Competitive Testing Report for Brio 650 and HEPA-style Air Purifiers

Executive Summary:
Brio 650 demonstrated the strongest overall performance among the tested air purifiers, combining high initial CADR, excellent dust-loading durability, and low operating noise. While several competitors excelled in individual categories, no other unit matched Brio 650’s balanced performance across all three metrics
Overview
This report compares the performance of the Brio 650 with six HEPA-style air purifiers using three standardized metrics:
1 Clean Air Delivery Rate (CADR)
Using a new filter on maximum speed, this test measures Clean Air Delivery Rate (CADR) in cubic feet per minute (CFM) CADR represents the volume of 100% clean air a unit delivers Higher CADR values indicate that a purifier can clean larger spaces or clean a given space faster
2. Cumulative Clean Mass (CCM)
CCM (Cumulative Clean Mass), also known as dust load, measures how much particulate matter a filter can collect before the unit’s CADR drops to 50% of its original value. It is reported in grams (g). CCM can be interpreted as the amount of dust a unit collects before the filter needs to be replaced due to clogging Higher CCM values indicate longer filter life and more stable real-world performance as the filter loads with dust
3. Noise testing, also known as Sound Power Level (SPL)
Conducted on maximum speed, this test measures two noise metrics: overall A-weighted sound level and noise level versus frequency. The overall sound level indicates how objectively loud a unit is, while the frequency profile indicates how subjectively intrusive the sound may be. Together, these metrics describe how disruptive a unit is during high-speed operation ,
Section 1: Test Procedures
CADR Testing
The North American standard for measuring CADR is ANSI/AHAM AC-1. The dust portion of this standard was replicated as closely as possible using the available test equipment Room size, recirculation equipment, and most procedural elements matched the standard. Minor deviations include the use of a MetOne BT-610 particle counter instead of the APS 3321 specified by the standard, as well as slight differences in dust-dispersion equipment
The general CADR procedure is as follows:
1. Place the air purifier on the ground at the center of a sealed test chamber with a volume of 30 m³ Maintain ambient temperature of 22–26 °C and 45–60 % relative humidity Clean the air in the chamber using HVAC filters to a prescribed, very low target particle concentration.
2. Introduce a controlled mass of ISO 12103-1 A2 Fine Test Dust into the chamber through a compressed-air dispersion system, achieving a target initial dust concentration range
3 Operate a ceiling recirculating fan for two minutes to achieve uniform particle dispersion throughout the chamber.
4 Turn on the air purifier to maximum fan speed Measure particle concentration every minute over a 20-minute period.
5. Repeat steps 1-4 with no purifier operating (this will be used to calculate the “natural decay rate”)
6. Calculate CADR values according to AHAM/ANSI AC-1, subtracting the natural decay rate from the rate with the purifier operating.
A photo of the CADR testing room can be seen in Figure 1 below
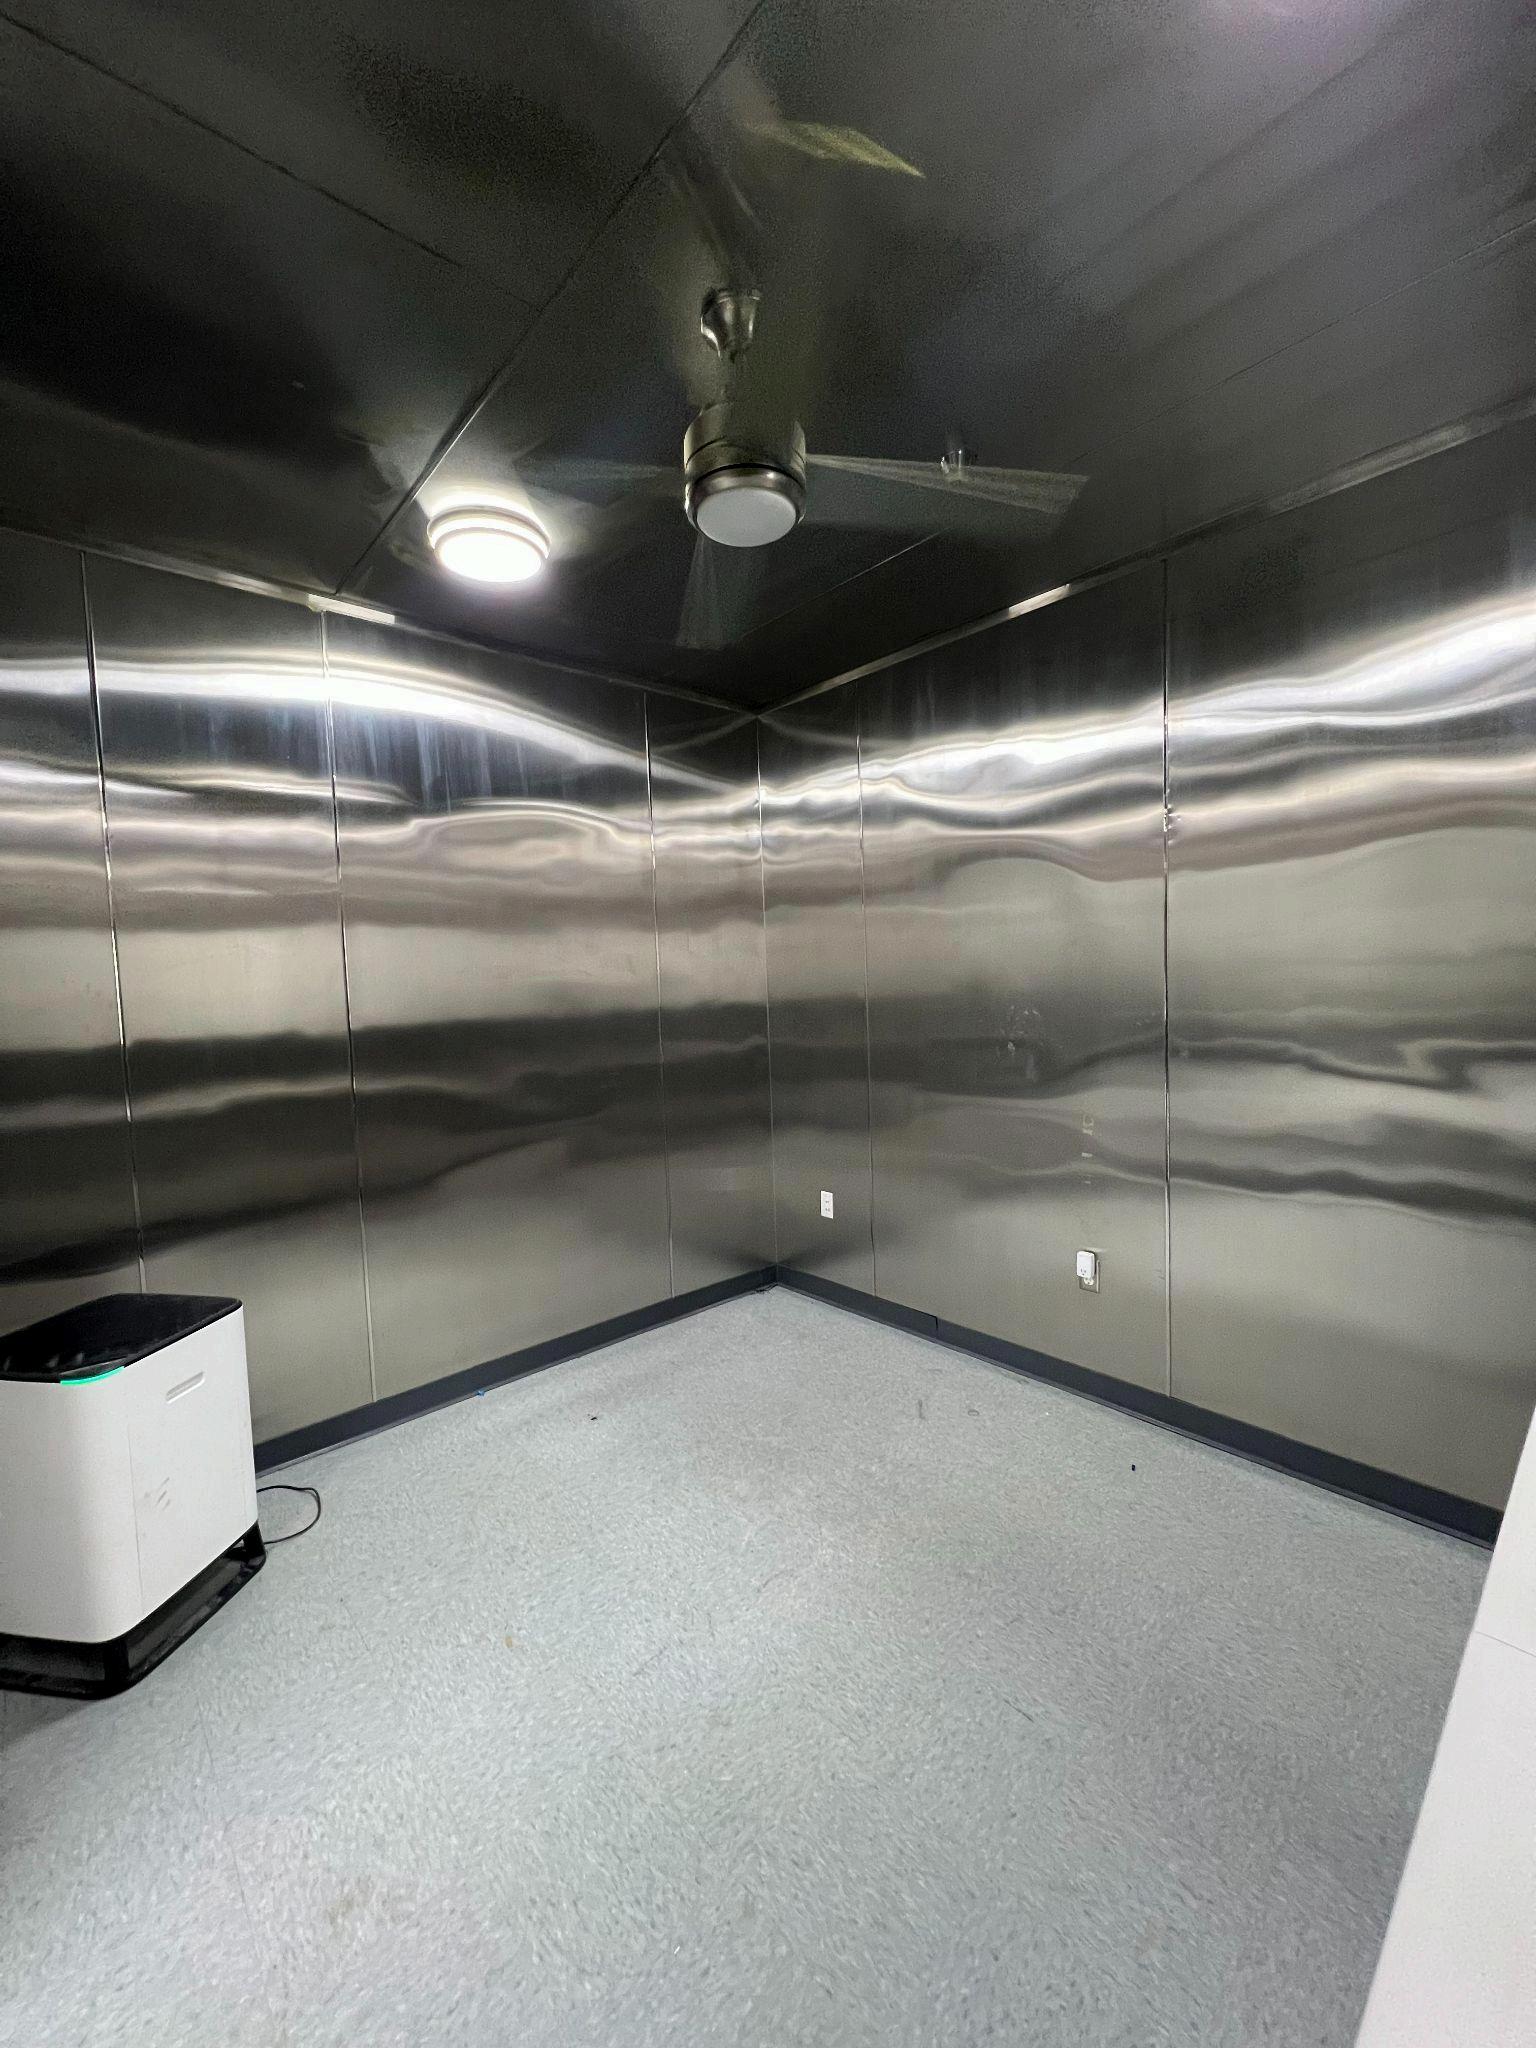
The CCM portion of this report approximates the Chinese standard GB/T-18801, the original CCM standard. For the testing presented in this report, loading room size, equipment, and other procedural
Figure 1
CCM Testing
details are identical to the standard However, there are some differences The primary difference is that the GB/T-18801 standard uses cigarette smoke as the loading pollutant, whereas dust is used in this testing. As such, pollution introduction equipment also varies.
The general CCM procedure is as follows:
1 Remove the filter from the unit and weigh using a precision lab scale Reinsert into unit
2 Perform a CADR test as detailed in the CADR section of this report
3. Place the unit in a 3m³ dust loading chamber, and introduce a controlled amount of ISO 12103-1 A2 Fine Test Dust into the chamber while operating the unit on maximum speed.
4 Operate the unit until no dust is left in the air
5. Repeat steps 1-4 until the unit CADR reaches 50% of its original value, or until no more dust can be loaded without dislodging dust during handling.
6 The reported CCM is the total amount of dust accumulated on the filter, in grams
A photo of the CCM dust loading chamber can be seen in Figure 2 below.
Noise Testing
The noise testing portion of this report approximates the IEC 60704-1 standard, with additional noise vs. frequency reporting Some minor differences in exact test equipment exist, such as specific sound insulation and microphones used, but generally the procedures and calculations are the same.
The general noise testing procedure is as follows:
1. Place the unit in the center of the noise testing chamber.
2 Position 3 microphones 1m from the unit at different locations (2 sides, and one above)
3 Operate unit on maximum speed for 30s
4. Record noise data for 30s.
5. Calculate A-weighted sound power level and report unweighted noise level vs. frequency.
A photo of the noise testing chamber can be seen in Figure 3 below.
Section 2: Results
CADR Testing
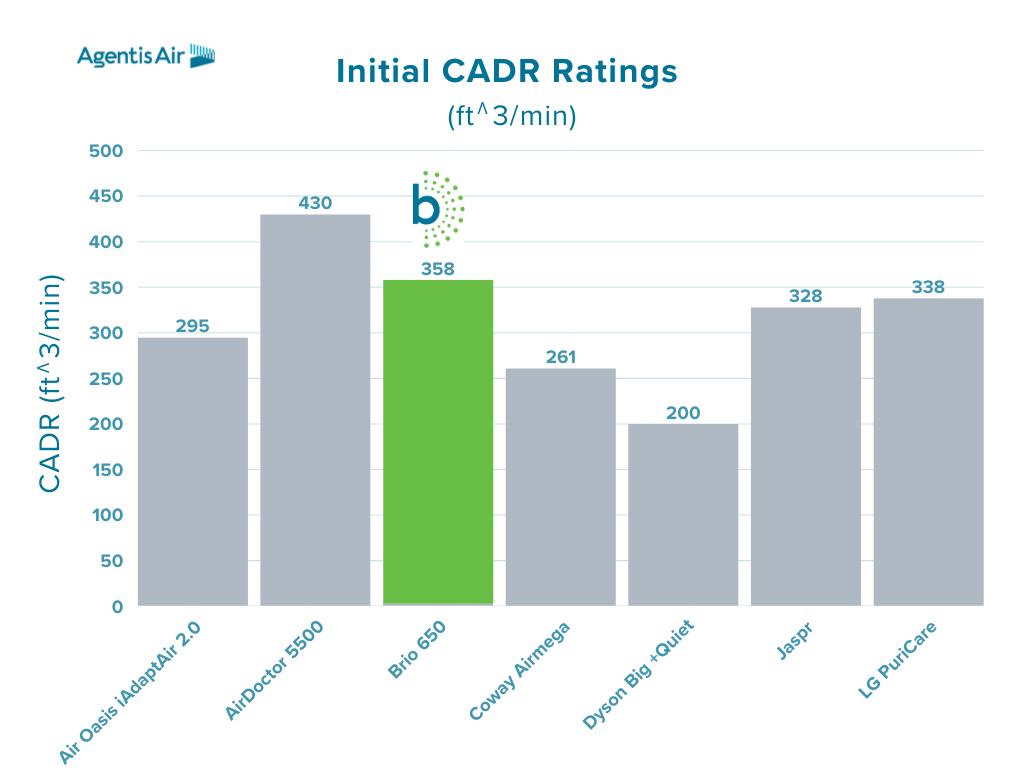
Results of the clean filter CADR testing can be seen in Figure 4 below. All units show different starting CADR values. Units with higher CADR values will be capable of cleaning larger spaces, or cleaning spaces faster The Air Doctor 5500 shows the highest initial CADR at 430 CFM, followed by the Brio 650 at
358CFM The Dyson Big+Quiet has the lowest initial CADR at around 200 CFM All other models fall between these two points.
CCM Testing
Results of CCM testing can be seen in Figure 5 below The y-axis shows the CADR as a % of the original CADR, with all units starting at 100%. The x-axis shows dust load in grams. Units with gradual, slow decreases in CADR, along with high final dust loads, should be interpreted as having long filter lifespans and CADRs that do not decrease significantly over the life of the filter Sharp decreases in CADR, with low final dust loads, should be interpreted as having short filter lifespans and CADRs that decrease quickly over the life of the filter. The Brio 650 has the best overall performance, with a very small decrease in CADR and a high final dust load. The Dyson Big+Quiet also has notably good performance. The LG Puricare, Coway Airmega, Air Oasis iAdaptAir 2 0, and Jaspr r all have similarly poor performance, with sharp drops in CADR and low final dust loads.
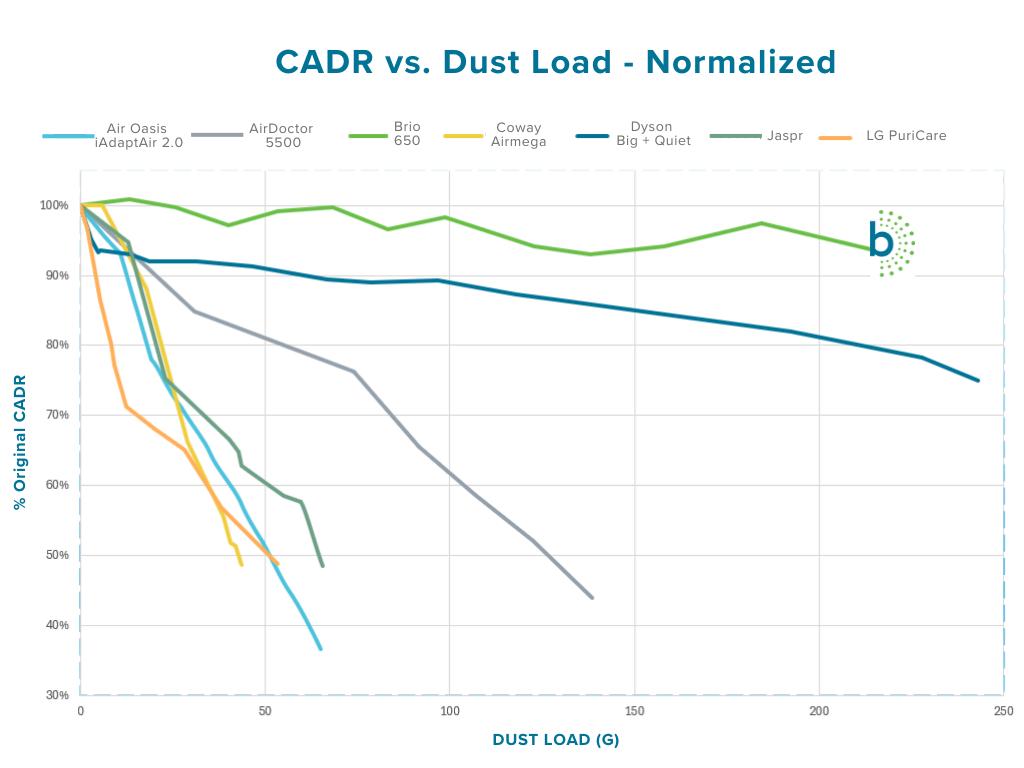
Note: Brio 650 and Dyson Big+Quiet tests were stopped due to inability to effectively load more dust onto the filters without shaking dust loose while weighing the filters Thus, their data does not extend to 50% of the original CADR values.
Noise Testing
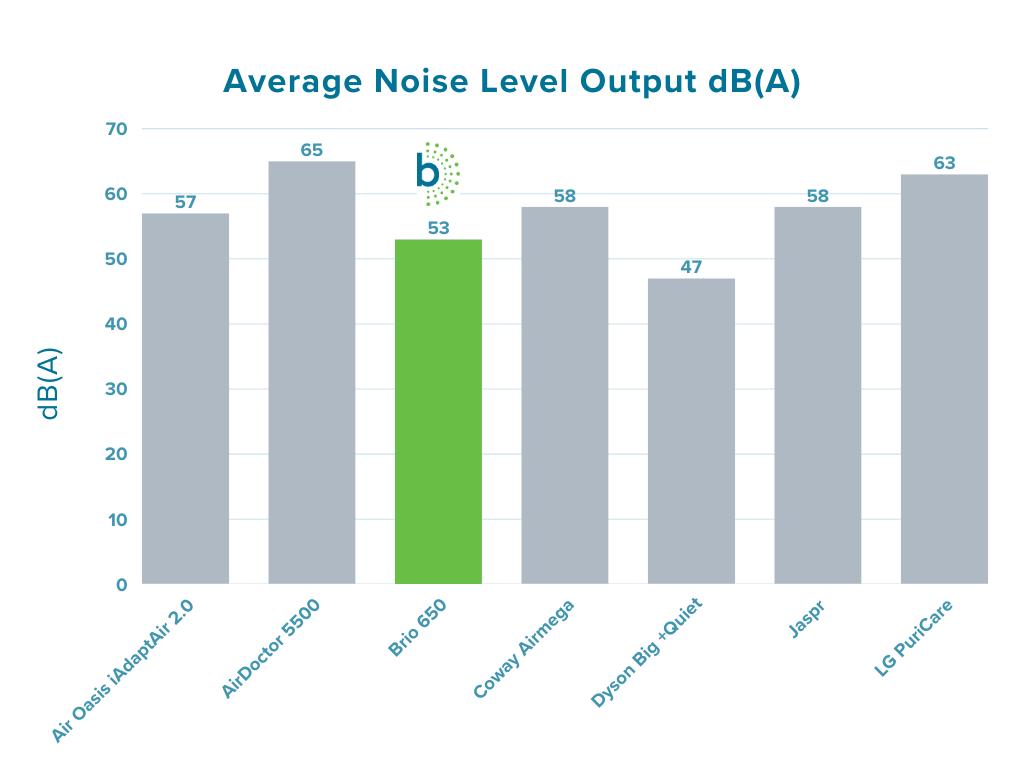
Results of overall noise level testing can be seen in Figure 6 below Units with lower dB(A) levels are generally quieter. The Dyson Big+Quiet has the lowest noise at 47db(A), followed by the Brio 650 at 53dB(A). The loudest units are the LG Puricare and Air Doctor 5500, at 63dB(A) and 65dB(A), respectively
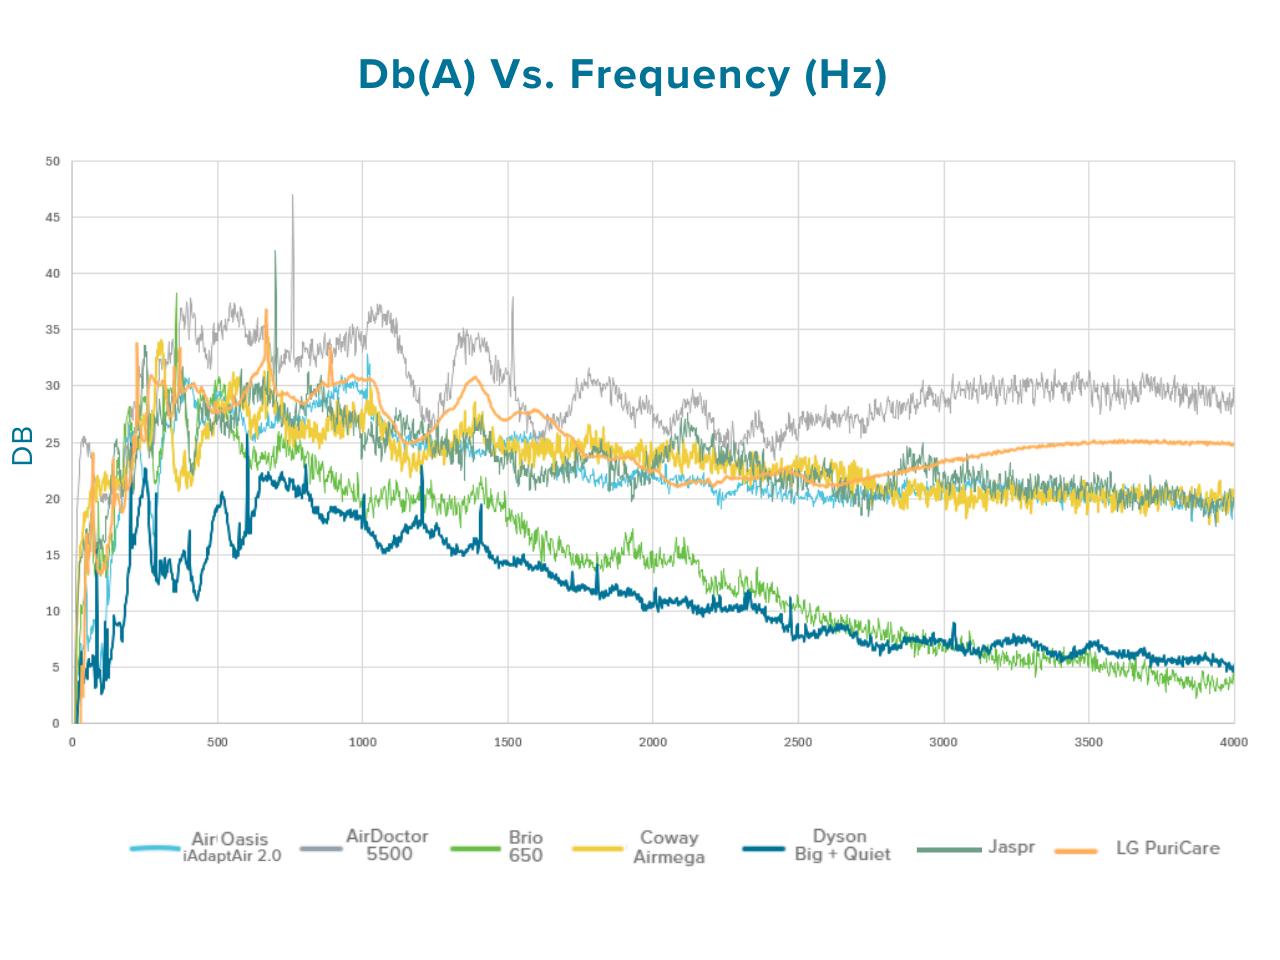
Noise level vs frequency results can be seen in Figure 7 below Units with generally lower levels across all frequencies will be quieter overall, and this is captured by the overall noise level results above. More important are the sharp peaks seen in the data of Figure 7. Units that have sharp peaks should be interpreted as having more “pure tones,” such as humming or buzzing Units without sharp peaks should be interpreted as having more of a “white noise” type noise profile. Pure tone noises are subjectively experienced by users as more annoying, whereas white noise is less intrusive and more pleasant to the human ear Of particular note are the Air Doctor 5500, LG Puricare, and Dyson Big+Quiet units, which all have significant peaks. Other units shown have very little peaks in their data.
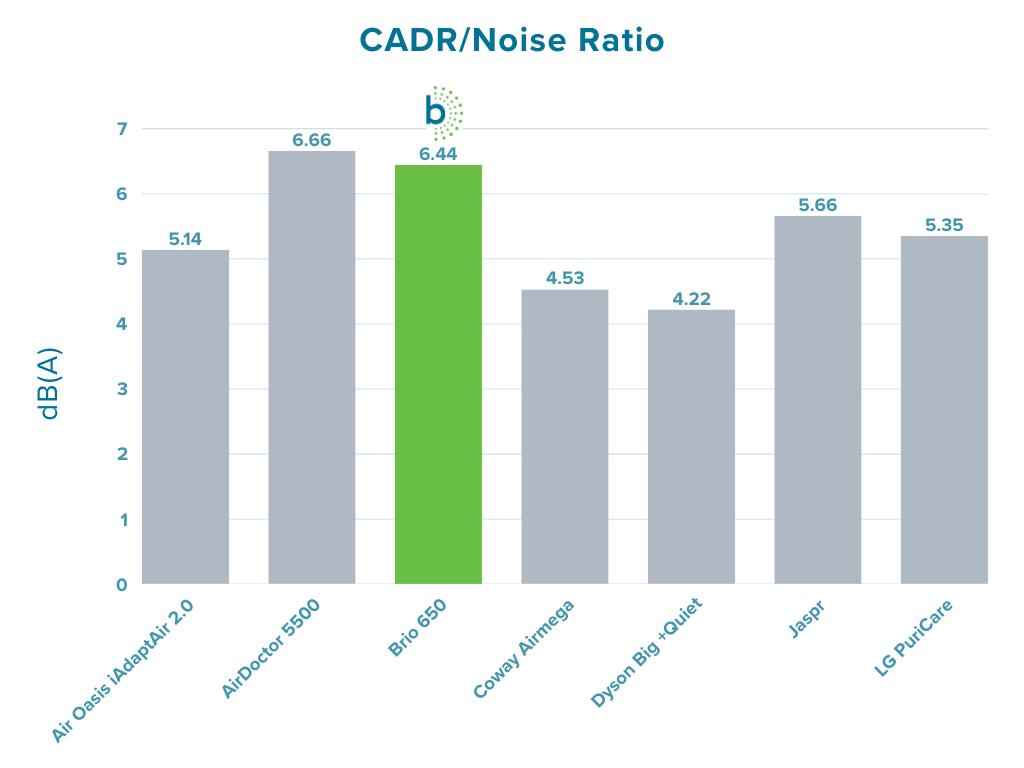
It is also potentially helpful to know the balance of cleaning power and overall noise. Calculating the CADR per noise level ratio (CFM/dB(A) is a simple way to visualize this balance Units with high CADR per noise level ratios should be selected.
Section 3: Discussion
Selecting an air purifier depends on balancing immediate cleaning power, long-term filtration performance, and quiet operation. The three tests in this report ( CADR, CCM, and Noise) are intended to help consumers navigate a crowded and often confusing market
To simplify comparison, each product was ranked from 1 to 7 in each category, with 1 representing the best performance and 7 representing the weakest. When the top three performers from each category are combined into a single table, the strongest overall products become clear
As shown above, the Brio 650 is the only unit that ranks in the top tier across all three categories, making it the most balanced performer The AirDoctor 5500 earns strong positions in CADR and CCM but is limited by higher noise levels The Dyson Big+Quiet performs very well in CCM and noise, but its lower CADR limits its overall standing. This ranking approach highlights that no single metric tells the full story, consistent real-world performance requires strength across all three. Based on the testing performed in this report, Brio 650 strikes the best balance of cleaning power, filter life, and low noise