
Instructor’s Manual
INSTRUCTOR’S MANUAL to accompany Microeconomics for Life:
Smart Choices for You
Second Edition
Prepared by Avi J. Cohen
York University University of Toronto

Toronto
Copyright © 2016 Pearson Canada Inc., Toronto, Ontario. All rights reserved. This work is protected by Canadian copyright laws and is provided solely for the use of instructors in teaching their courses and assessing student learning. Dissemination or sale of any part of this work (including on the Internet) will destroy the integrity of the work and is not permitted. The copyright holder grants permission to instructors who have adopted Microeconomics for Life: Smart Choices for You, Second Edition, by Avi J. Cohen, to post this material online only if the use of the website is restricted by access codes to students in the instructor’s class that is using the textbook and provided the reproduced material bears this copyright notice.
Overview
I wrote the Economics for Life textbooks to get more students interested in economics as a way of thinking that will help them make smarter choices in life and become economically literate citizens. If you are reading this, you probably share at least part of that goal.
I have taught Introductory Economics for over 30 years, in classrooms ranging from 30 to 500 students. I love my job, especially when I see that students are engaged, the moment when their eyes widen and the light bulb goes on because they “get it.” To help them get it, I use motivational techniques, group work, technologies including big sidewalk chalk (so students at the back of classrooms can see what I am writing), video clips to stimulate discussion, online quizzing to help students keep up, clickers, one-minute papers, digital lecture capture …. The list is long at my age!
The Instructor’s Manual (IM) will make it easier for you to prepare and teach introductory economics classes, whether you are new at the job or an experienced instructor looking for ways to enliven your classroom or adapt to the growing world of fully or partially online courses.
This IM is meant to be read on screen, so you can click web links and instantly access the resources. As well, the textbook site, economicsforlife.ca will be updated regularly with media stories, commentary and teaching strategies. Adopters of the textbook also have access to my library of old tests and exams. The IM is part of the rich package of resources for the Economics for Life textbooks, and is meant to be used in conjunction with those resources. Here is what you will find in the IM for every chapter of the textbook, followed by descriptions of the full set of Pearson resources.
Chapter Organization
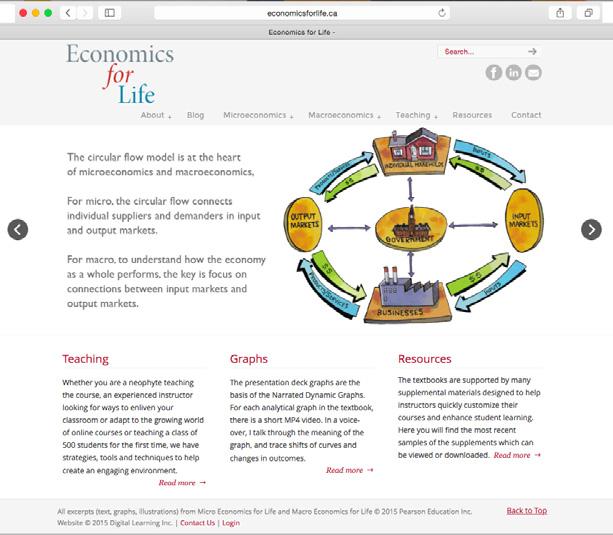
www.economicsforlife.ca
There is an IM chapter for each textbook chapter. All chapters share a standardized format. Chapter-wide resources are presented first, followed by resources for each section.
Learning Objectives
There is one learning objective for each section in the chapter.
Lecture Narrative
Rather than just list the main points in the chapter, it is helpful to hear the story that ties all of those points together. This will help you develop your own presentations in a more flowing and engaging way. I developed the lecture narrative together with the PowerPoint lecture deck (see PowerPoint details on Page 2).
Graphs, Tables and Illustrations
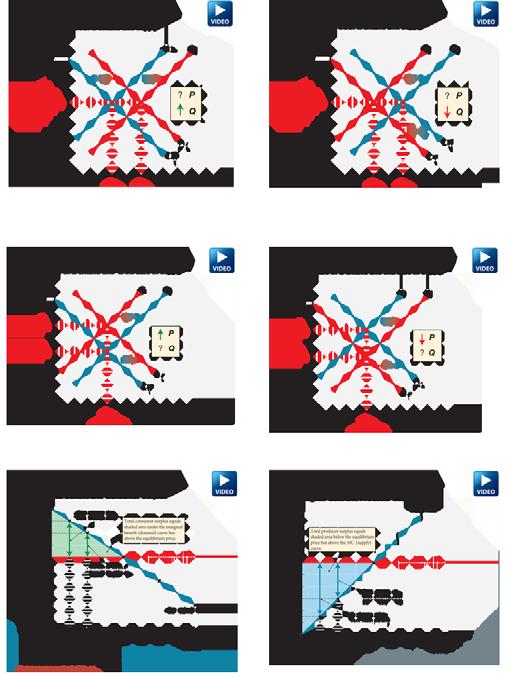
A table lists all figures in the chapter (tables, graphs, illustrations) with page numbers. For titles in blue, Narrated Dynamic Graph videos are available online in MyEconLab on each Chapter Resources page.
Active Learning Suggestions – Top Choice

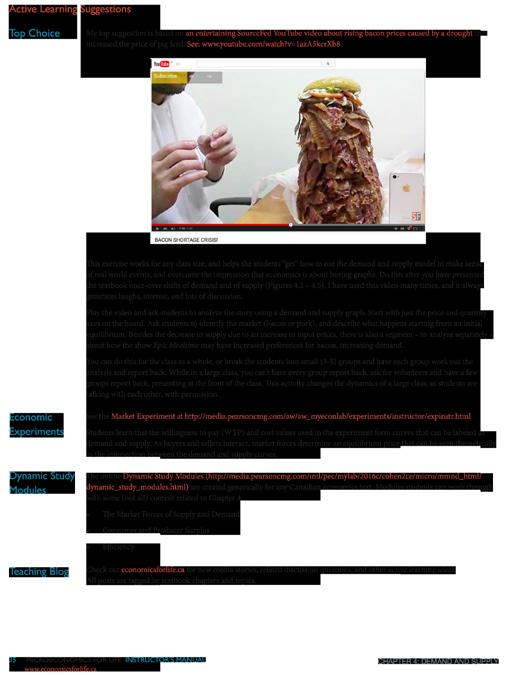
While economicsforlife.ca will have many suggestions and links for active learning, it takes time to search and evaluate options. So I thought it would be useful to pick one “Top Choice” for each chapter. These are activities (for example, auctions and group assignments) and resources (for example, media stories and YouTube videos) that I have used successfully in the classroom.
Economics Experiments
Experiments are a fun and engaging way to promote active learning and mastery of important concepts. MyEconLab has microeconomics experiments including single-player experiments that allow students to play against virtual players anywhere, and multiplayer experiments that can be done online or in class. Experiments available for this chapter are linked. See the sample on Page 3.
Dynamic Study Modules
Within MyEconLab, Dynamic Study Modules assess students’ knowledge more granularly than with simple right or wrong questions. As students work through questions, the software assesses their knowledge and only shows questions that still require practice. Modules can be completed online using a computer, tablet, or mobile device. There is a list of relevant modules for each chapter. See the sample on Page 3.
Resources for Each Section of Each Chapter
For each section of a chapter, the IM has:
• Learning Objective
• Main Point – one sentence capturing the most important idea in the section. This main point also appears for students in red italics in the Study Guide Chapter Summary.
• Key Terms – all key terms and definitions that appear in the margins (and included in the Glossary and student digital flash cards) are listed.
• Discussion or Homework Questions and Answers – there are two questions (and answers) that can be used for classroom discussion or assigned as homework.
• Refresh Questions and Answers – the Refresh Questions appearning in the textbook as the end of each section are repeated, together with the answers that are available to students on MyEconLab.
Additional Resources
PowerPoint Slides
The PowerPoint® slides are a set of lectures based on the textbook content, paralleling the Chapter Summary found in the end-of-chapter Study Guide material. I developed the content in the slides to enable you to prepare and present a focused, manageable lecture without having to wade through an excessive number of slides. The parallels between the slides and the Study Guide’s Chapter Summary make it easier for students to connect the textbook material, your classroom presentation, and the Study Guide exercises. The design of the slides matches the textbook design so students connect more easily the material they have read and the content of your classroom presentation. The font sizes of the slides have been tested for readability from the back of a 500-seat lecture hall as well as on mobile devices.
There are two PowerPoint decks for each chapter.
1. The primary Lecture deck is a curated set of slides. Most analytical graphs have transitions that appear (like shifting curves) as you click through.
2. The secondary deck contains alternative versions of graphs in the lecture deck but paired with tables of numbers, and figures in the textbook that contain multiple graphs. Also included are all textbook Refresh Questions, which you can project to show how to work through the problem or to stimulate a discussion about the answer. Refresh answers are found in the PowerPoint Notes view, as well as in this IM.
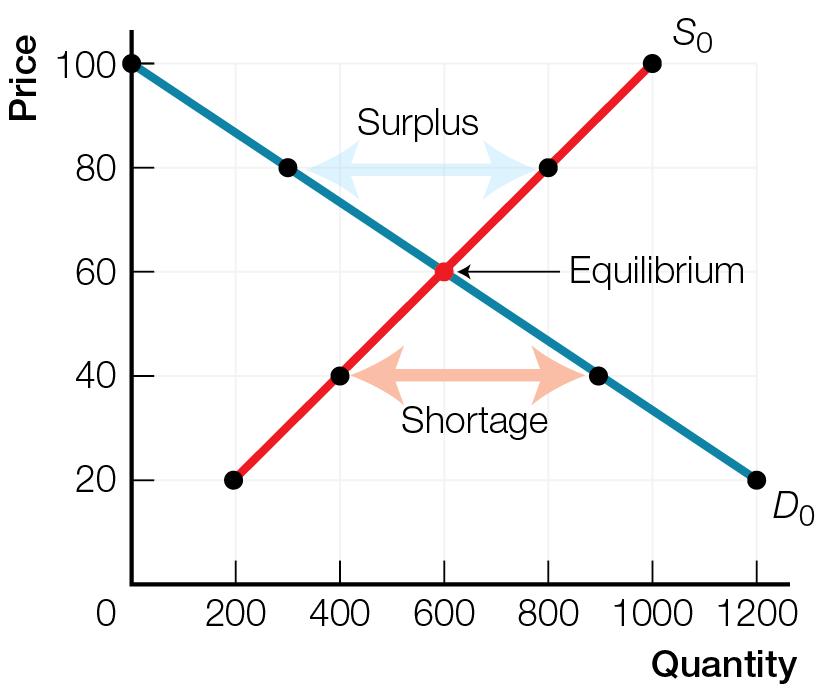
Narrated Dynamic Graphs
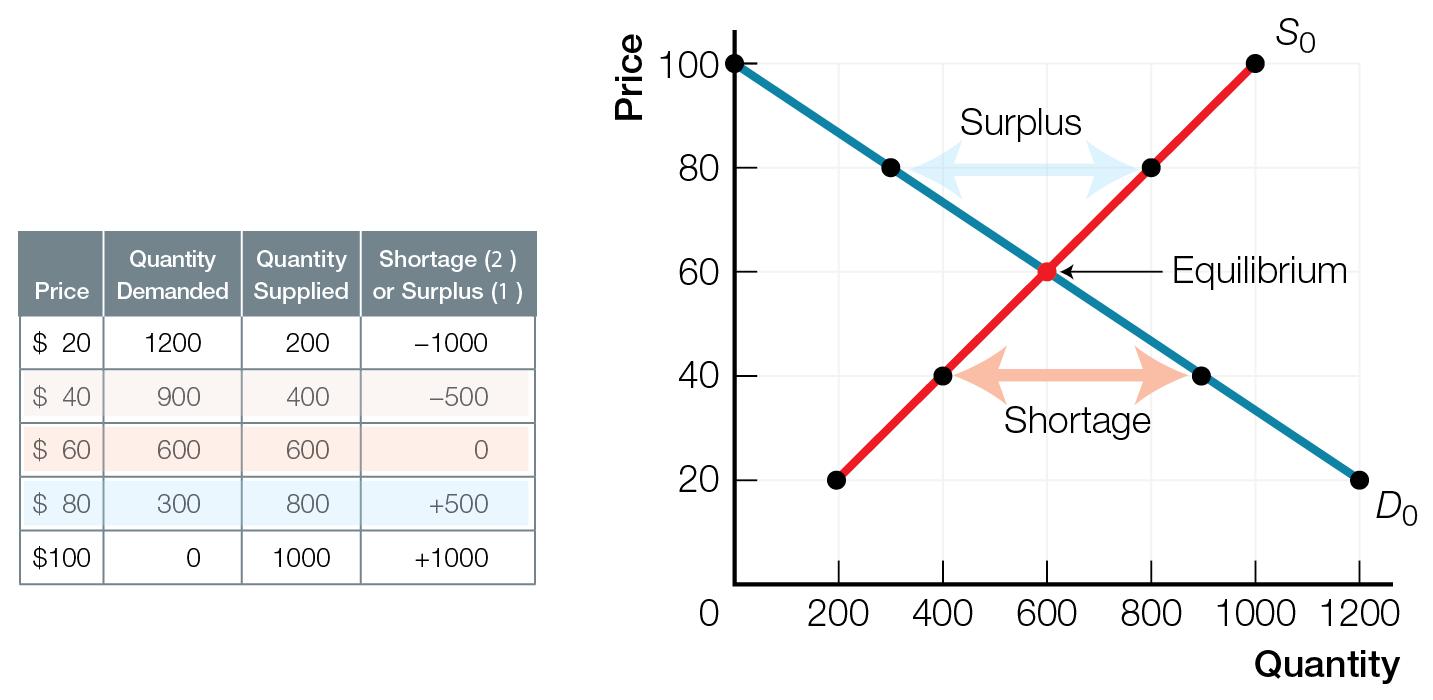
The PowerPoint graphs, built from the textbook graphic files, are the basis of the Narrated Dynamic Graphs. For key analytical graphs in the textbook, there is a short MP4 video. In a voice-over, I talk the student through the meaning of the graph, and traces shifts of curves and changes in outcomes. There is a moving cursor directing students’ attention to the portion of the graph being discussed in the narration. These MP4 files, which tell the story of each graph, can be streamed to a student’s computer or mobile device.
Fig. 4.1 Secondary Lecture Deck
Fig. 4.1 Primary Lecture Deck
Narrated Dynamic Graphs
Pearson TestGen Testbanks
I created or edited all multiple choice and true/false questions in the micro and macro testbanks. Multiple choice questions have five good choices. “None of the above” and “All of the above” are actually used as correct answers, and sometimes the fifth choice is humorous. Questions are classified by chapter learning objectives, level of difficulty (1 – 3), and as recall or analytical.
Learning Catalytics
Learning Catalytics is a Wi-Fi “bring your own device” student engagement and assessment system that allows instructors and students to work together to generate classroom discussion, guide your lectures, and promote peer-to-peer learning and interaction with real-time analytics. Students bring their devices (phones, tablets, computers) to class, and then input the login code provided by the instructor. Instructors release questions (multiple choice, matching, many right choices, graph sketching, numerical), and students answer in real time. The results are aggregrated and help direct class discussion and/or assessment. They can also be saved for more analysis after class. Note: you must be logged in to Pearson MyLab to access Learning Catalytics.
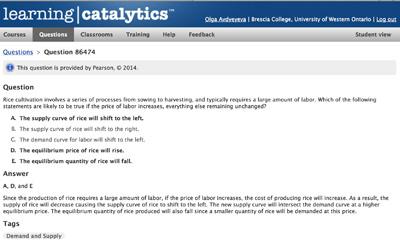
Learning Catalytics
Economicsforlife.ca
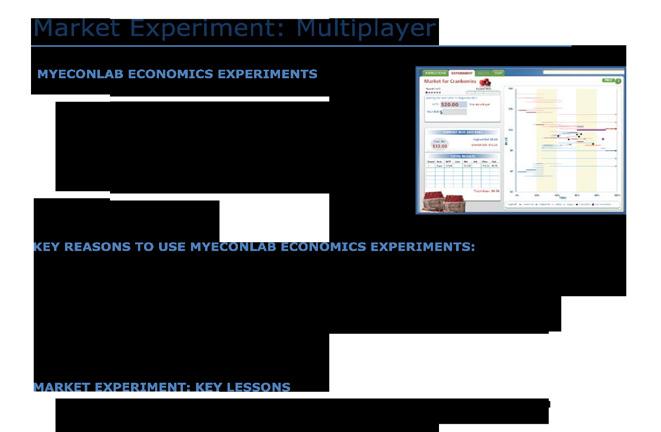
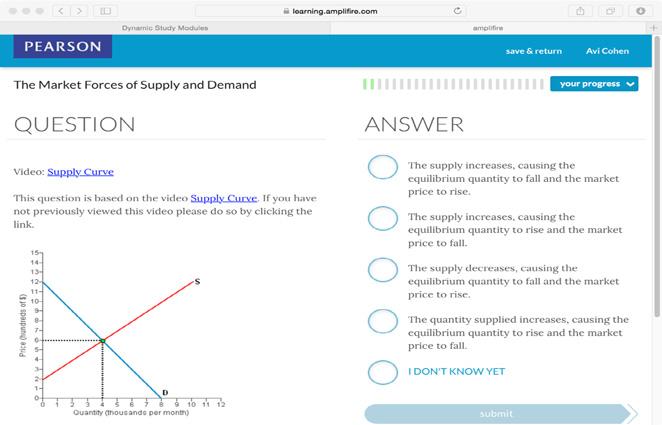
Economics Experiments Dynamic Study Modules
Economicsforlife.ca links to all textbook-related resources, advice on creating or teaching blended and online courses, links to web-resource elsewhere on the internet, and a teaching blog. I will continually update the website with new media stories, discussion questions, data, blog posts and links to other teaching resources. All resources are tagged by topics and chapters in the Economics for Life textbooks, and are searchable.
There also is a password-protected area with additional materials for adopters like old tests, exams, and answer guides.
Lets Go!
Pearson Canada has helped me develop a rich set of resources to make our jobs easier and to do them better. I hope the resources organized in this Instructor’s Manual help you succeed in teaching Economics and help your student learn, and retain, what you give to them.
If you have questions or suggestions, please contact me at avicohen@yorku.ca
1 What’s in Economics for You? Scarcity, Opportunity Cost, Trade, and Models
Learning Objectives
1. Explain scarcity and describe why you must make smart choices among your wants.
2. Define and describe opportunity cost.
3. Describe how comparative advantage, specialization, and trade make us all better off.
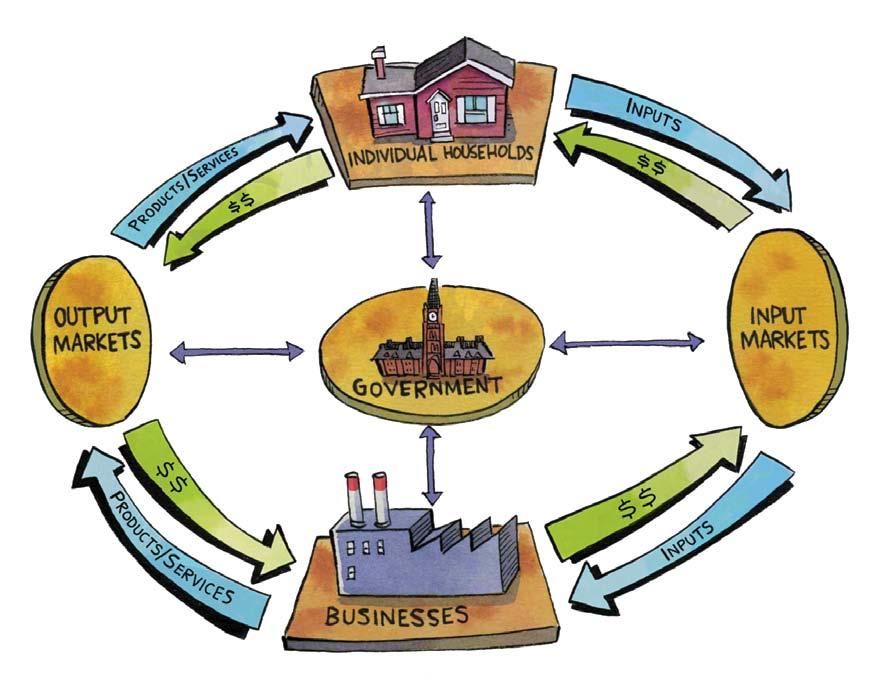
4. Explain how models like the circular flow of economic life make smart choices easier.
5. Differentiate microeconomic and macroeconomic choices, and explain the Three Keys model for smart choices.
Lecture Narrative
George Bernard Shaw’s quote, “Economy is the art of making the most out of life,” introduces economics and the problem of scarcity. I define economics in a way that focuses on the choices of key players – how individuals, businesses, and governments make the best possible choices to get what they want, and how those choices interact in markets. Because of scarcity, choices involve a trade-off, leading to the concept of opportunity cost – the single most important concept in all of economics. Incentives are also crucial for understanding choices. Opportunity cost and comparative advantage are key to understanding why specialization and voluntary trade make us all better off. The most basic choice is producing for yourself or specializing, trading in markets and depending on others. There is a simple example of two previously self-sufficient pioneers in the same country coming together to trade. This example of the gains from trade purposefully avoids the politically charged issue of trade between countries, focusing instead on the general benefits of markets and exchange.
I then introduce models (using a road map example) and what it means to think like an economist. The circular flow model reduces the complexity of the economy to three sets of players who interact in markets – households, businesses, and governments. Without using the phrase ceteris paribus, I compare the assumptions of “all other things unchanged” to the mental equivalent of controlled experiments in a laboratory. The positive/normative distinction is also part of thinking like an economist. Finally, I distinguish microeconomics from macroeconomics and introduce the 3 Keys to Smart Choices as the microeconomic “model” that focuses attention on the information most useful for making smart choices:
1. Choose only when additional benefits are greater than additional opportunity costs
2. Count only additional benefits and additional costs.
3. Be sure to count all additional benefits and costs, including implicit costs and externalities.
If you watch “The Five Minute University” (https://www.youtube.com/watch?v=kO8x8eoU3L4) mentioned in the Instructor’s Preface to the textbooks, the 3 Keys model is what I want my students to remember 5 years (at least!) after they have taken introductory economics. This is students’ first look at the 3 Keys, which recur throughout the book.
Graphs, Tables and Illustrations
Figure Title G, I, T Page
1.1 Jill’s Production Possibilities T, G 8
1.2 Marie’s Production Possibilities T, G 8
1.3 Opportunity Costs for Jill and Marie T 10
1.4 Mutually Beneficial Gains from Trade a) Jill’s Gains from Trade b) Marie’s Gains from Trade G G 11
1.5 Circular Flow of Economic Life I 14
1.6 Three Keys to Smart Choices I 19
Graphs and illustrations follow on the next page.
Key:
G - Graph(s) For titles in blue, Narrated Dynamic Graph videos are available online on each Chapter Resources page.
I - Illustration
T - Table
Narrated Dynamic Graphs are identified with a blue video button. To access them, log into the Pearson course website (pearsonmylab.com), click on Chapter Resources, and then Chapter 1.

Marie specializes in producing only bread, moving from point C to point A on her PPF. She then trades 20 loaves of bread to Jill for 20 logs of wood, moving from point A to point A' along the trade
Marie specializes in producing only bread, moving from point C to point A on her PPF. She then trades 20 loaves of bread to Jill for 20 logs of wood, moving from point A to point A' along the trade line. Marie can now consume 20 logs of wood and 20 loaves of bread, a combination that was impossible before

1.4a Jill’s Gains from Trades 1.4b Marie’s Gains from Trades
1.5 Circular Flow of Economic Life
1.6 Three Keys to Smart Choices
Active Learning Suggestions
Top Choice
First class meetings are often short and focus on administrative course details. I try to also use the time for a small group activity to help students get to know each other.
For microeconomics, I use the policy debate over whether government should impose a tax on sugary pop to counter obesity. There has been much press on the topic recently. In the U.S., former New York City mayor Michael Bloomberg proposed making giant size soft-drink cups illegal. In Canada, the Heart and Stroke Foundation called for a tax on sugary drinks (http://www.ctvnews.ca/health/heart-and-stroke-foundation-calls-for-tax-on-sugary-drinks-1.1999780). Mike Moffat has an excellent article in the September 2012 Walrus, “Pop and the Tax Question” (http://thewalrus.ca/pop-and-the-tax-q/). Here are the PowerPoint slides I used for the activity, focusing on these policy questions:
You are the Minister of Health and your government is considering a tax on sugary pop.
1. What are the consequences of this policy – all intended and unintended consequences?
(How will people change their choices after the sugar tax?)
2. Should the government tax sugary pop?
(What are the arguments for and against this policy?)
For macroeconomics, the small group exercise focuses on this policy question:
Canada is in a deep recession, with high unemployment, manufacturing plants closing because of cheap imports from Asia. The government deficit is growing, inflation is 3%.
You are the Minister of Finance, in power in government. Come up with 3 policies that would help Canadians and improve the economy.
I find this exercise bring out students’ misconception about economics (most will suggest high tariffs on imports without understanding the consequences), and gives you an idea of where they are coming from, knowledge-wise.
For either group activity, if you have time it adds interest if the class votes on the best group presentation, and you award candy prizes. Of course you do not want to criticize wrong information, but rather to note it and explain how what they will learn will likely change their thinking about these issues.
Dynamic Study Modules
The online Dynamic Study Modules are created generically for any Canadian economics text. The modules students can work through with some content related to Chapter 1:
• Basic Principles of Economics
• Interdependence and Gains from Trade
Teaching Blog Check out economicsforlife.ca for new media stories, related discussion questions, and other active learning ideas. All posts are tagged by textbook chapters and topics.
1.1 Are You Getting Enough? Scarcity and Choice
Learning Objective
Explain scarcity and describe why you must make smart choices among your wants.
Main Point
Key Terms
Because you can never satisfy all of your wants, making the most out of your life requires smart choices about what to go after, and what to give up.
Scarcity the problem that arises because we all have limited money, time, and energy
Economics how individuals, businesses, and governments make the best possible choices to get what they want, and how those choices interact in markets
Discussion or Homework Q&A
1. Q. Olga chooses to live at home rather than move into residence during her first year of college. She often brags about the fact that she saves a lot of money by living at home. Provide some examples of what Olga may have given up by choosing to live at home.
A. • freedom
• some privacy
• parties at the residence
• readily available study partners
2. Q. “If all people would only make smart choices and economize, the problem of scarcity would be solved.” Agree or disagree, and explain why.
A. Disagree. If everyone makes smart choices and economizes, then we would be making the best possible use of our resources and would get the greatest benefits or satisfaction possible, given the limited quantity of resources. But this does not mean that we would be satisfying all of our limitless needs. The problem of scarcity can never be “solved” as long as people have infinite needs and finite resources for satisfying those needs.
Q&A
1.1.1
Q. Define scarcity and give an example from your own experience.
A. Scarcity is the problem that arises because we all have limited money, time, and energy. We can’t have and/or do everything we may want to. While examples will differ, they should all highlight the difference between what we want and what we can actually have due to a limitation of our money, time, and energy.
1.1.2
Q. Write a definition of economics in your own words that includes the word scarcity.
A. Answers will differ but should include some or all of the following:
• Because of scarcity, you can never satisfy all of your wants.
• Making the most out of your life requires smart choices about what to go after and what to give up.
• Smart choices are at the heart of the definition of economics — how individuals, businesses, and governments make the best possible choices to get what they want, and how those choices interact in markets.
1.1.3
Q. Social activists argue that materialism is one of the biggest problems with society: If we all wanted less, instead of always wanting more, there would be plenty to go around for everyone. Do you agree with this statement? Why or why not?
A. The claim that if we all wanted less, there would be plenty to go around for everyone is both true and false. If each individual had less, it is true that there could be more to go around for more people. But that does not eliminate the problem of scarcity. The difficulty is with the word “plenty.” Even with reduced wants, we each cannot get everything we desire and would have to make choices about what to go after and what to give up.
1.2 Give It Up for Opportunity Cost! Opportunity Cost
Learning Objective
Define and describe opportunity cost.
Main Point
Key Terms
Opportunity cost is the single most important concept both in economics and for making smart choices in life.
Opportunity cost the cost of the best alternative given up
Incentives
rewards and penalties for choices
Discussion or Homework Q&A
1. Q. You’re trying to decide whether to go camping with your friends or spend a quiet weekend at home with your significant other. What incentives (think rewards and penalties), if changed, may influence your decision?
A.
• weather
• cost of trip (gas)
• if your partner tells you the relationship is over if you go
• if your partner offers to cook for you or take you out to dinner if you stay
2. Q. Seat belts save lives. Suppose that a city doubles the penalty for being caught driving without a seat belt in attempt to increase seat belt use among drivers.
a. Explain how this policy will influence driver behaviour.
b. Now suppose the city evaluates the policy and finds that the number of fatalities actually increased after the policy was introduced. Can you think of a reason why this may have occurred?
A. a. The increased penalty represents a rise in the price (or cost) of not wearing a seat belt, which will likely motivate more individuals to wear their seat belt.
b. Drivers adjust their behaviour and drive more dangerously because they think they are now safe wearing a seat belt.all
1.2.1
Q. What is the opportunity cost of any choice?
A. The opportunity cost of any choice is the cost of the best alternative given up. It is what you have to give up to get your choice.
1.2.2
1.2.3
Q. This weekend, your top choices are going camping with your friends or working extra hours at your part-time job. List three facts (think rewards and penalties) that, if they changed, would influence your decision.
A. In deciding between camping with friends or working extra hours at your job, the rewards and penalties that could influence your choice might include (you have probably thought of others too): the weather forecast (rain or sunshine), who is paying for the camping expenses, whether you will be paid your regular wage or overtime for working extra hours, and whether you will get on your boss’s good side by working more.
Q. Your sister is trying to decide whether to go to college or get a job after high school. What would you advise her to do based only on the money cost of attending college? based on the opportunity cost of her attending college?
A. The biggest difference between the money cost of attending college and the opportunity cost is the income that you give up from not working, or from not working as many hours. This forgone income is not part of the costs you pay directly — like the costs of tuition and books — for college. See Economics Out There on p. 6.
1.3 Why Don’t You Cook Breakfast? Gains from Trade
Learning Objective
Describe how comparative advantage, specialization and trade make us all better off.
Main Point
Key Terms
Opportunity cost and comparative advantage are key to understanding why specializing and trading make us all better off.
Production possibilities frontier (PPF) the maximum combinations of products or services that can be produced with existing inputs
Absolute advantage the ability to produce a product or service at a lower absolute cost than another producer
Comparative advantage the ability to produce a product or service at a lower opportunity cost than another producer
Discussion or Homework Q&A
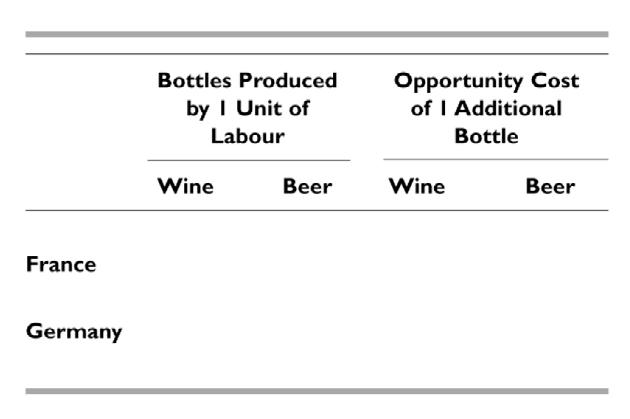
1. Q. France and Germany each produce both wine and beer, using a single, input—labour. Their production possibilities are: France has 100 units of labour and can produce a maximum of 200 bottles of wine or 400 bottles of beer. Germany has 50 units of labour and can produce a maximum of 250 bottles of wine or 200 bottles of beer.
a. Complete this table.
Use the information in part a to answer these questions.
b. Which country has an absolute advantage in wine production?
c. Which country has an absolute advantage in beer production?
d. Which country has a comparative advantage in wine production?
e. Which country has a comparative advantage in beer production?
f. If trade is allowed, describe what specialization, if any, will occur.
A. a. The completed table is shown here.
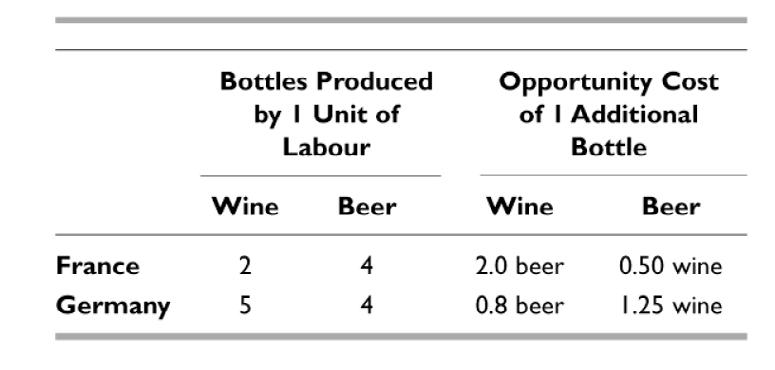
b. Germany, which can produce more wine (5 bottles) per unit of input, has an absolute advantage in wine production.
c. Neither country has an absolute advantage in beer production, since beer output (4 bottles) per unit of input is the same for both countries.
d. Germany, with the lower opportunity cost (0.8 beer), has a comparative advantage in wine production.
e. France, with the lower opportunity cost (0.5 wine), has a comparative advantage in beer production.
f. The incentive for trade depends only on differences in comparative advantage. Germany will specialize in wine production and France will specialize in beer production.
More questions follow on the next page.
2 Q. Tova and Ron are the only two remaining inhabitants of the planet Melmac. They spend their 30-hour days producing widgets and woggles, the only two goods needed for happiness on Melmac. It takes Tova 1 hour to produce a widget and 2 hours to produce a woggle, while Ron takes 3 hours to produce a widget and 3 hours to produce a woggle.
a. For a 30-hour day, draw an individual PPF for Tova, then for Ron.
b. Assume initially that Tova and Ron are each self-sufficient. Define self-sufficiency. Explain what the individual consumption possibilities are for Tova, then for Ron.
c. Who has an absolute advantage in the production of widgets? of woggles?
d. Who has a comparative advantage in the production of widgets? of woggles?
e. Suppose Tova and Ron each specialize in producing only the good in which she or he has a comparative advantage (one spends 30 hours producing widgets, the other spends 30 hours producing woggles). What will be the total production of widgets and woggles?
f. Suppose Tova and Ron exchange 7 widgets for 5 woggles. On your PPF diagrams, plot the new point of Tova’s consumption, then of Ron’s consumption. Explain how these points illustrate the gains from trade.
A. a. The individual PPFs for Tova and Ron are given by figures (a) and (b), respectively.
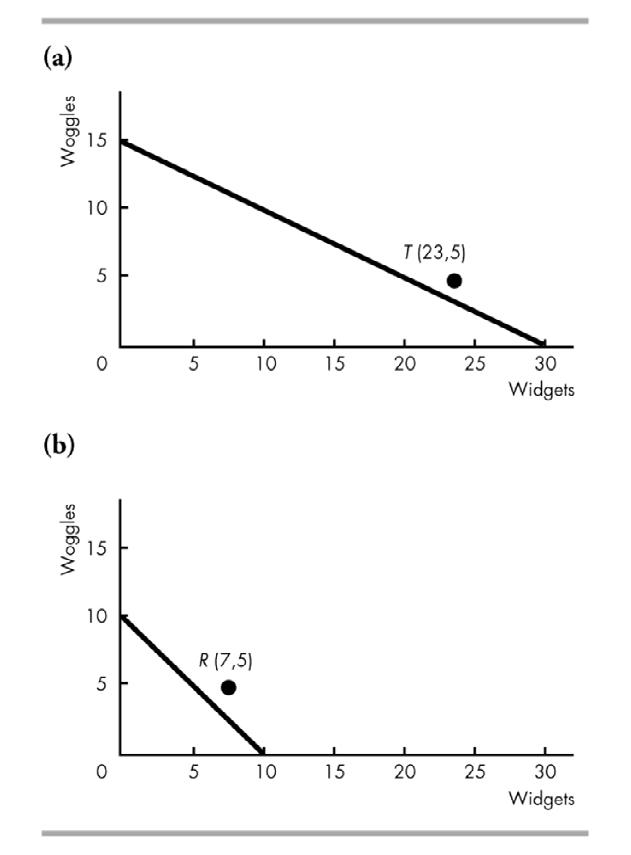
b. Individuals are self-sufficient if they consume only what they produce. This means there is no trade. Without trade, Tova’s (maximum) consumption possibilities are exactly the same as her production possibilities—points along her PPF. Ron’s (maximum) consumption possibilities are likewise the points along his PPF.
c. Tova has an absolute advantage in the production of both widgets and woggles. Her absolute advantage can be defined either in terms of greater output per unit of input or fewer inputs per unit of output. A comparison of the PPFs in the figures above shows that, for given inputs of 30 hours, Tova produces a greater output of widgets than Ron (30 versus 10) and a greater output of woggles than Ron (15 versus 10). The statement of the problem tells us equivalently that, per unit of output, Tova uses fewer inputs than Ron for both widgets (1 hour versus 3 hours) and woggles (2 hours versus 3 hours). Since Tova has greater productivity than Ron in the production of all goods (widgets and woggles), we say that overall she has an absolute advantage.
d. Tova has a comparative advantage in the production of widgets, since she can produce them at lower opportunity cost than Ron (1/2 woggle versus 1 woggle). On the other hand, Ron has a comparative advantage in the production of woggles, since he can produce them at a lower opportunity cost than Tova (1 widget versus 2 widgets).
e. Tova will produce widgets and Ron will produce woggles, yielding a total production between them of 30 widgets and 10 woggles.
f. After the exchange, Tova will have 23 widgets and 5 woggles (point T). Ron will have 7 widgets and 5 woggles (point R). These new post-trade consumption possibility points lie outside Tova’s and Ron’s respective pre-trade consumption (and production) possibilities. Hence trade has yielded gains that allow the traders to improve their consumption possibilities beyond those available with self-sufficiency.
More questions follow on the next page.
1.3.1
Q. Explain the difference between absolute advantage and comparative advantage.
A. Absolute advantage is the ability to produce a product or service at a lower absolute cost than another producer. Comparative advantage is the ability to produce a product or service at a lower opportunity cost than another producer. The key difference is between the absolute, or dollar, cost and the opportunity cost — what you must give up to produce more of the product or service.
1.3.2
Q. If you spend the next hour working at Canadian Tire, you will earn $10. If you instead spend the next hour studying economics, your next test score will improve by five marks. Calculate the opportunity cost of studying in terms of dollars given up per mark. Calculate the opportunity cost of working in terms of marks given up per dollar.
A. The opportunity cost of studying for one hour is the $10 you give up from not working. That hour gets you 5 marks on your test. So the opportunity cost of each additional mark is $10 ÷ 5 marks = $2 per mark. The opportunity cost of working for one hour is the 5 extra marks you give up by not studying. So the opportunity cost of each additional dollar is 5 marks ÷ $10 = ½ mark per dollar. Remember, you always calculate opportunity cost using the formula Give Up ÷ Get.
1.3.3 Q. The best auto mechanic in town (who charges $120/hour) is also a better typist than her office manager (who earns $20/ hour). The mechanic decides to do her own typing. Is this a smart choice for her to make? Explain your answer. [Hint: The best alternative employment for the office manager is another office job that also pays $20/hour.]
A. The question of whether the mechanic should do her own typing is the question of whether there are gains from trade between the mechanic and her office manager when each specializes in what she does best and then exchanges in the market for the other service. Gains from trade do not depend on absolute advantage; they depend on comparative advantage. So to answer the question we need to know the opportunity costs for both the mechanic and the office manager. For these types of questions, it is always helpful to draw a table like Figure 1.3 on p. 10, which would look like this.
O.C. of 1 Additonal Hour of
Mechanic Services
Mechanic
Office Manager
Comparative Advantage
$120
Much more than $120
Mechanic
Typing
$120
$20
Office Manager
For the mechanic, the opportunity cost of spending one hour repairing cars is giving up working an hour repairing a different car, for which she would also earn $120. The opportunity cost for the mechanic of spending one hour typing is the $120 she could have earned repairing cars. Opportunity cost is the cost of the best alternative given up ($120 as a mechanic versus $20 as a typist).
For the office manager, to even begin to provide mechanic services, she would have to retrain as a mechanic, which would have a cost far greater than $120. And you are told that her opportunity cost of doing one hour of typing is another office job also paying $20/hour.
If we compare opportunity costs — reading down each column — for mechanic services, the mechanic has a lower opportunity cost ($120), so she has a comparative advantage in providing mechanic services. For typing, the office manager has a comparative advantage in providing typing services ($20 is lower than $120). So there are gains from trade if the mechanic specializes in repairing cars and the office manager specializes in typing. So the auto mechanic should not do her own typing.
1.4 Economists as Mapmakers and Scientists: Thinking Like an Economist
Learning Objective
Explain how models like the circular flow of economic life make smart choices easier.
Main Point
Key Terms
The circular-flow model, like all economic models, focuses attention on what’s important for understanding and shows how smart choices by households, businesses, and governments interact in markets.
Model
a simplified representation of the real world, focusing attention on what’s important for understanding
Inputs
the productive resources — labour, natural resources, capital equipment, and entrepreneurial ability — used to produce products and services
Positive statements about what is; can be evaluated as true or false by checking the facts
Normative statements about what you believe should be; involve value judgments
Discussion or Homework Q&A
1. Q. Suppose your friend, who is a history major, claims that economic models are useless because they are so unrealistic. He claims that since the models leave out so many descriptive details about the real world, they can’t possibly be useful for understanding how the economy works. How would you defend your decision to study economics?
A. Models are like maps, which are useful precisely because they abstract from real-world detail. A useful map offers a simplified view, which is carefully selected according to the purpose of the map. No mapmaker would claim that the world is as simple as her map, and economists do not claim that the real economy is as simple as their models. What economists claim is that their models isolate the simplified effect of some real forces (like self-interested smart choices) operating in the economy, and yield predictions that can be tested against real-world data.
Another way to answer your friend would be to challenge him to identify what a more realistic model or theory would look like. You would do well to quote Milton Friedman (a Nobel Prize winner in economics) on this topic: “A theory or its ‘assumptions’ cannot possibly be thoroughly ‘realistic’ in the immediate descriptive sense.… A completely ‘realistic’ theory of the wheat market would have to include not only the conditions directly underlying the supply and demand for wheat but also the kind of coins or credit instruments used to make exchanges; the personal characteristics of wheat-traders such as the color of each trader’s hair and eyes, … the number of members of his family, their characteristics,… the kind of soil on which the wheat was grown,… the weather prevailing during the growing season;… and so on indefinitely. Any attempt to move very far in achieving this kind of ‘realism’ is certain to render a theory utterly useless.” From Milton Friedman, “The Methodology of Positive Economics,” in Essays in Positive Economics (Chicago: University of Chicago Press, 1953), p. 32.
1.4.1 Q. Who are the three sets of players in the circular flow of economic life?
A. The three sets of players in the circular flow of economic life are households, businesses, and governments.
1.4.2 Q. Write a positive statement linking increasing government taxes on tobacco and smoking habits. Now rewrite it as a normative statement.
A. Answers will differ but the positive statement must be fact based, that is, checkable by anyone through research. For example, “An increase in taxes on tobacco products causes a decrease in consumption.” This can be checked and proven true or false by looking at past data.
The normative statement is opinion based and is different for different people, non-provable, and open to change. For example, “Government should tax tobacco products in order to show its concern for public health.” There is no way validate this statement through fact checking. The statement is the opinion of the speaker.
More questions follow on the next page.
1.4.3
Q. If you are trying to decide whether to buy a car, what are the most important factors to focus on when making your decision? What are some of the factors that you ignore, or leave out of your decision? Explain how your thinking resembles an economic model.
A. Answers will vary, but should include some of the following:
• Factors to focus on include: your savings, expected income, payment costs, upkeep costs, other debts, current transportation costs.
• Factors to ignore include: the weather in Costa Rica, the probability of the Leafs winning the Stanley Cup, who is the Prime Minister of Canada.
A model is a simplified representation of the real world, focusing attention on what’s important for understanding a specific idea or concept. The factors to focus on are important for understanding a smart choice about buying a car. The model is useful because it leaves out unnecessary information.
1.5 Where and How to Look: Models for Microeconomics and Macroeconomics
Learning Objective
Differentiate microeconomic and macroeconomic choices , and explain the Three Keys model for smart choices.
Main Point
Key Terms
The Three Keys model summarizes the core of microeconomics, providing the basis for smart choices in all areas of your life.
Microeconomics
analyzes choices that individuals in households, individual businesses, and governments make, and how those choices interact in markets
Macroeconomics
analyzes performance of the whole Canadian economy and global economy, the combined outcomes of all individual microeconomic choices
Marginal benefits additional benefits from the next choice
Marginal opportunity costs additional opportunity costs from the next choice
Implicit costs
Opportunity costs of investing your own money or time
Negative (or positive) externalities
costs (or benefits) that affect others external to a choice or a trade
Discussion or Homework Q&A
1. Q. Back in the old days, professors and students could smoke in the classrooms. Today, smoking indoors in public places is illegal.
a. Provide an example of an “external cost” that indoor smokers fail to consider when deciding to light up inside the classroom.
b. Do you think that those who smoked indoors considered the “external cost” in their decision to smoke? Why or why not?
c. Another way to discourage smoking is to tax the activity. If people respond to incentives, how would we expect smokers to adjust their behaviour in response to an increase in a cigarette tax?
A. a. Smokers often ignore the cost that non-smokers incur from inhaling their cigarettes. If they considered this cost in their decision-making process, then they may have found that the cost exceeded the benefit.
b. No — if they did, they wouldn’t have smoked indoors because the external cost would likely have been high enough to offset personal gains.
c. Since a tax represents a rise in price to the end user, an increase in the tax on cigarettes should cause smokers to reduce the number of cigarette packs they buy, assuming they are sensitive to changes in the price. However, it is possible that some smokers may be addicted to the point where they cannot reduce their consumption.
2. Q. From a social point of view, external costs should be included in making smart decisions, but sometimes they are not. In each of the following examples, determine whether the market economy (in the absence ofgovernment policy) would result in too few or too many products or services being produced. Then describe one policy or program that the government has in place to force individuals to consider these costs or benefits when they make decisions.
a. Pollution levels
b. Smoking levels
c. Education levels
A. a. Too much pollution; carbon taxes, fines for cars that don’t pass emission tests.
b. Too high; cigarette taxes, banning smoking indoors.
c. Too little education; tuition subsidies, loans.
1.5.1
Q. List the three keys to smart choices, and highlight the most important words in each key.
A. Key 1: Choose only when additional benefits are greater than additional opportunity costs. Emphasize opportunity costs.
Key 2: Count only additional benefits and additional opportunity costs.
Emphasize the word additional which is the same as marginal.
Key 3: Be sure to count all additional benefits and costs, including implicit costs and externalities. Emphasize what counts as benefits and costs – implicit costs and externalities, which are less obvious costs that you must look carefully for.
1.5.2
1.5.3
Q. Find one story in today’s news that you think is about microeconomics, and one that is about macroeconomics. How did you decide whether the story was about micro or macro economics?
A. Answers will vary. The news item about microeconomics should focus on an individual’s choice and it’s repercussions. The macroeconomics item should focus a larger, national, international or global issue.
Q. Highway 407 ETR in Toronto is a toll road that uses transponders to keep track of how many kilometres you drive on it, and then sends you a monthly bill. Highway 401 runs parallel to Highway 407 and is free. Why do drivers voluntarily pay the tolls? (Use opportunity cost in your answer.) Suppose the government could calculate the cost per kilometre of the pollution damage from your driving, and send you a similar monthly bill. How might that additional cost affect your decision to drive?
A. Given a choice between a free road and a toll road, drivers will be willing to pay the toll if the value of the saved time from the less congested toll road (additional benefit) is worth more to them the cost of the toll (additional cost). The opportunity cost of any choice is the best alternative you give up. So by taking the toll road, you are giving up the cost of the toll, but you are getting a savings in time. By taking the free 401 Highway, you save the cost of the toll (your “get”) but you are giving up some of your time that could have been saved on toll Highway 407. You smart choice depends on the value of your saved time compared to the cost of the toll. If you received a monthly bill for the pollution damage from your driving, that increases the additional costs of driving. If the benefits from driving remain the same, the additional costs will lead some motorists to drive less – to choose public transit instead.
2 Making Smart Choices The Law of Demand
Learning Objectives
1. Describe what determines your willingness and ability to pay for a product or service.
2. Identify why smart choices depend on marginal benefits, not total benefits, and explain what changes marginal benefits.
3. Explain the law of demand, and describe the roles of substitutes and willingness and ability to pay.
4. Explain the difference between a change in quantity demanded and a change in demand, and identify five factors that change demand.
Lecture Narrative
This chapter explains demand as a response to two questions: “How badly do you want it?” and “How much are you willing and able to give up for it?” Demands are smart choices when expected benefits are greater than costs, and I emphasize the importance of marginal benefit (Key 2). I develop quantity demanded and the law of demand from examples of choices among substitutes, focusing on what happens to buying decisions when prices change. To help students understand the importance of marginal benefit for smart choices, I illustrate the two ways to read a demand curve. Reading from price to quantity (over and down), highlights the effects of substitution. Reading from quantity to marginal benefit (up and over), highlights willingness and ability to pay at the margin.
The final section on the five factors that change demand (including substitutes, complements, and normal/inferior goods) begins with an apparent contradiction to the law of demand, when gas prices rise and the quantity of gasoline bought and sold increases. This motivates the distinction between a change in quantity demanded and a change in demand, which allows us to “save” the law of demand from the apparent contradiction. Because there are no further chapters on consumer choice, this chapter contains all of the intuition behind consumers’ willingness and ability to pay for products and services.
Graphs, Tables and Illustrations
2.4
2.5
2.6
2.7
Key: G - Graph(s) For titles in blue, Narrated Dynamic Graph videos are available online on each Chapter Resources page. T - Table
Graphs follow on the next page.
Narrated Dynamic Graphs are identified with a blue video button. To access them, log into the Pearson course website (pearsonmylab.com), click on Chapter Resources, and then Chapter 2.
2.3b Reading the Demand Curve as a Marginal Benefit Curve
2.4 An Increase in Demand for Beats Headphones 2.5 More Consumers Increase the Market Demand for Water
Decrease in demand is le ward shi of demand curve.
Active Learning Suggestions
Top Choice
Dynamic Study Modules
Teaching Blog
Increase in demand is rightward shi of demand curve.
Decrease in quantity demanded is a movement up along an unchanged demand curve.
Increase in quantity demanded is a movement down along an unchanged demand curve.
The best way to introduce the law of demand is to hold a real auction in class. I bring something students like (a Coke on a Pepsi-only campus, cookies from the bakery where my daughter works, ….) and start playing promoter, selling a wonderful (ice-cold Coke! Cookies made with real ginger!) product. The rules are that I put prices on the board, starting at $0, and ask students who are willing and able to pay that price to raise their hands. Then I count (very roughly in large classes) the number of hands and write that quantity next to the price. The key rule is that students must have the cash (no debit or VISA) and must buy the product if they are the highest bidder. I usually start with 50 cent increments, but use my judgment about jumping to larger increments. What appears on the board is the inverse relation between price and quantity demanded. At prices get really high, this often turns into a “pissing contest” between a few student who want to win and come up to the front of the class to claim their prize, and the number of hands can increase at the highest prices.
After the fun and shouting (the more the better) subside (you should do your best imitation of a game show host), the teaching part of the activity comes from asking students what factors went into their decisions, at each price, to raise their hand or not. From their answers, you get all of the assumptions behind the law of demand. One important answer that always emerges is that the quantity demanded drops off dramatically as you pass the price most students think the product sells for elsewhere. This emphasizes the importance of substitutes for the law of demand. Even the bidding at the end that violates the law of demand allows discussion of status goods (see Refresh question 2.4.3).
Come prepared with lots of change, and let students know you are donating the money to a scholarship fund or student association at your school. I have sold a Coke for $20 and a box of 6 cookies for $50!
The online Dynamic Study Modules (http://media.pearsoncmg.com/intl/pec/mylab/2016c/cohen2ce/micro/mmnd_html/ dynamic_study_modules.html) are created generically for any Canadian economics text. Modules students can work through with some (not all) content related to Chapter 2:
• The Market Forces of Supply and Demand
• The Theory of Consumer Choice
• The Basis of Consumer Behaviour
Check out economicsforlife.ca for new media stories, related discussion questions, and other active learning ideas. All posts are tagged by textbook chapters and topics.
2.1 Put Your Money Where Your Mouth Is: Weighing Benefits, Costs, and Substitutes
Learning Objective
Describe what determines your willingness and ability to pay for a product or service.
Main Point
Key Terms
Your willingness to buy a product or service depends on your ability to pay, comparative benefits and costs, and the availability of substitutes.
Preferences your wants and their intensities
Demand consumers’ willingness and ability to pay for a particular product or service
Discussion or Homework Q&A
1. Q. What is a smart choice?
A. • when making a decision consider only additional (marginal) costs and additional (marginal) benefits
• all the sunk costs are ignored
• a smart choice is very important when facing scarcity
2. Q. If you don’t have enough money to get a product, can you still have a demand for it?
A.
Refresh Q&A
2.1.1
• no
• demand is a willingness and ability to pay
• if you can’t pay, your willingness alone does not count
Q. What is the difference between wants and demands?
A. Wants are much greater than demands. Your wants for products or services are limitless, and economists describe your wants and their intensities as your preferences. Demand describes your willingness and ability to pay for a particular product or service. You must put your money (or time) where your mouth is in order to demand a product or service.
2.1.2
2.1.3
Q. What is the key factor that would make you choose to download a song for free rather than pay for it on iTunes? Explain your choice.
A. Answers will differ, but whatever the students’ personal decision between buying music and downloading music for free, some factors that are likely to influence their choice are:
• how much they like the song (their preferences and expected benefits from listening)
• whether the song is available for free
• how much it costs to buy
• what they can afford to pay
• their values about the ethics of downloading
Q. You have just started at a school that is a 30-minute drive from home or a 90-minute transit ride. What is your smart choice, taking the transit or buying a car? Justify your choice.
A. In making the choice between transit or buying a car, you should determine what the marginal benefits will be and if they are greater than the costs.
In choosing between taking transit to school or driving, the benefits comparison includes:
• the convenience and speed of driving versus the fixed transit schedule and longer ride
• how much you value your time
• the costs of owning and driving a car versus transit fares
If you are concerned about the environment, you might also consider the environmental advantages of public transit in making your choices.
2.2 Living on the Edge: Smart Choices are Marginal Choices
Learning Objective
Identify why smart choices depend on marginal benefits, not total benefits, and explain what changes marginal benefits.
Main Point
Key Term
Key 2 states, “Count only additional benefits and additional costs.” Additional benefits mean marginal benefits — not total benefits — and marginal benefits change with circumstances.
Marginal benefit the additional benefit from a choice, changing with circumstances
Discussion or Homework Q& A
1. Q. Consider the diamond/water paradox — diamonds are very expensive but not required for life, but water, a necessity for life, is relatively inexpensive. What if you are Bill Gates walking through the desert alone with pockets full of diamonds? How will this affect your marginal benefits?
A. Water is scarce in the desert, so its marginal benefit is very high while having pockets full of diamonds makes their marginal benefit low. In this situation, the price of water may exceed the price of diamonds.
2. Q. A demand curve shows visually the relationship between two variables – price and quantity demanded. Explain what it means to “read” this relationship in two ways.
A. There are correlations between the two variables. Reading two ways is to attach different causation stories to the relationship. The demand curve story tells for any price, what quantities consumers will demand. The marginal benefit story tells for any quantity, how much someone is willing to pay.
2.2.1
Q. In your own words, define marginal benefit.
2.2.2
2.2.3
A. Answers may vary but should include the following concepts. Marginal benefit is the additional benefit from a choice. Marginal benefit changes with circumstances. For example, the additional benefit you get from studying for one more hour depends on if you have hardly studied at all (marginal benefit will then be high) or if you have studied your brains out already (marginal benefit will then be low).
Q. Explain why we are willing to pay more for a diamond than a glass of water even though water is essential for survival and diamonds are an unnecessary luxury.
A. The difference in willingness to pay more for a diamond than a glass of water is connected to the difference between marginal benefit and total benefit. Willingness to pay depends on marginal benefit, not total benefit. Because water is abundant, the marginal benefit of an additional glass of water is low, even though the total benefit of all water consumed, including the first lifesaving glass, is high. Because diamonds are scarce, marginal benefit is high, even though total benefit of the few diamonds available is low.
Q. You and your entrepreneurial buddy have a concession stand on the beach. It is a hot, sunny, crowded day, and you are selling a few $5 collapsible umbrellas as sun shades. The skies suddenly darken, rain begins to pour, and your buddy quickly switches the umbrella price sign to $10. Will you sell more or fewer umbrellas? Explain your thinking, including your analysis of the customer’s decision.
A. Even though you raise the price of umbrellas from $5 to $10, you might still sell more umbrellas as it starts raining. The rain dramatically increases the marginal benefit of an umbrella to customers, so they might still be making a smart choice to buy an umbrella, even at the $10 price. Two factors for consumers’ choices have changed — increased cost (leading to fewer sales) and increased benefits (leading to higher sales) — so it is hard to predict if you will sell more or fewer umbrellas. Refresh Q&A
2.3 Move on When the Price Isn’t Right: The Law of Demand
Learning Objective
Explain the law of demand and describe the roles of substitutes and willingness and ability to pay.
Main Point
Key Terms
The demand curve combines two forces — switch to substitutes; willingness and ability to pay — determining quantity demanded, and can be read as a demand curve and as a marginal benefit curve.
Quantity demanded the amount you actually plan to buy at a given price
Market demand the sum of demands of all individuals willing and able to buy a particular product or service
Law of demand if the price of a product or service rises, quantity demanded decreases, other things remaining the same
Demand curve shows the relationship between price and quantity demanded, other things remaining the same
Discussion or Homework Q&A
1. Q. Advertising is designed to increase your preference for a product or service. Give an example of a slogan that changed or shaped your preference.
A. • “There’s always Coca-Cola” (you should keep on having colas)
• “You’ve always got time for Tim Hortons” (go out of your way but come to the doughnut shop)
• “Harveys: Have it your way” (have a customized burger every time)
2. Q. Suppose a city is considering the idea of returning to a flat monthly rate payment scheme for water usage instead of its current fee for use structure. Explain what will happen to the demand for the following products: water, orange juice, soap, rubber ducky bath toys.
A. Water: quantity demanded will increase because price has fallen
Orange juice: demand will decrease because, water, a substitute good, is now cheaper Soap: demand will increase because water, a complement good, is now cheaper. Longer showers!
Rubber ducky bath toys: demand will increase because it is a complement good
Refresh Q&A
2.3.1
Q. In just a couple of sentences, explain the law of demand to a friend who is not taking this economics course.
A. Answers may differ, but should include all or most of the following:
• If the price of a product or service rises, quantity demanded decreases.
• At a higher price, fewer consumers are willing and able to pay for the product or service.
• Some consumers switch to cheaper substitutes as prices rise.
2.3.2 Q. You own a car and work at a job that you cannot get to by public transit. If the price of gasoline goes up dramatically, does the law of demand apply to you? Explain the choices you might make in responding to this price rise.
A. As the price of gasoline goes up, your commute to work becomes more expensive. Although public transit is not available as a substitute, there are still choices you can make to reduce the quantity demanded of gasoline. You might arrange a carpool with other employees, which would reduce the total quantity demanded of gasoline. You might also keep your car tuned up to save gas, or turn off the engine instead of idling. With more time to adjust, you might move closer to this job, find a different job that is closer to home or accessible by transit, or buy a hybrid or more fuel-efficient car. All of these choices will decrease your quantity demanded of gasoline.
More questions follow on the next page.
2.3.3
Q. You have tickets for a concert tonight that you have been looking forward to. Your mother, who is helping you pay your tuition, phones and says that it’s very important to her that you come to Grandma’s birthday party tonight. Using the law of demand, explain your decision — the concert or Grandma’s party? [Hint: Think about opportunity cost]
A. According to the law of demand, as the price rises, quantity demanded decreases. The “price” of going to the concert includes the ticket price, but also includes the opportunity cost of what you give up to attend the concert. Your mother’s request to come to Grandma’s birthday party increases the opportunity cost of going to the concert. As the concert “price” rises, your choice to go to the party decreases your quantity demanded of concert tickets from 1 to 0.
2.4 Moving the Margins: What Can Change Demand?
Learning Objective
Explain the difference between a change in quantity demanded and a change in demand, and identify five factors that change demand.
Main Point
Key Terms
Quantity demanded is changed only by a change in price. Demand is changed by all other influences on consumer choice.
Increase in demand increase in consumers’ willingness and ability to pay. Rightward shift of demand curve.
Decrease in demand decrease in consumers’ willingness and ability to pay. Leftward shift of demand curve.
Substitutes products or services used in place of each other to satisfy the same want
Complements products or services used together to satisfy the same want
Normal goods products or services you buy more of when your income increases
Inferior goods products or services you buy less of when your income increases
Discussion or Homework Q&A
1. Q. Identify the factor responsible for changing demand – i.e. preferences, prices of related goods, income, expected future prices or the number of consumers – after the following events take place:
a. The impact on the demand for groceries at a local store after a new 120-unit apartment building is built.
b. The impact of downloading music on the demand for CDs.
c. The impact on the demand for cars and houses in anticipation of a 1% decrease in GST.
d. A popular band’s last year’s album that became a bestseller can suddenly be found in a discount bin at the music store for only $1.99.
A. a. number of consumers
b. prices of related goods
c. expected future prices
d. preferences
2. Q. Young drivers account for more than 35% of all drivers involved in fatal accidents, despite only representing 20% of all licensed drivers. Explain how each of the following policies would affect the demand for alcohol:
a. increasing the minimum age for drinking
b. raising the price (e.g. through higher taxes) of alcohol
c. using advertising campaigns to deter alcohol usage
A. a. decrease demand
b. decrease in quantity demanded
c. decrease demand
2.4.1 Q. Explain the difference between a change in quantity demanded and a change in demand. Identify the five factors that can change demand.
A. A change in the quantity demanded of a product or service is due to a change in the price of that product or service. A change in demand for a product or service is caused by a change in anything else. The five (“anything else”) factors that can change market demand are changes in preferences, prices of related products, income, expected future prices, and number of consumers.
2.4.2
2.4.3
Q. Roses sell for about $40 a bouquet most of the year, and worldwide sales are 6 million bouquets per month. Every February, the price of roses doubles to $80 a bouquet, but the quantity of roses demanded and sold also increases, to 24 million bouquets per month. The cost of producing roses doesn’t change throughout the year. Can you explain what else is going on that saves the law of demand?
A. A rise in price decreases quantity demanded, as long as other factors besides price do not change. The key “other factor” that changes in February is Valentine’s Day. Because of the Valentine’s Day tradition of giving roses as gifts, preferences for roses increase (a greater willingness to pay for roses) in February. It is this increase in preferences that saves the law of demand and accounts for the increase in sales of roses even though the price of roses is higher.
Q. There are some “status goods,” like Rolex watches, that people want to own because they are expensive. In contradiction to the law of demand, if Rolex watches were less expensive, few “status-seeking” consumers would demand them. Reconcile status products or services with the law of demand. How does the existence of cheap “knock-off” imitations of Rolex watches fit with the law of demand?
A. Consumers who demand “status goods” like Rolex watches are mostly demanding the status of appearing able to afford the expensive watch, rather than the time-keeping qualities of the watch itself. A cheap, non-Rolex watch is not a substitute for a status-seeking consumer. But knockoff Rolex watches illustrate the law of demand for status goods. As long as the consumer believes that others cannot tell the difference between a real Rolex and a knockoff, the knockoff supplies the same status at a lower price. The fact that more knockoffs are sold than real Rolex watches illustrates the law of demand for status goods.
3 Show Me the Money The Law of Supply
Learning Objectives
1. Explain why marginal costs are ultimately opportunity costs.
2. Define sunk costs and explain why they do not influence smart, forward-looking decisions.
3. Explain the law of supply and describe the roles of higher profits and higher marginal opportunity costs of production.
4. Explain the difference between a change in quantity supplied and a change in supply, and list six factors that change supply.
Lecture Narrative
This chapter parallels the previous demand chapter, motivating the supply decision as a choice among alternative opportunities, comparing expected benefits and costs at the margin. Setting aside sunk costs, I show that all costs relevant for smart choices are ultimately opportunity costs. Quantity supplied is developed using examples of willingness to work (depending on the wage offered), and a small business example of choosing among alternative products to supply. The example of Paola’s Parlour for Piercing and Nails has a production possibilities frontier that yields increasing marginal costs. This allows derivation of the law of supply and increasing marginal costs using only opportunity cost. This simplified treatment avoids the need for production functions and detailed cost curves (this alternative treatment is presented in Chapter 9 Appendix if you want to cover it). Paola’s small business example recurs throughout later chapters. To help students understand the importance of marginal cost for smart supply choices, I illustrate the two ways to read a supply curve. Reading from price to quantity (over and down), highlights the effects of higher prices (through increased profits and covering higher marginal opportunity costs) on quantity supplied. Reading from quantity to marginal cost (up and over), highlights the minimum price a business will accept to cover all marginal opportunity costs.
The final section on the six factors changing supply begins with an apparent contradiction to the law of supply, when price of ultrabook computers falls while the quantity bought and sold increases. This motivates the distinction between a change in quantity supplied and a change in supply, which allows us to “save” the law of supply from the apparent contradiction.
Graphs, Tables and Illustrations
3.1 Your Supply of Hours Worked
3.2 Paola’s Parlour Production Possibilities Frontier
3.3 Paola’s Parlour’s Marginal Opportunity Costs
3.4 Increasing Marginal Opportunity Cost
a) Marginal Opportunity Costs of Additional Piercings Measured in Fingernail Sets
b) Marginal Opportunity Cost of Additional Piercings Measured in $
3.5 Market Supply of Piercings
3.6 Two Ways to Read a Supply Curve
a) Reading the Supply Curve as a Supply Curve
b) Reading the Supply Curve as a Marginal Cost Curve
3.7 Increase in Market Supply of Piercings
3.8 Change in Quantity Supplied versus a Change in Supply a) Change in
b) Change in Supply
3.9 Law of Supply and Changes in Supply
Graphs follow on the next page.
Key:
G - Graph(s) For titles in blue, Narrated Dynamic Graph videos are available online on each Chapter Resources page.
T - Table
Narrated Dynamic Graphs are identified with a blue video button. To access them, log into the Pearson course website (pearsonmylab.com), click on Chapter Resources, and then Chapter 3.
3.4a Marginal Opportunity Costs of Additional Piercings Measured in Fingernail Sets
3.4b Marginal Opportunity Cost of Additional Piercings Measured in $ 3.5 Market Supply of Piercings
e minimum price Paola is willing to accept per piercing is based on ngernail sets selling for $20
3.7 Increase in Market Supply of Piercings
3.8a Change in Quantity Supplied
Decrease in quantity supplied is a movement down along an unchanged supply curve
From any quantity on the horizontal axis, go up to the marginal cost curve and over to the price.
Marginal Cost of Piercings
Change in Supply
Decrease in supply is le ward shi of supply curve. Increase in supply is rightward shi of supply curve.
Active Learning Suggestions
Top Choice
Dynamic Study Modules
There is an engaging video (https://www.youtube.com/watch?v=ukNkCnNJuR8) about the noodle-shaving robots described in the Economics Out There on p. 66. Besides being fun, it has some interviews in Chinese (with English subtitles) which have been popular with my Chinese-speaking students.

Play the video and use these or similar questions for discussion:
• What created the incentive for the invention of the robots?
• How do you represent the invention of the robots using a supply curve?
• Explain two ways to read the supply curve for meals with noodles, comparing supply before and after the invention.
• Will robots cause unemployment for workers?
The online Dynamic Study Modules (http://media.pearsoncmg.com/intl/pec/mylab/2016c/cohen2ce/micro/mmnd_html/ dynamic_study_modules.html) are created generically for any Canadian economics text. Modules students can work through with some (not all) content related to Chapter 3:
• The Market Forces of Supply and Demand
Teaching Blog Check out economicsforlife.ca for new media stories, related discussion questions, and other active learning ideas. All posts are tagged by textbook chapters and topics.
3.1 What Does It Really Cost? Costs Are Opportunity Costs
Learning Objective
Explain why marginal costs are ultimately opportunity costs.
Main Point
Key Term
Businesses must pay higher prices to obtain more of an input because opportunity costs change with circumstances. The marginal costs of additional inputs (like labour) are ultimately opportunity costs — the best alternative use of the input.
Marginal cost
additional opportunity cost of increasing quantity supplied, and changes with circumstances
Discussion or Homework Q&A Refresh Q&A
1. Q. Your boss asks you to work 20 additional hours next weekend. If you work those 20 hours, you will not be able to see your significant other. You really value the time you spend with your significant other, and the only time you’ve gone a weekend without seeing each other was when your friends offered to pay you $300 to spend the weekend with them instead. You agreed because this is the minimum amount you must be compensated for giving up a weekend with your significant other.
a. Should you work 20 weekend hours if your boss pays your regular hourly wage rate of $10?
b. Should you work 20 weekend hours if your boss pays the overtime rate of $15 per hour for the whole weekend?
A. a. No — you would receive only $10/hour × 20 hours = $200 for the weekend, which is lower than the value you place on spending time with your significant other on a weekend ($300).
b. Perhaps — you would receive $15/hour × 20 hours = $300 for the weekend, which is equal to the value you place on spending time with your significant other. You may want to say no if you place additional value on other things that you may have to miss out on by working (for example, watching television, talking on MSN, going on Facebook, and so on). On the other hand, you may want to say yes if these other additional benefits from saying no are lower than some other additional benefits from saying yes (for example, getting on your boss’s good side).
2. Q. Employees do not like working long weekdays and on weekends, so employers offer higher wages for the extra time in the form of “overtime pay,” which could be up to three times the regular wage. Why is it important for businesses to offer overtime pay?
A. Employees who spend up to one-third of their life at work — 8 hours out of 24 in a day — value their free time. As employers want workers to put in more hours of work, the worker’s free time becomes more scarce and valuable, so the marginal opportunity cost of an additional hour of work is greater
3.1.1 Q. Explain why marginal costs are ultimately opportunity costs.
A. Marginal costs are additional costs of using more inputs to produce more products or services. To hire or buy inputs, a business must pay a price matching the best opportunity cost of the input owner. If the business does not pay the opportunity cost, the input owner (for example, a worker), will not supply his input to this business but will work for another business paying a higher price (wage). Marginal costs ultimately equal the opportunity costs of the input owner.
3.1.2
Q. In 2013, Microsoft released a limited supply of Xbox ONEs with a list price of $500. The units immediately started selling on eBay and other online auction websites for far more than $500. What factors determined that increase in price of an Xbox One?
A. The real cost of any input or product is determined by the best alternative use of that input or product. Microsoft set the price of an Xbox One at $500 in 2013. But because Xbox Ones were in short supply (the demand was greater than the available supply) anyone who was lucky enough to buy an Xbox One for $500 had the opportunity to resell it for more to one of the many consumers who wanted, but did not get, one of the limited supply. As an Xbox One owner, you could use it or alternatively re-sell it for far more than $500. The “real” price on the street of an Xbox One was determined by what consumers were willing to pay, not by the list price set by Microsoft.
More questions follow on the next page.
3.1.3
Q. During a recession it much harder for workers to find better-paying jobs. Explain how a recession might affect Paola’s labour costs.
A. If jobs become harder to find, then the alternative opportunities for Paola’s workers become harder to find. If the recession lasts long and unemployment is a problem, then a worker’s opportunity cost of working for Paola — the best alternative job he or she would give up — falls. Workers might accept lower wages from Paola because they have no better alternative.
3.2 Forget It, It’s History: Sunk Costs Don’t Matter for Future Choices
Learning Objective
Define sunk costs and explain why they do not influence smart, forward-looking decisions.
Main Point
Key Term
Sunk costs are the same no matter which fork in the road you take, so they have no influence on smart choices.
Sunk costs past expenses that cannot be recovered
1. Q. Dell tried to compete with Apple’s iPod and invested millions of dollars into a factory to produce its own MP3 player. After a few months of poor sales, Dell started to look into the possibility of abandoning the player (which they eventually did). However, one of the top managers says it would be a mistake to abandon the project after so much money was spent. What is your advice?
A. The money invested in the factory is a sunk cost because it cannot be undone. This cost, however, should not be considered in the decision to abandon the project. The project should be abandoned only if the additional costs of operating the business exceed the additional benefits.
2. Q. You have paid $1500 tuition for a course that has 30 lectures, or $50 per lecture. When you oversleep and miss one lecture, what is the cost of missing the lecture? What is the cost of attending one lecture?
A, The cost of missing the lecture is what you would have learned from attending, or the increase in your course grade because that lecture material helped you do better on tests. The tuition cost is a sunk cost – it is the same whether you miss or attend the lecture – and should not influence your smart choice. The cost of attending one lecture is the opportunity cost – the best alternative use of that time, whether that is sleeping, gaming, going out with friends, … Discussion or Homework
3.2.1 Q. Why aren’t sunk costs part of the opportunity costs of forward-looking decisions?
A. Sunk costs are not part of the opportunity costs of forward-looking decisions because sunk costs are the same no matter which fork in the road you take with your decision. As a result, they have no influence on smart choices.
3.2.2
3.2.3
Q. If you bought a $100 textbook for a course, and then dropped out after the tuition refund date, is that $100 a sunk cost? Explain your answer.
A. The $100 textbook you bought is now not useful to you for the course you dropped. But it is not a sunk cost. Sunk costs are not recoverable. You could sell the textbook to someone else in the course, or to a used-book buyer. On the other hand, the lost tuition is a sunk cost. You cannot recover any of it.
Q. Suppose you have just paid your bus fare. A friend in a car pulls up and offers you a ride. Explain how you would decide between staying on the bus or taking the ride, and the influence of the paid fare on your choice.
A. The paid bus fare is now a sunk cost. You cannot get it back whether you stay on the bus or get off. If you make a smart choice, you will not let the bus fare influence your choice about taking the ride with the friend or staying on the bus. Many people, who have not studied economics, will think, “I paid the fare so it would be waste to get off the bus.” This is not smart thinking. If the friend can get you to your destination faster, or you will have more fun in the car, you should take the ride.
3.3 More for More Money: The Law of Supply
Learning Objective
Explain the law of supply and describe the roles of higher profits and higher marginal opportunity costs of production.
Main Point
Key Terms
If the price of a product or service rises, quantity supplied increases. Businesses increase production when higher prices either create higher profits or cover higher marginal opportunity costs of production.
Supply
businesses’ willingness to produce a particular product or service because price covers all opportunity costs
Quantity supplied quantity you actually plan to supply at a given price
Marginal opportunity cost complete term for any cost relevant to a smart decision
Market supply sum of supplies of all businesses willing to produce a particular product or service
Law of supply if the price of a product or service rises, quantity supplied increases
Supply curve shows the relationship between price and quantity supplied, other things remaining the same
Discussion or Homework Q&A
1. Q. As wages go up, we work longer hours. Research indicates that some workers, such as medical surgeons, may work fewer hours in response to a wage increase. Why might surgeons make this decision? Would this violate the law of supply?
A. Some workers (particularly those with high income) will respond to wage increases by working fewer hours because they value additional hours of leisure over additional hours of work at this wage rate (possibly because they are earning so much money). This would violate the law of supply because as the price of labour (the wage) rises the quantity of labour supplied decreases.
2. Q. Rumour has it that Avril Lavigne is giving a concert in her home town of Napanee, Ontario. The first 50 fans get in free! You are 20 minutes away from Napanee and are considering speeding for the rest of the way. Speeding fines on Highway 401 outside Napanee are $110 for driving 120 km/hr, $143 for driving 130 km/hr, and $295 for driving 140 km/hr.
a. If you are going 120 km/hour, what is the marginal cost if you speed up to 130 km/hour and get caught (assuming you would have been caught if you continued going at 120 km/hour)?
b. If you are going 130 km/hour, what is the marginal cost of speeding up to 140 km/hour and getting caught (assuming you would have been caught if you continued at130 km/hour)?
c. Compare the marginal cost of speeding up from 120 km/hour to130 km/hour, with the marginal cost of speeding up from 130 km/hour to 140 km/hour. Why do you think the police have set up the fines this way?
A.
a. $33
b. $152
c. Fines have been set so that the marginal cost of raising your speed an additional 10 km/hour when you are already going at 130 km/hour is higher than when you are going at 120 km/hour ($152 versus $33). This is done to deter drivers from speeding at really high rates.
3.3.1
Q. Explain why Paola needs a higher price to be willing to supply more piercings.
A. Paola needs a higher price to be willing to supply more piercings because her marginal opportunity cost of supplying more piercings increases as she sells more. To increase her quantity of piercings supplied, Paola must switch better fingernail painters, so a greater quantity of piercings supplied costs Paola more in terms of lost fingernail sales. Increasing marginal opportunity costs arise because inputs — like labourers — are not equally productive in all activities.
3.3.2
3.3.3
Q. If you could spend the next hour studying economics or working at your part-time job, which pays $11 an hour, what is your personal opportunity cost, in dollars, of studying?
A. The opportunity cost of any choice is the value of the best alternative forgone. If earning $11 per hour is your best alternative use of the hour you choose to spend studying, then the opportunity cost of studying for the next hour is $11.
Q. Suppose the Paola’s Parlour was producing only piercings and no fingernail sets. If Paola wanted to start producing some fingernail sets, which staff person should she switch to fingernails first? Who should she switch last? Explain your answers.
A. Remember all workers are equally good at piercing, so from an opportunity cost perspective, it makes no difference who Paola switches first — the number of piercings forgone will be the same. But workers differ in their fingernail painting skills. Paola will switch the best fingernail painter first: herself. That choice gives Paola the greatest gain — the most additional revenue from fingernail sets, for the same opportunity cost of forgone piercings. The “give up” is 1 piercing, and the “get” is 5 fingernail sets. So the opportunity cost per fingernail set is 1/5 piercing. The last worker she would switch to fingernail sets would be Parminder, the worst fingernail painter. Parminder provides the least additional revenue from fingernail sets for the same opportunity cost of foregone piercings. The “give up” is still 1 piercing, but the “get” is only 1 fingernail sets. So the opportunity cost per fingernail set is 1 piercing. If you do all of the opportunity cost calculations, you will see that opportunity costs increase as Paola increases the output of fingernail sets.
3.4 Changing the Bottom Line: What Can Change Supply?
Learning Objective
Explain the difference between a change in quantity supplied and a change in supply, and list six factors that change supply.
Main Point
Key Terms
Quantity supplied is changed only by a change in price. Supply is changed by all other influences on business decisions.
Increase in supply increase in businesses’ willingness to supply; rightward shift of supply curve
Decrease in supply decrease in businesses’ willingness to supply; leftward shift of supply curve
Discussion or Homework Q&A
1. Q. Your friend Pablo opens up a tattoo parlour because he thinks body art is a profitable industry. He is trying to forecast how different factors in the industry would affect supply in the market for tattoos. He knows you are taking a course in economics and asks you to verify whether his predictions are true or false.
a. The entry of new businesses into the (hot) industry will increase supply.
b. An increase in the minimum wage will increase supply.
c. A rise in the price of piercings (a related service) will reduce supply of tattoos.
d. An improvement in tattoo technology will increase supply.
e. A rise in the price of tattoos will increase supply.
A. a. True
b. False. Higher wages — higher input prices — decrease supply.
c. True
d. True
e. False. It will increase quantity supplied, not supply.
2. Q. The increase in oil prices causes many other products to become more expensive to produce, especially the products with high transportation costs or the oil-based plastics. How will the higher oil price affect the supply of these other products?
A. Oil is a major input in the production of these products, higher prices of inputs will cause the supply to decrease.
Refresh Q&A
3.4.1
3.4.2
Q. Explain the difference between a change in quantity supplied and a change in supply. In your answer, distinguish the six factors that can change supply.
A. A change in the quantity supplied of a product or service is due to a change in the price of that product or service. A change in supply for a product or service is caused by a change in anything else. The six (“anything else”) factors that can change market supply are changes in technology, prices of inputs, prices of related products or services, expected future prices, number of businesses, and environmental changes.
Q. Suppose you have two part-time jobs, babysitting and pizza delivery. After younger babysitters start working for less, babysitting clients pay only $8 instead of $10 per hour. What happens to your supply of hours for delivering pizzas? Explain.
A. Your smart choice between working at babysitting or pizza delivery depends, as always, on opportunity cost. For any job, the opportunity cost is what you could have earned at the other job. When babysitting rates fall from $10 to $8 per hour, the opportunity cost of supplying pizza delivery services falls. At any pizza-delivery wage above $8 per hour, you would be willing to supply more hours delivering pizzas.
3.4.3
Q. When the price of nail sets falls, Paola’s hard dollar costs do not change. Will the quantity of piercings Paola supplies increase or decrease? Explain.
A. Even though Paola’s hard dollar input costs have not changed, her opportunity costs change when the price of nail sets falls. Paola will supply more piercings and fewer nail sets, as piercings are now relatively more profitable. Smart choices do not depend on hard, or out-of-pocket costs, they depend on opportunity costs.
4 Coordinating Smart Choices Demand and Supply
Learning Objectives
1. Describe what a market is and the necessary rules for voluntary exchange.
2. Explain how shortages and surpluses affect prices.
3. Identify how market-clearing or equilibrium prices equalize quantity demanded and quantity supplied.
4. Predict how changes in demand and supply affect equilibrium prices and quantities.
5. Explain the efficiency of markets using the concepts of consumer surplus and producer surplus.
Lecture Narrative
This chapter combines the demand and supply material from Chapters 2-3 to describe what happens in markets. Markets require property rights as the rules of the game. Interactions between buyers and sellers combine competition (between buyers and between sellers) and cooperation (voluntary exchange between buyers and sellers). Prices are the outcome of competing bids (from buyers) and offers (from sellers).
The best way to understand how prices are set is to look at what happens when price is set too low or too high. When price is too low, buyers are frustrated. Shortages create pressure for prices to rise from competition between buyers. As price rises, quantity demanded decreases and quantity supplied increases, until the shortage is eliminated. When price is too high, sellers are frustrated. Surpluses create pressure for prices to fall from competition between sellers. As price falls, quantity demanded increases and quantity supplied decreases, until the shortage is eliminated.
At the market-clearing (equilibrium) price, quantity demanded equals quantity supplied, and the forces of competition and cooperation are balanced. There is no tendency for change. Price signals coordinate self-interest through Adam Smith’s Invisible Hand of competition. The result is the miracle of markets (a synonym for economic efficiency) — the continuous, ever-changing production of the products and services we want, without the government doing anything beyond setting the rules of the game.
Equilibrium prices assume that all 5 factors behind the demand curve do not change, and all 6 factors behind the supply curve do not change. I then show what happens to equilibrium prices and quantities when demand and/or supply change. I emphasize the bread-and-butter technique that economists use to explain changes in prices and quantities – comparative statics. Comparative statics is at the heart of what it means to think like a microeconomist.
The final section explains the economic efficiency of an equilibrium market outcome in terms of maximum consumer and producer surplus. The emphasis is on reading demand and supply curves as marginal benefit and marginal costs curves, and showing how any quantity other than the equilibrium quantity has a mismatch between marginal benefit and marginal cost, setting in motions the forces of self-interest that push toward the equilibrium quantity and price.
Graphs, Tables and Illustrations
Key:
G - Graph(s)
For titles in blue, Narrated Dynamic Graph videos are available online on each Chapter Resources page.
T - Table
Graphs follow on the next page.
Narrated Dynamic Graphs are identified with a blue video button. To access them, log into the Pearson course website (pearsonmylab.com), click on Chapter Resources, and then Chapter 4.
Title
4.1 Market Demand and
The Effects of Combined Changes in Demand and Supply
a) Increase in Both Demand and Supply
b) Decrease in Both Demand and Supply
c) Increase in Demand and Decrease in Supply
d) Decrease in Demand and Increase in Supply
a)
b) Inefficiency of Producing Too Much
Figure
Active Learning Suggestions
Top Choice
My top suggestion is based on an entertaining SourceFed YouTube video about rising bacon prices caused by a drought that increased the price of pig feed. See: www.youtube.com/watch?v=1azA5kcrXb8
This exercise works for any class size, and helps the students “get” how to use the demand and supply model to make sense of real world events, and overcome the impression that economics is about boring graphs. Do this after you have presented the textbook once-over shifts of demand and of supply (Figures 4.2 – 4.5). I have used this video many times, and it always generates laughs, interest, and lots of discussion.
Play the video and ask students to analyze the story using a demand and supply graph. Start with just the price and quantity axes on the board. Ask students to identify the market (bacon or pork), and describe what happens starting from an initial equilibrium. Besides the decrease in supply due to an increase in input prices, there is also a segment – to analyze separately –about how the show Epic Mealtime may have increased preferences for bacon, increasing demand.
You can do this for the class as a whole, or break the students into small (3-5) groups and have each group work out the analysis and report back. While in a large class, you can’t have every group report back, ask for volunteers and have a few groups report back, presenting at the front of the class. This activity changes the dynamics of a large class, as students are talking with each other, with permission.
Economic
Experiments
Dynamic Study Modules
See the Market Experiment (http://media.pearsoncmg.com/aw/aw_myeconlab/experiments/instructor/expinstr.html)
Students learn that the willingness to pay (WTP) and cost values used in the experiment form curves that can be labeled as demand and supply. As buyers and sellers interact, market forces determine an equilibrium price that can be seen theoretically as the intersection between the demand and supply curves.
The online Dynamic Study Modules (http://media.pearsoncmg.com/intl/pec/mylab/2016c/cohen2ce/micro/mmnd_html/ dynamic_study_modules.html) are created generically for any Canadian economics text. Modules students can work through with some (not all) content related to Chapter 4:
• The Market Forces of Supply and Demand
• Consumer and Producer Surplus
• Efficiency
Teaching Blog
Check out economicsforlife.ca for new media stories, related discussion questions, and other active learning ideas. All posts are tagged by textbook chapters and topics.
4.1 What’s a Market?
Learning Objective
Describe what a market is and the necessary rules for voluntary exchange.
Main Point
Key Terms
Markets connect competition between buyers, competition between sellers, and cooperation between buyers and sellers. Government guarantees of property rights allow markets to function.
Market
the interactions between buyers and sellers
Property rights legally enforceable guarantees of ownership of physical, financial, and intellectual property
Discussion or Homework Q&A
1. Q. Why do city parks usually have more litter than private golf clubs? Do people who use parks care less about neatness than golfers? How might you explain the difference in litter in terms of incentives and property rights?
A. There might be personality differences between park-users and golfers, but we can also explain the litter difference using incentives. The property rights to the park belong to the city, and indirectly to the people in the city. But no individual has any sense that the park is his or her “property” to look after, as individuals would look after houses that they truly own. Private golf clubs are owned by the limited number of members, who have a much more direct incentive to take care of their property. In addition, littering in city parks is largely anonymous – few individuals feel personally responsible to keep the park tidy for thousands of “others.” In private golf clubs, individuals in the smaller community better know each other, and feel more responsible to keep the club tidy.
2. Q. Since the rise of online evaluation services like Trip Advisor and Yelp, customer service has improved dramatically. There has also been a rise in the number of fake positive reviews. Explain the connections.
A. Online evaluations dramatically increase the incentives/rewards for good customer service. The disincentives/penalties for poor customer services also dramatically increase. Good reviews bring more business, and bad reviews drive away business to competitors. The online reviewing system creates incentives for business owners to “produce” fake positive reviews, because the rewards are great.
Refresh Q&A
4.1.1
4.1.2
4.1.3
Q. In your own words, define what a market is.
A. A market is not a place (physical or virtual) or a thing: it’s a process — the interactions between buyers and sellers.
Q. You are negotiating over the price of a new car with a car dealer. Explain how this process contains both cooperation and competition.
A. In negotiating to buy a car, the process contains cooperation between you as buyer and the dealer as seller. If you come to an agreement, it is voluntary — at the negotiated price, you choose to buy and the dealer chooses to sell, because the deal makes you both better off.
There is competition because you compete with other potential buyers to get the car. The dealer competes with other dealers, and with anyone else selling a car (used cars, online sales).
Q. The Recording Industry Association of America’s (RIAA) mission is “to foster a business and legal climate that supports and promotes our members’ … intellectual property rights worldwide.” Have you ever downloaded music? Write a short argument (three or four sentences) defending people’s right to download music for free. Now, write a short argument against that position including the concept of property rights. Which do you agree with? Explain why.
A. Almost everyone downloads music. Arguments differ, but common arguments against the defence of property rights include
• the record labels already make enough money
• the prices are too high
• there is no cost to the record label or artist of your single download
• the artists will benefit eventually from the exposure
• you cannot afford to pay the prices charged for legal sales of music
Arguments against downloading are mostly based on the ideas property rights and incentives. Without property rights, there are no incentives to produce any product or service for exchange. Customers can take/steal your output for free, so why would you, as a business trying to make money, continue to produce? The important purpose of this question is to think more carefully about the role of property rights for a well-functioning market economy.
4.2 Where Do Prices Come From?
Price Signals from Combining Demand and Supply
Learning Objective
Explain how shortages and surpluses affect prices.
Main Point
Key Terms
When there are shortages, competition between buyers drives prices up. When there are surpluses, competition between sellers drives prices down.
Shortage, or excess demand quantity demanded exceeds quantity supplied
Surplus, or excess supply quantity supplied exceeds quantity demanded
Discussion or Homework Q& A
1. Q. Apu wants to set the market equilibrium price, so he surveys all three families on his street in order to determine how many cappuccinos per day they are willing to buy at different prices. He gives them four price options. Their answers can be summarized on the following table.
a. What is the market quantity demanded for each price? Fill in the table.
Apu also estimates his costs and determines how many iced cappuccinos he is willing to sell. Apu’s supply is summarized in the following table:
b. What is the market-clearing price? Explain.
c. If Apu sets the price higher than the market-clearing price, i) Will there be a shortage or surplus in the market? ii) Will there be pressure for the price to rise or fall? Explain.
d. If Apu sets the price lower than the market-clearing price, i) Will there be a shortage or surplus in the market? ii) Will there be pressure for the price to rise or fall? Explain.
More questions follow on the next page.
1. A. a. The market quantity demanded is in the middle column in the table below.
b. The market-clearing price is $2, since this is the price for which there is no shortage or surplus.
c. i) At any price higher than $2, quantity supplied is greater than quantity demanded, so there is a surplus. ii) Apu has excess inventory, which creates pressure for the price to fall, as he wants to get rid of his supplies before the milk goes sour.
d. i) At any price lower than $2, quantity supplied is less than quantity demanded, so there is a shortage. ii) There aren’t enough cappuccinos to satisfy demand, which creates pressure for the price to rise.
Customers bid up the price of the scarce cappuccinos, hoping that they will get one when someone else will not.
2. Q. Billions of dollars will be invested in energy-related projects across Alberta over the next 20 years, prompting Albertans to ask where the workers for these projects will come from. In 2007, the Alberta government warned that it is facing a shortfall of 100 000 workers, with at least 40 000 of those positions in the oil and gas sector. “It’s in the whole economy . . . whether it’s the Tim Hortons or a new restaurant that can’t find people to serve coffee and food because there’s not enough people to keep the restaurants or coffee shops open.”
a. A union proposal calls for 14.5-percent wage increases over two years, barely above Alberta’s nation-leading inflation rate of 6.5 percent per year. Explain why unions are asking for such high wage increases for their workers.
b. The skilled labour shortage is prompting many companies to look overseas for employees. If companies can hire many temporary foreign workers, how might this affect the wages that workers in Alberta receive?
A. a. In a shortage, workers are in scarce supply and have a bargaining advantage.
b. The use of temporary foreign workers reduces the size of the shortage in Canada, which lowers the price (wage) offered to workers.
4.2.1
4.2.2
4.2.3
Q. In your own words, define what a shortage is. Explain who competes and what happens to prices when there is a shortage.
A. A shortage is a situation of excess demand where quantity demanded exceeds quantity supplied. Shortages encourage competition among buyers, who bid against each other in attempting to get the scarce product or service and not be left empty-handed. Shortages create pressure for prices to rise.
Q. Old Navy decides to price a new line of jeans at $95, which covers all marginal opportunity costs as well as a healthy profit margin. If Old Navy has priced the jeans too high, what signals will the company receive? What actions might Old Navy take next?
A. If Old Navy has priced the jeans too high, the signals are unsold jeans sitting on shelves, or rising inventories in warehouses. This is a situation of a surplus, or excess supply. In response, Old Navy might cut prices, advertise more heavily, or offer other incentives (free t-shirt with purchase of jeans) to get customers to buy. Surpluses create pressure for prices to fall.
Q. Most provincial parks charge a fixed price for a camping permit, and allow you to reserve specific campsites in advance. By the time the summer holiday weekends arrive, all the permits are usually taken. There is excess demand but no price adjustment. Suggest a pricing system for provincial parks that allows them to take advantage of the higher demand for campsites on holiday weekends. Your system should explain who is competing and who is cooperating.
A. If all camping permits are taken, and you and others still want more, that is a situation of excess demand. Because the price is fixed, there is no price response to the shortage. Instead of bidding up prices, competition between consumers/campers for the scarce permits takes the form of trying to be the first in line to buy a permit as soon as permits go on sale for the next season. An alternative pricing system would set higher prices for holiday weekends than for other times. If campers voluntarily pay the prices set, there is cooperation between consumers/camper and the parks.
4.3 When Prices Sit Still: Market Clearing or Equilibrium Prices
Learning Objective
Identify how market-clearing or equilibrium prices equalize quantity demanded and quantity supplied.
Main Point
Key Terms
Market-clearing or equilibrium prices balance quantity demanded and quantity supplied, coordinating the smart choices of consumers and businesses.
Market-clearing price the price that equalizes quantity demanded and quantity supplied
Equilibrium price the price that balances forces of competition and cooperation, so that there is no tendency for change
Discussion or Homework Q&A
1. Q. The price set in a market is much more than a number. What functions does a price perform for the buyers and sellers? And what is so special about the “market-clearing price”?
A. The market price performs a communication function between buyers and sellers. A rise in price communicates to suppliers that more must be produced and brought to the market, while a fall in price communicates to the suppliers that they should produce less. The market-clearing price is the price at which no shortages or surpluses occur and no signals are sent to businesses and consumers to change their smart choices.
2. Q. Due to labour shortages, employers are allowed to hire temporary foreign workers (TFWs) once the employer proves the Canadian labour pool is exhausted. Between 1996 and 2005, the number of TFWs doubled in Canada. If the Government of Canada eliminates this program, what happens to the wages of Canadian workers who were previously competing with TFWs for jobs?
A. It reduces the available supply of TFWs and put upward pressure on the price (wage) offered to Canadian workers.
Refresh Q&A
4.3.1
Q. List and define the two other names for “prices that sit still”?
A. “Prices that sit still” are called both market-clearing prices and equilibrium prices. The market-clearing price is the price that equalizes quantity demanded and quantity supplied. At the market-clearing price, there are no frustrated buyers or sellers. There is a match for every buyer and seller, and all go home happy. The equilibrium price balances the forces of competition and cooperation, so that there is no tendency for change. The equilibrium price coordinates the smart choices of consumers and businesses — there is no incentive for anyone to change their own, self-interested, smart decisions.
4.3.2
4.3.3
Q. In an attempt to promote the social good of energy conservation, Toronto Hydro introduced the Peaksaver Program. Participating households received a $25 reward for allowing a “peaksaver” switch to be installed on their central air conditioners, which briefly turns off the air conditioner during peak demand times on hot summer days. Do you think the program would work without the $25 reward? Why or why not?
A. The Peaksaver energy-saving program would not work as well without the $25 reward to households who participate. With the Peaksaver switch installed, households will experience some discomfort from having their air conditioning turned off (even briefly) on hot summer days. To get households to agree to this discomfort, it helps to appeal to self-interest by paying households to participate. This is the principle behind the invisible hand — by acting in their own self-interest ($25), households also promote the good of society (environmental/ energy savings). If all households cared deeply enough about the environment to experience the discomfort of the Peaksaver Program without a reward, then the program would not be necessary.
Q. Explain the idea of Adam Smith’s “invisible hand.” Your explanation should illustrate the balance between the forces of competition and cooperation at “prices that sit still.” (I can’t give away the answer to question 1, can I?)
A. At market-clearing prices, smart choices are coordinated. The forces of competition (between consumers, and between businesses) are balanced with the forces of cooperation (voluntary, mutually beneficial exchanges between consumers and businesses). The key to this outcome is that price signals in markets create incentives so that while each person acts only in her own self-interest, the unintended consequence is the production of all the products and services we want.
4.4 Moving Targets: What Happens When Demand & Supply Changes?
Learning Objective
Identify how market-clearing or equilibrium prices equalize quantity demanded and quantity supplied.
Main Point
Key Term
When demand or supply change, equilibrium prices and quantities change. The price changes cause businesses and consumers to adjust their smart choices. Well-functioning markets supply the changed products and services demanded.
Comparative statics comparing two equilibrium outcomes to isolate the effect of changing one factor at a time
Discussion or Homework Q&A
1. Q. Rising housing prices in Alberta during the Oil boom lead some Albertans to move to Saskatchewan. Housing prices in Saskatchewan rose to record levels. Using a demand and supply framework, explain the higher prices in Saskatchewan’s housing market.
A. The demand for houses in Saskatchewan increased because more Albertans moved to Saskatchewan (more consumers in the Saskatchewan housing market). This increase in demand (rightward shift of the demand curve) puts upward pressure on housing prices in Saskatchewan if the supply of housing does not change.
2. Q. Suppose the Nudist Party wins the next federal election because all the clothed citizens forgot to vote. The Nudists pass a law making it illegal to produce clothes. The shift in party power causes a shift in preference away from buying clothes.
a. The cost of supplying clothes is now very high given that it is illegal to do so. Assuming that the demand for clothes reduces only slightly (in comparison), how would this affect the market price for clothes?
b. Suppose the police don’t enforce the law (where would officers pin their badges?). If the cost of supplying clothes is the same as before, what happens to the market price for clothes?
A. a. Now that the cost of producing/selling clothes is high, the supply of clothes decreases, causing rising clothing prices. Clothing prices fall slightly due to the comparatively smaller fall in demand, so the overall effect raises prices.
b. If the cost of supplying clothes is unchanged, the slight fall in demand causes falling prices.
Refresh Q&A
4.4.1
4.4.2
Q. What happens to the market-clearing price and quantity of a product or service when demand increases? When demand decreases? When supply increases? When supply decreases?
A. When demand increases (the demand curve shifts rightward), the market-clearing price rises, and the quantity supplied (and sold) increases. When demand decreases (the demand curve shifts leftward), the market-clearing price falls, and the quantity supplied (and sold) decreases. When supply increases (the supply curve shifts rightward), the market-clearing price falls, and the quantity demanded (and sold) increases. When supply decreases (the supply curve shifts leftward), the marketclearing price rises, and the quantity demanded (and sold) decreases.
Q. Predicting changes in market-clearing prices and quantities is harder when both demand and supply change at the same time. You run a halal butcher shop in Ottawa and expect an increase in the number of Muslims in Ottawa who prefer halal meant. Rents for retail space are also falling all over town. Predict what will happen to the market-clearing price for halal meat. Predict what will happen to the market-clearing quantity. Explain your predictions.
A. The increase in the number of Muslims in Ottawa causes an increase in the demand for halal meat (the demand curve shifts rightward). The falling rents, which are a fall in the price of an input, cause an increase in the supply of halal meat (the supply curve shifts rightward). These events have opposite effects on the price of halal meat. The increase in demand increases the price, but the increase in supply decreases the price. The net effect depends on the relative strength of the demand forces relative to the supply forces. It is not clear what will happen to the market-clearing price. However, there will clearly be an increase in the quantity sold. The increase in demand increases the quantity sold, and the increase in supply increases the quantity sold. The forces of demand and supply work in the same direction on the quantity sold.
More questions follow on the next page.
4.4.3
Q. In response to the business boom in Alberta, the city of Edmonton offered $200-per-month rent subsidies to lowincome families so they could afford to live and work in the city. If you were asked to advise the city on this policy, what would you tell them about the impact it will have on rents? Will rents go up or down? Explain your reasoning to the city officials.
A. The $200-per-month subsidy increases income, which causes an increase in demand for normal goods like housing (the demand for housing curve shifts rightward). In general, an increase in demand causes an increase in price, and rent is the price of rental housing. This was not the intention of the subsidy, which was designed to help low-income families afford the already expensive rents in Edmonton. Unless rents increase by $200 per month, the subsidies will help make housing more affordable as designed. But there could also be the unintended consequence of slightly higher rents.
4.5 Getting More Than You Bargained For: Consumer Surplus, Producer Surplus, and Efficiency
Learning Objective
Explain the efficiency of markets using the concepts of consumer surplus and producer surplus.
Main Point
Key Terms
An efficient market outcome has the largest total surplus, prices just cover all opportunity costs of production and consumers’ marginal benefit equals businesses’ marginal cost.
Consumer surplus
the difference between the amount a consumer is willing and able to pay, and the price actually paid. The area under the marginal benefit curve but above the market price.
Producer surplus the difference between the amount a producer is willing to accept, and the price actually received. The area below the market price but above the marginal cost curve.
Total surplus consumer surplus plus producer surplus
Deadweight loss the decrease is total surplus compared to an economically efficient outcome
Efficient market outcome coordinates smart choices of businesses and consumers so
• consumers buy only products and services where marginal benefit is greater than price
• product and services are produced at lowest cost, with prices just covering all opportunity costs of production
• at the quantity of an efficient market outcome, marginal benefit equals marginal cost (MB = MC)
Discussion or Homework Q&A
1. Q. The figure below shows the market for champagne. Note that the demand curve is also a marginal benefit curve, and the supply curve is also a marginal cost curve. Use this figure to answer questions 1 and 2.
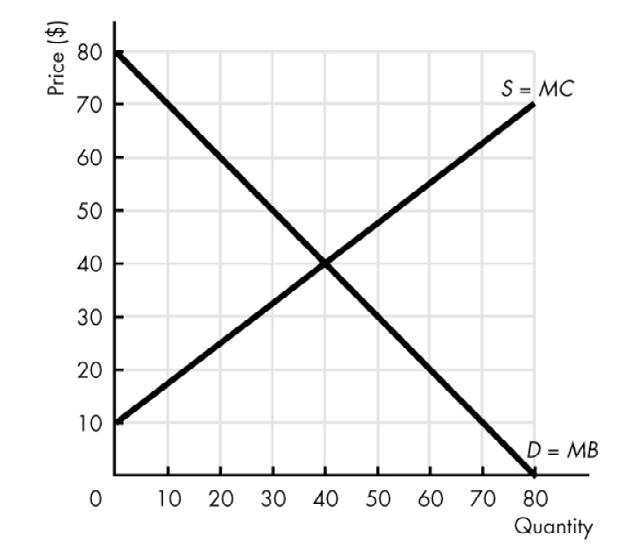
The champagne market is in equilibrium.
a. Calculate the consumer surplus.
b. Calculate the producer surplus.
c. What is the total surplus?
d. What is the condition for economic efficiency?
A. a. Consumer surplus is the triangular area under the demand curve but above the horizontal line at the market price of $40. The formula for the area of a triangle is 1/2(base)(altitude), so consumer surplus = 1/2(40)(40) = 800.
b. Producer surplus is the triangular area above the supply curve but below the horizontal line at the market price of $40. Producer surplus = 1/2(40)(30) = 600.
c. Total surplus, consumer surplus plus producer surplus, is 800 + 600 = 1,400.
d. Economic efficiency occurs when total surplus is largest. Is this outcome efficient? We can’t be sure if 1,400 is the largest total surplus until we compare total surplus in other situations in the champagne market.
More questions follow on the next page.
2. Q. Suppose now that that there is underproduction in the champagne market and output is restricted to 20 bottles.
a. Calculate the deadweight loss.
b. What is the total surplus?
c. How does total surplus compare to the answer in Question 1 above? Is the output of 20 bottles efficient?
A. a. Deadweight loss is the decrease in consumer surplus and producer surplus that results from an inefficient level of production. It equals the triangular area between the demand and supply curves from quantity = 20 to quantity = 40. Deadweight loss = 1/2(35)(20) = 350.
b. The new total surplus is the original amount of 1,400 minus the deadweight loss: 1,400 – 350 = 1,050.
c. Total surplus (1,050) is less than the equilibrium total surplus at an output of 40 bottles. Since an efficient output has the largest total surplus, the output of 20 bottles is not efficient.
Refresh Q&A
4.5.1
Q. “At the quantity of an efficient market outcome, marginal benefit equals marginal cost.” Explain this statement in your own words.
A. The best way to explain what happens at an efficient market outcome is to look at outcomes that are not efficient, and the forces that are set in motion to move the market towards an efficient outcome. As output increases, marginal benefit decreases and marginal cost increases. So at a quantity of output less than the efficient market outcome, marginal benefit is greater than marginal cost. That means there is some consumer willing and able to pay a price (marginal benefit) that is higher than the minimum price some business needs to receive (marginal cost) to be willing to supply that unit of output. There is a mutually beneficial trade. These trades, in the self-interest of consumers and businesses, will continue until output increases to the efficient market output.
At quantities greater than the efficient market outcome, marginal cost is greater than marginal benefit. There is no consumer willing to pay the minimum price a business needs to receive to be willing to supply any quantity greater than the quantity at the efficient market outcome. No mutually beneficial trades are possible.
4.5.2
4.5.3
Q. In the market for e-readers, at the prices of $40, $60, $80, $100 and $120, the following quantities are demanded: 2000, 1600, 1200, 800 and 600 units. The quantities supplied at those prices are: 400, 800, 1200, 1600 and 2000 units. Draw a graph of this market. For the 800th unit, what is the consumer surplus; what is the producer surplus?
A. Draw the graph. Here is the answer in words. Consumer and producer surpluses are both measured in relation to the market price. So the first task is to find the equilibrium price in this market. That price is $80 – the price where quantity demanded equals quantity supplied (1200 units). To find the consumer surplus of the 800th unit, take the difference between the price some consumer is willing and able to pay ($100) and the market price of $80. The consumer surplus of the 800th e-reader is $20. That is the vertical distance between the demand curve and the market price at quantity = 800.
To find the producer surplus of the 800th unit, take the difference between the market price ($80) and the $60 minimum price some business needs to receive to be willing to supply that unit. The producer surplus of the 800th unit is $20. That is the vertical distance between the market price and the supply curve at the quantity = 800.
Q. For the e-reader market above, explain the reduction in total surplus that happens if the quantity of output increases beyond the efficient market outcome.
A. Look at quantities beyond the efficient market outcome of 1200 units. For example, the most some consumer is willing and able to pay for the 1600th unit is $60. The minimum price some business needs to receive to be willing to supply the 1600th unit is $100. No mutually beneficial trade is possible. If trades did happen beyond the efficient market outcome of 1200 units, there would be deadweight loss from trades where marginal cost is greater than marginal benefit, and total surplus (the sum of consumer and producer surplus) decrease.
5 Just How Badly Do You Want It? Elasticity
Learning Objectives
1. Define and calculate elasticity of demand, and explain three factors that determine it.
2. Explain how the relationship between elasticity of demand and total revenue determines business pricing strategies.
3. Explain elasticity of supply and how it helps businesses avoid disappointed customers.
4. Define cross elasticity and income elasticity of demand, and explain how they measure substitutes and normal goods.
5. Use elasticity to explain who pays sales taxes and government tax choices.
Lecture Narrative
Once students understand the relationships between price, quantity demanded, and quantity supplied, elasticity explains by how much those quantities respond to changes in price. This chapter emphasizes the practical business and tax applications of elasticity, making it the second most important microeconomic concept after opportunity cost. The explanation of elasticity of demand focuses on responsiveness linked to the availability of substitutes, and especially on the relation between elasticity and total revenue. Elasticity is a crucial concept for making smart business pricing decisions, and provides the analysis behind the justification for putting products on sale – “will you make it up in volume?” For price elasticity of supply, the emphasis in on helping businesses accurately predict future output possibilities to avoid disappointing customers by not being able to deliver products.
Elasticity provides additional intuition and precision to concepts of substitutes and complements (cross elasticity of demand) and normal/inferior goods and necessities/luxuries (income elasticity of demand). For governments, elasticities of demand and supply determine tax incidence. While using extreme elasticities (zero and infinity) to show simple results, I emphasize the general relationships between elasticities and who pays more – buyers or sellers. Those elasticities also inform government choices about which products and services to tax to collect the most tax revenue.
Graphs, Tables and Illustrations
5.1
Key:
G - Graph(s)
For titles in blue, Narrated Dynamic Graph videos are available online on each Chapter Resources page.
I - Illustration
T - Table
Graphs follow on the next page.
Narrated Dynamic Graphs are identified with a blue video button. To access them, log into the Pearson course website (pearsonmylab.com), click on Chapter Resources, and then Chapter 5.
5.7
5.8
5.9
Top Choice
The Economics Out There article on p. 115 (based on the 4 September 2012 New York Times article, “When It Comes to Reservations, Time is Money” http://www.nytimes.com/2012/09/05/dining/restaurant-prices-can-vary-by-reservation-time. html) is a good discussion-starter about elasticity- based pricing, which is becoming more common in many service sectors. The CEO of Savored (now part of Groupon.com) said “The challenge that every single restaurant is faced with is the elasticity of demand from consumers.” “In an off-peak hour, you might get only a couple people who want to go to the restaurant, and in a peak hour you might get people out the door.” Restaurants “are leaving so much on the table.”
The elasticity factor ties to the chapter title of “How Badly Do You Want It?” More customers are keen on a 7 pm restaurant reservation than a 5 pm reservation, and are willing and able to pay more. The article contrasts a steakhouse in the financial district that is a popular lunch destination, with discounts for any dinnertime reservations.
Ask students whether they think this pricing is fair? Another question is to have students identify other examples of elasticitybased pricing. Students in big cities will likely mention Uber’s surge pricing. Besides having prices respond to elasticity, surge pricing equates quantities demanded with quantities supplied (surge pricing also attracts more drivers supplying rides).
Economic Experiments
Dynamic Study Modules
See the Market Experiment (http://media.pearsoncmg.com/aw/aw_myeconlab/experiments/instructor/expinstr.html)
This experiment is based on excise taxes. Students learn that transaction prices rise as a result of the excise tax. Fewer transactions occur in the taxed market than in the free market. As buyers and sellers interact in the taxed market, market forces determine a new, higher equilibrium price. As a result, both buyers and sellers share the burden of the tax.
The online Dynamic Study Modules (http://media.pearsoncmg.com/intl/pec/mylab/2016c/cohen2ce/micro/mmnd_html/ dynamic_study_modules.html) are created generically for any Canadian economics text. Modules students can work through with some (not all) content related to Chapter 5:
• Elasticity
Teaching Blog
Check out economicsforlife.ca for new media stories, related discussion questions, and other active learning ideas. All posts are tagged by textbook chapters and topics.
5.1 Measuring Your Responsiveness: Price Elasticity of Demand
Learning Objective
Elasticity measures how responsive quantity demanded is to a change in price.
Main Point
Key Terms
Define and calculate elasticity of demand, and explain three factors that determine it.
Elasticity (or price elasticity of demand) measures by how much quantity demanded responds to a change in price
Inelastic demand small response in quantity demanded when price rises
Elastic demand large response in quantity demanded when price rises
Perfectly inelastic demand price elasticity of demand equals zero; quantity demanded does not respond to a change in price
Perfectly elastic demand price elasticity of demand equals infinity; quantity demanded has an infinite response to a change in price
Discussion or Homework Q&A
1. Q. Is demand for the following products elastic or inelastic?
a. Pimple medication
b. Pencils
c. Clothes
d. Parasuco jeans
e. Newspaper
f. Toilet paper
A.
a. Elastic
b. Elastic
c. Inelastic
d. Elastic
e. Elastic
f. Inelastic
2. Q. If a union leader claims that “higher wages increase living standards without causing unemployment,” what is she assuming about the elasticity of demand for labour?
A. If a rise in wages (the price of labour) caused no change in the quantity of labour demanded, then the demand curve for labour is a vertical line – demand is perfectly inelastic.
Refresh Q&A
5.1.1
Q. Explain the relationship between price and quantity demanded for inelastic demand and for elastic demand.
A. For inelastic demand, when price rises there is a small response (decrease) in quantity demanded. The percentage change is quantity demanded is less than the percentage change in price. For elastic demand, when price rises there is a large response (decrease) in quantity demanded. The percentage change is quantity demanded is greater than the percentage change in price.
More refresh questions follow on the next page.
5.1.2
5.1.3
Q. A jewellery store cuts its prices on specialty watches by 20 percent, and finds that its quantity sold increases by 40 percent. Calculate the price elasticity of demand for its specialty watches. Is it elastic or inelastic?
A. Percentage change in quantity demanded
Price elasticity of demand = Percentage change in price
For this example of a jewellery store’s specialty watches, elasticity of demand is 40 percent
= 2
20 percent
Since the price elasticity of demand is greater than 1, this is elastic demand.
Q. In the women’s clothing market, which is likely to be more inelastic, demand for the latest fashions or demand for clothing in general? If you were the marketing manager of a women’s clothing chain, use your answer to explain to store managers why they should or should not exclude the latest arrivals in their upcoming sale.
A. Demand for the latest fashions is more inelastic than demand for clothing in general. Shoppers are willing to pay higher prices for the latest fashions, but will buy many older fashions if the price is right.
5.2 Will You Make It Up in Volume? Elasticity and Total Revenue
Main Point
Key Terms
Explain how the relationship between elasticity of demand and total revenue determines business pricing strategies.
Elasticity determines business pricing strategies to earn maximum total revenue – cut prices when demand is elastic and raise prices when demand is inelastic.
Total revenue all money a business receives from sales, equal to price per unit (P) multiplied by quantity sold (Q)
Discussion or Homework Q&A
1. Q. Using the midpoint formula for price elasticity of demand, explain why elasticity is not the same as slope.
A. One answer comes from the knowledge that slope is constant everywhere along a straight-line demand curve, while Figure 5.5 on p. 117 shows that elasticity gets smaller and smaller as you move down along a straight-line demand curve (from elastic, to unit elastic, to inelastic).
A more complete answer comes from the formula below, which is just a rearrangement of the midpoint formula on p. 111.
Change in quantity demanded
Change in price
Average price between points X
Average quantity demanded between points
The first fraction before the multiplication sign is simply the inverse of the slope. Since the slope is constant everywhere along a straight-line demand curve, so is the inverse of the slope. But what happens to the second fraction as we move down the demand curve? At the “top” of the demand curve, the average price between points is very large, while the average quantity demanded between points is very small, so the second fraction is large. As we move down the demand curve, the average price between points gets smaller and average quantity demanded between points gets larger, so the overall value of the second fraction gets smaller. The result is that the price elasticity of demand falls as we move down along the demand curve.
2. Q. Suppose a frost destroys a large part of the supply of grapefruits. Predict what will happen to price and revenue in the grapefruit market if the demand for grapefruits is elastic; if the demand for grapefruits is inelastic?
A. The frost is an environmental change that decreases the supply of grapefruits – the supply curve shifts leftward. If demand is elastic, we know that a rise in price decreases total revenue (think of the example of blue earbuds). If demand is inelastic, a rise in price increases total revenue (think of the example of insulin). Learning Objective
Refresh Q&A
5.2.1 Q. Explain the relationship between price cuts, elasticity, and total revenue.
A. Price cuts increase total revenue when demand is elastic. Price rises increase total revenue when demand is inelastic.
More refresh questions follow on the next page.
5.2.2
5.2.3
Q. In Figure 5.4, use the coordinates of point B as (P0, Q0) and the coordinates of point C as (P1, Q1). Use the midpoint formula for elasticity to show the calculation that results in the elasticity of 2.33. Now reverse the points, using point C as (P0, Q0) and point B as (P1, Q1) and redo the calculation. What is the difference between the two results?
A.
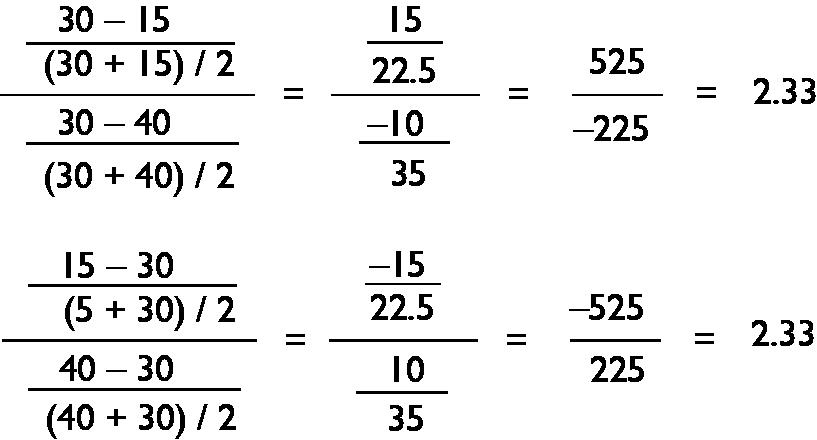
The only difference between the results is that the numerator is a negative number in the first calculation, and the denominator is a negative number is the second calculation. But because the calculation of price elasticity of demand ignores minus signs, the two numbers are the same.
Q. Concession stands at movie theatres charge high prices for popcorn, drinks, and other refreshments. This pricing strategy increases total revenue. What does that imply about the price elasticity of demand for refreshments in movie theatres? What theatre policy helps make this demand elastic or inelastic?
A. When higher prices increase total revenue it means the price elasticity of demand is inelastic (less than 1). Demand tends to be inelastic when there are fewer substitutes. Food and drinks from outside are substitutes for movie theatre refreshments. The policy at most theatres of not allowing food or drinks from outside reduces the number of substitutes and makes the demand for movie theatre refreshments more inelastic.
5.3 How Far Will You Jump for Money? Price Elasticity of Supply
Learning Objective
Explain elasticity of supply and how it helps businesses avoid disappointed customers.
Main Point
Key Terms
Elasticity of supply measures the responsiveness of quantity supplied to a change in price, and depends on the difficulty, expense, and time involved in increasing production.
Elasticity of supply measures by how much quantity supplied responds to a change in price
Inelastic supply small response in quantity supplied when price rises
Elastic supply large response in quantity supplied when price rises
Perfectly inelastic supply price elasticity of supply equals zero; quantity supplied does not respond to a change in price
Perfectly elastic supply price elasticity of supply equals infinity; quantity supplied has infinite response to a change in price
Discussion or Homework Q&A
1. Q. An unexpected fall heat wave makes consumers desperate to buy more air conditioners, but suppliers have none in stock. What factors might affect how quickly suppliers can restock their shelves? What does this have to do with the price elasticity of supply?
A. In this case, to produce air conditioners and bring them to the market is not easy; it involves long supply chains and the cooperation of many companies on wholesale and retail levels. Therefore, the price elasticity of supply of air conditioners is low.
2.
Q. List five things you personally supplied in your life for someone else’s consumption (e.g., summer jobs, blood donations, friendly advice, etc.) What were the most important considerations for you that affected your supply decision in each case?
A. Ideas from the class will differ but in each case focus on the elasticity of their supply. What factors influenced their decisions and how willing were they to supply the service.
Refresh Q&A
5.3.1
5.3.2
Q. In your own words, explain the relationship between price and quantity supplied for inelastic supply and for elastic supply.
A. For inelastic supply, when price rises there is a small response (increase) in quantity supplied. The percentage change is quantity supplied is less than the percentage change in price. For elastic supply, when price rises there is a large response (increase) in quantity supplied. The percentage change is quantity supplied is greater than the percentage change in price.
Q. If your boss offers you a 20-percent raise, and in response you work 10 percent more hours, how would you describe your price elasticity of labour supply? Are these smart choices for both of you? Explain your answer.
A. For this example, the elasticity of supply is ½ – less than 1 and is therefore inelastic supply. Reasons for the choices will differ but should refer to the responsiveness of the employee to the offers of the employer. If you voluntarily offer 10 percent more hours, you must think that the additional benefits of the money earned from those 10 hours is greater than the opportunity cost (your next best use) of those 10 hours of your time. If your boss was hoping for more or less hours in response to the 20-percent raise, it may not be a smart choice for her.
More refresh questions follow on the next page.
5.3.3
Q. Your business is about to launch an advertising campaign, announcing your new low prices. You hope the ads will bring in many more customers. Explain why you need to be concerned about your elasticity of supply.
A. If your business’s ad campaign is successful, you are about to have many more customers wanting to buy your product or service. How quickly can you increase your quantity supplied to meet the anticipated new demand? The answer depends on your elasticity of supply. Business supply is more elastic (it is easier to increase quantities) when additional inputs are easily available and when there is more time to adjust. By knowing your elasticity of supply, you can make more accurate projections about what quantities of output you are capable of supplying, at what prices, and when. This helps avoid disappointed new customers who might come to buy your product or service, but find you are sold out.
Can You Measure Substitutes? More Elasticities of Demand
Learning Objective
Define cross elasticity and income elasticity of demand and explain how they measure substitutes and normal goods.
Main Point
Key Terms
Elasticity measures explain the responsiveness of quantity demanded to changes in prices of related products and income, and the division of a tax between buyers and sellers.
Cross elasticity of demand measures the responsiveness of the demand for a product or service to a change in the price of a substitute or complement
Income elasticity of demand measures the responsiveness of the demand for a product or service to a change in income
Income inelastic demand for normal goods that are necessities, the percentage change in quantity is less than the percentage change in income
Income elastic demand for normal goods that are luxuries, the percentage change in quantity is greater than the percentage change in income
Discussion or Homework Q&A
1. Q. Suppose you lose your job and start receiving employment insurance. You income falls by 60 percent.
a. Your spending on grits increases by 20 percent. What kind of a good are grits? (Normal, inferior, necessity, luxury?)
b. Your spending on clothes decreases by 40 percent. What kind of a good are clothes? (Normal, inferior, necessity, luxury?)
A. a. The income elasticity of demand for grits is a positive 20 percent change in quantity divided by a negative 60 percent change in income, equals – 1/3. The negative sign means grits are an inferior good for you. b. The income elasticity of demand for clothes is a negative 40 percent change in quantity divided by a negative 60 percent change in income, equals + 2/3. The positive sign means clothes are a normal good. We can also classify normal goods as necessities or luxuries, depending on if the income elasticity of demand is less than one or greater than one. Clothes are a necessity because the income elasticity of demand, +2/3 , is less than one.
2. Q. In Chapter 4, we saw that the demand and supply model cannot predict what will happen to the equilibrium price when demand and supply both increase or both decrease, and cannot predict what will happened to the equilibrium quantity when demand and supply change in opposite directions. Explain how the cross elasticity of demand can improve those predictions.
A. The clear predictions of the demand and supply model in Ch 4 only depend on the direction (increase or decrease) of the shifts in the demand and supply curves. They do not depend on the size of the shifts. The predictions listed in the question do depend on the size of the shifts in the demand and supply curves, and cross elasticity of demand gives more precise information about the size of the shift of the demand curve. That information helps improve the prediction of the change in equilibrium price or quantity.
Refresh Q&A
5.4.1
Q. Choose two related products or services and use them to explain the simple formula for the cross elasticity of demand.
A. Answers will vary but should display an understanding whether the responsiveness of the quantity demanded of a product moves in a positive direction (for substitutes) or negative direction (for complements) to a change in price of a product that is a substitute or complement.
5.4.2
Q. What do you think the number would be (positive or negative? size?) for the cross-elasticity of demand of two products that seem totally unrelated to each other? Explain your answer.
A. If products are totally unrelated to each other, than a change in the price of one should have no impact on the decision to buy the other. The responsiveness in quantity demanded will be zero. When the value of the numerator of the formula for cross elasticity of demand is zero, then the entire fraction, and the cross elasticity of demand, is zero.
More refresh questions follow on the next page.
5.4.3
Q. Evidence suggests that babies are a normal good for lower income earners and an inferior good for higher income earners. Use the income elasticity of demand to explain what this means, using the definitions of “normal” and “inferior” goods.
A. Lower income earners respond to increases in income by having more children. So an increase in income causes an increase in “demand” for children, so more children are born. Higher income earners respond to increases in income by having fewer children. So an increase in income causes a decrease in “demand” for children, so fewer children are born. Lower income families are more likely to look at children as potential wage earners to support the family. Higher income families do not need as much extra income, and choose to spend more money investing in their children’s education and upbringing. With fewer children, they can better improve each child’s human capital, a concept coming in Chapter 12.
5.5 Who Pays the HST? Tax Incidence and Government Tax Choices
Learning Objective
Use elasticity to explain who pays sales taxes and government tax choices.
Main Point
Key Term
The more inelastic demand and supply are, the greater the tax revenue for government. For maximum revenue, governments try to tax products and services with inelastic demands and supplies.
Tax incidence
the division of a tax between buyers and sellers; depends on elasticities of demand and supply
Discussion or Homework Q&A
1. Q. The Ministry of Treasury want to put a $0.15 per unit excise (sales) tax on one of two products —comic books or dog biscuits. As a summer student at the Ministry, you are given an assignment by the Director of Taxes, Dr. More. You must choose the product that meets two objectives: (1) it will yield the greatest tax revenue and (2) the major burden of the tax will fall on consumers. Ministry researchers have estimated the supply and demand curves (without the tax) for each market. The comic book market is shown in the first graph and the dog biscuit market in the second graph.
1. For the comic book market:
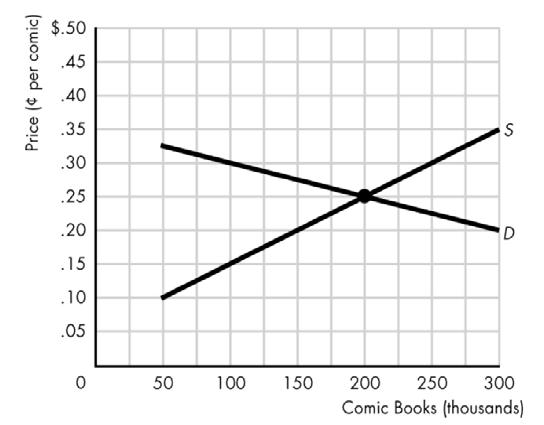
a. Shift the appropriate curve to reflect the tax and draw it on the graph. Label the curve either “S + tax” or “D + tax.” Identify the new equilibrium price and quantity. Compare the total expenditure in the original and new equilibriums.
b. Calculate the total tax revenue collected, and indicate it as an area on the graph.
c. How much of the tax is paid by consumers? by sellers?
A. a. See the graph below. In the comic book market, the supply curve shifts up vertically by an amount equal to the tax ($0.15). The original equilibrium price is $0.25 and quantity is 200,000. The new equilibrium price is $0.30 and quantity is 100,000. Total expenditure has decreased, from $50,000 ($0.25 × 200,000) to $30,000 ($0.30 × 100,000).
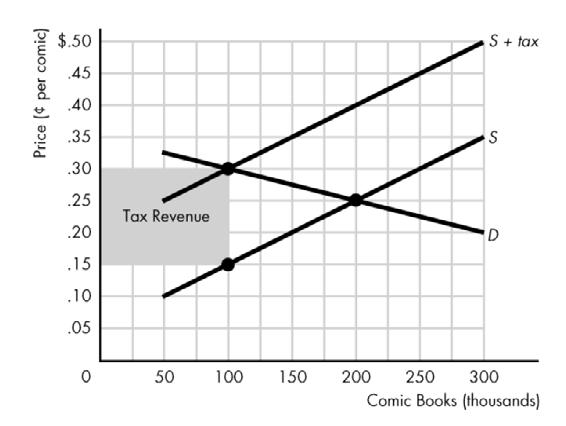
b. Total tax revenue is $0.15 per comic book × 100,000 units sold = $15,000 and is indicated by the shaded area on the graph above.
c. As a result of the tax, the price to consumers has gone up by $0.05 (from $0.25 to $0.30). Consumers’ share of the tax burden is $5,000 ($0.05 × 100,000). Sellers pay the $0.15 tax to government, but only get back $0.05 of it from consumers. Therefore, sellers’ share of the tax burden is $10,000 ($0.10 × 100,000).
More discussion/homework questions follow on the next page.
2. Q. Now perform the same analysis on the dog biscuit market.
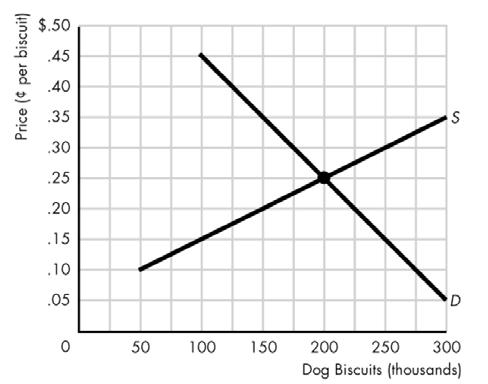
Shift the appropriate curve to reflect the tax and draw it on the graph. Label the curve either “S + tax” or “D + tax.” Identify the new equilibrium price and quantity. Compare the total expenditure in the original and new equilibriums.
a. Calculate the total tax revenue collected and indicate it as an area on the graph.
b. How much of the tax is paid by consumers? by sellers?
c. What is your recommendation to Dr. More? Explain.
A. a. See the graph below. In the dog biscuit market, the supply curve shifts up vertically by an amount equal to the tax ($0.15). The original equilibrium price is $0.25 and quantity is 200,000. The new equilibrium price is $0.35 and quantity is 150,000. Total expenditure has increased, from $50,000 ($0.25 × 200,000) to $52,500 ($0.35 × 150,000).
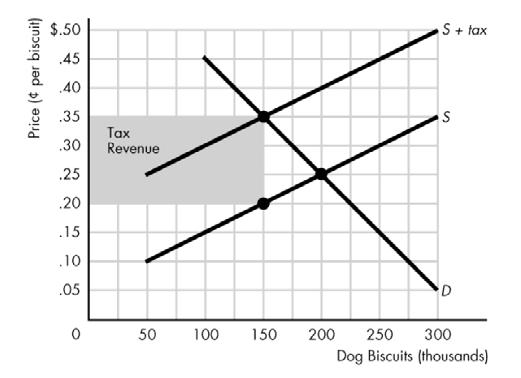
b. Total tax revenue is $0.15 per dog biscuit × 150,000 units sold = $22,500 and is indicated by the shaded area on the graph above.
c. As a result of the tax, the price to consumers has gone up by $0.10 (from $0.25 to $0.35). Consumers’ share of the tax burden is $15,000 ($0.10 × 150,000). Sellers pay the $0.15 tax to government, and get back $0.10 of it from consumers. Therefore, sellers’ share of the tax burden is $7,500 ($0.05 × 150,000).
d. You confidently recommend to Dr. More that the Ministry tax dog biscuits. An excise tax on dog biscuits meets both objectives: (1) it will raise more tax revenue than a tax on comic books ($22,500 versus $15,000) and (2) it will put more of the tax burden on consumers. In the dog biscuit market, consumers will pay $15,000, which is 67 percent of the tax burden. In the comic book market, consumers will pay only $5,000, which is 33 percent of the tax burden.
Refresh Q&A
5.5.1
Q. In your own words, explain the relationships between who pays a sales tax and elasticities of demand and supply.
A. Demanders or consumers pay more of a sales tax when demand is inelastic. With inelastic demand, quantity demanded is less responsive to an increase in price (caused by the tax), so it is easier for suppliers to pass on their higher costs (from the tax). Suppliers or businesses pay more of a sales tax when supply is inelastic. With inelastic supply, quantity supplied is less responsive to an increase in price (caused by the tax) so in order to continue to supply close to the same quantities as before, suppliers absorb the tax to keep sales from decreasing.
5.5.2
5.5.3
Q. Governments use sales taxes both to collect revenue and to change behaviour. If cigarette taxes are intended to discourage smoking rather than raise revenue, what elasticities of supply and demand for cigarettes will help governments achieve this policy objective? How do those elasticities compare to the elasticities that give government the most tax revenue?
A. The largest decreases in smoking will happen if supply is very elastic and demand is very inelastic. Elastic supply means that buyers pay more of the tax in the form of higher prices. And elastic demand means buyer respond strongly to higher prices by decreasing quantity demand even more.
Q. Governments could collect sales taxes from sellers or from buyers. Explain why governments collect almost all sales taxes from sellers.
A. The simple answer is that it is easier and less costly to collect from sellers because there are many fewer sellers than buyers. Sellers must report sales on their tax returns, so it is relatively easy to determine the taxes owed. Buyers do not have to report which products and services they buy, so there is no reliable way for governments to determine how much tax each consumer owes.
6 What Gives When Prices Don’t? Government Policy Choices
Learning Objectives
1. Explain how government-fixed prices cause quantities to adjust and market coordination to fail.
2. Describe price ceilings and explain the unintended consequences of government rent-control policies.
3. Describe price floors and explain the unintended consequences of government minimum wage laws.
4. Explain government policy trade-offs between efficient and equitable outcomes.
5. Describe two equity concepts and how to use positive economic thinking to achieve a normative policy goal.
Lecture Narrative
It is important for students to understand the unintended consequences of government price-fixing policies — quantities adjust instead. This chapter first examines the problems caused by rent controls, and offers more effective policies to help the homeless. Minimum wage laws are next, which can yield unemployment as a quantity adjustment. I discuss debates about the effectiveness of minimum/living wage laws and show that the impact on employment depends on the elasticity of demand for labour. The message is that to have an informed political viewpoint about living wage laws you need to understand elasticity of demand.
The final sections examine efficiency/equity trade-offs, to show that policies that hamper price adjustments and cause inefficiencies may still be justified on equity grounds. I compare health care in the U.S. and Canada, and discuss the difference between an efficient market outcome (when many cannot afford health care) and an equitable outcome (where there are waiting lists due to lack of price adjustments). After repeating the the positive/normative distinction for understanding which policy choices can be decided by empirical evidence, and which require values, I present the two most common value-based definitions of equity – equal outcomes and equal opportunities. I show sympathetically the two sides of the politics of equity. The political left emphasizes equal outcomes and prioritizing equity over efficiency. The political right emphasizes equal opportunities and prioritizing efficiency over equity. The emphasis is on helping students as citizens make informed policy choices between these positions.
Graphs, Tables and Illustrations
Figure Title
6.1 Market for Gasoline with Shortage
6.2 Market for Gasoline with Surplus
6.3 Market for Two-Bedroom Apartments
a) Market for Two-Bedroom Apartments
b) Market for Two-Bedroom Apartments with Rent Controls
6.4 Market for Unskilled Labour
a) Market for Unskilled Labour
b) Market for Unskilled Labour with a Minimum Wage
Key:
G - Graph(s)
For titles in blue, Narrated Dynamic Graph videos are available online on each Chapter Resources page.
I - Illustration
T - Table
Graphs follow on the next page.
Narrated Dynamic Graphs are identified with a blue video button. To access them, log into the Pearson course website (pearsonmylab.com), click on Chapter Resources, and then Chapter 6.
Active Learning Suggestions
Top Choice
There is a 20 October 2014 Toronto Star article, “Minimum wage hike does not kill jobs: report” (http://www.thestar.com/ business/2014/10/20/minimum_wage_hike_does_not_kill_jobs_report.html), that is rich for discussing both sides of the minimum wage debate. The article presents a Unifor (the largest public sector union in Canada) report that there is no evidence that minimum wages laws have any impact on employment – negative or positive. The article also reports a study by the Canadian Federation of Independent Businesses estimating that a 10 per cent increase in the minimum wage costs 321,300 jobs nationally. This contrast allows discussion of how different studies get different results – the importance of assumptions in model-building. One crucial assumption in the Unifor study was including the impact of higher incomes on demand for local businesses employing minimum wage workers. “If people have money in their pocket, they’re more likely to eat in a restaurant. That’s the piece of the puzzle that is often ignored in the more simplistic discussions [models] about the effect of the minimum wage on employment.” This ties to the stress in the macroeconomics chapters about the importance of looking at connections between input markets and output market – the differences between general equilibrium and partial equilibrium models/analyses. These issues add richness to the textbook emphasis on the importance of elasticity of demand for labour for determining the unemployment impact of higher minimum wages.
Economic Experiments
Dynamic Study Modules
Teaching Blog
See the Market Experiment (http://media.pearsoncmg.com/aw/aw_myeconlab/experiments/instructor/expinstr.html)
Students learn that a price ceiling tends to benefit buyers, while a price floor tends to benefit sellers. Students see first hand that in a market with a price control there are less transactions than in a free market.
The online Dynamic Study Modules (http://media.pearsoncmg.com/intl/pec/mylab/2016c/cohen2ce/micro/mmnd_html/ dynamic_study_modules.html) are created generically for any Canadian economics text. Modules students can work through with some (not all) content related to Chapter 6:
• Government Intervention into Markets
• Earnings and Discrimination
• Income Inequality and Poverty
• Efficiency
Check out economicsforlife.ca for new media stories, related discussion questions, and other active learning ideas. All posts are tagged by textbook chapters and topics.
6.1 Do Prices or Quantities Adjust? Unintended Consequences of Government Policies
Learning Objective
Explain how government-fixed prices cause quantities to adjust and market coordination to fail.
Main Point
When government fixes prices, the smart choices of consumers and businesses are not coordinated. Quantities adjust to whichever is less — quantity supplied or quantity demanded.
Discussion or Homework Q&A
1.
Q. When the government fixes prices below equilibrium, quantity supplied does not equal quantity demanded. Explain why quantity adjusts to whichever is less – quantity supplied or quantity demanded – instead of to whichever is more.
A. If the price is fixed below the equilibrium price, quantity demanded is greater than quantity supplied. Governments can’t legally force business to supply more at that price, so the quantity supplied, which is less than quantity demanded, is all that is sold in the market. That is why shortages continue and consumers are frustrated.
2. Q. When the government fixes prices above equilibrium, quantity supplied does not equal quantity demanded. Explain why quantity adjusts to whichever is less – quantity supplied or quantity demanded – instead of to whichever is more.
A. If the price is fixed above the equilibrium price, quantity supplied is greater than quantity demanded. Governments can’t legally force consumers to buy more at that price, so the quantity demanded, which is less than quantity supplied, is all that is sold in the market. That is why surpluses continue and businesses are frustrated.
Refresh Q&A
6.1.1
6.1.2
Q. If government makes it illegal for businesses to lower their prices, and there is a surplus of products and services in the market, explain how consumers and businesses will react.
A. If there is a surplus (quantity supplied is greater than quantity demanded) and prices cannot adjust, the price will be above the market-clearing price. Consumers will not buy as much as businesses produce, and inventories will pile up. The quantity sold is equal to the quantity demanded only. Businesses will decrease production so that quantities will adjust instead of prices. Government or businesses cannot force consumers to buy at the higher-than-equilibrium fixed price.
Q. You own a flower shop and usually sell roses for $25 a dozen. In the month before Valentine’s Day, your suppliers charge you a higher price for roses. A politician, who has many romantics in his riding, gets Parliament to pass a private member’s bill making it illegal to charge more than $25 for a dozen roses. Other flower prices are not fixed. What will be your smart business choice for Valentine’s Day?
A. Prices for roses usually rise before February because of increased demand due to increased preferences for roses. Suppliers may have increasing opportunity costs for delivering a much greater quantity of roses during that month, or they may simply be taking advantage of the strong demand and increased willingness to pay. As a flower shop owner, those higher prices are part of your costs. If the government fixes the retail price of roses, you will not be able to earn as much profit on roses (you will have higher costs but a fixed price). Your smart choice is to point customers to other flowers and plants as alternatives, where your costs would be lower but you might still be able to charge higher prices and make higher profits. Your supply of roses decreases (supply curve of roses shifts leftward), and your supply of other flowers increases (supply curve shifts rightward). Consumers might initially be happy with the $25 price for roses, but with reduced supply by other businesses (who would think like you), roses quickly sell out and rose-seeking customers are disappointed. Consumers looking for roses but not finding them would be willing to pay more for alternative flowers.
6.1.3 Q. Tim Hortons charges the same price for coffee no matter what time of day it is. At your local Tims, there are times of the day you walk right up to the counter and order, and other times when you have to wait in line. Explain how quantities supplied and quantities demanded are being coordinated. If you were the CEO of Tims, would you change Tims’s fixedpricing policy? Explain your answer.
A. Once Tim Horton’s sets the price of coffee, price cannot adjust to daily imbalances between the quantities of coffee demanded and supplied. The line-ups at busy times of the day are quantity adjustments. Quantity supplied does not keep up with quantity demanded. If you are a loyal enough Tim’s customer, you will wait your turn. Other customers might get frustrated and buy from a competitor like Coffee Time, Second Cup, or Starbucks. This is another example of a quantity adjustment.
6.2 Do Rent Controls Help the Homeless? Price Ceilings
Learning Objective
Describe price ceilings and explain the unintended consequences of government rent-control policies.
Main Point
Key Term
Rent controls fix rents below market-clearing levels, and quantity adjustment takes the unintended form of apartment shortages.
Rent controls (example of a price ceiling) maximum price set by government, making it illegal to charge higher price
Discussion or Homework Q&A
1. Q. Explain whether or not the following groups will be negatively affected by rent controls.
a. Poor individuals/families
b. Those who occupy rental units when rent controls are imposed
c. Private construction companies and workers in private construction companies
A. a. Poor individuals or households will likely be worse off because rent controls restrict the supply of affordable housing.
b. These are the individuals who truly benefit from rent controls because their rental prices won’t increase with rent ceilings. However, the quality of these units will likely deteriorate because landlords have no incentive to improve or update them.
c. These individuals will likely suffer because tenants lack the incentive to move to new housing or home ownership and landlords lack the incentive to request repairs or build new apartment buildings— business will be slow!
2. Q. Alternative polices to rent control for affordable housing are government housing (which only low-income persons can qualify for) and cash that can be used only for housing (“housing vouchers”).
a. Which policy affects the demand side of the housing market, and which affects the supply side?
b. A housing voucher increases tenants’ ability to pay for rental housing. How would it affect the incentive of builders’ supply of new rental accommodation?
c. In your opinion, should government improve the housing situation in Canada by concentrating more on increasing the supply of affordable housing or by improving the purchasing power of low-income households?
A. a. Government housing is a supply-side initiative; housing vouchers is a demand-side initiative.
b. A housing voucher would increase the incentive of builders to supply new units because demand would increase after the policy from increasing ability to pay.
c. Open ended.
Refresh Q&A
6.2.1 Q. In your own words, define rent controls.
A. Rent controls are a price ceiling — a maximum price set by government, making it illegal to charge a higher rent.
6.2.2 Q. Explain the unintended consequences of rent controls for the choices of tenants and of landlords.
A. There are two unintended and undesirable consequences of rent controls. First, rent controls reduce the quantity of housing supplied, so that shortages of housing develop (quantity demanded greater than quantity supplied). This shortage gives landlords the upper hand in dealing with tenants. Landlords may allow the physical condition of their properties to deteriorate, since they can be sure of finding tenants. Spending less on maintenance improves their profits in the short run. Landlords may also charge a potential tenant “key money,” which is a polite term for a bribe, in exchange for giving that tenant (as opposed to the many other willing tenants) the key to the scarce apartment. Landlords are also in a position to discriminate against renting to tenants they don’t like or on the basis of race or religion.
Second, rent controls subsidize well-off tenants who are willing and able to pay market-clearing rents.
More refresh questions follow on the next page.
6.2.3
Q. Many people argue that education, like housing, is an essential service that should be affordable — perhaps even free — for all citizens. Describe a set of policies that accomplishes the goal of education affordability for all, but avoids the problems of price controls that you have learned about in this section.
A. If the price of tuition is limited (even to zero!) by government, that is a price ceiling that creates shortages, just like rent controls. Since price (tuition) cannot adjust, quantities will. Post-secondary schools will restrict the number of students they admit. The post-secondary equivalent of landlords allowing properties to deteriorate is class sizes rising, reducing the quality of the education students receive. Another unintended consequence of low, universal tuition is that it subsidizes well-off students who can afford to pay more for the benefits they receive from education (we will discuss those benefits in more detail in Chapter 12). Schools do not receive that higher revenue from private individuals, so general taxes must be higher to pay the operating expenses of providing educational services. Other policies that might better provide a supply of affordable education would include higher tuition, with better needs-based financial aid, and subsidies to post-secondary schools, discussed in Chapter 12.
6.3 Do Minimum Wages Help the Working Poor? Price Floors
Learning Objective
Describe price floors and explain the unintended consequences of government minimum wage laws.
Main Point
Key Terms
Minimum wage laws fix wages above market-clearing levels, and quantity adjustment takes the unintended form of unemployment.
Minimum wage laws
minimum price set by government, making it illegal to pay a lower price. (example of price floor)
Living wage estimated at $20 per hour, enough to allow an individual in a Canadian city to live above the poverty line.
Discussion or Homework Q&A
1. Q. In one minimum wage study, “Job loss was minimal when higher wages were forced on businesses. About 97 per cent of all minimum wage workers were better off when wages went up.” Part of the reason why most minimum wage workers benefit is because of a small reduction in hours worked.
a. What would you say if your employer asked if you were willing to work one fewer hour per week in return for a 10-percent hourly wage increase?
b. If your employer asked you this same question near exam time, would you be more or less likely to say yes? What does this imply about your labour supply responsiveness (elasticity of supply) to a change in wage?
c. Are there any reasons to believe that increasing minimum wages could actually benefit businesses?
A. a. Responses may vary, but the concept of the value placed on the time given up should play a major part in the decisionmaking. How valuable is your time?
b. You should be more likely to reduce hours in exchange for an hourly wage increase during exam time. This suggests that your labour supply is more elastic (more responsive) to a change in the wage during exam time because for the same changes in wage you would be willing to reduce your hours more.
c. Yes. A worker with a higher wage is a happier worker, which could turn into increased productivity and less employee turnover (which would lower business costs).
2. Q. Some have argued that an increase in the minimum wage, because it affects all employers equally, will not increase unemployment. The Canadian Centre for Policy Alternatives argues that “in the real world it doesn’t work out that way.” The dry-cleaning industry, with many low-wage workers, is an example: “You raise the minimum wage and the cost of dry cleaning will go up slightly. But all of the dry cleaning companies across Ontario are going to have their cost structures changing in exactly the same way. And the last time I checked, people don’t take their laundry to Buffalo to get it cleaned.”
a. What is the simplest way for businesses to adjust to the rising costs, assuming that the economy is doing well and individuals are not cutting back on their spending on laundry?
b. Some businesses may not be able to afford to pay their workers the new minimum wage. List solutions (other than laying off current workers) that the laundry business could consider in response to the minimum wage.
A. a. Pass cost increases to consumers through higher prices.
b. The business could adjust by substituting away from workers altogether (by using automated machinery or automated checkout), or by substituting away from low-skilled (and toward higher-skilled) labour, reducing output, shutting down, moving their business to a different location, or cutting back on non-wage benefits (for example, extra health and dental benefits).
Refresh Q&A
6.3.1
Q. Explain what a “living wage” is and how it works as a price floor.
A. A “living wage,” estimated to be $20 per hour, is high enough to allow an individual in a Canadian city to live above the poverty line. A living wage is an example of a minimum wage, which is a price floor — a minimum price set by government, making it illegal for employers to pay a lower wage (the price of labour services).
More refresh questions follow on the next page.
6.3.2
6.3.3
Q. Explain how a rise in the minimum wage affects job losses when the demand for labour is inelastic, and when the demand for labour is elastic.
A. A rise in the minimum wage — the price of labour services — decreases businesses’ quantity demanded of labour. If the demand for labour is inelastic, then the rise in the wage will produce a small response of decreased quantity demanded of labour — a small increase in unemployment. If the demand for labour is elastic, then the rise in the wage will produce a large response of decreased quantity demanded of labour — a large increase in unemployment.
Q. A new government policy is being considered to raise the minimum wage. If you were a lobbyist supporting this policy, what argument would you make? What data would you include? If you were a lobbyist for business and against this policy, what argument would you make? What data would you provide to support your position?
A. For a “living wage” policy to help the working poor, the gains for workers who remain employed (and whose incomes go up) must be greater than the loss of incomes for workers who lose their jobs because of decreased quantity demanded of labour. The policy will help the working poor when the demand for labour is inelastic. The data that would support the argument for a living wage would have to show that for any percentage rise in the wage, the percentage decrease in the quantity demanded of labour will be less.
If you ran a business, you might oppose an increase in the minimum wage because it increases your costs. But to make an argument against a living wage that is not based on your personal self-interest, but based on what is best for society, you would need data showing that the gains for workers who remain employed (and whose incomes go up) would be less than the loss of incomes for workers who lose their jobs because of decreased quantity demanded of labour. In other words, the data should show that the demand for labour is elastic — for any percentage rise in the wage, the percentage decrease in the quantity demanded of labour will be greater.
6.4 When Markets Work Well, Are They Fair? Trade-Offs between Efficiency and Equity
Learning Objective
Explain government policy trade-offs between efficient and equitable outcomes.
Main Point
Key Term
Well-functioning markets are efficient, but not always equitable. Government may smartly choose policies that create more equitable outcomes, even though the trade-off is less efficiency.
Efficient market outcome coordinates smart choices of businesses and consumers so outputs are produced at lowest cost (prices just cover all opportunity costs of production), and consumers buy products and services providing the most bang per buck (marginal benefit greater than price)
1. Q. The health care system in Canada provides free coverage for medically necessary care for all Canadians. Canadians and Americans often debate which health care system is better.
a. If the government did not participate in the market for health care services, what would be the equity issue?
b. Since health care patients (consumers) in Canada do not pay user fees for medically necessary services, do you think that the number of doctor and hospital visits is efficient? Why or why not?
c. How would shortages be eliminated in the U.S. health care system if it resembles a private health care market?
d. What is the efficiency–equity trade-off in the Canadian health care system?
A. a. Those able to pay for health care services would receive them, but those unable to pay the market-clearing price — despite how willing or how much in need of care — would not receive medical care.
b. The number of visits to the doctor and hospital would be higher than the efficient number because patients face a price of zero in Canada, so they are more likely to visit the doctor or hospital than if doing so had a financial cost.
c. With shortages, prices would rise, quantities demanded would decrease while quantities supplied would increase, and waiting lists would disappear.
d. The Canadian-style outcome is more equitable, but at the cost of being less efficient.
2. Q. One policy cost that we have not explored in this chapter is the cost of not helping the homeless or the working poor. These costs of inaction may come in the form of higher crime rates and higher health care costs. Is reducing homelessness a smart choice economically? The British Columbia government found that while it costs money to house the homeless, doing so is cheaper than the indirect costs of neglect — paid for through the criminal justice system, expensive visits to emergency rooms, and other social services. If housing the homeless is actually cheaper than the indirect costs of not housing the homeless, should we definitely do it?
A. Not necessarily. We would have to consider the opportunity costs because there may be alternative uses that represent even greater cost savings (for example, actions to reduce child poverty). If there are not alternatives with greater cost savings, the benefits of housing the homeless outweigh the costs (assuming the report is accurate) and it would be a smart choice. Discussion or Homework Q&A
6.4.1 Q. In your own words, describe what an “efficient market outcome” means for businesses and for consumers.
A. An efficient market outcome coordinates the smart choices of businesses and consumers. For businesses, an efficient market outcome means that outputs are produced at lowest costs, and prices just cover all opportunity costs of production. For consumers, an efficient market outcome means buying the products and services providing the most bang per buck, where marginal benefit is greater than price. Products and services go to those most willing and able to pay.
More refresh questions follow on the next page.
6.4.2
6.4.3
Q. What are the trade-offs between efficiency and equity in comparing a private market for health-care services with government provision of health-care services?
A. In comparing a private market for health-care services with government provision of health-care services, there are tradeoffs between efficiency and equity. The private market outcome might be more efficient, but less equitable. The government provision outcome might be less efficient, but more equitable.
Q. If you had to choose between a health-care system run by the market or run by government, which would you prefer? Explain the reasoning behind your choice. What changes in your life might make you change your choice?
A. There is no right answer to the question of which kind of health-care system you prefer. There are trade-offs to any system, and your preference will depend on how you value the trade-offs. For example, you may value the accessibility and affordability of the government system so much that you are willing to put up with waiting lists for medical procedures and shortages of doctors and hospital beds. Or, when you are very ill, you may want the option of paying more to get priority medical care that is available with a private market system. From a strictly personal point of view, the greater your income, the more likely the private market system will appeal to you, as you can take advantage of its benefits. The smaller your income, the more likely the government system will appeal to you, as you get the benefit of health-care services you might not be able to afford under the private market system. A change in what you can afford to pay for has a major impact on your choice of health-care system. You will also have opinions as a citizen, thinking about what is best all around. What is important in debating health care is not the “side” you take, but using sound, smart arguments that recognize the trade-offs.
6.5 Choosing between Efficiency and Equity: What Economics Can and Cannot Do for You
Learning Objective
Explain government policy trade-offs between efficient and equitable outcomes.
Main Point
Once you choose to support a political position or social goal based on your values, positive economic thinking helps identify the smartest choices to efficiently achieve that goal.
Discussion or Homework Q&A
1. Q. Many question whether the market can provide affordable housing for those most in need. What are the equity concerns with allowing the market to provide rental housing to Canadians?
a. What does a rent ceiling do, and how is it intended to increase equity?
b. Why does a government-imposed rent ceiling reduce efficiency in the rental housing market?
c. What is the unintended consequence?
A. If the price of rental housing in Canada was determined only by willingness and ability to pay, anyone who could not afford the market-clearing price would not be able to afford a place to live. Although the market functions very well for those above a certain income level, if you are poor, the housing market does little to address your needs. It has been argued that shelter is a human right that is necessary for survival and should be provided if individuals don’t have the ability to pay.
a. Rent ceilings limit how high prices for rental housing can rise, which prevents landlords from increasing rents to market values. Rent ceilings are intended to (i) increase the amount of money poor households have available for other necessities and luxuries; and (ii) reduce the likelihood that poor households will become homeless.
b. Inefficiencies (uncoordinated demand and supply) such as shortages occur because (i) with rent prices less than their market value landlords don’t have as much incentive to increase the quantity of apartments; and (ii) tenants who are willing and able to pay more do not because of the maximum price.
c. Since the quantity of housing supplied is less than it would be at the market-clearing rent, there will be fewer apartments available, and those who cannot find rental housing as a result of the rent ceiling —many of whom are those the policy was intended to help — will be worse off.
2. Q. There have been recent increases in family income inequality.
a. The Canadian Centre for Policy Alternatives argues that raising the minimum wage is a useful tool to create greater social justice in the distribution of income because it decreases family income inequality. Explain how increasing the minimum wage to a level that is above the poverty line would decrease family income inequality.
b. Business groups such as the Canadian Federation of Independent Businesses argue that raising the minimum wage causes upward pressure on the entire wage structure. Think of the worker working for $10 an hour who then suddenly sees co-workers who were previously making less get a raise to $10. Explain why business groups think that raising the minimum wage may have no impact on reducing family income inequality.
c. Poor families received 28 percent of the additional earnings from a 35-percent increase in the Ontario minimum wage, but individuals from rich families received an even higher share (31 percent) of the additional earnings. Why would individuals in rich families benefit from a policy that increases wages only for those earning minimum wages?
A. a. Many minimum wage workers are in low-income families. Raising the minimum wage can reduce wage inequality by moving low-wage workers up the wage distribution.
b. Businesses would feel pressured to increase wage for the others too, which could result in no improvement in income inequality or equity.
c. Some minimum wage workers do not live in poor families — think of the typical student living at home.
Refresh questions follow on the next page.
6.5.1
Q. Explain the difference between a positive statement and a normative statement. Give an example of each.
A. Positive (or empirical) statements are about what is. Positive statements can be evaluated as true or false by checking the facts. Normative statements are about what you believe should be. Normative statements involve value judgments and cannot be evaluated as true or false by checking the facts.
6.5.2
6.5.3
Q. Pick a political party in Canada. Based on the policy statements on the party’s website, how would you describe its positions on issues of efficiency versus equity?
A. Answers will differ depending on the political party (Liberal, Conservative, NDP, Green, …).
Q. Arguments often end with someone saying, “Everyone is entitled to an opinion.” Does that mean that all opinions are equally valid? (The positive/normative distinction can help answer this question.)
A. While everyone is entitled to an opinion about normative statements, opinions about a positive statement like “water freezes at zero degrees centigrade” or “the earth is flat” are not all equally valid. Positive statements can be tested and evaluated as true or false by comparing them with empirical data in the real world. If you continue to believe in a positive statement that has been shown to be false, that opinion does not have the same validity as a positive statement that has been shown to be true.
7 Finding the Bottom Line Opportunity Costs, Economic Profits and Losses, and the Miracle of Markets
Learning Objectives
1. Describe accounting profits, and explain how they miss hidden opportunity costs.
2. Define normal profits and economic profits, and explain their differences.
3. Explain how economic profits signal smart business decisions and coordinate consumer and business choices.
Lecture Narrative
Economic profits are the main goal of a business’s bottom line, as well as the key signal directing markets and the invisible hand. This short chapter develops the distinction between accounting profits and economic profits using a small business example. I then show what the accountants miss — the opportunity costs of your time and money — and develop the economist’s conceptions of normal profits and economic profits. This is the first application of the importance of Key 3 — count implicit costs. The final section illustrates how economic profits direct the invisible hand, using three scenarios of economic loss, breakeven, and economic profits as signals for smart business decisions to exit, continue in, or enter an industry. Those scenarios introduce the distinction between short-run market equilibrium (with economic profits or losses) and long-run market equilibrium (with zero economic profits and no tendency for change).
Graphs, Tables and Illustrations
a) Economic Losses and Decreased Supply Lead to Long-Run Market Equilibrium
b) Economics Profits and Increased Supply Lead to Long-Run Market Equilibrium
Key:
G - Graph(s)
For titles in blue, Narrated Dynamic Graph videos are available online on each Chapter Resources page. To access them, log into the Pearson course website (pearsonmylab.com), click on Chapter Resources, and then Chapter 7.
I - Illustration
T - Table
7.4a
Active Learning Suggestions
Top Choice
Getting students to fully understand the three alternative profit scenarios for Wahid’s Web Wonders business in Figure 7.3 on p. 174 is your most important teaching and learning objective. Spend class time probing with questions their understanding of each scenario. Figure 7.3 highlights the unimportance of accounting profits as a market signal, in that all three scenarios have positive accounting profits, yet each scenario has different implications for a business’s smart choices to exit, enter, or continue in an industry. The stoplight metaphor (red, green, yellow) will help students remember the different choices.
Another aspect of the alternative profit scenarios that challenges students is that normal profits are the same for all scenarios, and are best defined here as average profits in other industries – what the business owner must earn to do as well as the best alternative use of his time and money. The $46 000 amount for hidden opportunity costs is given by the $38 000 Wahid could have earned in another job, and the $8000 return on his $40 000 investment. That $8000 includes the interest he could have earned in the bank ($2000 at 5% interest) plus his personal risk compensation of $6000 (15% of $40 000). To do as well as he could in another industry, Wahid’s revenues must cover both his total obvious costs and his hidden opportunity costs.
Dynamic Study Modules
The online Dynamic Study Modules (http://media.pearsoncmg.com/intl/pec/mylab/2016c/cohen2ce/micro/mmnd_html/ dynamic_study_modules.html) are created generically for any Canadian economics text. Modules students can work through with some (not all) content related to Chapter 7:
• The Nature of Firms
• Making a Decision
Teaching Blog Check out economicsforlife.ca for new media stories, related discussion questions, and other active learning ideas. All posts are tagged by textbook chapters and topics.
7.1 What Accountants Miss: Accounting Profits and Hidden Opportunity Costs
Learning Objective
Describe accounting profits, and explain how they miss hidden opportunity costs.
Key Terms Main Point
Accounting profits equal revenues minus all obvious costs, including depreciation. But accounting profits miss the hidden, implicit opportunity costs of a business owner’s time and money.
Depreciation
decrease in the value of equipment over time because of wear and tear and because it becomes obsolete. The allowable yearly depreciation cost is price of equipment divided by number of years it lasts.
Obvious costs (explicit costs) costs a business pays directly. Accountants count all obvious business costs and include depreciation.
Accounting profits revenues minus obvious costs (including depreciation)
Implicit costs hidden opportunity costs of what business owner could earn elsewhere with time and money invested
Discussion or Homework Q&A
1. Q. Betty’s Blogging is a small business and prepares the following plan about revenues and expenses in the first year:
Expected revenue
Cost of renting equipment
Cost of web hosting
Cost of phone and internet
Cost of advertising
$50 000
$10 000
$ 3 000
$ 5 000
$ 2 000
What are the obvious costs? What are the expected accounting profits for the year?
A. Obvious Costs = $10 000 + $3000 + $5000 + $2000 = $20 000.
Accounting Profits = Revenues – Obvious Costs = $50 000 – $20 000 = $30 000. There is no information about any interest costs on the $20 000 needed to start the business, so actual bank interest costs, which would be part of Obvious Costs, is not included here.
2. Q. Explain the difference between a risk-loving person and a risk-averse person. Which type of person requires a higher risk premium when gambling or investing? Which type of person prefers a variable rate mortgage over a fixed rate mortgage, all other things being equal?
A. A risk-loving person is comfortable with risk and does not require much risk compensation to be persuaded to gamble or invest. A risk-averse person tries to avoid risk and therefore requires a lot of risk compensation to be persuaded to gamble or invest.
A risk-loving person will be more comfortable with the uncertainty associated with a variable-rate mortgage, knowing that it is a good gamble for getting lower rates over the full term of the mortgage. A risk-averse person is not easily persuaded to live with the constant uncertainty of a variable-rate mortgage, and is willing to pay the slightly higher interest rate of the full term of the mortgage in exchange for the certainty and reassurance of knowing exactly what payments will be each month.
Refresh questions follow on the next page.
7.1.1
Q. Your sister is thinking about investing in a new business venture. Define the concept of implicit costs (hidden opportunity costs) for her and explain to her why it is important to understand these costs before she invests.
A. Implicit costs are the best she could have earned with her time and money if she did not invest in the new business. It would include the income she could have earned at another job, and the interest she could have earned on her money if she put it in a savings account. The profits she expects from the new business must be greater than those implicit costs, or the new business will leave her worse off, even if those (accounting) profits are a positive number.
7.1.2
7.1.3
Q. The current bank interest rate is 5 percent. You borrow $10 000 from the bank as well as invest $20 000 of your own money in a new business for a year. Detail the obvious costs and the implicit costs (hidden opportunity costs) for both amounts of money you are investing.
A. If you borrow $10 000 from a bank at 5 percent interest, your obvious cost of borrowing is $10 000 × 0.05 = $500 per year. For the borrowed $10 000, there are no hidden opportunity cost beyond the obvious costs. If you invest $20 000 of your own money, there are no obvious borrowing costs, as you do not charge yourself interest. However, there are hidden opportunity costs of what you could have earned elsewhere if you invested the $20 000. If you could have earned 5 percent interest loaning out the $20 000, then your hidden opportunity cost of investing your own money in your business is $20 000 × 0.05 = $1000 per year.
Q. You are deciding between safely investing your lottery winnings in the bank or to risk investing them in a friend’s startup business. What factors, including your own attitude toward risk, would lead you to choose to invest in your friend’s business rather than take the safe path with the bank?
A. Your choice is between safely investing your lottery winnings in the bank or taking a chance on a friend’s business venture. The factors that would lead you to invest in your friend’s business are the size of the payoff (the greater the expected profits, the more interested you are) and the riskiness of the payoff (the probabilities of success and of failure). Your attitude toward risk determines how attractive the safe, riskless return in the bank looks to you relative to the more risky, but higher, return from the friend’s business. If you don’t like risk (are risk-averse) it would take a very high expected profit in the friend’s business to get you away from the riskless bank return. But if you don’t mind risk, and even like the thrill of gambling (are risk-loving) then you might go for the friend’s investment with an expected return not much higher than the riskless return you would get from the bank.
7.2 What Economists Find: Normal Profits and Economic Profits
Learning Objective
Define normal profits and economic profits, and explain their differences.
Key Terms Main Point
Smart business decisions return at least normal profits — what a business owner could earn from the best alternative uses of her time and money. There are economic profits over and above normal profits, when revenues are greater than all opportunity costs of production, including hidden opportunity costs.
Normal profits compensation for business owner’s time and money
Economic profits revenues minus all opportunity costs
Economic losses negative economic profits
Discussion or Homework Q&A
1. Q. Suppose Betty’s Blogging business has the revenues and obvious costs in section 7.1, question 1. Betty ‘s best alternative employment is working for $25 000 for a marketing company. Betty has to borrow $20 000 from the bank to start the business, at an interest rate of 10%. Betty wants her own business more than anything in the world, and is not looking for any risk compensation. Does this information change Betty’s expected accounting profits – and if so, what are they? What are Betty’s hidden opportunity costs? What are Betty’s expected economic profits?
A. We now know that Betty has explicit interest costs of $2000 (10% of $20 000). These costs must be added to her other obvious costs of $20 000, and subtracted from expected revenues to calculate accounting profits. So Accounting Profits = Revenues – Obvious Costs = $50 000 – $22 000 = $28 000.
The $25 000 Betty could earn elsewhere (a hidden opportunity cost) does not affect her accounting profits, but must be subtracted to calculate her economic profits. Hidden opportunity costs also include the cost of using your own money, plus risk compensation. Betty is not using her own money – all the money is borrowed from the bank, so the interest cost is an obvious cost, and there is no risk compensation.
Economic Profits = Revenues – (Obvious Costs + Hidden Opportunity Costs) = $50 000 – ($22 000 + $25 000) = $3000
So Betty is making economic profits of $3000.
2. Q. What would an economist recommend for Betty’s Blogging business?
A, An economist would see a green light and recommend that Betty start the business.
Refresh questions follow on the next page.
7.2.1
7.2.2
7.2.3
Q. If your business earns accounting profits of $50 000 and economic profits of $20 000, what are your hidden opportunity costs?
A. $30 000. Economic Profits = Accounting Profits – Hidden Opportunity Costs.
Q. You earn a good salary, but you hate your boss. You develop a plan to start your own business that projects economic profits of $5000 at the end of the first year. But just as you are about to go ahead with your new business, you are offered a job for $15 000 more than you were earning before. How does that change your projected economic profits? Would it change your decision to start your new business? Why or why not?
A. If you project $5000 in economic profits, that would be after subtracting all hidden opportunity costs, including the best alternative cost of your time. When someone offers you $15 000 more for your time than you were earning before, that $15 000 must be added to the hidden opportunity costs of your business projection. If you subtract $15 000 from your projected $5000 in economic profits, your projection becomes an economic loss of $10 000. Your smart choice would now be to take the alternative job you are offered (you still get away from your boss!) rather than start the new business.
Q. Do you think it correct to use economic profits as opposed to accounting profits when judging the success or failure of a business? Explain your reasons.
A. Only economic profits take all opportunity costs into consideration, and smart choices depend on opportunity costs. But most new businesses take a few years to become profitable, and business owners know that. So you might be willing to suffer economic losses for a while in the hope that they will turn into much larger economic profits when your business finally succeeds.
7.3 Red Light, Green Light: How Economic Profits Direct the Invisible Hand
Learning Objective
Explain how economic profits signal smart business decisions and coordinate consumer and business choices.
Main Point
Key Terms
The simplest rule for smart business decisions is “Choose only when economic profits are positive.” When businesses pursue economic profits, markets produce the products and services consumers want.
Breakeven point
Business just earning normal profits – no economic profits, no economic losses
Short-run market equilibrium
quantity demanded equals quantity supplied, but economic losses or profits can lead to changes in supply
Long-run market equilibrium quantity demanded equals quantity supplied, economic profits are zero, no tendency for change.
Discussion or Homework Q&A Refresh Q&A
1. Q. What is the same about short-run equilibrium and long-run equilibrium? What is different?
A. In both short-run equilibrium and long-run equilibrium, quantity demanded equals quantity supplied. The equilibrium price and quantity are at the intersection of the demand and supply curves.
What differs between short-run equilibrium and long-run equilibrium has to do with economic profits or losses. At the equilibrium price and quantity of short-run equilibrium, businesses are making economic profits or suffering economic losses. There is an incentive for change to happen. At the long-run equilibrium price and quantity, economic profits must be zero. There is no incentive for businesses to change their smart choices.
2. Q. Starting with a short-run equilibrium with economic profits, explain what happens to move the industry to long-run equilibrium.
A. Economic profits are an incentive for new businesses to enter the industry, increasing supply. The supply curve shifts rightward, pushing prices down. The continuing increase in supply keeps moving the market price down along the unchanged demand curve. As long as economic profits remain, businesses keep entering, supply keeps increasing, prices keep falling, and economic profits keep decreasing until the new intersection of the (unchanged) demand curve and (rightward-shifted) supply curve happens at a price that yields zero economic profits. At the long-run equilibrium price and quantity, revenues just cover all opportunity costs of production (including normal profits), and economic profits are zero.
7.3.1
Q. State the main difference between economic and accounting profits. What signal does it send to new businesses considering entering an industry when economic profits are negative? Zero? Positive?
A. Economic profits look at all costs including all hidden costs.
When economic profits are negative, the signal to new businesses considering entering the industry is a red light — get off that road, a not smart business decision! Negative economic profits, or economic losses, mean that businesses are not even earning normal profits — they are worse off than the best alternative use of their time and money.
When economic profits are zero, the signal to new businesses considering entering the industry is a yellow light — proceed with caution. All any business will do is break even, doing as well as it could have done with the best alternative use of its time and money. Zero economic profits mean that businesses are just earning normal profits, no more or less.
When economic profits are positive, the signal to new businesses considering entering the industry is a green light — get on that road, a smart business decision with economic profits ahead! Positive economic profits mean that businesses are earning over and above normal profits — they are earning more than the best alternative use of their time and money.
More refresh questions follow on the next page.
7.3.2
7.3.3
Q. Explain how the rule “Choose only when additional benefits are greater than additional opportunity costs” is the same as “Choose when economic profits are positive.”
A. The rule “Choose only when additional benefits are greater than additional opportunity costs” means choose only when revenues (additional benefits) are greater than additional opportunity costs. Additional opportunity costs include obvious costs and hidden opportunity costs. The formula for economic profits is revenues minus all opportunity costs. So the rule is the same as “Choose when economic profits are positive” or choose when revenues are greater than additional opportunity costs.
Q. Businesses in the beachball market are currently earning zero economic profits. A heat wave strikes and demand for beachballs skyrockets, so a shortage develops, driving up beachball prices. Using economic profits as the key, use a demand and supply graph to explain all the choices that will be made before the beachball market once again returns to long-run market equilibrium with zero economic profits.
A. The increase in demand shifts the demand curve rightward. At the original price, there is a shortage of beachballs. Price rises and existing businesses increase their quantity supplied (moving up along the original supply curve).
The higher price creates economic profits for businesses in the market. Those economic profits serve as a signal for new businesses to enter the beachball market (supply curve shifts rightward). The price of beachballs falls. As long as economics profits are positive, the supply curve keeps shifting rightward as new businesses continue to enter the market. The beachball market will stop changing when price falls enough so that economic profits are back to zero (normal profits only) and businesses no longer have incentives to increase quantities. At that point (market equilibrium), businesses will be doing just a well as in any other market or industry.
8 Pricing Power Monopoly to Competition and In Between
Learning Objectives
1. Differentiate between monopoly and perfect competition, and explain what businesses aim for and what businesses fear.
2. Identify three main characteristics of market structure and explain their influence, with elasticity of demand, on a business’s pricing power.
3. Identify the four main market structures, and explain their differences.
4. Explain how businesses compete, and why the process of creative destruction improves productivity and living standards.
Lecture Narrative
This chapter focuses on how market prices are set – somewhere between the maximum consumers are willing to pay and the minimum businesses are willing to accept. Where prices settle depends on competitive conditions and a business’s market power (which in turn depend on the availability of substitutes and the elasticity of demand). Market power is a continuum, ranging between the extremes of monopoly (price maker) to perfect competition (price taker). I describe the characteristics of market structure — substitutes, product differentiation, number of businesses, and barriers to entry (legal barriers and economies of scale). As a shorthand measure, market power is inversely related to elasticity of demand.
I emphasize competition as an active attempt to increase profits and gain the market power of monopoly, whether through cutting costs, increasing quality, product differentiation, advertising, buying out competitors, or erecting barriers to entry. This emphasis ends with Schumpeter’s concept of creative destruction, which explains the inherent change and growth of the market economy, and controversial trends like off-shoring, the destruction of manufacturing jobs in Canada, and technological obsolescence of products, which nonetheless improve overall living standards over time.
Graphs, Tables and Illustrations
Figure Title G, I, T Page
8.1 Monopoly’s Inelastic Demand
Active Learning Suggestions
Top Choice
My textbooks differs from most others in placing more emphasis on the entrepreneurial aspects of how businesses compete, rather than focusing on “perfect competition,” which is a hypothetical market structure where all competitive actions have ended and all businesses have identical technologies and cannot influence price. The most important concept of active business competition is Schumpeter’s creative destruction – competitive business innovation generate economic profits for winners, improve living standards for all, but destroy less productive or less desirable products and production methods. This Schumpeter quote appears on p. 200: Schumpeter focused on “the competition from the new commodity, the new technology, the new source of supply, the new type of organization (the largest-scale unit of control for instance) — competition which commands a decisive cost or quality advantage and which strikes not at the margins of the profits and the outputs of the existing businesses but at their foundations and their very lives. This kind of competition is as much more effective than [price competition] as a bombardment is in comparison with forcing a door ….”
One of the current best examples of creative destruction is the impact of Uber on the taxi industry. Here are two excellent articles for students to read, about Toronto and New York City: “How Uber Is Ending The Dirty Dealings Behind Toronto’s Cab Business,” Globe and Mail, 16 July 2015 (http://www.theglobeandmail.com/globe-drive/adventure/red-line/how-uber-isending-the-dirty-dealings-behind-torontos-cab-business/article25515301/) and “Under Pressure From Uber, Taxi Medallion Prices Are Plummeting” New York Times, 27 November 2014 (http://www.nytimes.com/2014/11/28/upshot/under-pressurefrom-uber-taxi-medallion-prices-are-plummeting.html?abt=0002&abg=1)
The Uber story is especially applicable to this chapter, as the new technology is destroying the monopoly power embodied in taxi medallions. The Globe and Mail story lacks any sympathy for the taxi medallion owners, but that will spark even more discussion as students agree or disagree.
Dynamic Study Modules
The online Dynamic Study Modules (http://media.pearsoncmg.com/intl/pec/mylab/2016c/cohen2ce/micro/mmnd_html/ dynamic_study_modules.html) are created generically for any Canadian economics text. Modules students can work through with some (not all) content related to Chapter 8:
• New Developments in Markets
• Monopoly
• Monopolistic Competition
Teaching Blog Check out economicsforlife.ca for new media stories, related discussion questions, and other active learning ideas. All posts are tagged by textbook chapters and topics.
8.1 Dreams of Monopoly and Nightmares of Competition: Price Makers and Price Takers
Learning Objective
Differentiate between monopoly and perfect competition, and explain what businesses aim for and what businesses fear.
Main Point
Key Terms
Businesses aim for monopoly’s economic profits and price-making power. Competitors usually push businesses toward the normal profits and price taking of perfect competition.
Monopoly
only seller of a product or service; no close substitutes are available
Market power business’s ability to set prices
Price maker monopoly with maximum power to set prices
Perfect competition many sellers producing identical products or services
Price taker business with zero power to set prices
Discussion or Homework Q&A
1. Q. Explain the connection between pricing power and elasticity of demand. Then use the connections between elasticity of demand and total revenue to explain why businesses want pricing power.
A. Inelastic demand is associated with more pricing power. Elastic demand is associated with less pricing power. When demand is inelastic, raising price increases total revenue, making a business more profitable. When demand is elastic, lowering price increases total revenue, so competing businesses, in pursuing revenues, have incentives to cut prices, which also reduces profits. So businesses want to make their demands as inelastic as possible, and have the power to raise prices and profits.
2. Q. Explain what limits the power of a price-making monopoly to raise prices.
A. A monopoly price maker has maximum power to set prices, but market power is limited by what buyers are willing and able to pay. The law of demand always operates, so higher prices mean decreased quantity demanded and fewer sales. Consumers cannot be forced to buy at any price – they can sit on their wallets and do without the product, or find an imperfect substitute.
Refresh Q&A
8.1.1 Q. In your own words, define “perfect competition” and “monopoly.” Besides wheat, list three other products or services that have markets like perfect competition. List three products or services that have markets like a monopoly.
A. In perfect competition, there are many sellers producing identical products or services; there are perfect substitutes for any one business’s products or services. Businesses in perfect competition have zero market power — businesses are price takers with zero power to set prices any different from the market price.
There are many possible examples of markets that are like perfect competition. The common characteristic is that perfect substitutes are available. If you are selling balls of string, or nails, or concrete, or sidewalk chalk, or other agricultural commodities, you are a price taker, with zero power to set prices different from the market price.
A monopoly is the only seller of a product or service when no close substitutes are available. That gives the business market power — power to set prices. A monopoly is a price maker, with maximum power to set prices. Examples that are close to monopoly are wineries that sell unique or rare wines, businesses that invent brand-new products like Apple’s iPhone in 2007, and businesses in very small towns that have no competitors (but the Internet has reduced that kind of monopoly power).
More refresh questions follow on the next page.
8.1.2
Q. Explain how the forces of competition and the law of demand still operate even in the market structure of monopoly.
A. A monopolist has no close substitutes, but there are always substitutes. As a monopolist raises prices — for a rare wine for example — consumers may give up and buy a different wine from a producer who now becomes a competitor. And no one can force a consumer to buy. As the price rises, if consumers choose not to buy, quantity demanded decreases.
8.1.3
Q. To increase revenues, a business may lower rather than raise its prices. Use the concept of elasticity of demand to explain how this business strategy would work.
A. Sellers prefer higher prices to lower prices, as long as they can continue to sell the same quantities. But the law of demand always applies. Sellers with market power can set higher prices, but cannot force consumers to buy. In setting higher prices, sellers must consider the trade-off — they lose revenues due to the lower quantity demanded and sold. If demand is elastic, then a cut in price will produce a large response in increased quantity demanded and total revenues will rise. In this case, sellers prefer lower prices. If demand is inelastic, then sellers will prefer higher prices because a rise in price will produce only a small decrease in quantity demanded, and total revenues will rise. Smart business pricing decisions for total revenue depend on knowing the elasticity of demand for your product or service.
Whatever price a seller sets, another question is whether the price covers all opportunity costs of production. We will look more closely at costs in Chapter 9 and Chapter 9 Appendix.
8.2 How much Competition Is Going On? Market Structure
Learning Objective
Identify three characteristics of market structure and explain their influence, with elasticity of demand, on business’s pricing power.
Main Point
Key Terms
Pricing power depends on the competitiveness of a business’s market structure — available substitutes, number of competitors, barriers to the entry of new competitors — and on elasticity of demand.
Market structure
characteristics that affect competition and pricing power – available substitutes, number of competitors, barriers to entry of new competitors
Product differentiation attempt to distinguish product or service from those of competitors
Barriers to entry
legal or economic barriers preventing new competitors from entering a market
Patents and copyrights (legal barriers) exclusive property rights to sell or license creations, protecting against competition
Average Total Cost total cost per unit of output
Economies of scale (economic barriers) average total cost of producing falls as quantity (scale) of production increases
Discussion or Homework Q&A
1. Q. Why do governments around the world offer the monopoly protection of patents and copyrights?
A. Without patents and copyrights, other businesses can copy inventions or great ideas for free and sell them for substantial profits — without ever having to invest the time, money, or effort required to come up with an invention. Therefore, patents and copyrights are essential for ensuring that businesses have incentives to invest in the research and innovation required to come up with an invention.
2. Q. Canadian beer companies spend millions of dollars a year on advertising.
a. Why do they advertise?
b. If the government banned all beer advertising, how do you think beer businesses would compete?
c. What kind of barriers to entry exist in the beer industry?
A. a. To create perceived differences.
b. Since beer companies could no longer compete by creating perceived differences, they would be forced to compete on the basis of price or cost or taste.
c. Economic barriers to entry in the form of economies of scale in production and distribution.
Refresh Q&A
8.2.1
Q. Write a definition of market structure that includes its three main characteristics
A. Market structure is the characteristics that affect competition and pricing power. The three main characteristics are availability of substitutes, the number of competitors, and barriers to entry of new competitors.
More refresh questions follow on the next page.
8.2.2
8.2.3
Q. Even after patents expire, brand-name drugs like Advil and Tylenol sell for more than chemically identical no-name generic drugs. Describe two strategies that the companies that produce the brand names can employ to keep existing customers and gain new ones. How can they get consumers to pay more for their brand names than for no-name generics?
A. Some consumers will spend more for brand names than for identical generic drugs if they believe that the brand-name drugs work better. The important word is “believe.” Although the drugs are chemically identical, brand-name companies spend money on advertising to convince consumers that there are differences, or simply to get consumers to think of the name of their drug when facing a store display with all of the competitors’ drugs. Advertising is part of a strategy of product differentiation — attempts to distinguish your product or service from those of competitors. The advertised differences may be actual or simply perceived differences.
Q. What counts as a substitute product depends on how broadly or narrowly you define the market. Pick any specific product or service. Explain how it could be seen as a monopoly. Then present a position showing the opposite, that it is not really a monopoly.
A. Your answer will depend on the product or service you pick. Take Rolex watches as an example. For a consumer who wants only a Rolex watch, Rolex has a monopoly. But if the consumer is interested in real, status watches, there are other competitors in the market. Or, if the consumer in interested in status only, but not necessarily the actual watch, then knockoffs become competitors too. And if the consumer is interested in any watch, the broadest definition of the market, then there are many, many competitors (mostly phones — who wears a watch?). For any example you pick, the basic logic is this: The narrower the definition of the market (Rolex watches only), the fewer substitutes and competitors there are, and the closer it is to monopoly. The broader the definition of the market (all time-keeping devices), the more substitutes and competitors there are.
8.3 Mash-Ups of Market Structure: Oligopoly and Monopolistic Competition
Learning Objective
Identify the four main market structures, and explain their differences among them.
Main Point
Key Terms
The four main market structures are monopoly, oligopoly, monopolistic competition, and perfect competition.
Oligopoly
few big sellers control most of the market
Monopolistic competition
many small businesses make similar but slightly differentiated products or services
b. In fostering new, viable competitors, the government is trying to reduce the pricing power of the big three companies. Consumers will benefit from lower prices, and possible better service. Discussion or Homework
1. Q. What are the three sources of pricing power? If you are a business in an industry that is classified as monopolistic competition, what is your strategy to create pricing power and make demand for your product or service more inelastic?
A. The three sources of pricing power are the availability of substitutes, the number of competitors, and barriers to entry. By definition, the market structure of monopolistic competition has no barriers to entry, which also means there are no limits to the number of business competitors. Your only option for creating pricing power is to differentiate your product or service so that consumer come to think that there are few substitutes for what you sell. Product differentiation can take many forms – price premium, quality, service, or marketing to enhance perceived differences.
2. Q. The mobile phone services industry in Canada is dominated by three big providers – Rogers, Telus, and Bell, together with a number of smaller, regional providers.
a. What kind of market structure is this?
b. In recent years, the government of Canada has actively worked to create viable, new competitors to the big three by reserving wireless spectrum sales for smaller companies and other regulations. Who will benefit from these policies, and how will they benefit?
A. a. Oligopoly – a few big sellers control most of the market.
8.3.1 Q. Describe the differences between oligopoly and monopolistic competition. Between monopolistic competition and perfect competition.
A. The most important differences between oligopoly and monopolistic competition are number of sellers and barriers to entry. Oligopoly has just a few big sellers, while monopolistic competition has many slightly differentiated sellers. Oligopoly has some barriers to entry (often economies of scale) while there are almost no barrier to entry in monopolistic competition. These difference give businesses in oligopoly more price-making power than businesses in monopolistic competition.
The differences between monopolistic competition and perfect competition are in the numbers of substitutes and sellers. Businesses in monopolistic competition have slightly differentiated products or services, while in perfect competition there are many perfect substitutes. There are fewer competitors in monopolistic competition than in perfect competition. These differences give businesses in monopolistic competition slightly more price-making power than the price-takers in perfect competition.
More refresh questions follow on the next page.
8.3.2
Q. Use your answer to question 1 to explain why oligopoly and monopolistic competition can be described as mash-ups.
A. Oligopoly shares some of the characteristics of monopoly (on one side) and monopolistic competition (on the other side). Similarly, monopolistic competition shares some of the characteristics of oligopoly (on one side) and perfect competition (on the other side).
8.3.3
Q. You are thinking of opening a gardening business during the summer — you will cut, weed, rake, and water lawns. What market structure would you be competing in? Describe your pricing strategy using the term “elasticity of demand.”
A. There are many competing businesses out there, and there are no barriers to entry — anyone can buy a lawnmower and a truck and open for business. With all of that competition, it is difficult to charge prices much higher than others. You might differentiate yourself by offering better service, being more knowledgeable about plants, being more polite and responsive, getting a distinctive advertising strategy, etc. That differentiation would place you in the market structure of monopolistic competition. With differentiation, you face a slightly more inelastic demand than a business in perfect competition. That slight inelasticity of demand gives you a little price-making power. When you raise your price, your quantity demanded will decrease, but not to zero, as it would for a business in perfect competition that tried to raise its price.
8.4 To Compete Is a Verb: How Do Businesses Compete?
Learning Objective
Explain how businesses compete, and why the process of creative destruction improves productivity and living standards.
Key Terms Main Point
Businesses actively compete for monopoly’s economic profits and pricing power. This process of creative destruction drives competitors who do not adequately respond out of business, while unintentionally improving productivity and living standards for all.
Competition
active attempt to increase profits and gain the market power of monopoly
Creative destruction
competitive business innovations generate economic profits for winners, improve living standards for all, but destroy less productive or less desirable products and production methods
Discussion or Homework Q&A
1. Q. In 2015, the photography retailer Black’s Camera closed all 59 of its stores. Black’s used to be the largest, most powerful photography business in Canada. Explain what happened, and who wins, and who loses from Black’s shutdown.
A. What happened was Schumpeter’s process of creative destruction, in the form of new digital technologies for photography. With smart phones and the internet, the need to physically print photos disappeared. While all consumers benefit from cheaper, faster, easier photographs, workers and business owners in the old film photography business are losers.
2. Q. Explain why Karl Marx was a great admirer of the productivity of capitalism and its potential to raise living standards by “producing the goods” (if the “goods” were more equally distributed among families).
A. Marx understood the nature of capitalist competition as Schumpeter subsequently described it with the concept of creative destruction. (Schumpeter has been described as a “Bourgeois Marx!”) The competitive forces of Adam Smith’s invisible hand channel the restless energy of profit-seeking capitalists into creating more productive technologies that that not only create a competitive advantage for the inventing capitalist, but also reduce costs and improve living standards for most families.
Refresh Q&A
8.4.1
8.4.2
8.4.3
Q. Describe in your own words two actions a business can take to compete. Give a real-world example of each.
A. The actions businesses can take to compete include cutting costs, improving quality, innovating, advertising, buying out competitors, and erecting barriers to entry. Examples will differ.
Q. Explain, in your own words, Schumpeter’s process of creative destruction. Explain how creative destruction is good for the majority but harmful to some minorities.
A. In Schumpeter’s process of creative destruction, competitive business innovations (that’s the creative part) generate economic profits for winners, improve living standards for all, but destroy the less productive or less desirable products and production methods (that’s the destructive part). The process is similar to the phrase, “In order to make an omelette, you have to break some eggs.” There is ultimately a desirable result, but there are casualties along the way. Businesses that have been destroyed by creative destruction include typewriters, VHS tapes and video stores, home mail delivery. . .
Q. Markets combine freedom of choice with tremendous competitive pressure to supply products and services the markets value. This combination is connected to the age-old philosophical question about whether humans have free will, or whether our choices are all determined by other forces in society. Argue that your choice of “what you want to be when you grow up” is an example of free will. Then argue that the freedom of your choice is an illusion and that your choice is determined by economic forces in society.
A. No one controls your decision about what you want to be when you grow up. Your parents might try, but ultimately it is your choice to listen to or disagree with them. You are a unique individual, and your choices are your own. On the other hand, your preferences and choices are shaped by your parents, your genes, and your upbringing, education, and experiences. Furthermore, you choice of professions is influenced by the rewards offered by different professions. Your personal history and economic incentives shape your decision, so that the outcome is not that much in doubt. You may think you have free will, but there are subtle forces (social and economic) determining everything that you do.
9 Pricing for Profits Marginal Revenue and Marginal Cost
Learning Objectives
1. Define marginal revenue, and explain how it depends on market structure and when it differs from price.
2. Explain when marginal cost increases and when it is constant as a business increases output.
3. Explain quantity and price decisions in the recipe for maximum profits, and show the importance of marginal revenue and marginal cost.
4. Define price discrimination, and explain how it leads to higher profits by taking advantage of differences in elasticity of demand.
5. Explain why maximum profits bring efficiency for perfect competition, but inefficiency for market structures with pricemaking power.
Lecture Narrative
The price-taking rule of perfect competition is not very helpful for business strategy. This chapter uses the continuum of market structures from the previous chapter, to instead develop the common “recipe” for businesses in any market structure for setting the profit maximizing price and quantity: estimate marginal revenues and marginal costs, and then set the highest price that allows you to sell the highest quantity for which marginal revenue is greater then marginal cost. This focus on business pricing strategy is designed to connect students to real business decisions and avoid students “tuning out” because they find the price-taking assumptions of perfect competition unreal or uninteresting.
Based on the “one-price rule” (when buyers can resell), I explain scenarios when marginal revenue equals price (the price taker of perfect competition) and when marginal revenue is less than price (businesses with pricing power in all other market structures). For marginal cost, there are examples where marginal cost increases with increasing output (prevalent in most textbooks) and where marginal cost is constant (prevalent for most businesses not operating at capacity). I combine this information for a business’s quantity decision (choose the quantity where marginal cost equals marginal revenue) and the decision to set the highest possible price allowing sale of the target quantity. This chapter ties the recipe for profits back to the Three Keys, and emphasizes the importance of Key 2 (marginal decisions).
The last two sections look at the implications of price-making power for price discrimination and for efficiency. In industries where the one-price rule does not apply, businesses can increase profits through price discrimination. I then compare the inefficiencies of less competitive market structures with the efficiency of perfect competition, and point out potential positive trade-offs of price-making power in terms of product variety and financing innovation.
Graphs, Tables and Illustrations
9.1
9.2
9.3
9.4
9.5
9.6
9.7
9.8
Key: G - Graph(s) For titles in blue, Narrated Dynamic Graph videos are available online on each Chapter Resources page. I - Illustration T - Table
Graphs follow on the next page. Narrated Dynamic Graphs are identified with a blue video button. To access them, log into the Pearson course website (pearsonmylab.com), click on Chapter Resources, and then Chapter 9.
Active Learning Suggestions
Top Choice
Price discrimination, “dynamic pricing” (Economics Out There on p. 224), Uber’s “surge pricing,” and phone plan pricing will all generate student interest and discussion (see economicsforlife.ca for more stories). But the topic students need most help with in this chapter is the one-price rule motivating the downward-sloping marginal revenue curve. The chapter purposefully offers repeated, slightly different explanations because students have so much trouble grasping this concept. I advise you to use the PowerPoint slides to walk your students through as many of these iterations as they need, until they get it.
The first iteration is an intuitive example of marginal revenue on p. 206. Paola’s Parlour closes at 7 p.m., but some of her customers say it would be more convenient for them if the shop stayed open until 10 p.m. Is it a smart business decision for Paola to stay open later? This example differentiates marginal from total revenues (and costs).
Because of the one-price rule, to sell more, price-makers must lower the price on all units, not just on new sales. The slide for Figure 9.2 takes students step-by-step through price-quantity combinations and shows the marginal revenue calculation between combinations (A, B, …). Be sure to click through the transitions while in slideshow mode. This figure allows you to ask the question on p. 209 – In dropping the price from $18 to $16, Paola sells 2 units instead of 1, but why is her additional revenue from the 2nd unit only $14 instead of the $16 price? The “time machine” explanation on p. 210 is another iteration, which students suggested when they had trouble understanding my presentation in the 1st edition. Most other PowerPoint slides (Figures 9.3, 9.5, 9.6, 9.7) also have transitions motivating the one-price rule story. You can hear my explanations by listening to the Narrated Dynamic Graphs of those figures, and you can assign those for students to look at outside of class. The recipe for profits is the key business pricing decision, and the one-price rule and the downward-sloping marginal revenue curve are key to students’ mastery of that pricing decision.
Dynamic Study Modules
The online Dynamic Study Modules (http://media.pearsoncmg.com/intl/pec/mylab/2016c/cohen2ce/micro/mmnd_html/ dynamic_study_modules.html) are created generically for any Canadian economics text. Modules students can work through with some (not all) content related to Chapter 9:
• Monopolistic Competition
• Efficiency
• Monopoly
• Supply Curves: Inputs and Costs
Teaching Blog Check out economicsforlife.ca for new media stories, related discussion questions, and other active learning ideas. All posts are tagged by textbook chapters and topics.
9.1 Is the Price You See the Revenue You Get? Marginal Revenue
Learning Objective
Define marginal revenue, and explain how it depends on market structure and when it differs from price.
Main Point
Key Term
Marginal revenue equals price for price takers and is less than price for price makers. Smart businesses choose actions when marginal revenue is greater than marginal cost.
Marginal revenue additional revenue from more sales or from selling one more unit
Discussion or Homework Q&A
1. Q. Ori the ice cream truck driver knows he can sell 50 single-scoop ice cream cones on a hot, sunny day if his price is $3 each. His brother, who used to be in the ice cream business, tells him he can probably sell 80 single-scoop ice cream cones if he lowers his price on all cones to $2. What is Ori’s marginal revenue if he lowers the price to $2?
A. If his price is $3, total revenue is $150 (50 × $3). If price is $2, total revenue is $160 (80 × $2). Therefore, the marginal revenue is $10 ($160 – $150).
2. Q. The Vanherk family has a pig farm in a small town near Stratford, Ontario. The family currently charges the market price because the pig market is extremely competitive. Explain why the Vanherk family has no ability or incentive to raise or lower its pig prices.
A. In the market structure of perfect competition, businesses can’t raise their price because consumers will react by buying from one of the thousands of other businesses selling identical products at the lower (market) price. There is no incentive to lower prices since they can sell as much as they can produce at the market price.
Refresh Q&A
9.1.1
9.1.2
9.1.3
Q. In your own words, define marginal revenue.
A. Marginal revenue is the additional revenue a business receives from selling one more unit(s), or from extending sales.
Q. The connection between marginal revenue and price depends on a business’s competitive environment. Why are marginal revenue and price the same for a business that is a price taker in perfect competition? Why is marginal revenue less than price for a business that is a price maker?
A. Marginal revenue and price are the same for a price-taking business in perfect competition. As one of many small businesses, a price taker can sell as much as it can produce at the market price. So to sell more units, a price-taking business does not have to lower its price. Its additional marginal revenue from each unit sold equals the unchanged price of the units. Marginal revenue is less than price for a business that is a price maker. A business with some pricing power has the ability to set price above the price of competitors. But in order to sell more units, a price maker must lower prices. Products that can be easily resold tend to have a single price in the market. For the price-making business, that means to sell more units, it must lower the price on all units, not just on the additional units. So while the business receives a price from each additional unit sold, its marginal revenue is less than that price because of the reduction in price on other units. That lower revenue from other units must be subtracted from the price received on the additional units to calculate marginal revenue. So marginal revenue is less than price for a business that is a price maker.
Q. You own a business that personalizes smartphone covers. Explain to your investors how lowering your price may actually increase your total revenue.
A. If your business is facing elastic demand, lowering your price will increase your sales more than proportionately, so you will “make it up in volume” for the lower price per unit. Total revenue increases. But if you face inelastic demand, lowering your price will decrease your total revenues.
9.2 Increasing or Constant? Marginal Cost
Learning Objective
Explain when marginal cost increases and when it is constant as a business increases output.
Main Point
Key Term
As output increases, marginal cost increases for businesses operating near capacity or when businesses’ additional inputs cost more. Marginal cost is usually constant for businesses not near capacity.
Diminishing returns as output increases, decreasing productivity increases marginal costs
Discussion or Homework Q&A
1. Q. Explain how each of these decisions will be a smart choice by comparing estimated marginal revenues with marginal costs. For each decision, do you think marginal costs will be constant or increasing?
a. Launching an advertising campaign.
b. Hiring a new employee.
c. Extending business hours.
A. a. Determine whether the additional sales revenues caused by the advertising exceed the amount you have to pay in additional labour costs and any additional associated advertising fees. Marginal costs are likely constant for each additional advertising campaign.
b. Determine whether the additional sales revenues exceed the amount you have to pay in additional labour costs for that one employee. If additional employees are paid the same wage as current employees, marginal costs are likely constant. If a business has to pay more to hire additional employees because of a tight labour market or paying overtime rates, marginal costs are increasing.
c. Determine whether the additional sales revenues exceed the additional amounts you have to pay in labour costs, electricity, and so on in order to stay open during that period. For a business with excess capacity, marginal costs are likely constant for each additional hour the business stays open, like the example of Paola’s Parlour on p. 213.
2. Q. In Figure 9.5 on p. 215, if Paola has increasing marginal costs instead of constant marginal costs, do you think her smart, profit-maximizing quantity of piercings would increase or decrease from 3 units? Explain your answer.
A. If marginal costs are increasing, the marginal cost of producing the 3rd unit will be higher than its current $8. If the marginal cost of the 3rd unit goes higher than $10, producing 3 units will no longer be profit-maximizing since marginal costs would exceed marginal revenues ($10). The profit-maximizing quantity of piercings would likely decrease if Paola has increasing marginal costs.
Refresh Q&A
9.2.1 Q. Define marginal cost in a way that someone who has never taken an economics course will understand it.
A. Marginal cost is the additional cost to a business of increasing output. What happens to marginal cost as output increases depends on the supply side of the business’s costs. Businesses operating near capacity, or shifting to more expensive sources of inputs, have increasing marginal costs to increase output. As you have to drill deeper to find more oil, the additional cost of those new barrels of oil are higher than the cost of oil near the surface. Businesses not operating near capacity have constant marginal costs to increase output. If you have sales clerks sitting around on a slow day, when many new customers come in, there are almost no additional costs of selling to them — the marginal cost is constant at zero.
More refresh questions follow on the next page.
9.2.2
9.2.3
Q. What if, when the busload of piercing-seeking tourists arrives at Paola’s busy shop, she has employees on standby who she could bring in very quickly, and who would be paid their regular hourly wage? What difference, if any, would that make to Paola’s marginal cost of increasing piercing output?
A. If Paola’s workers are fully employed, in order to increase output she faces increasing opportunity costs for increasing either her output of piercings or of nail sets. But if Paola could bring in more employees quickly, and pay then the same (nonovertime) wages as the other employees, then she could expand her output of either piercings or nail sets at a constant marginal (additional) cost.
Q. Pick one business where you think marginal costs are increasing and one where they are constant. Explain your choices showing why in each case marginal costs are increasing or constant.
A. Your answer will depend on the business you pick. Some examples of businesses that may have increasing marginal costs are any business that has to pay overtime to workers to increase output, oil drilling or gold mining (where you have to go deeper/farther to increase output), or electricity production on hot summer days (where the electrical utility has to buy extra power at higher rates).
Examples of businesses that may have constant marginal costs are semiconductor producers, airline companies, printing companies (high fixed costs for machinery and setup, marginal costs of just paper, ink, and energy), and railway and shipping companies.
9.3 Recipe for Profits: Marginal Revenue Greater Than Marginal Cost
Learning Objective
Explain quantity and price decisions in the recipe for maximum profits, and show the importance of marginal revenue and marginal cost.
Main Point
A smart business decision for maximum economic profits involves both quantity and price decisions. The quantity decision is: produce all quantities for which marginal revenue is greater than marginal cost. The price decision is: set the highest possible price that allows you to sell that quantity. Key to maximum profits is to focus on marginal revenues and marginal costs, not on total revenues and total costs.
Key Term
Fixed costs (sunk costs) do not change with changes in quantity of output
Discussion or Homework Q&A
1. Q. Look at Figure 9.5 on p. 215 about Paola’s marginal revenues and marginal costs.
a. Explain why producing three piercings is Paola’s smart quantity choice.
b. Explain why charging a price of $14 is Paola’s smart price choice.
c. Increasing quantity from zero units to one unit has the largest additional impact on profits. Explain why producing one unit is not Paola’s smart, profit-maximizing choice.
d. If Paola increases quantity from three units to four units, she makes an additional $6. Explain why producing four units is not Paola’s smart quantity choice.
A. a. Producing three units is the highest quantity for which marginal revenue is greater than marginal cost, which is the quantity rule in the recipe for profits.
b. $14 is the highest price that allows Paola to sell her target quantity according to the recipe for profits.
c. Paola should keep increasing output as long as it leads to any increase in total profits. Her goal is maximum total profits, not the quantity with the largest additional profit.
d. If Paola increases quantity from 3 units to 4 units it costs her an additional $8. Since the additional costs are higher than the additional revenues of $6, it is not a smart choice. Total profits will be less with 4 units.
2. Q. Explain if we need information about fixed costs or total profits to determine the smart choices of output and price that give maximum total profits.
A. We do not need information about fixed costs or total profits to determine the smart choices of output and price, because fixed costs are irrelevant for smart decision-making. In Figure 9.7, if you increase the number for fixed costs, total profits will decrease by that same amount for each price and quantity combination. The current row with the price and quantity combination that has the highest economic profits (Row D) will still have, relatively, the highest economic profits, although the total amount of economic profits will be less than before for every combination.
Refresh Q&A
9.3.1
Q. Rewrite the steps in the recipe for maximum economic profits in your own words, in the order that businesses actually do them.
A. The recipe for maximum total profits is: Estimate marginal revenues and marginal costs and then set the highest price that allows you to sell the highest quantity for which marginal revenue is greater than marginal cost. The first step is the quantity decision: Produce all quantities where marginal revenue is greater than marginal cost. Once you choose that target quantity, the second step is the price decision: Set the highest possible price that allows you to sell the target quantity.
More refresh questions follow on the next page.
9.3.2
Q. Suppose Paola’s marginal revenues and fixed costs are the same as in Figure 9.7, but her marginal costs are increasing: $1 for the first piercing, $2 for the second, $3 for the third, $4 for the fourth, $5 for the fifth, and $6 for the sixth piercing. What quantity and price will Paola choose if she is making a smart decision? [Hint: Create a table like Figure 9.7.]
A. If Paola’s marginal revenues and fixed costs ($10) are the same as in Figure 9.7, but her marginal costs are increasing, the table for figuring out her smart quantity and price decisions looks like this:
9.3.3
Total Costs include fixed costs of $10, plus the sum of the marginal costs for the quantities in that row. For example, Row E has Total Costs of $20, equal to $10 fixed costs, plus marginal costs of $1 for the first unit, plus $2 for the second unit, plus $3 for the third unit, plus $4 for the fourth unit. Total Profits (last column) are equal to Total Revenue (TR) minus Total Costs. The recipe for maximum profits says: Estimate marginal revenues and marginal costs and then set the highest price that allows you to sell the highest quantity for which marginal revenue is greater than marginal cost. If Paola first chooses the quantity to produce, she would choose Row E, with a quantity of 4. If Paola increase quantity to 5, marginal cost ($5) is greater than marginal revenue ($2). Not smart. The highest price at which Paola can sell the 4 units is $12. At that quantity, Total Revenue is $48, Total Costs are $20, and Total Profits are $28. Notice that of all the possible Total Profits numbers in the last column, $28 is the maximum Total Profits. So, the recipe still works.
Q. You have been working too many hours at your part-time job (which pays $10 per hour), and your Economics marks are suffering. Your father, who wants you to do better in school but recognizes your desire for cash, offers you this deal. For every 1-percent increase in your mark on the next test, he will pay you $6. You estimate that one additional hour of studying will raise your mark 5 percent; a second hour of studying will raise your mark 4 percent; a third hour, 3 percent; a fourth hour, 2 percent; and a fifth hour, 1 percent. If all you are trying to do is make the most money, how many hours should you study?
A. This question also uses the recipe for maximum profits, but twists it slightly to apply to your choice of how many hours to study to make the most money, instead of how much quantity of output to produce to make the most total profits. Use the quantity first step of the recipe for maximum profits — study all hours for which marginal revenue (from your father) is greater than marginal cost (the forgone money from your part-time job). For the first hour of studying, your marks will go up 5 percent, so your father will pay you $6 × 5 = $30. You give up $10 from your job, but that is clearly a smart choice. For the second hour studying, your marks will go up 4 percent, so your father will pay your $6 × 4 = $24. Still better than the $10 lost from your job. For the third hour studying, your marks go up 3 percent, so your father will pay you $6 × 3 = $18. Still smart. For the fourth hour, your marks will go up 2 percent, so your father will pay you $6 × 2 = $12. Still smart, but barely more than the $10 lost from not working. For the fifth hour, your marks only go up 1 percent, so your father will pay you $6, but that is not as good as the $10 you could have earned working. Since your only goal is to make the most money, you will spend 4 hours studying.
9.4 Divide and Conquer: Price Discrimination Recipes for Higher Profits
Learning Objective
Define price discrimination, and explain how it leads to higher profits by taking advantage of differences in elasticity of demand.
Main Point
Key Term
Price discrimination is a business strategy that divides customers into groups. Businesses increase profits by lowering the price to attract additional price-sensitive customers (elastic demanders), without lowering the price to others (inelastic demanders).
Price discrimination charging different customers different prices for the same product or service
Discussion or Homework Q&A
1. Q. Tifo works for Infamous Players Cinemas and wants to look smart during his next staff meeting. Suppose all movie ticket customers currently pay the same price.
a. Explain how Tifo can win the respect of his boss by having different groups pay different prices.
b. Suppose Infamous Players likes the idea of lowering the price to the age group most sensitive to price, but it would prefer to do this in an indirect way — that is, by lowering the price of movie tickets during the time of day the pricesensitive group watches movies. Explain how this could be done.
A. a. Since movie tickets cannot easily be resold, Tifo can discriminate by giving the age group with the most elastic demand (for example, seniors on fixed incomes) a discount. This can be enforced by requiring ID showing a birthdate, like a driver’s license.
b. Since seniors are more likely than working adults to be available to watch movies during the daytime, Infamous Players could reduce ticket prices for afternoon movies.
2. Q. What are the requirements for a business to be able to successfully price discriminate? How does the example of discount coupons at a grocery story meet those requirements?
A. Price discrimination requires that businesses can prevent low-price buyers from reselling to high-price buyers, and can control resentment among high-price buyers. Because grocery store coupons are available to anyone who takes the time to find them, the high-price buyers are not likely to search out low-price buyers for a bargain. It would be easier to just find the coupons. Resentment among high-price buyers is not a problem again because they have the option to use the coupons but voluntarily choose not to take the time to do so.
Refresh Q&A
9.4.1 Q. In your own words, write the basic recipe for successful price discrimination.
A. The recipe for successful price discrimination is to divide customers into groups, and lower the price to price-sensitive customers (with elastic demands) without lowering the price to less price-sensitive customers (with inelastic demands).
9.4.2 Q. Compare the phone plan you have chosen with more expensive plans. What factors went into your decision to select your plan? What does your plan tell you about your price elasticity?
A. As phone plans are very different, your answer to this question will be unique. In general, if you passed on more expensive plans, it was probably because the additional benefits of those plans were not worth the additional costs to you. And if you passed on plans that had more daytime minutes, chances are you do not need to use your phone for business much, putting you into the more elastic demand group.
9.4.3
Q. Explain the difference between dynamic pricing and price discrimination. State your opinion on the fairness of these pricing strategies. Should businesses be allowed to use them? Explain your answer.
A. Price discrimination identifies elastic and inelastic demanders and charges lower prices to elastic demanders and higher prices to inelastic demanders. Dynamic pricing continuously adjusts the price discrimination strategy with new information. Are these strategies fair? That depends on how you define “fair.” If you believe a business should be free to charge any price that a customer is willing to pay, then these strategies are fair. If you believe that prices should reflect costs, and not “what the market will bear,” then these strategies are not fair.
9.5 Are Maximum Profits Good for All? Market Structure and Efficiency
Learning Objective
Explain why maximum profits bring efficiency for perfect competition, but inefficiency for market structures with pricemaking power.
Main Point
Maximum profits bring efficiency for perfect competition, but inefficiency for market structures with price-making power.
Discussion or Homework
1. Q. Use the coloured/shaded areas in Figure 9.8 on p. 226 to explain all of the ways that consumers are worse off in market structures with price-making power.
A. Compare the areas of consumer surplus and producer surplus in parts a) and b) of Figure 9.5. In the part a) efficient market structure of perfect competition, total surplus (consumer surplus + producer surplus) is at a maximum. The idea behind consumer surplus – the focus of this question – is that consumers’ willingness and ability to pay for a unit of a product, their marginal benefit, is greater than the market price they have to pay. The excess of marginal benefit over price, added up for all units sold, equals the green area of consumer surplus.
In part b), businesses with price-making power reduce the quantity of output, and raise the price relative to perfect competition. Because of the higher price ($80 instead of $60), the consumer surplus for each unit sold is less, and there are fewer units sold (300 instead of 600). Both of these outcomes reduce the green area of consumer surplus compared to perfect competition.
For the 300 units sold, you can see that producers gain what consumer lose, in that the blue area of producer surplus is larger than in part a). The grey deadweight loss area represents both consumer surplus and producer surplus that is lost due to the reduced quantity of output. For every unit between 300 and 600, marginal benefit (reading the demand curve as a marginal benefit curve) is greater than marginal cost (reading the supply curve as a marginal cost curve). For every one of these units, there is a consumer who is willing and able to pay a price greater than the minimum price a business will accept to be willing to supply. These mutually beneficial transactions never happen because of pricing power. The lost consumer surplus part of the grey deadweight loss is the area below the demand curve but above the original price of $60, for all units between 300 and 600.
2. Q. What are the disadvantages to consumers of businesses with price-making power? What are the advantages? As a consumer, do the advantages or disadvantages of price-making power seem more valuable to you?
A. The obvious disadvantage to consumers of business price-making power is higher prices for products and services. The advantages all relate to what businesses are able to do on the product side because of the profits that come with pricing power. Businesses can makes changes and improvements to products that differentiate them from those of competitors, providing consumers with variety and choice. Profits also provide funds for innovations that can reduce costs through new production technologies, or create entirely new kinds of products and services that improve living standards. People will differ on the relative importance of disadvantages and advantages. The important point is to get students thinking and talking about the role of profits in the improvement and development of products and services.
9.5.1 Q. Explain in your own words why market structures with price-making power are inefficient.
A. When price makers increase prices above competitive levels, the quantity produced and sold in the market decreases. Those “lost” units of production create deadweight loss. That means that for each of those “non-produced” units of output, marginal benefit is greater than marginal cost. There is some consumer out there who values the additional unit more that the minimum price a supplier needs to receive to be willing to supply that unit. There are mutually beneficial exchanges that could happen, but don’t. That is what is inefficient about market structures with price-making power.
More refresh questions follow on the next page.
9.5.2
9.5.3
Q. Redraw Figure 9.8b but make the marginal revenue and marginal cost curves intersect at a quantity of 200 piercings. At that point, what are the output, price, consumer and producer surpluses, and deadweight loss?
A. See the graph below. Output will be 200 piercings, price will be about $87, and the areas of consumer and producer surplus and deadweight loss are indicated on the graph.
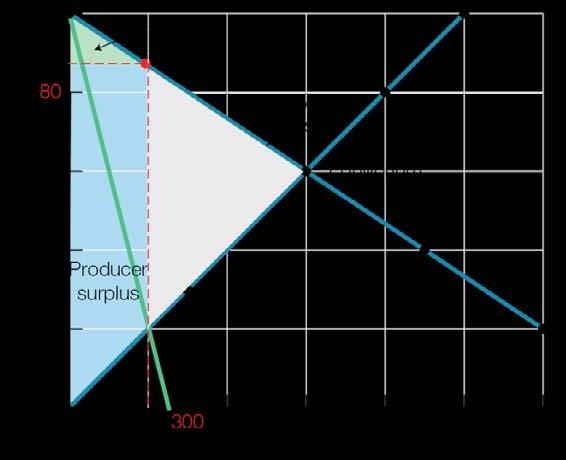
Q. If I claim that “efficient price-taking businesses are better for society than inefficient price-making businesses,” is that a positive or a normative statement? Do you agree with the claim? What arguments would you make to support your position?
A. That is a normative statement because my definition of “better” may be different from your definition. My claim can be defended by arguing that efficiency is more important than any other value or criterion of what is best for society. A contrary claim could be “inefficient price-making businesses are better for society because price-making power and profits allow innovation and product differentiation, and the gains from having new and varied products are more valuable than the losses in efficiency.”
9A Exploring Perfect Competition Productivity, Costs, Quantities, and Profits
Learning Objectives
1. Explain why marginal revenue equals price for price-taking businesses in perfect competition.
2. Describe how diminishing marginal productivity increases marginal costs and shapes the average total cost curve.
3. Explain why the marginal cost curve determines the supply curve for businesses in perfect competition.
4. Explain economic profits and losses as signals for businesses to exit or enter industries and change supply.
Lecture Narrative
This appendix is for instructors who want to develop and teach the traditional model of perfect competition. If you are that instructor, you deserve an explanation about why perfect competition is not a core textbook chapter.
The literacy-targeted (LT) approach of Microeconomics for Life focuses on essential economic concepts students need to know to become economically literate citizens. I believe that most of the topics usually covered in the perfectly competitive model – efficiency, equality of marginal revenue and marginal cost, business pricing strategy, the role of economic profits/ losses in prompting entry/exit and adjustments to long-run equilibrium – can be covered more simply, without resorting to the complex cost curve diagrams that scare off so many students. Those topics are covered in Chapters 4, 7, 8, and 9. I also find many students lose interest in a traditional course because of the perceived unreality of the perfectly competitive model. While you and I understand the power and importance of abstract models, once we lose students, they will probably never take another economics course. So for me and the LT approach, the cost/benefit calculation about including the complete perfectly competitive model leads to this appendix.
In the hope that we can still retain and engage students while teaching this model, I have simplified the cost curve diagrams by omitting ranges of increasing marginal productivity (and decreasing marginal cost), the average fixed cost curve, and the average variable cost curve. Other textbooks also downplay the AFC and AVC curves. You lose the precise calculation of the shutdown point (I do explain at the bottom of p. 243 why the supply curve does not go down to a zero price), but I think that loss is worth the greater simplicity (and hopefully student understanding) of the figures with just MC and ATC. The long-run equilibrium adjustments in Section 9.4 parallel the simpler presentation in Section 7.3, and use the same stoplight metaphors (red = economic losses, yellow = breakeven, green = economic profits) for intuition.
Graphs, Tables and Illustrations
Key: G - Graph(s) For titles in blue, Narrated Dynamic Graph videos are available online on each Chapter Resources page. I - Illustration T - Table Figure Title
9A.1 Perfect Competition: Industry and Individual Business Demand and Price
a) Wheat Industry
b) Individual Wheat Farmer
9A.2 Total Product and Marginal Product
a) Total Product
b) Marginal Product
9A.3 Increasing Marginal Cost
9A.4 Marginal Costs and Average Total Costs
Graphs follow on the next page. Narrated Dynamic Graphs are identified with a blue video button. To access them, log into the Pearson course website (pearsonmylab.com), click on Chapter Resources, and then Chapter 9A.
9A.5 Smart Quantity Choice for Economics Profits and Different Prices
a) Smart Quantity Choice for Economics Profits when Price = $4
b) Smart Quantity Choice for Economics Profits with Difference Prices
9A.6 Individual Farmer’s Supply of Wheat
9A.7 Market Supply of Wheat with 1000 Farmers
9A.8 Scenario One - Economic Losses
9A.9 Scenario Two - Breakeven Point
9A.10 Scenario Three - Economic Profits
9A.11 Short-Run and Long-Run Market Equilibrium in the Wheat Industry
a) Economic Losses
b) Breakeven Zero Economic Profits
c) Economic Profits
9A.6 Individual Farmer’s Supply of Wheat 9A.7 Market Supply of Wheat with
9A.8 Scenario One - Economic Losses
9A.9 Scenario Two - Breakeven Point
9A.10 Scenario Three - Economic Profits 9A.11a Economic Losses
9A.11b Breakeven Zero Economic Profits
9A.11c Economic Profits
Active Learning Suggestions
Top Choice
Helping students master the perfectly competitive models means taking them step-by-step through the development of the interrelated concepts. I have created the PowerPoint slides so that when you click on the transitions in slideshow mode, there is an easy-to-follow story that emerges.
After presenting the total product and marginal product curves in Figure 9A.2, Figure 9A.2b, goes step-by-step to derive the values for marginal product and the corresponding points on the marginal product curve. Similarly, Figures 9A.5a and 9A.5b derive the individual business’s supply curve from the profit-maximizing quantity choice associated with different prices (marginal revenues).
The story of adjustments to long-run equilibrium from short-run economic losses and profits appears in Figures 9A.8, 9a.9, and 9A.10. Finally, Figures 9A.11a,b,c show impact of exit and entry on the market supply and demand curves, and the return to long-run equilibrium with zero economic profits. Again, in the interest of simplicity, I have isolated the market supply and demand curves rather than pairing them with the complete cost curve diagrams showing the breakeven point.
My simplification represents the breakeven price ($4) in yellow on the market diagram, providing a clear visual target of where the market price ends up. This same convention of representing the long-run equilibrium price in yellow appears in Figure 7.4.
For all of these figures, you can hear my explanations by listening to the associated Narrated Dynamic Graphs, and you can assign those for students to watch outside of class
Dynamic Study Modules
The online Dynamic Study Modules (http://media.pearsoncmg.com/intl/pec/mylab/2016c/cohen2ce/micro/mmnd_html/ dynamic_study_modules.html) are created generically for any Canadian economics text. Modules students can work through with some (not all) content related to Chapter 9 Appendix:
• Perfect Competition
Teaching Blog Check out economicsforlife.ca for new stories and related discussion questions. All posts are tagged by textbook chapters.
9A.1 All Equal! Marginal Revenue and Price
Learning Objective
Explain why marginal revenue equals price for price-taking businesses in perfect competition.
Main Point
The demand curve for an individual price-taking business in perfect competition is also a marginal revenue curve — a horizontal line at the market price.
Discussion or Homework Q&A
1. Q. Explain the difference between the shape of the demand curve facing a perfectly competitive business and the shape of the demand curve facing a monopoly. What explains the differences in shape?
A. For a perfectly competitive business, the demand curve is a horizontal line at the market price. For a monopoly, the demand curve is the downward-sloping market demand curve.
In perfect competition, price equals marginal revenue, no matter what quantity the business supplies. There is a horizontal relationship between P = MR on one hand, and quantity on the other hand, because the individual business is very small, identical to many other individual businesses, and supplies only a tiny fraction of total industry output. That means the individual business can supply as large a quantity as it can produce, without lowering its price.
A monopolist is the only supplier in an industry, and faces the downward-sloping market demand curve. The law of demand applies. In order to sell more, the monopolist must lower its price.
2. Q. Ask your instructor to justify the time spent on understanding perfectly competitive market structures, even though perfect competition is rare in the real world.
A. Here are three justifications.
1. Many markets closely approximate perfectly competitive markets. The analysis in this appendix gives direct and useful insights into the behavior of these markets.
2. The model of perfect competition allows us to isolate the effects of competitive forces that are at work in all markets, even in markets that do not match the assumption of the model of perfect competition.
3. The perfectly competitive model serves as a useful benchmark for evaluating the relative efficiency of different market structures like monopolistic competition, oligopoly, and monopoly.
Refresh Q&A
9A.1.1 Q. Explain in your own words why marginal revenue and price are equal for a small business in perfect competition.
A. A small business in perfect competition is a price taker. As one of many small businesses, a price taker can sell as much as it can produce at the market price. To sell more units, a price-taking business does not have to lower its price. Its additional marginal revenue from each unit sold equals the unchanged price of the units.
9A.1.2 Q. Identify another industry that fits the description of perfect competition. Explain your choice.
A. There are many industries that fit the description of perfect competition. The common characteristic is that perfect substitutes are available. If you are selling balls of string, or nails, or concrete, or sidewalk chalk, or other agricultural commodities, you are a price taker, with zero power to set prices different from the market price.
9A.1.3
Q. Starting from perfect competition, what changes in an industry would cause price to be unequal to marginal revenue?
A. If price in no longer equal to marginal revenue, that means a business must lower its price to sell more units of its product. Here are two changes in the industry that might cause that to happen.
1. A business grows so large that increasing its output increases total market supply past the quantity that consumers are willing and able to pay for at the original market-clearing price. According to the law of demand, consumers will increase quantity demanded only if price falls.
2. Businesses in the industry develop price-making power, maybe through advertising that creates product differentiation or brand loyalty. For a business to sell more, it must take customers away from other businesses with loyal customers. That requires lower prices.
With the one price rule, lowering prices on all units to sell more units means marginal revenue is less than price.
9A.2 More Gets You Less Costs and Diminishing Marginal Productivity
Learning Objective
Describe how diminishing marginal productivity increases marginal costs and shapes the average total cost curve.
Main Point
Key Terms
Because of diminishing marginal productivity, marginal costs increase as output increases, and the average total cost curve is U-shaped.
Variable costs
change with changes in the quantity of output produced
Total cost
fixed costs plus variable costs
Total product total output labour produces when working with all fixed inputs
Marginal product additional output from hiring one more unit of labour
Diminishing marginal productivity as you add more of a variable input to fixed inputs, the marginal product of the variable input eventually diminishes
Average total cost total cost per unit of output
Discussion or Homework Q&A
1. Q. Why must the marginal cost curve intersect the average total cost curve at the minimum point of the average total cost curve?
A. The average total cost curve is U-shaped, first falling and then rising as output increases. When average total cost is falling, marginal cost must be less than average total cost, and when average total cost is rising, marginal cost must be greater than average total cost. Therefore, the marginal cost curve must intersect the average total cost curve at its minimum point. In order for average total cost to fall, it must have been pulled down by a smaller increase in cost from the last unit of output. Therefore, marginal cost is lower than average total cost. Similarly, when average total cost is rising, it must be that it has been pulled up by a higher marginal cost. When average total cost is at its minimum, it is neither falling nor rising, so marginal cost cannot be lower or higher than average total cost. Therefore, marginal cost must equal average total cost.
2. Q. Use the concepts of marginal and average to answer the following question. Suppose the worst student at Hubertville High School transfers to Histrionic High School. Is it possible that the average grade-point of the students at each school rises? Explain.
A. Yes, it is possible that the average grade-point of the students at each school rises. Think of the transferring student as the marginal student. If his grade-point average, although the lowest at Hubertville High, is higher than the average grade-point at Histrionic High, then the results are: the average grade-point at Hubertville High rises with the elimination of the lowest grade-point, and the average grade-point at Histrionic High rises because the transferring (marginal) student’s grade-point pulls up the average grade-point.
Refresh Q&A
9A.2.1 Q. In your own words, explain diminishing marginal productivity
A. Diminishing marginal productivity is the idea that as you add workers to a business with a fixed number of machines and tools, the marginal product of each additional worker is less than the marginal product of the previous worker hired. With fixed amounts of tools and other inputs, as you add workers that start having to share tools and eventually get in each others’ way. Productivity of each additional worker diminishes.
More refresh questions follow on the next page.
Refresh Q&A (continued)
9A.2.2
9A.2.3
Q. Explain how diminishing marginal productivity causes the average total cost curve to be U-shaped. [Hint: Your explanation needs to include marginal cost.]
A. Diminishing marginal productivity means increasing marginal costs. Marginal costs come from increasing the quantity of a variable input. Those variable costs (from hiring variable inputs) are added to fixed costs to get total costs. Average total costs (ATC) equal total costs divided by the quantity of output.
As output increases, fixed costs are spread over a greater quantity of output, pushing down average total costs. But because of diminishing marginal productivity, marginal costs are increasing. As long as marginal costs are below average total costs, average total costs decrease. The lower additional costs pull down the average. But when marginal costs are above average total costs, average total costs increase. The higher additional costs pull up the average.
Q. How do you know that the marginal cost curve intersects the average total cost curve at the minimum point of the average total cost curve?
A. See 9A.2.2. The average total cost curve is U-shaped. If the marginal cost curve is below the average total cost curve, the average total cost curve is falling — the left side of the “U.” If the marginal cost curve is above the average total cost curve, the average total cost curve is rising — the right side of the “U.” The only place the marginal cost curve can intersect the average total cost curve is in between where the average total cost curve is falling and where the average total cost curve is rising. The intersection is the bottom point of the “U” on the average total cost curve.
9A.3 Prices and the Recipe for Profits: Marginal Cost Curve Determines the Supply Curve
Learning Objective
Explain why the marginal cost curve determines the supply curve for businesses in perfect competition.
Main Point
The marginal cost curve determines the supply curve for businesses in perfect competition.
Discussion or Homework Q&A
1. Q. Give three different explanations for how higher prices create incentives for increased quantity supplied.
A. Higher prices are necessary to cover increasing marginal opportunity costs that arise because inputs are not equally productive in all activities. Higher prices can bring higher profits, whether marginal costs are increasing or constant. Higher prices are necessary to cover increasing marginal costs that arise from diminishing marginal productivity.
2. Q. Explain how to construct a market supply curve when all you know is the supply curve of one business in a perfectly competitive industry, and the total number of businesses.
A. The key piece of information that allows you to construct a market supply curve is the assumption that all businesses in a perfectly competitive industry are identical. If you know the supply curve of one business, you know for every price, what will be the quantity supplied. For the market supply curve, for every price, multiply the quantity supplied by one business times the number of businesses in the industry. For example, if at a price of $9 one firm supplies 30 units, and there are 100 identical businesses, then one point on the market supply curve is a price of $9 and a quantity of 3000.
Refresh Q&A
9A.3.1
9A.3.2
Q. In your own words, explain the three reasons why higher prices create incentives for businesses to increase quantity supplied.
A. 1. If a business has increasing marginal opportunity costs because inputs are not equally productive in all activities, it needs higher prices to cover those increasing costs.
2. Higher prices usually mean higher profits, whether marginal costs are constant or increasing.
3. If a business has increasing marginal opportunity costs because of diminishing marginal productivity, it needs higher prices to cover those increasing costs.
Q. Explain why the marginal cost curve is also the supply curve for businesses in perfect competition.
A. For any given market price facing a business in perfect competition, a business’s marginal cost curve generally shows its profit-maximizing quantity of output. The combination of market price and quantity supplied of output is the business’s supply curve. The only exception is that when the market price is so low that is does not even cover variable costs, the business will not supply any output.
9A.3.3
Q. If the market price of wheat falls from $5 to $4 per bushel, calculate the change in the farmer’s quantity supplied decision. Explain why the farmer makes that change.
A. Figure 9A.6 on page 243 shows the individual farmer’s supply curve, which is also his marginal cost curve. At a market price of $5 per bushel, going over to the supply curve and down to the quantity axis, the profit-maximizing quantity supplied by the farmer is 1300 bushels. You can also see those numbers on the table. If the price falls to $4 per bushel, the profitmaximizing quantity supplied decreases to 1200 bushels.
The marginal cost of each bushel of wheat between 1200 and 1300 bushels is greater than $4. So as the price falls from $5 to $4 per bushel, bushels 1201 – 1300 are no longer smart choices, as marginal cost is greater than the marginal revenue of $4 per bushel.
9A.4 Go or Stay? Short-Run and Long-Run Equilibrium
Learning Objective Main Point
Explain economic profits and losses as signals for businesses to exit or enter industries and change supply.
Economic losses and profits are signals for businesses to exit or enter an industry, shifting industry supply and returning the industry to long-run equilibrium, where economic profits are zero and average total costs are at a minimum.
Discussion or Homework Q&A
A business in a perfectly competitive industry has this cost information.
1. Q.
Use this information to answer questions 1 and 2.
a. What is the business’s breakeven price? How do you know?
b. If the market price is P = $16, what quantity of output will the business produce?
c. What are economic profits or losses at the output in b.?
A. a. The breakeven price is $22. The breakeven point occurs where the average total cost curve and the marginal cost curve intersect. In the table of numbers, notice that marginal cost is $21 at a quantity halfway between 17 and 18 units. Marginal cost is $23 at a quantity halfway between 18 and 19 units. So at 18 units, marginal cost is halfway between $21 and $23, or equals $22. At 18 units of output, average total cost also equals $22. So marginal cost and average total cost “intersect” at a quantity of 18 units and a price of $22.
b. For a perfectly competitive business, the recipe for profits says to choose the quantity where marginal revenue (equals price) equals marginal cost. If the price (and marginal revenue) is $16, look at the table for the quantity where the marginal cost also equals $16. That quantity is 15 units. At 15 units of output, marginal cost is halfway between $15 and $17, or equals $16.
c. Economic profit per unit is the difference between price and average total cost at the smart quantity of output for P = $16. At quantity of 15, average total costs equal $22.60. So the business is suffering an economic loss of $16 –$22.60 = $6.60 per unit. Total economic losses are $6.60 per unit times 15 units equals a loss of $99.
More homework/discussion questions follow on the next page.
2. Q.
Use this information to answer questions 1 and 2.
a. What is the long-run equilibrium price in the industry? How do you know?
b. What is this business’s long-run equilibrium quantity of output?
c. Using cost and revenue numbers for the output in part b, explain why that output is a long-run equilibrium output
A. a. The long-run equilibrium price is at the breakeven point, where the price is $22.
b. The long-run equilibrium quantity of output at that price is 18 units.
c. At the quantity of 18, price is $22 and average total cost is also $22. There are zero economic profits per unit, and zero total economic profits. That is the definition of a long-run equilibrium for a business and an industry. There is no tendency for change.
Refresh Q&A
9A.4.1
Q. Which of the three scenarios would cause businesses to enter an industry? Explain why that increase in the number of businesses in an industry causes the market supply curve to shift rightward.
A. Scenario Three, with Economic Profits, attracts new businesses into an industry. Economic profits are over and above normal profits (average profits in all industries), so it pays for businesses to move out of other industries, where they only earn normal profits, into this industry. One of the six factors that increases supply (p. 65) is an increase in the number of businesses. At each price, there are now more businesses willing to supply output, so the supply curve shifts rightward.
9A.4.2 Q. In Figure 9A.9, explain why the breakeven point is a market price of $4 per bushel and an output of 1200 bushels.
A. At the market price of $4 per bushel, the marginal cost curve tells us the profit-maximizing quantity of output for the business is 1200 bushel. At 1200 bushels, reading up to the average total cost curve (ATC), the average total costs of each bushel (which includes normal profits) is $4. So the market price is exactly equal to ATC. The price just covers all opportunity costs of production, including normal profits.
9A.4.3
Q. The paper clip industry is perfectly competitive and is initially in long-run equilibrium. Then the demand for paper clips decreases because people are using tablets and less paper. Using one graph for the paper clip industry and one graph for an individual business like Figures 9A.11a and 9A.8 (remember to title your graphs), tell the story of what will happen to market price, economics profits or losses, and the adjustment to a new long-run equilibrium.
A. After the decreases in demand for paper clips, the intersection of the industry demand and supply curves is at a price below the long-run equilibrium price, like price Ps in Figure 9A.11a. Individual businesses in the industry will decrease quantity supplied, from 1200 units (clips) to 700 units, as in Figure 9A.8. At the new short-run equilibrium price, businesses are making economics losses – earning less than normal profits. Businesses will exit the industry, and in Figure 9A.11, the supply curve shifts leftward. As industry supply decreases, the market price slowly increases. Businesses keep exiting and price keeps rising until the price reaches PL. At the new long-run equilibrium price, businesses are just breaking even, earning normal profits. At the price PL and the quantity QL, the industry is once again in long-run equilibrium.
10 When Markets Fail: Natural Monopoly, Gaming, Competition, and Government
Learning Objectives
1. Define market failure and explain the challenge for policymakers of a natural monopoly.
2. Explain how strategic interaction between competitors complicates business decisions, creating two smart choices.
3. Explain how governments use laws and regulations to promote competition, discourage cartels, and protect the public from dangerous business practices.
4. Differentiate between the public-interest view and the capture view of government regulation.
Lecture Narrative
After many chapters stressing the efficiency of markets, this is the first of three chapters about market failure. The next chapter covers externalities and the last chapter covers income inequality (as an equity, not efficiency, failure). This chapter focuses on market failures caused by economies of scale or collusion, and on government attempts to correct the failures.
The policy challenge for natural monopoly regulators is gaining the efficiencies of economies of scale, but avoiding the inefficiencies of restricted output and increased price. I examine public ownership and regulated private monopoly, focusing on simple rate of return policy. To motivate competition law, I describe cycles of gasoline price wars, and explain them as strategic, competitive decisions. There is a simple prisoners’ dilemma game explaining the tension between the Nash equilibrium outcome and the fact that players would be better off if they could trust each other. With the complication of trust, there are now two smart choices — high prices are a smart choice based on trust, while price wars are a smart choice based on non-trust.
After describing cartels (OPEC), I describe competition law as government attempts to counter collusion. I contrast publicinterest and capture views of government, and focus not on the normative question of “should governments intervene?” but on the positive question, “When will government action improve market failures, and when will it produce a worse outcome?” A citizen must evaluate evidence to decide which is worse — market failure or government failure — and make normative, political decisions about regulation policies that may trade off public safety versus efficiency and lower prices.
Graphs, Tables and Illustrations
Figure Title G, I, T Page
10.1 The Prisoners’ Dilemma of Bonnie and Clyde T, G 261
10.1 The Prisoners’ Dilemma of Bonnie and Clyde
Clyde’s Choices
Key: G - Graph(s) T - Table
Narrated Dynamic Graphs are identified with a blue video button.
To access them, log into the Pearson course website (pearsonmylab.com), click on Chapter Resources, and then Chapter 10.
Bonnie’s Choices
Active Learning Suggestions
Top Choice
Dynamic Study
Modules
The best way to engage students with the abstract, mathematical techniques of game theory is to show the clip of the bar scene from A Beautiful Mind (http://www.youtube.com/watch?v=CemLiSI5ox8). This film about John Nash (based on the book by Sylvia Nasser) won the 2001 Oscar for Best Picture. Many students have seen the film, and most love watching this clip (Governing Dynamics – Ignore the Blonde). Your biggest problem will be that when you turn the lights back up, they will not be pleased about having to stop watching Russell Crowe and instead start watching you!

I usually introduce game theory by pointing out that most of the models so far do not pay much attention to strategic interaction between competitors. Models of perfect competition, and even imperfect competition, look at what is the best smart choice for a single business, not considering how competitors might react to that choice, or how the business might then respond to the competitors’ reactions. Game theory is about strategic interaction.
The “game” in the movie clip is how each of the 4 guys in the bar can get lucky (they use a different l-word) and go home with the girl of his choice. When a group of 5 girls, including one blonde, walk in, the strategy discussion turns to who will get the blonde. Nash figures out that if each guy pursues his own self-interest and goes for the blonde, they will block each other and no one gets her. The other girls will spurn subsequent advances because no one likes to be second best. But if the 4 guys each go for one of the other 4 girls, and trust each other to ignore the blonde, they all can get lucky. But trust in your fellow competitors is key. After hearing Nash’s ideas, another one of the guys says, “Nash, if this is some way for you to get the blonde on your own, you can go to hell!”
Each player in this game has two choice, cooperate (and ignore the blonde for the good of the group) or cheat on the agreement (and go for the blonde and forget the group). The payoffs are in getting lucky or not. By the time you switch to the traditional prisoner’s dilemma example in the textbook, students will have a much better interest in, and understanding of, the principles of game theory.
The online Dynamic Study Modules (http://media.pearsoncmg.com/intl/pec/mylab/2016c/cohen2ce/micro/mmnd_html/ dynamic_study_modules.html) are created generically for any Canadian economics text. Modules students can work through with some (not all) content related to Chapter 10:
• Oligopoly
• Monopoly
Teaching Blog Check out economicsforlife.ca for new media stories, related discussion questions, and other active learning ideas. All posts are tagged by textbook chapters and topics.
10.1 Size Matters: Market Failure and Natural Monopolies
Learning Objective
Main Point
Key Terms
Define market failure and explain the challenge for policymakers of a natural monopoly.
Natural monopolies are a market-failure challenge for policymakers — gain the low-cost efficiencies of economies of scale, but avoid the inefficiencies of monopoly’s restricted output and higher price.
Market failure
when markets produce outcomes that are inefficient or inequitable
Natural monopoly economies of scale allows only a single seller to achieve lowest average total cost
Crown corporations publicly owned businesses in Canada. Achieve economies of scale, but lack of competition weakens incentives to reduce costs or innovate.
Rate of return regulation sets price allowing regulated monopoly to just cover average total costs and normal profits
Discussion or Homework Q&A
1. Q. Canada Post has a legal monopoly over delivering letters to private homes from coast to coast. The price of a stamp in Dease Lake, B.C., is exactly the same as in Glace Bay, Nova Scotia. A review of Canada Post tried to determine whether postal service should be deregulated and opened to competition.
a. If postal service were deregulated, why would a private business charge different prices in different regions of the country? What regions would likely experience a price increase?
b. Some international evidence suggests that deregulation will not lead to cheaper rates or better service. In Sweden, deregulation almost immediately led to the doubling of the price of a stamp. Does this evidence support the publicinterest view or the capture view of government regulation?
A. a. Canadians who live in rural communities will likely pay higher prices to cover higher delivery costs.
b. This would support the public-interest view of government regulation, since prices were lower under public ownership, possibly due to economies of scale.
2. Q. The telecommunications regulatory body in Canada — the Canadian Radiotelevision and Telecommunications Commission (CRTC) — supports the move toward greater competition but retains control over telecom prices.
a. Until the late 1990s, prices of telecommunication services were set by the CRTC at levels that covered total costs. Explain why linking prices with costs would have reduced supplier incentives to develop cost-saving technology.
b. The telecommunications industry had a slow rate of entry of new competitors into local residential service. Some argue that if prices were allowed to rise, more competitors would enter. Explain why price regulation holds back the progress toward a more competitive industry.
A. a. Suppliers would not need to invest in cost-saving innovations because consumers would be required to pay higher prices when costs increase.
b. If prices were allowed to rise, then businesses would make higher profits, and higher profits would attract new businesses and make the industry more competitive.
Refresh questions follow on the next page.
Refresh Q&A
10.1.1
Q. What is a natural monopoly, and how does it help consumers?
A. A natural monopoly is a business where the technology allows only a single seller to achieve lowest average total cost. Monopolies usually have economies of scale — their average total costs fall as quantity of output increases. Consumers benefit when the natural monopoly charges a lower price (because of the lower average total cost) than would be possible with more sellers in the market.
10.1.2
10.1.3
Q. In your own words, explain the challenge facing government policy makers in dealing with natural monopolies.
A. The challenge is to gain the low-cost efficiencies of economies of scale that are only possible with a single seller, but avoid the inefficiencies that usually come with a monopoly (single seller) — reduced output and higher price.
Q. Identify one regulated private monopoly you buy services from. Find out from its website everything you can about its costs and the regulations under which it operates. Do you think its services could be improved? Explain your answer.
A. Your answer depends on the province in which you live. See the list on page 258 of the textbook. Be sure to think about the services you receive from the regulated private monopoly you chose and how you think they could be improved by competition. Was there anything on the monopoly’s website about its costs and regulations that surprised you?
10.2 Cooperate or Cheat? Prisoners’ Dilemma and Conspiracies
Learning Objective
Explain how strategic interaction between competitors complicates business decisions, creating two smart choices.
Main Point
Key Terms
Strategic interaction among competitors complicates business decisions, creating two smart choices — one based on trust and the other based on lack of trust.
Game theory
a mathematical tool for understanding how players make decisions, taking into account what they expect rivals to do. Gasoline pricing is a strategic decision that can be understood using game theory.
Prisoners’ dilemma
a game with two players who must each make a strategic choice, where results depend on the other player’s choice
Nash equilibrium outcome of a game in which each player makes her own best choice given the choice of the other
Discussion or Homework Q&A
1. Q. Consider the strategic game that your local gas station owners play.
a. Explain why gas station owners cooperate.
b. Explain why collusion hurts consumers, and why collusion rarely lasts.
c. Try to summarize the strategic game and outcome in one sentence using as many c-words as you can
A. a. By implicitly agreeing to keep prices high, gas station owners can get more from consumers without fearing that they will lose their consumers to a nearby gas station.
b. Cooperation or collusion keeps prices high for consumers. Collusion rarely lasts because if owners don’t trust one another, they have an incentive to cheat on the cartel agreement, which leads to lower prices.
c. Gas stations charge high prices when cooperating or colluding with competitors through cartels but should cheat on the cartel if they cannot trust competitors or be trusted. (Answers vary).
2. Q. Jack and Jill are high school sweethearts who are going away to school in different cities. Jack and Jill both have two options: they can cheat (on one another) or be faithful. Values (or levels of happiness) can be assigned to these strategic choices. Both of them rank the outcomes of the strategic choices as follows:
• 4 happy-points: s/he cheat but the partner is faithful
• 3 happy-points: both are faithful
• 2 happy-points: both cheat
• 1 happy-point: s/he is faithful but the partner cheats
a. Construct a table that is similar to Figure 10.1 on p. 261 of the textbook, where the choices are Cheat and Faithful.
b. Suppose Jill learns that Jack cannot be trusted. What strategic choice would give her more happiness: cheating or being faithful? Why?
c. Suppose Jill learns that Jack can be trusted. What strategic choice would give her more happiness: cheating or being faithful? Why?
d. Explain what the Nash equilibrium outcome is in this game.
e. Explain how this game and outcome is similar to two businesses deciding whether to cheat or cooperate on a collusive agreement.
The answer and Refresh questions follow on the next page.
2. A. Jill
Cheat (2, 2) (4, 1)
Jack
Faithful (1, 4) (3,3)
b. If Jill suspects that Jack will cheat, then Jill should cheat because cheating gives her 2 units of happiness and being faithful gives her only 1 unit.
c. If Jill suspects that Jack will be faithful, then Jill should cheat because cheating gives her 4 units of happiness and being faithful gives her only 3 units.
d. The Nash equilibrium occurs where Jill and Jack both cheat.
e. If businesses cannot trust one another, then both will end up cheating on the collusive agreement, which gives lower profits (or happiness) than the outcome where both trust one another and cooperate.
Refresh Q&A
10.2.1
Q. In your own words, explain the idea of the prisoners’ dilemma.
A. The prisoners’ dilemma is a game with two players who must each make a strategic choice, where the results depend on the other player’s choice. Two criminals, Bonnie and Clyde, are caught robbing a bank. The police suspect they murdered a bank teller in a previous robbery, but don’t have the evidence to prove it. The detective in charge has a plan to get Bonnie or Clyde to confess to the murder. He places the prisoners in separate rooms, with no ability to communicate with each other. He then sets up rewards (reduced jail time) for cooperating with the police by confessing, and penalties (more jail time) for denying the murder charge if the other prisoner confesses. The detective’s plan is to build up mistrust between Bonnie and Clyde, and to get each one to worry the other will confess. The “dilemma” is that each prisoner is motivated to confess, but both would be better off if they could trust each other to deny. There are two smart choices in the game: confess if you don’t trust the other, but deny if you do trust the other.
10.2.2 Q. What is a Nash equilibrium?
A. A Nash equilibrium is the outcome of a game where each player makes her own best choice given the choice of the other player.
10.2.3 Q. Other than in setting gas prices, what is another competitive area where this situation might arise? Explain, using game theory, the two smart choices available to the players in the competitive area you selected.
A. Any competitive situation can be used where there are benefits to colluding and raising prices (the trust outcome), but greater individual business benefits to cheating on the agreement if the other player sticks to the agreement.
10.3 C–Words Everywhere: Cartels, Collusion, Cheating, Competition Law, Caveat Emptor
Learning Objective
Explain how governments use laws and regulations to promote competition, discourage cartels, and protect the public from dangerous business practices.
Main Point
Key Terms
Governments use laws and regulations to try to promote competition, discourage cartels, and protect the public from dangerous business practices.
Collusion conspiracy to cheat or deceive others
Cartel association of suppliers formed to maintain high prices and restrict competition.
OPEC (Organization of Petroleum Exporting Countries) is an international cartel that acts like a monopoly.
Caveat emptor “let the buyer beware” the buyer alone is responsible for checking the quality of products before purchasing
Discussion or Homework Q&A
1. Q. Adam Smith is often described as a supporter of free markets and opposed to government intervention. Look at the Smith quote on p. 263 – “People of the same trade seldom get together, even for merriment and diversion, but the conversation ends in a conspiracy against the public, or in come contrivance to raise prices.” What do you think of Smith’s quote? Do you think Smith would support a role for government like enforcing the Competition Act?
A. This is more of a question to stimulate discussion rather than a homework question. The point it to get students to think critically about the legal framework necessary for the efficient functioning of “free” markets. For the record, Smith was critical of the corrupt Mercantilist government of his era, but also believed that the legal institutions of a country must provide incentives for channeling self-interest towards the public good. He would have approved of the Competition Act
2. Q. Supporters of free markets often support the principle of caveat emptor – let the buyer beware. What do you think of the principle, especially in the face of evidence of businesses that don’t enforce safety standards, or allow harmful ingredients in products or medicines?
A. Again, this is more of a question to stimulate discussion rather than a homework question. The point it to get students to think critically about the consequences of allowing totally “free,” unregulated markets. Absolute government control has its own problems, so the point is not to force students to take a “for or against” or “black and white” position, but to think about the issues involved, for which there are no simple solutions.
Refresh Q&A
10.3.1
10.3.2
Q. Outline the two kinds of anti-competitive offences in the 1986 Competition Act, and explain the basic difference between them.
A. The two kinds of anti-competitive offences in the 1986 Competition Act are:
1. criminal offences (price fixing, bid rigging, and false or misleading advertising)
2. civil offences (mergers, abusing a business’s dominant market position, and other actions that lessen competition)
Civil offences are difficult to distinguish from regular competitive behaviour by businesses.
Q. Do you agree with the principle of caveat emptor? Explain your answer, providing details from both sides of the argument.
A. This is a normative decision based on your values. One side of the argument is that it is the consumer’s responsibility to be careful about the quality of what he or she buys. If the government tried to regulate all products and services, you believe that the additional costs of regulation are greater than the additional benefits of protection. The other side is that whatever the costs of government regulation, the benefits of saving lives by reducing the quantity of harmful and unsafe products are greater than the costs.
10.3.3
Q. Construct a payoff matrix (similar to Figure 10.1) for two oil companies forming a cartel, where the single strategic choice is to collude (stick to an agreement to restrict output and raise prices) or to cheat on the agreement. Your payoffs should be made-up, reasonable numbers of the expected financial profits of each combination of player choices. Explain the difference between the Nash equilibrium of the game and the outcome that would be best for the two oil companies.
A. In this example, the two oil companies are Slick and Rig. Their choices are to cheat on the agreement or collude (stick to the collusive agreement to restrict output and raise prices). The payoffs are in millions of dollars.
Cheat (0, 0) (5, -2)
Collude (-2, 5) (4, 4)
If Rig cheats, Slick’s best choice is also to cheat ($0 is better than –$2). If Rig colludes, Slick’s best choice is still to cheat (+$5 is better than +$4). Similarly, no matter what Slick’s choice, Rig’s best choice is to cheat. The Nash equilibrium is that both companies cheat, and earn $0 in economic profits (the competitive outcome). But both companies could be better off if they could trust each other and collude (+$4 each). The numbers in your example will be different. What is important is that you choose the payoff numbers so that both players are driven to choose the cheat option, and that the payoff numbers (for profits) from the cheat option are higher than the payoff numbers for the collude option.
Slick
10.4 Pick Your Poison: Market Failure or Government Failure?
Learning Objective
Differentiate between the public-interest view and the capture view of government regulation.
Main Point
Key Terms
The public-interest view of government regulation suggests government actions improve market-failure outcomes, while the capture view suggests government actions produce government failure.
Public-interest view
government regulation eliminates waste, achieves efficiency, and promotes the public interest
Capture view
government regulation benefits the regulated businesses, not the public interest
Government failure when regulations fail to serve public interest
Discussion or Homework Q&A
1. Q. When tuition fees in Ontario professional programs were deregulated in 1998, fees rose dramatically in the professional programs of medicine, dentistry, and law. In contrast, Quebec and British Columbia largely kept regulated tuition fees, and fees fell among these programs. Does this evidence support the public-interest view or the capture view? Explain.
A. This evidence supports the public-interest view because government actions (regulating tuition fees) resulted in market outcomes favourable to the public (lower price of education).
2. Q. A report commissioned by the Government of Ontario recommended eliminating Ontario Hydro (a government-owned monopoly) and opening the electricity market to competition. The Ontario government then opened electricity to competition in 2002.
a. Politicians promised that electricity reform would lower prices immediately. If the generation of electricity is not a natural monopoly, would competitive forces likely lower prices? Why or why not?
b. Does the public-interest view or the capture view support the politicians’ position above? Why or why not?
c. When the electricity market opened in May, wholesale prices averaged 3.01 cents per kilowatt hour. By July, prices more than doubled, due to an especially hot summer, reduced domestic generating capacity, and increasing imports. The Ontario government reacted in December by capping retail prices at 4.3 cents per kilowatt hour, with transmissions and distribution rates frozen at existing levels. Some have argued that the regulated prices were below the marginal opportunity cost of producing electricity. If this is the case, how might private electricity suppliers respond to the price freeze?
A. a. If the market for electricity is not a natural monopoly, then privatizing electricity generation will result in lower prices as competitors try to attract customers through lower prices.
b. The capture view supports this position. The capture view of government regulation supports the position that regulated prices and profits are higher than they should be, so deregulation results in lower prices. The public-interest view would not support this position because it believes government regulation is efficient.
c. If prices were below marginal opportunity costs, producers would not produce electricity because additional costs exceed additional benefits.
Refresh Q&A
10.4.1 Q. Explain the public-interest and capture views of government regulation.
A. According to the public-interest view, government regulation eliminates waste, achieves efficiency, and promotes the public interest. According to the capture view, the regulators are “captured” by the industry they are supposed to regulate, so that government regulation benefits the regulated businesses instead of the public interest.
More refresh questions follow on the next page.
10.4.2
10.4.3
Q. If a previously regulated industry is deregulated, and we observe that prices rise and output falls, which view of government regulation does that evidence support? Explain why.
A. A previously regulated industry is de-regulated, and prices rise and output decreases. That means that while the industry was regulated, prices were lower and there was more output. That evidence supports the public-interest view of government regulation. Once the regulations end, there may be collusion in the industry to restrict output and raise prices.
Q. In Chapter 5, we observed that a conservative politician on the political right might value efficiency more than equity, while a left-leaning politician might value equity more than efficiency. Which of the two views on government regulation — public-interest or capture — do you think a conservative politician is more likely to hold? Which view is a left-leaning politician more likely to hold? Explain your answers.
A. Your opinions and explanations may vary. In general (there are many exceptions), conservative politicians favour a limited role for government, and are suspicious of the ability of government to produce outcomes that are as efficient as market outcomes. The capture view of government regulation is more consistent with this mistrust of big government. In general (there are many exceptions), left-leaning politicians favour a bigger role for government to make up for the failures of markets, especially to produce equitable outcomes. The public-interest view of government regulation is more consistent with this trust in government to improve on market outcomes.
11 Acid Rain on Others’ Parades: Externalities, Carbon Taxes, Free Riders and Public Goods
Learning Objectives
1. Describe how externalities cause market failure, so smart private choices differ from smart social choices.
2. Explain the rule for coordinating private choices with smart social choices when there are negative externalities.
3. Identify how government policies for polluters can internalize externalities to create smart social choices.
4. Explain how positive externalities create the free-rider problem of public goods and cause markets to fail.
5. Identify how government subsidies can internalize positive externalities to create smart social choices.
Lecture Narrative
In this second of three chapters on market failure, Chapter 11 highlights the importance of Key 3 (externalities) for making smart personal and social choices about pollution, the tragedy of the commons, and public goods. After revisiting Chapter 4’s invisible hand conclusion about personal self-interest producing good social outcomes, I ask why markets also produce “bads” like pollution and traffic jams. The basic answer has to do with missing property rights. Smart personal choices are not the same as smart social choices, for both negative and positive externalities. The smart policy rule for any form of externality is: choose the quantity of output where marginal social cost equals marginal social benefit.
I discuss policy options for remedying the market failure of pollution (carbon taxes and cap-and-trade systems), and emphasize the principle behind all policies —internalize the externality by having the government compensate for missing property rights. For positive externalities, I explain free riders and motivate the presentation with the question of why markets won’t produce lighthouses. There is a detailed numerical education example of public goods showing the differences between smart private and social choices, pointing out the role for government and examining subsidies and public provision as policy options.
Graphs, Tables and Illustrations
Key:
G - Graph(s) For titles in blue, Narrated Dynamic Graph videos are available online.
T - Table
Narrated Dynamic Graphs are identified with a blue video button. To access them, log into the Pearson course website (pearsonmylab.com), click on Chapter Resources, and then Chapter 11.
Learning Suggestions
Economic Experiments
Dynamic Study Modules
Teaching Blog
There is an abundant supply of media stories on global warming, carbon taxes, cap-and-trade, traffic congestion, the declining east-coast fishery, and other externality-related topics. Two fundamental issues underlie all of the stories. One is the lack of property rights. The other is the opportunity cost of tackling problems of negative externalities. This chapter is close to the end of the book, so it is appropriate to return to, and reinforce, the single-most-important-concept-in-all-of-economics from the first chapter – opportunity cost.
Opportunity cost is at the heart of the scenario opening the chapter – we can have a world without pollution if we are willing to drastically reduce our standard of living. The informed question is: how do you find the efficient level of pollution that balances the environmental benefits of lower pollution with the opportunity costs of lower living standards.
The importance of trade-offs is dramatically clear in the Economics Out There story about DDT on p. 285. Try organizing a debate in your class. One side must defend the decision to ban DDT to protect the environment. The other side must defend the use of DDT, with the most important argument being the millions of childrens’ lives that will be saved from reduced malaria outbreaks. What is most important is getting students to face the fact that there are no easy solutions to many externality problems. The lesson is to never make a choice, including environmentally friendly choices, without considering the opportunity costs.
By returning to the concept of opportunity cost, you increase the chances of your students remembering the concept 5 years (or more!) after finishing your course.
See the Public Goods Experiment at http://media.pearsoncmg.com/aw/aw_myeconlab/experiments/instructor/expinstr.html
Students learn that it is difficult to fund pubic goods (street lights, national defense). There is a tension between self interest and social interest. It’s tempting to rely on your neighbor, creating incentives to free ride on the actions of others. There are ways to reduce free riding, but most fail. A government enforced tax is the most effective way to reduce free riding and fund public goods.
The online Dynamic Study Modules (http://media.pearsoncmg.com/intl/pec/mylab/2016c/cohen2ce/micro/mmnd_html/ dynamic_study_modules.html) are created generically for any Canadian economics text. Modules students can work through with some (not all) content related to Chapter 11:
• Externalities
• Public Goods and Common Resources
Check out economicsforlife.ca for new media stories, related discussion questions, and other active learning ideas. All posts are tagged by textbook chapters and topics.
11.1 Handcuffing the Invisible Hand: Market Failure with Externalities
Learning Objective
Describe how externalities cause market failure, so smart private choices differ from smart social choices.
Main Point
Key Terms
When externalities exist, prices don’t reflect all social costs and benefits; markets fail to coordinate private smart choices with social smart choices.
Negative externalities (external costs)
costs to society from your private choice that affect others, but that you do not pay
Positive externalities (external benefits) benefits to society from your private choice that affect others, but that others do not pay you for
Discussion or Homework Q&A
1. Q. Two prairie pioneers, Jethro and Hortense, have adjacent fields. Because they get along so well and always work out any problems that arise, they have not bothered to put up a fence. Then one day Jethro buys a new pig, Babe. Babe sometimes wanders into Hortense’s field and eats her corn. If Babe would only stay on Jethro’s farm, he would eat valueless garbage. Suppose that Babe eats $500 worth of Hortense’s corn per year (a negative externality imposed on Hortense) and that to build a fence between the farms costs $300. No property rights to keep animals off the fields have been established yet.
a. If the property right is given to Jethro so Babe can continue to wander, will Hortense build a fence? Explain.
b. If, instead, the property right is given to Hortense, so that she can charge Jethro for the corn Babe eats, will Jethro build a fence? Explain.
c. Does it matter who gets the property right?
A. a. Hortense will build a fence. Although the fence costs $300 per year, it saves her the $500 in lost corn that Babe would otherwise eat.
b. Jethro will build a fence. $300 per year is less than the $500 per year he would have to pay Hortense for Babe’s wanderings.
c. No, it does not matter who gets the property right. The fence will be built either way. This is an illustration of a concept called the Coase theorem — if transactions costs are low, property rights are established and there are no externalities, then an efficient outcome occurs regardless of who is assigned the property right. Because Jethro and Hortense can work out their problems amicably, transactions costs are low. Building a fence eliminates the negative externality of the wandering pig and occurs regardless of which pioneer is assigned the property right. The outcome is efficient because, for this one decision, the $300 cost to society of the fence is less than the $500 cost of consumed corn.
2. Q. What is the tragedy of the commons problem, and why does it occur? Use the example of ocean fisheries to illustrate your explanation.
A. The tragedy of the commons—the overuse and depletion of a common resource—occurs because no one has an incentive to conserve and use a shared resource sustainably. In the fishing example, each fisherman has an incentive to continue fishing until the marginal benefit (revenue from selling an additional tonne of fish) equals his marginal cost—the additional cost of keeping a boat and crew at sea long enough to catch an additional tonne of fish. But for each tonne he catches, he doesn’t take into account the external cost of stock depletion that makes it harder and more costly for others to catch fish.
Refresh questions follow on the next page.
11.1.1
Q. Explain why economists also call negative externalities “spillover” effects.
A. A negative externality is a cost to society from your private choice that “spills over” onto others, but that you do not pay. Negative externalities, like pollution from your car exhaust, are external costs that spill over onto people external to the original activity (the activity of your driving or your purchase of a car). A positive externality is a benefit to society from your private choice that “spills over” onto others, but that others do not pay you for. Positive externalities, like the reduced traffic from your taking public transit, are external benefits that go to people external to the original activity (your transit ride).
11.1.2
11.1.3
Q. Talking in large lecture halls is a problem, both for instructors who can’t concentrate and attentive students who can’t hear. Can you explain this problem in terms of externalities? Why is this problem hard to solve?
A. The noise in large lecture halls from talking is a negative externality. It is a nuisance or cost that affects others who are not part of your “private” conversation, and you do not pay for the cost. This problem is hard to solve because it is impossible to monitor every private conversation, and difficult to impose costs or penalties on those responsible for disturbing other students and teachers. The noise problem is similar to pollution or global warming problems.
Q. Many condominiums have strict rules about the colour of window coverings. Explain this rule in terms of externalities. Is it fair to restrict the owner’s choices in this way? Explain your answer.
A. Rules about the colour of outward-facing window coverings in condominium arise because if every owner chooses a different colour, the outside of the building looks like an awful, jumbled mess. Besides the aesthetics, the unattractive look of the building can affect property values, and make it harder for someone, even with neutral white window coverings on their own windows, to sell their condo. In other words, window coverings have external costs (when they are ugly) and external benefits (when they are coordinated and tidy). There is a certain fairness in restricting the choices of property owners because their choices are not entirely private — their choices affect other owners who are external to any individual property owner’s choice of window covering.
11.2 Why Radical Environmentalists Dislike Economists: Efficient Pollution
Learning Objective
Explain the rule for coordinating private choices with smart social choices when there are negative externalities.
Key Terms Main Point
For an efficient market outcome when there are negative externalities, choose the quantity of output where marginal social cost equals marginal social benefit.
Marginal social cost
marginal private cost (MC) plus marginal external cost
Marginal social benefit
marginal private benefit (MB) plus marginal external benefit
Discussion or Homework Q&A Refresh Q&A
1. Q. Your roommate is an environmentalist who is appalled at the economic concept of an “efficient” level of pollution. She argues that since everyone agrees pollution is “bad,” society must work toward eliminating all pollution. How would you, as an economics student, convince her that it is not in society’s best interests to eliminate all pollution?
A. • We all want to eliminate pollution, all other thing equal, but every action, including reducing pollution, has a cost. Once again, the key concept underlying the economic argument is opportunity cost. What is the opportunity cost of reducing pollution, or what does society have to give up to achieve a pollution-free environment?
• Small reductions in pollution are relatively inexpensive—eliminating lead from gasoline and paint, conserving energy to reduce output from coal-fired electrical plants, etc. But to eliminate all pollution would mean eliminating all cars and airplanes, outlawing all power except solar and hydroelectric power, shutting down most factories, etc. The cost of eliminating all pollution is enormous, and that additional cost is far greater than the additional benefits from further reductions in pollution. Therefore some level of pollution is efficient. Pollution is part of the opportunity cost of the benefits we receive from driving or flying instead of walking, from enjoying the comfort of air conditioning in hot weather, and from enjoying goods produced in factories. The efficient level of pollution balances the marginal social cost of the pollution against the marginal social benefit of the production and consumption associated with that level of pollution.
2. Q. The Carbon Tax Center (CTC) estimates that the price elasticity of gasoline demand is 0.4 and the price elasticity of electricity demand is 0.7. Since these figures are less than 1, this means that demand is inelastic — a large increase in price produces a smaller decrease in quantity demanded.
a. What does this imply about the size of the carbon tax necessary to induce large decreases in emissions?
b. These estimates are “long-run” elasticities. Are elasticities smaller or larger over the long run?
A. a. Since demand is inelastic, a very large tax (increase in price) is required to reduce emissions.
b. Price-responsiveness grows over time, as households have opportunities to buy more fuel efficient vehicles and appliances.
11.2.1
Q. Explain the rule for coordinating private choices with smart social choices when there are negative externalities.
A. The rule for finding efficient combinations of output and pollution is: Choose the quantity of output where marginal social cost equals marginal social benefit. Marginal social cost includes both marginal private cost as well as marginal external costs (of pollution).
More questions follow on the next page.
Refresh Q&A (continued)
11.2.2
11.2.3
Q. If the marginal external cost of pollution in Figure 11.1 were $60 per tonne instead of $30 per tonne, what would be the smart choice for society of pulp output? What would be the smart price of a tonne of pulp?
A. In Figure 11.1, if the marginal external cost of pollution is $60 per tonne instead of $30 per tonne, the numbers in the last column (Marginal Social Cost) are each $30 more. If we then find the quantity where marginal social cost (last column) equals marginal social benefit (third column), it is at 2 tonnes of pulp output per day, with MSC = MSB = $120.
Q. What position on DDT would you support (see story from Economics Out There, page 285)? What additional information might you need before deciding?
A. Individuals will have different positions on DDT depending on the values they place on protecting the environment (and saving lives in the future) versus saving lives now (at the expense of the environment). Different positions are possible because there are trade-offs that most of us don’t think carefully about. Never make a choice, including environmentally friendly choices, without considering opportunity costs. You often need additional information to be able to properly consider opportunity costs.
11.3 Liberating the Invisible Hand: Policies to Internalize the Externality
Learning Objective
Identify how government policies for polluters can internalize externalities to create smart social choices.
Main Point
Key Terms
If polluters are forced by government to pay the marginal external costs of their pollution, this internalizes the externalities/costs into private choices, creating smart social choices.
Emissions tax
tax to pay for external costs of emissions
Carbon tax
emissions tax on carbon-based fossil fuels
Internalize the externality transform external costs into costs the producer must pay to the government
Cap-and-trade system limits the quantity of emissions businessescan release into environment
Discussion or Homework Q&A
1. Q. The production of steel also produces pollution and generates external costs. Suppose government attempts to solve the problem by imposing a tax on steel producers. At the after-tax level of output, we observe the original marginal social cost curve is below the demand curve. Is the after-tax level of output efficient? If not, should steel production, and therefore pollution production, be increased or decreased?
A. Since the marginal social cost curve is below the demand curve at the after-tax output, marginal social cost is less than marginal benefit. This means that the tax has been set too high; it has been set at a level in excess of the external cost. As a result, the after-tax level of steel production will be less than the efficient level. The level of steel production and pollution production should be increased by decreasing the amount of the tax.
2. Q. The New Democratic Party of Canada supports a cap-and-trade system that forces big industrial polluters to buy credits from companies that can reduce emission. “Our plan is based on our consistent commitment to price carbon through a cap-and-trade system, ensure we reduce pollution, generate revenues for green solutions, and help ensure sustainability for future generations.”
a. How are prices set in a cap-and-trade system?
b. Why might a cap-and-trade system be difficult to administer?
c. How do carbon taxes and cap-and-trade systems differ with regard to how price and quantity are determined?
d. Which policy is more likely to guarantee that a nation accomplishes its emission targets?
A. a. The trading market would set a price for carbon emissions based on the supply and demand of permits.
b. Thousands of companies are involved in the buying and trading of permits, and “haggling” over price.
c. With a cap-and-trade system, the government has direct control over quantity, and price adjusts. With a carbon tax, the government has direct control over price, and quantity adjusts.
d. The cap-and-trade system guarantees the emissions quantity targets will be met because the government sets an overall limit on the amount of carbon dioxide that can be pumped into the atmosphere.
Refresh Q&A
11.3.1
Q. Explain what the phrase “internalize the externality” means for a polluting business. Give an example of how government policies like emissions taxes “internalize externalities” for polluters to create smart social choices.
A. A carbon tax, which must be paid by anyone using carbon-based fossil fuels, is an example of an emissions tax (a tax to pay for the external costs of emissions). A smart carbon tax is set equal to the marginal external cost of the damage that results from using a particular quantity of fuel. The tax forces the fuel user to pay for the external damage they cause by using the fuel, thus internalizing the externality.
More questions follow on the next page.
11.3.2
11.3.3
Q. Some environmental groups try to expose businesses that pollute while supporting environmentally friendly businesses by posting information and photos on public websites. Explain how this strategy may “internalize the externality” for the polluters even without government action.
A. The strategy of publicly exposing polluting businesses and supporting environmentally friendly businesses is a different form of “internalizing the externality.” If the publicity causes consumers to not buy from polluting businesses (a cost to the businesses in lost sales) and to buy more from environmentally friendly businesses (a benefit to the businesses), then what had been external costs and benefits become internal to the businesses. Their external costs and benefits come back to affect each business’s bottom line of profits. Therefore, the strategy internalizes both the negative and positive externalities.
Q. While carbon taxes and cap-and-trade systems have the same objective, governments and political parties differ over which policy they support. Which policy would a political party have to adopt to gain your vote? Explain your reasons.
A. Check out the most recent positions of the political parties by looking at their websites. The question of which position makes the most sense to you will depend on your values, the value you place on the environment versus economic growth, and other trade-offs.
11.4 Why Lighthouses Won’t Make You Rich: Free Riders and Public Goods
Learning Objective
Explain how positive externalities create the free-rider problem of public goods and cause markets to fail.
Main Point
Key Terms
With positive externalities, buyers and sellers are not paid for the external benefits their exchange creates. The marketclearing price is too high for buyers to be willing to buy the socially best quantity of output, and too low for sellers to be willing to supply.
Public goods provide external benefits consumed simultaneously by everyone; no one can be excluded Free-rider problem markets underproduce products and services with positive externalities
Discussion or Homework Q&A
1. Q. What is the free-rider problem?
A. The free-rider problem is the problem of markets underproducing a public good because there is little incentive for individuals to pay for the good. There is nothing to prevent the person from being excluded from consuming the good, or from getting a free ride.
2. Q. The first two columns of the table below give the demand curve for education in Hicksville, while the third column gives the marginal social cost. Since education generates external benefits, marginal social benefit in the last column is greater than marginal private benefit.
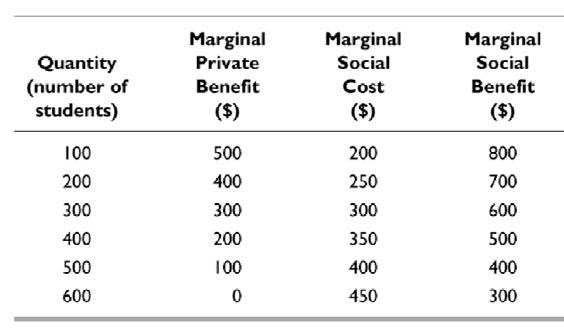
a. What is the equilibrium price and quantity if the market for education is unregulated?
b. What is the efficient quantity of students in Hicksville?
A. a. In an unregulated market, equilibrium price and quantity are where Marginal Private Benefit equals Marginal Price Cost (which is the same as Marginal Social Cost because there are no negative externalites). The equilibrium price is $300; the equilibrium quantity is 300 students.
b. Since there are no external costs, the efficient quantity is where Marginal Social Benefit equals Marginal Social Cost. The efficient quantity of students is 500 students.
Refresh Q&A
11.4.1
Q. Explain how the free-rider problem of public goods causes markets to fail.
A. A free rider is someone who does not have to pay for external benefits. The free-rider problem is that markets underproduce products and services with positive externalities (that free riders benefit from, but do not pay for). The market outcome is that the price charged to buyers is too high, and the price received by sellers is too low.
11.4.2
Q. Smart students often don’t like group projects. Explain why, using the concept of free riding.
A. Group projects suffer from the free‐rider problem. Weaker students try to “free ride” on the contributions of stronger students by sharing the group grade. Stronger students don’t like this situation because the weaker students’ lack of contribution may drag down the group grade. Even if the group grade is high, strong students resent that others received credit for work that was not their own.
More questions follow on the next page.
11.4.3
Q. Two physically identical houses can have very different values depending on their neighbourhoods. How do positive (or negative) externalities help explain this difference in property values?
A. Difference in property values of houses usually have little to do with the cost of the house itself. Land values are the source of most differences, and land values depend on the neighborhood. Houses in “good” areas, where incomes are high, services are plentiful, and schools are good, will have much higher property values than those in “bad” areas, which lack these desirable characteristics. There is a saying in the real estate business that the three most important features of a house are “location, location, and location.”
11.5 Why Your Tuition Is Cheap (Really!): Subsidies for the Public Good
Learning Objective
Identify how government subsidies can internalize positive externalities to create smart social choices.
Main Point
Key Terms
When there are positive externalities, government subsidies can get everyone to voluntarily choose the socially best quantity of output where marginal social benefit equals marginal social cost
Subsidy payment to those who create positive externalities
Public provision government provision of products or services with positive externalities, financed by tax revenue
Discussion or Homework Q&A
1. Q. Heritage Apartments has 100 residents who are concerned about security. The table below gives the total cost of hiring a 24-hour security guard service as well as the marginal benefit to each of the residents.
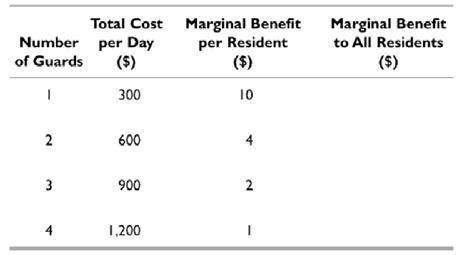
Why is a security guard a public good for the residents of Heritage Apartments?
a. Why will zero guards be hired if each of the residents must act individually?
b. Complete the last column of the table by calculating the marginal benefit of security guards to all of the residents together.
A. a. A security guard is a public good because, once hired, the benefits of increased security extend to all residents whether they pay or not. No one can be excluded.
b. If each resident must act individually in hiring a security guard none will be hired because each resident receives only $10 in benefit from the first guard, which costs $300 per day.
c. The entries in the last column of the table belw are come from multiplying the marginal benefit per resident by the number of residents, 100. This multiplication is the numerical equivalent of summing the individual marginal benefit curves vertically for each quantity of guards.
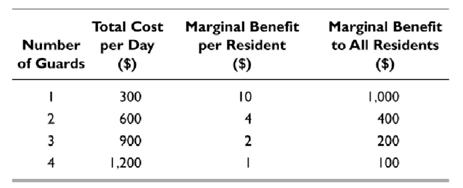
2. Q. The residents form an Apartment Council that acts as a governing body to address the security issue.
a. What is the smart (efficient) number of guards? What is the net benefit at the efficent number of guards?
b. Show that net benefit is less for either one less guard or for one more guard than for the optimal number of guards.
c. How might the Apartment Council pay for the guards?
A. a. If the Apartment Council hires each guard for whom the marginal benefit exceeds the marginal cost, they will hire the smart number of guards. The marginal cost of each additional guard is $300. The marginal benefit of the first guard is $1,000, so he will be hired. Similarly, the marginal benefit of the second guard is $400, and she will be hired.
The marginal benefit of the third guard is only $200, which is less than marginal cost. Therefore the efficient (smart) number of guards is two. For two guards, the net benefit is $800: total benefit ($1,400) minus total cost ($600).
b. For one guard, net benefit is $700: total benefit ($1,000) minus total cost ($300). For three guards, net benefit is also $700: total benefit ($1,600) minus total cost ($900). Thus the net benefit of $800 is greatest for two guards.
c. The Apartment Council might pay for the guards by collecting a security fee of $6 per day from each of the 100 residents in order to hire two security guards.
Refresh Q&A
11.5.1
Q. Explain how government subsidies can internalize positive externalities to create smart social choices using education as your example.
A. A smart government subsidy, to address the problem of a positive externality, equals the marginal external benefit of savings to others associated with an activity. To get a smart social outcome, the government can pay the subsidy to either the demanders or the suppliers of the activity. In the example of education, which creates positive externalities, the subsidy can go to either the schools or the students.
11.5.2
11.5.3
Q. What if the government gave the $3000 subsidy from Figure 11.4 directly to students instead of to schools? Construct a table like Figure 11.3, and discover whether the students’ private choices would still be the same as the smart choice for society. [Hint: The Marginal Private Benefit column shows willingness to pay. Create a new column showing willingness to pay with the subsidy (Marginal Private Benefit + Subsidy).]
A. If the $3000 subsidy were paid directly to students instead of to schools, Figure 11.4 would have the same third column of numbers, but with a new heading Marginal Private Benefit + Subsidy, instead of Marginal Social Benefit. This new column equals Marginal Social Benefit, as it adds the marginal external benefit to the marginal private benefit. If you find the quantity of educational output where Marginal Private Benefit + Subsidy equals Marginal Private Cost (same as Marginal Social Cost because there are no negative externalities), it will still be 500 students/year. Therefore, the outcome is the same whether the subsidy goes to the schools or to the students themselves.
Q. Some European countries have free tuition for post-secondary education. If you were a member of parliament defending this policy (knowing that any money needed to provide “free” education had to be raised by new taxes), what arguments would you make? If you defended the Canadian system, where students must pay some tuition, what arguments would you make?
A. The argument in favour of European free tuition for post-secondary education is that the positive externalities from education are so great and so widespread throughout society that government should subsidize education through general tax revenues. This is the same argument that leads governments in Canada to offer free primary and secondary education to all students.
The argument in favour of the Canadian system, where students still pay a small fraction of the costs of post-secondary education, is that while there are positive externalities, there are also private benefits students receive from education. These private benefits take the form of higher lifetime earnings. There is no justification for having taxpayers subsidize your higher lifetime earnings. This argument is more powerful if you consider that general tax revenues, which are collected from rich and poor, may go to subsidizing the tuition of well-off students who can easily afford the tuition that will make them even better off for the rest of their lives. There is an element of “reverse Robin Hood” (taking from the poor and giving to the rich) in the Canadian system and even more so in the European system.
12 What Are You Worth? Inputs, Incomes, and Inequality
Learning Objectives
1. Explain four types of income and how they are determined in input markets.
2. Explain the importance of marginal revenue product for labour income and for smart business hiring decisions.
3. Explain how to calculate present value and how it informs smart capital investment choices.
4. Describe economic rent, and explain its importance for determining land and superstar income.
5. Explain the sources of poverty and describe trade-offs in policies to help the poor.
Lecture Narrative
This final chapter returns to the circular flow diagram to explain income as a function of prices and quantities in input markets. It is important to stress the switch from output to input markets — where households are suppliers and businesses are demanders — otherwise students get confused by remembering consumers as demanders and businesses as suppliers. For the inputs labour, capital, land (and other resources), the goal is to explain the most important concept for each input’s income — marginal revenue product for labour, present value for capital, and economic rent for land. Income is a function of prices and quantities in input markets. Entrepreneur’s income (profits) is determined differently, as a residual.
I explain wages from businesses’ derived demand for labour, and use the Three Keys, especially Key 2’s marginal focus, to explain smart business hiring decisions. The recipe is: Hire additional inputs when marginal revenue product is greater than marginal cost (the wage). Returns to capital focuses on present value as essential for smart investment choices, when benefits are spread out over the future and cost is in the present. The recipe is: Invest when the present value of the stream of future earnings is greater than the price of the investment. Economic rent is a return to any input in relatively inelastic supply, which I illustrate with superstar salaries.
The final section presents income and wealth data. Even efficient market outcomes can yield serious inequality and poverty. I present this market “failure” as an efficiency/equity trade-off. After discussing education/training and progressive tax/transfer policies to help those who are poor, I explain the Robin Hood principle — take from the rich and give to the poor — and incentive effects as the opportunity costs of tax-changed income distributions. The normative question of should we help those who are poor uses the equity conceptions from Section 6.5. I outline “yes” and “no” answers that students will hear from left-leaning and conservative politicians, but which they must decide on personally. Their choices will depend on whether they are being taken from/given to, on equity conceptions (equal opportunity or equal outcomes), and on values about efficiency/equity tradeoffs.
Graphs, Tables and Illustrations
Key:
G - Graph(s)
For titles in blue, Narrated Dynamic Graph videos are available online on each Chapter Resources page.
I - Illustration
T - Table
Graphs and illustrations follow on the next page.
Narrated Dynamic Graphs are identified with a blue video button. To access them, log into the Pearson course website (pearsonmylab. com), click on Chapter Resources, and then Chapter 12.
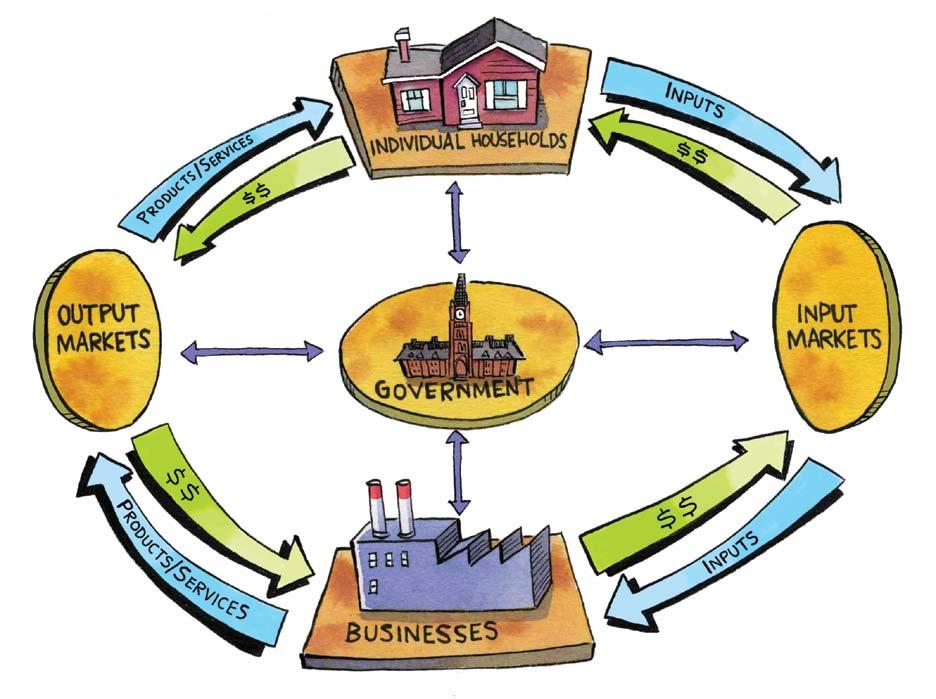
12.4a Marginal Revenue Product and the Wage Rate 12.4b Marginal Revenue Product Curve and Marginal Cost Curve
12.7 Percentage of 2006 Canadian Wealth Owned, by Family Deciles
12.9 Percentage of 2010 Total Canadian Income after Transfers and Taxes, by Family Quintiles
Active Learning Suggestions
Top Choice
Inequality is a hot topic since the “occupy Wall St.” movement, because of concerns about normative issues of fairness, and because of the macroeconomic impact on economic growth emphasized by Thomas Piketty’s 2013 Capital in the Twenty-First Century. Since this is a microeconomics textbook, I suggest having students read/watch the powerful and provocative research by James Heckman (Nobel Prize-winning economist at the University of Chicago) that is more microeconomic in nature and gets students thinking yet again about opportunity cost arguments. There is a brief summary in the Economics Out There on p. 157, and an accessible article is James Heckman’s, “The Economics of Inequality: The Value of Early Childhood Education,” American Educator (Spring 2011) (http://www.aft.org/sites/default/files/periodicals/Heckman.pdf). You can also show this short video, Personality Creates Productivity and Prosperity, to stimulate discussion – http://www.heckmanequation.org/ content/resource/personality-creates-productivity-and-prosperity.

Heckman argues passionately that governments should pay (unusual for a Chicago economist!) for early childhood education (ECE). His passion is more than a normative value judgment. Here is his argument.
“Traditionally, equity and efficiency are viewed as competing goals. . . . What is remarkable is that there are some policies that both are fair — i.e., promote equity — and promote economic efficiency. Investing in the early years of disadvantaged children’s lives is one such policy.”
Heckman’s research shows that inequality in early childhood produces inequality in a person’s adult ability, educational achievement, health, and success. The disadvantages that arise later in life because of a child’s genetic background, lack of parental involvement, or social environment can be overturned through investing in early childhood education.
Investment in ECE for disadvantaged children from birth to five years reduces achievement gaps, reduces the need for special education, increases the likelihood of healthier lifestyles, lowers crime rates, and reduces overall social costs from dealing with the problems of the adults these disadvantaged children become. Heckman estimates that every dollar invested in ECE yields a 7–10 percent per year return, higher than most investments. “We can invest early to close disparities . . . or we can pay to remediate disparities when they are harder and more expensive to close.” So using tax dollars to pay for ECE not only reduces inequality, it also increases efficiency, by saving more money for society than the costs of ECE.
Dynamic Study Modules
The online Dynamic Study Modules (http://media.pearsoncmg.com/intl/pec/mylab/2016c/cohen2ce/micro/mmnd_html/ dynamic_study_modules.html) are created generically for any Canadian economics text. Modules students can work through with some (not all) content related to Chapter 12:
• Factor Markets
• Capital Markets
• Making a Decision
• Earnings and Discrimination
Teaching Blog Check out economicsforlife.ca for new media stories, related discussion questions, and other active learning ideas. All posts are tagged by textbook chapters and topics.
12.1 Switching Sides: Incomes Are Prices and Quantities in Input Markets
Learning Objective
Explain four types of income and how they are determined in input markets.
Main Point
Key Terms
Incomes are determined by prices and quantities in input markets, where households supply to businesses labour, capital, land, and entrepreneurship in exchange for wages, interest, rent, and profits.
Flow
amount per unit of time
Stock
fixed amount at a moment in time
Discussion or Homework Q&A
1. Q. Households and businesses interact in two sets of markets: input markets and output markets.
a. Explain the difference in how households and businesses interact in the two markets.
b. Give an example of each type of market interaction.
A. a. In output markets, businesses sell their products and services to households. In input markets, businesses buy from households the inputs they need to produce products and services.
b. Gasoline station owners sell gasoline to households in exchange for money in the output market, and gasoline station owners pay workers in exchange for work in input markets
2. Q. a. What is the general formula for calculating the income of labour, capital or land inputs?
b. How is entrepreneur’s income different from other forms of income? What are the components of entrepreneur’s income?
A. a. The general formula is price X quantity. For example, the price for labour inputs is the wage rate, and the quantity is the number of hours worked.
b. Entrepreneur’s income does not fit the price X quantity formula. Entrepreneurs must earn normal profits to continue a business – earn as much for their invested time and money as they could earn elsewhere. But entrepreneurs are really after economic profits – the other component of their income. Economic profits are a reward for innovation and risktaking, and are a residual after paying all opportunity costs of production.
Refresh Q&A
12.1.1
Q. What are the two types of markets in the circular-flow road map? Identify the buyers and sellers in each market.
A. The two types of markets in the circular-flow road map are input markets and output markets. In input markets, households are sellers and businesses are buyers. In output markets, roles are reversed — households are buyers and businesses are sellers.
12.1.2
12.1.3
Q. If you have $10 000 in a savings account, and no other assets, what is your income from capital if the interest rate is 8 percent per year? What is your wealth at the end of the first year?
A. If you have $10 000 in a savings account and the interest rate is 8 percent per year, you receive a flow per year of $10 000 × 0.08 = $800 in interest income. Your wealth at the end of the year — the total value of all assets you own — is $10 800 = $10 000 plus the $800 in interest income, and is measured as a fixed amount at a moment in time.
Q. When Wahid (Chapter 7) started his own web business using his savings and a small inheritance from his grandfather, he played multiple roles on the circular-flow road map. Identify those roles as he set up his business, and the roles he continues to play as the business begins producing web services. What are his types of income?
A. As Wahid set up his business, he played the role of a household supplying his time, money, and entrepreneurship skills to his new business. As the business begins selling web services, Wahid plays the role of a business (and entrepreneur) operating in output markets. As a business, Wahid’s income takes the form of normal profits as compensation for his time and invested money, and (hopefully) economic profits if the business does well. If anyone other than Wahid (the entrepreneur) invests in the business, she plays the role of a household supplying capital in an input market, and her income takes the form of interest payments.
12.2 What Have You Done for Me Lately? Labour and Marginal Revenue Product
Learning Objective
Explain the importance of marginal revenue product for labour income and for smart business hiring decisions.
Main Point
Key Terms
For maximum profits, businesses should hire additional labour when marginal revenue product is greater than marginal cost.
Marginal product
additional output from hiring one more unit of labour
Diminishing marginal productivity as you add more of a variable input to fixed inputs, the marginal product of the variable input eventually diminishes
Marginal revenue product additional revenue from selling output produced by an additional labourer
Derived demand demand for output and profits businesses can derive from hiring labour
Discussion or Homework Q&A
1. Q. Suppose Gordon Ramsay, world-renowned chef and star of the TV series Hell’s Kitchen, is trying to determine how many assistant cooks to hire for a new restaurant.
a. Use the cliché “too many cooks in the kitchen” to describe the concept of diminishing marginal revenue product.
b. The table below describes the number of meals the restaurant could produce per hour, depending on how many cooks are hired. The price of a meal at the restaurant is $10. Because of his fame, Gordon Ramsay can sell as many $10 meals as he chooses to produce. Fill in the numbers for the white boxes.
Price of Meal = $10
c. If the cost of a cook is $90 per hour, how many cooks should be hired?
The answer to this question and more questions follow on the next page.
1 A. a. Diminishing marginal revenue product comes from diminishing marginal productivity. Adding more cooks to a fixed (input) kitchen, each additional cook has a lower marginal product (in crowded kitchen, fewer additional meals can be prepared).
b.
c. 2 cooks should be hired. For cooks 1 and 2, the marginal revenue product per hour ($120, $100) is greater than the hourly wage of $90. For cook 3, the marginal revenue product of $80 is less than the wage of $90, so total profits will decrease by hiring the 3rd cook.
2. Q. Using the same table of number in question 1 above, suppose the price of a meal rises to $12 instead of $10. How many cooks should be hired?
A. At $12 per meal, the marginal revenue product of each chef increases (marginal physical product does not change). The marginal revenue products are now $144, $120, $96, and $72. With a wage rate of $90, it now pays to hire 3 chefs, but not the 4th chef.
Refresh Q&A
12.2.1
12.2.2
12.2.3
Q. In your own words, define marginal revenue product.
A. Marginal revenue product is the additional revenue a business receives from selling output produced by additional labour. A labourer’s marginal revenue product equals his marginal product (quantity of output) multiplied by the price of output.
Q. In the example from Chapter 3, your boss is willing to pay you triple-time wages for working extra time. Explain the calculation she must have made in offering you that much money, assuming she was making a smart decision.
A. For a smart hiring decision, the rule is: Hire additional hours of labour (or any input) when marginal revenue product is greater than marginal cost (the wage, or price of the input). If your boss made a smart hiring decision when she was willing to pay you triple time, she estimated that your marginal revenue product was at least equal to that triple-time wage.
Q. In the example in Figure 12.3, what would happen to Wahid’s hiring decision if the price for which he could sell webpages rose from $15 per page to $20 per page? Declined from $15 to $10? Explain your answers.
A. In textbook Figure 12.3, Wahid’s smart choice is to hire three web designers, because for each of the first three web designers, their marginal revenue products per hour ($90, $75, and $60, respectively) are greater than the wage ($50). If the price of webpages rose from $15 per page to $20 per page, the marginal revenue products of the web designers would rise to $120 (first web designer), $100 (second web designer), $80 (third), $60 (fourth), and $40 (fifth), respectively. According to the rule for smart hiring decisions, Wahid would now hire four web designers instead of three, since the marginal revenue product of the fourth web designer is now greater than the wage of $50. Hiring more workers when sales and revenues are strong fits with usual business practices.
If the price of webpages fell from $15 to $10 per page, marginal revenue products of the web designers would fall to $60 (first web designer), $50 (second web designer), $40 (third), $30 (fourth), and $20 (fifth), respectively. According to the rule for smart hiring decisions, Wahid would now hire one or two web designers instead of three. The marginal revenue product of the first web designer is greater than the wage. The marginal revenue product of the second web designer is now equal to the wage of $50, so Wahid would be indifferent between hiring the second web designer or not. The marginal revenue product of the third web designer is less than the wage, so Wahid would definitely not hire three web designers.
12.3 All Present and Accounted For: Interest on Capital and Present Value
Learning Objective
Explain how to calculate present value and how it informs smart capital investment choices.
Key Terms Main Point
Present value tells you what money earned in the future is worth today. Present value compares the price you pay for today’s investment against the investment’s future earnings. For a smart choice, the present value of the investment’s future earnings is greater than the investment’s price today.
Present value
amount that, if invested today, will grow as large as the future amount, taking account of earned interest
Discount reduction of future revenues for forgone interest
Discussion or Homework Q&A
1. Q. A man named Alberto, dressed in a pin-striped suit and wearing Dolce & Gabbana sunglasses, shows up at Wahid’s Web Wonders office and makes the following business proposition:
“I’ve got the best web page development software on the market. It’s guaranteed to boost your revenues by $3000 by the end of the year. I’ll lease it to you for the year for $2800, cash up front.”
What is the present value of the investment if the interest rate is 10 percent? Is it a smart investment? Why or why not?
A. The present value is approximately $2727($3000/1.1), which is less than the cost of $2800. It is not a smart investment because Wahid could have invested the $2800 in the bank and earned more ($2800 X 1.1 = $3080) than $3000.
2. Q. A man named Arthur, wearing suspenders and thick-rimmed glasses, shows up at Wahid’s Web Wonders office and makes the following business proposition:
“For the low-low price of $700 (cash up front) for a one-year lease, I can offer you web page development software that will increase your revenues at the end of the year by $800.”
What is the present value of the investment if the interest rate is 10 percent? Is it a smart investment? Why or why not?
A. The present value is approximately $727 ($800/1.1), which is greater than the cost of $700. It is a smart investment because Wahid could not have earned more than $800 by investing the money in the bank at that interest rate ($700 X 1.1 = $770).
Refresh questions follow on the next page.
12.3.1
12.3.2
Q. In your own words, explain present value. Using the formula, compute the present value of $2000 earned one year from now if the interest rate is 5 percent per year.
A. Present value is the amount that, if invested today, will grow as large as a future amount, taking account of earned interest. The concept of present value represents what money earned in the future is worth today.
The $2000 is the amount of money earned in the future (at the end of one year). To find out what it is worth in the present, use the formula for present value. The number of years, n, equals 1.
Amount of Money Available in n Years
Present Value = (1 + Interest Rate)n
$2000
Present Value = (1 + 0.05)1
$2000 = = $1904.76 (1.05)
$1904.76 represents the amount of money, that, if invested today, would grow to $2000 in one year, taking account of earned interest.
Q. What is the comparison problem that the concept of present value helps solve?
A. Present value solves the comparison problem that arises because long-lived investments (for example in factories) produce a stream of revenues over many years, yet the business or investor is faced with a single purchase price in the present. The concept of present value helps you simplify that future stream of revenues to a single number today so you can compare it with cost to make a smart choice.
12.3.3
Q. Suppose someone offers you a bond that will pay you $2000 at the end of a year. If the interest rate is 7% (0.07), what is the most you would be willing to pay for the bond today? Why?
A. The $2000 is the amount of money earned in the future (at the end of one year). To find out what it is worth in the present, use the formula for present value. The number of years, n, equals 1.
Amount of Money Available in n Years
Present Value = (1 + Interest Rate)n
$2000
Present Value = (1 + 0.07)1
$2000 = = $1869.16 (1.07)
$1869.16 represents the amount of money, that, if invested today, would grow to $2000 in one year, taking account of earned interest. This calculation is similar to the problem in Refresh 12.3.1, except that the interest rate is 7% instead of 5%. This problem also shows that the smart amount to pay for a stream of future revenues should be no more than the present value of that stream of future revenues.
12.4 Why Sidney Crosby Plays by Different Rules: Land, Economic Rent, and Superstars
Learning Objective
Describe economic rent, and explain its importance for determining land and superstar income.
Main Point
Key Term
Income for any input in inelastic supply, for example land or superstar talent, is economic rent, which is determined by demand alone.
Economic rent
income paid to any input in relatively inelastic supply
Discussion or Homework Q&A
1. Q. a. Define economic rent. What determines economic rent?
b. What is the connection between high input prices and high output price for most products and services? For land?
A. a. Economic rent is income paid to any input in relatively inelastic supply. Economic rent is determined entirely by demand.
b. For most products and services, high input prices cause high output prices. This relationship is reversed for land, where high output prices cause high input prices.
2. Q. Hockey is a favourite sport among many Canadians, so it deserves at least one homework problem.
a. Who are the demanders and the suppliers in the NHL output market?
b. Who are the demanders and the suppliers in the NHL input market?
c. Explain why a high percentage of a hockey superstar’s income takes the form of an economic rent rather than wages paid for their marginal productivity.
d. Why might the public think a salary cap would lead to lower ticket prices?
A, a. Demanders are ticket purchasers. Suppliers are owners of the hockey teams.
b. Demanders are owners of the hockey teams. Suppliers are players on the hockey teams.
c. Superstars, like landlords, are like monopolists with barriers to entry. Their talent goes to the highest bidders and their salaries are largely demand-determined.
d. For most products and services, high input prices cause high output prices, so a salary cap that limits input prices was thought to lead to lower ticket prices.
Refresh Q&A
12.4.1 Q. Define economic rent.
A. Economic rent is the income paid to any input in relatively inelastic supply.
12.4.2
12.4.3
Q. For most products and services, what is the relationship between input prices and output prices? For inputs in inelastic supply, what is the relationship between input prices and output prices?
A. For most products and services, high input prices cause high output prices. For inputs in inelastic supply, high output prices cause high input prices (high economic rents).
Q. Music groups usually go on tour to promote a new album. Given the availability of digital album downloads, what is the difference in the elasticity of supply of albums versus the elasticity of supply of concert performances? Where are (talented) musicians more likely to earn economic rents?
A. Because free music downloads are an almost perfect substitute for purchased music, the supply of recorded music is highly elastic at a price of close to zero. No matter how large the demand is for recorded music, revenues will be tiny because the price is so low. Consumers are not willing to pay a price much above the zero price of the download substitute. Live concert performances are a different experience, and have no close substitutes (music videos of the band might be the closest). Products and services with few substitutes tend to have inelastic supplies and demands. That means an increase in price can increase total revenues. Since concert performances are in relatively inelastic supply, talented musicians (who cannot be substituted for by performances from any off-the-street band) are more likely to earn economic rents from concerts than from recorded music.
12.5 What Should You Be Worth? Inequality and Poverty
Learning Objective
Explain the sources of poverty and describe trade-offs in policies to help the poor.
Main Point
Key Terms
Government policies to address the market’s unequal distributions of income and wealth involve trade-offs between efficiency and equality.
Human capital increased earning potential from work experience, on-the-job training, education
Progressive taxes tax rate increases as income increases
Regressive taxes tax rate decreases as income increases
Proportional (flat-rate) taxes tax rate the same regardless of income
Marginal tax rate rate on additional dollar of income
Transfer payments paymentsby government to households
Discussion or Homework Q&A
1. Q. When a family receives social assistance benefits without working, an unintended consequence of this government policy is to reduce incentives to work. There may be a trade-off between greater equality and reduced output and efficiency. To encourage work, an alternative government policy can provide additional income to low-income individuals if they work. Explain why this alternative policy can reduce the trade-off between equality and efficiency.
A. Increasing the income of low-income families only if they work reduces income inequality while at the same time increasing work incentives and output.
2. Q. Reducing income inequality by redistributing income from the rich to the poor has disadvantages. Explain why there might be a trade-off between equality and efficiency.
A, Higher income taxes on the rich allow the government to redistribute income and reduce inequalities. However, if taxes cause some individuals to supply less to the market because the rewards aren’t as high, then workers will earn less and output markets will produce fewer products and services. See also the Top Choice story above about James Heckman’s research that challenges the necessity of a trade-off between efficiency and equity.
Refresh Q&A
12.5.1
Q. Explain the differences between income and wealth.
A. Income — what you earn — is a flow, an amount per year. Your income depends on the quantities of inputs (your own labour, capital, land, entrepreneurship) and the prices you can sell them for on input markets. Wealth — what you own — is the net value of the assets your own, and is a stock, a fixed amount at a moment in time. Wealth consists of equities, bonds, real estate, life insurance, pension plans, savings accounts, and even the value of owned automobiles.
More Refresh questions follow on the next page.
12.5.2
12.5.3
Q. What are the two main policy options for reducing poverty and inequality? What other policies can you think of to address other causes of poverty?
A. The two main policy options for reducing poverty and inequality are education/training and a progressive tax and transfer system. One example of another cause of poverty is discrimination, so programs that somehow reduce discrimination would address this cause of poverty. Your list may include other causes and other policies. For many of the causes that you think of, the policies of education/training and a progressive tax and transfer system will be appropriate policy options.
Q. Where does your family fit into the Canadian distribution of income? Of wealth? Are you surprised?
A. Of course your answer depends on your family’s income and wealth. Most people are surprised at where they fit into the distributions — either amazed at how many families are better off, or at how many families are worse off. The statistics for wealth distributions usually cause surprises at the degree of inequality.
Appendices
MICROECONOMICS FOR LIFE
Graphs, Tables, and Illustrations
2.3
MICROECONOMICS FOR LIFE
Graphs, Tables, and Illustrations
Chapter 6 Government Policy Choices
Chapter 7 Opportunity Costs, Economic Profits and Losses, and the Miracle of Markets Figure Title
6.1 Market for Gasoline with Shortage
6.2 Market for Gasoline with Surplus T,
6.3 Market for Two-Bedroom Apartments
a) Market for Two-Bedroom Apartments
b) Market for Two-Bedroom Apartments with Rent Controls
6.4 Market for Unskilled Labour
a) Market for Unskilled Labour
Figure Title
7.1 Accountant’s One-Year Business Plan for Wahid’s Web Wonkers T 168
7.2 Economist’s One-Year Business Model for Wahid T 173
7.3 Alternative Profit Scenario’s for Wahid’s Web Wonders T 174
7.4 Short-Run and Long-Run Market Equilibrium
a) Economic Losses and Decreased Supply Lead to Long-Run Market Equilibrium
b) Economics Profits and Increased Supply Lead to Long-Run Market Equilibrium
Chapter 8 Monopoly to Competition and In Between
Figure Title
8.1
Key:
G - Graph(s)
For titles in blue, Narrated Dynamic Graph videos are available online on each Chapter Resources page.
I - Illustration
T - Table
Chapter 9 Appendix
MICROECONOMICS FOR LIFE
Graphs, Tables, and Illustrations
10.1
11.4
12.5
Literacy-Targeted Economics
When I began work on Economics For Life, I did not realize that I was taking an approach known as literacy-targeted (LT) economics. This approach is championed by, among others, Professor Michael Salemi, who for many years chaired the AEA Committee on Economic Education, as well as directing the Teacher Training Workshop Project jointly sponsored by the AEA and the National Council on Economic Education. Salemi and colleague Donna Gilleskie point out that in a typical introductory economics course,
students encounter a large number of concepts, many of which will be useful only to students who take additional courses in economics. Generally, students who stop after principles waste course and study time attempting to master tools and language that they will rarely, if ever, use. In a literacy-targeted (LT) course, students study a “short list” of concepts that they can use for the rest of their lives. They pursue higher-level mastery of fewer topics.1
The topics in Economics for Life closely match their short-list of topics.2
A legitimate concern with the literacy-targeted approach is whether it disadvantages students who want to continue studying economics in upper level courses. Many students in introductory economics don’t yet know if they want to pursue an economics credential. As teachers, we don’t want to cut off options, or disadvantage any students.
Gilleskie and Salemi compared the performance in upper level economics courses at University of North Carolina Chapel Hill of students who took a traditional, tools-oriented introductory course for majors with students who took a literacy-targeted course. Over three years, they found that
students who complete an LT principles course earn grades as high in intermediate microeconomics and intermediate macroeconomics as those of students who complete a traditional principles course.3
1 D. Gilleskie and M. Salemi, “The Cost of Economic Literacy: How Well Does a Literacy-Targeted Principles of Economics Course Prepare Students for Intermediate Theory Courses?” Journal of Economic Education 43 (2), May 2012, 112.
2 See W.L. Hansen, M. Salemi and J.Siegfried, “Use It or Lose It: Teaching Literacy in the Economics Principles Course,” American Economic Review 92 (2), May 2002, 463-472
3 Gilleskie and Salemi, 112.

While more research is needed, how is that for a Paretoimprovement! The 90% of students who never take another economics course will be better off using LT books like Economics for Life, while the 10% who pursue economics will be no worse off than if they had taken a traditional tools-oriented introductory course. The authors attribute the result to the extra class time devoted to mastering fewer topics, coupled with active learning assignments in the literacy-targeted course.
The University of Toronto Course Model
Over the past four years, I have used Economics for Life in teaching ECO105Y – Principles of Economics for Non-Specialists, at the St. George campus of the University of Toronto. This course serves as a pre-requisite for the prestigious Munk School International Relations Program and the Public Policy major in the School of Public Policy and Governance. The course also attracts many science and engineering students.
For Economics, in the U of T model, students can become majors either by taking the traditional principles course (ECO100Y –Introductory Economics) or my literacy-targeted course. Students need a 67% average in the traditional course to go on, or they can go on with an 80% average in the LT course. The grade difference makes sense because of the additional mathematical tools in the traditional course that students find challenging.
But what I like best about the model is that if a student in the LT course gets excited about economics and does well, she can continue on. At the same time, the vast majority of students in the literacy-targeted course have the benefit of a course better suited to their interests, needs, and future.
Avi Cohen
York University and University of Toronto

EconomicsforLife.ca
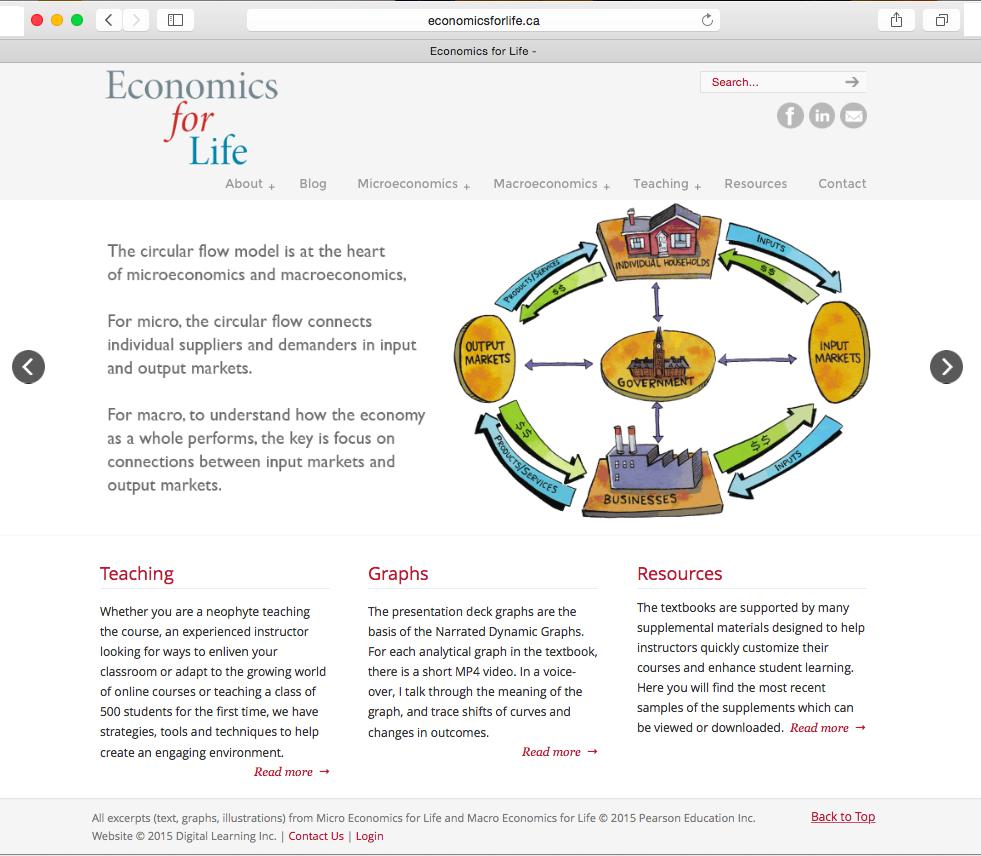
I will continually update the website with new media stories, discussion questions, engaging videos, data, blog posts and links to other teaching resources. All resources are tagged by topics and chapters in the Economics for Life textbooks, and are searchable.
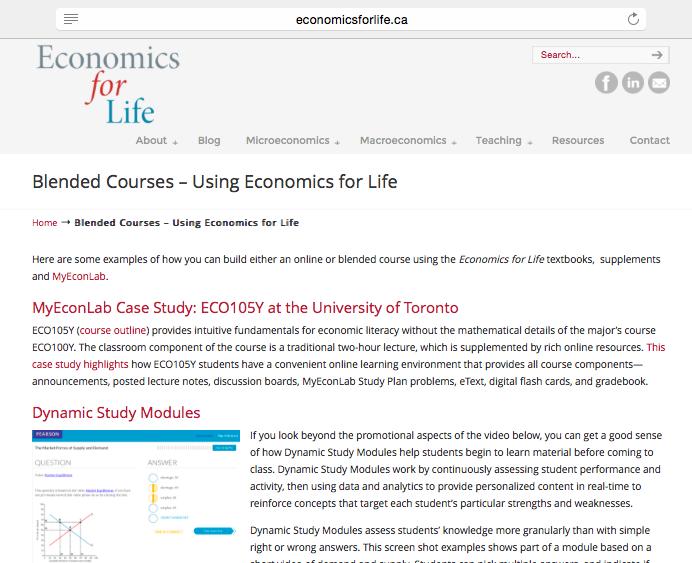
This textbook website is the single most important resource for teaching from the Economics for Life textbooks.
It contains links to all textbook-related resources, advice on creating or teaching blended and online courses, links to web-resource elsewhere on the internet, and a teaching blog.
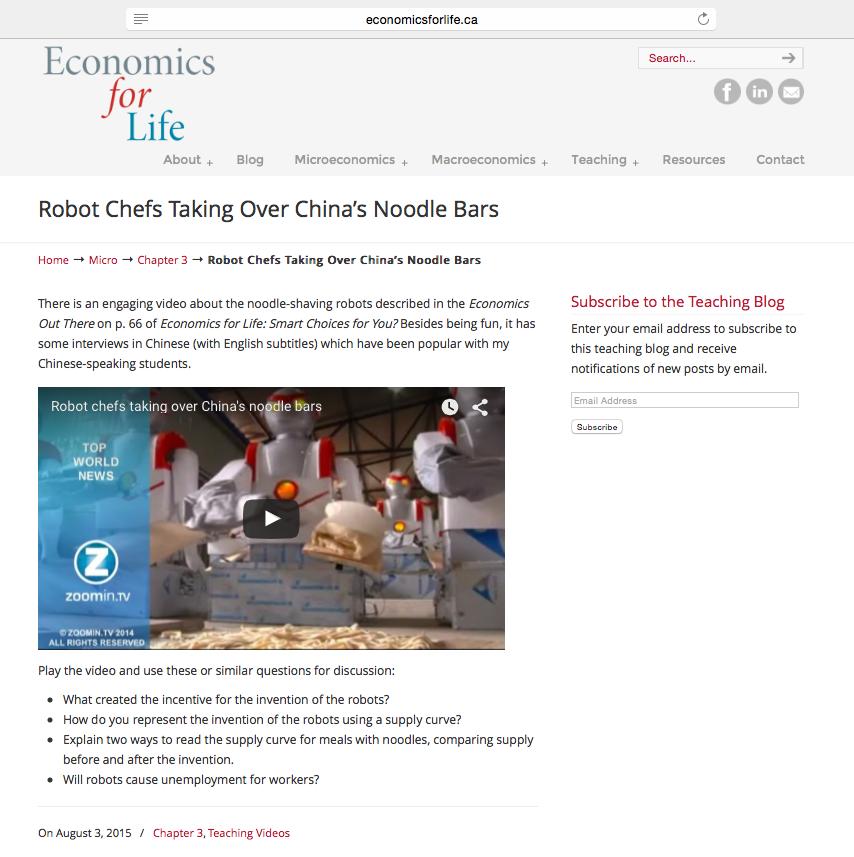
For adopters, there also is a password-protected area with additional materials like old tests, exams, and answer guides.