Answer & Explanation
Solved by verified expert
Rated
Helpful
Answered by BaronRiver11569
For the tables, answers, and explanations, please refer to the information provided below.
Step-by-step explanation
PART A. Consider "# of Vaccines administered per week" as your independent variable. Use single linear regression, for analyzing the relationship between "# of Vaccines administered per week" and each of the following dependent variables:
1. Y = number of confirmed cases
2. Y = number of confirmed deaths
3. Y = number of hospitalizations
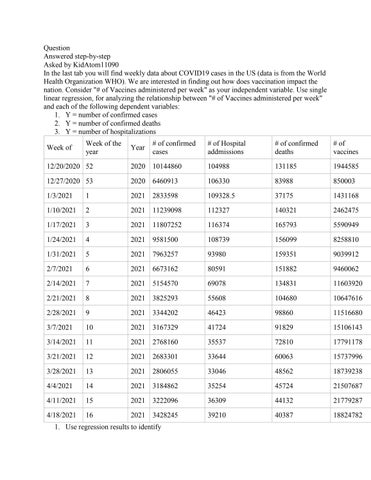
# of vaccines per week and no. of confirmed cases
p-value = 0.002 < 0.05; statistically significant at 95% confidence level
Image transcription text
SUMMARY OUTPUT Regression Statistics Multiple R 0.669275747 R Square 0.447930026 Adjusted R Square 0.413425652 Standard Error 2470205.264 Observations 18 ANOVA df SS MS F Significance F Regression 1 7.9214E+13 7.9214E+13 12.98183337 0.002383898 Residual 16 9.76306E+13 6.10191E+12 Total 17 1.76845E+14 Coefficients Standard Error t Stat P-value Lower 95% Upper 95% Lower 95.0% Upper 95.0% Intercept 9053226.963 1128171.865 8.024687767 5.32802E-07 6661609.448 11444844.48 6661609.448 11444844.48 # of vaccines -0.309800586 0.085983322 -3.603031137 0.0023838980.492077086 -0.127524086 -0.492077086 -0.127524086
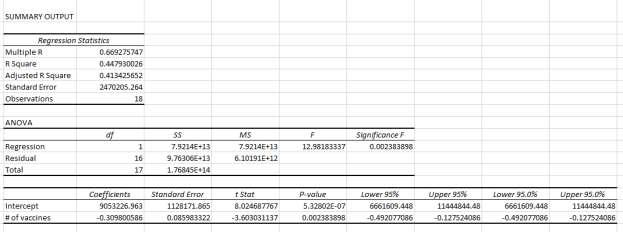
# of vaccines per week and no. of confirmed deaths
p-value = 0.019 < 0.05; statistically significant at 95% confidence level
Image transcription text
SUMMARY OUTPUT Regression Statistics Multiple R 0.545397454 R Square 0.297458382 Adjusted R Square 0.253549531 Standard Error 39944.3559 Observations 18 ANOVA df MS F Significance F Regression 1 10808986719 10808986719 6.774451504 0.019231986 Residual 16 25528825087 1595551568 Total 17 36337811806 Coefficients Standard Error t Stat P-value Lower 95% Upper 95% Lower 95.0% Upper 95.0% Intercept 138874.6325 18243.05823 7.612464461 1.0497E-06 100201.0766 177548.1883 100201.0766 177548.1883 # of vaccines -0.003618876 0.00139039 -2.602777652 0.019231986 -0.0065663710.000671381 -0.006566371 -0.000671381
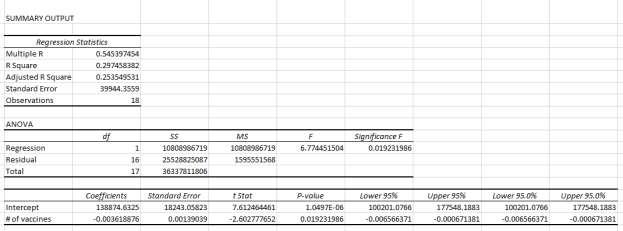
# of vaccines per week and no. of confirmed hospitalization
p-value = 0.000 < 0.05 ; statistically significant at 95% confidence level
Image transcription text
SUMMARY OUTPUT Regression Statistics Multiple R 0.917510836 R Square 0.841826134 Adjusted R Square 0.831940267 Standard Error 13686.94014 Observations 18 ANOVA of SS MS F Significance F
Regression 1 15952192859 15952192859 85.1545103 8.30103E-08 Residual 16 2997317286 187332330.4
Total 17 18949510146 Coefficients Standard Error t Stat P-value Lower 95% Upper 95% Lower 95.0% Upper 95.0% Intercept 119324.2932 6250.986914 19.08887265 1.96132E-12 106072.7929 132575.7934 106072.7929 132575.7934 # of vaccines -0.004396341 0.000476417 -9.227920151 8.30103E-080.005406301 -0.003386381 -0.005406301 -0.003386381
QUESTION:
Use regression results to identify if "# of vaccines administered" has a statistically significant effect on any of the above.
Based on the provided summary outputs, it is evident that all three independent variables exhibit statistical significance at a 95% confidence level.
For which one of the dependent variables, "# of Vaccines administered per week" is a better indicator.
Let C1 = coefficient of confirmed cases, C2 = coefficient of confirmed deaths, and C3 = coefficient of confirmed hospitalization
To determine which of the results is a better indicator for the "# of Vaccines administered per week," we need to consider both the coefficient value and the associated p-value.
Comparing the results:
C1: Coefficient = -0.309800586 and p-value = 0.002383898 C2: Coefficient = -0.003618876 and p-value = 0.019231986 C3: Coefficient = -0.004396341 and p-value = 8.301028E-08
In terms of coefficient value, C1 has the largest absolute magnitude (0.309800586), followed by C3 (-0.004396341), and C2 (-0.003618876).
When it comes to statistical significance, the p-values indicate the strength of the evidence against the null hypothesis. A smaller p-value suggests stronger evidence against the null hypothesis.
Considering the p-values, C3 has the smallest p-value (8.301028E-08), followed by C1 (0.002383898) and C2 (0.019231986).
Hence, based on both the coefficient value and the p-value, we can conclude that C3 (-0.004396341) is a better indicator for the "# of Vaccines administered per week" compared to C1 (-0.309800586) and C2 (-0.003618876). The smaller p-value associated with C3 indicates stronger evidence of a relationship between the "# of Vaccines administered per week" and the dependent variable it represents.
Explain how you could justify the results and what does your findings imply.
All three variables have negative coefficients, indicating an inverse relationship with the "# of Vaccines administered per week." As the number of vaccines administered per week increases, the dependent variables tend to decrease.
The coefficients for C1, C2, and C3 are relatively small, suggesting a modest effect size. This implies that changes in the number of vaccines administered per week have a relatively small impact on the dependent variables..
PART B. Perform the same three regression analysis but instead of "# of Vaccines administered per week," use the "cumulative # of vaccines administered " as your independent variable. Comparing these results with that of part A, which one is a better
indicator for each of the outcomes: # of Vaccines administered per week, or cumulative # of vaccines administered?
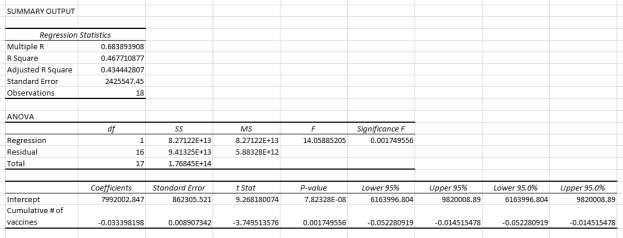
cumulative # of vaccines administered and no. of confirmed cases
Image transcription text
SUMMARY OUTPUT Regression Statistics Multiple R 0.683893908 R Square 0.467710877 Adjusted R
Square 0.434442807 Standard Error 2425547.45 Observations 18 ANOVA df SS VIS F Significance F
Regression 1 8.27122E+13 8.27122E+13 14.05885205 0.001749556 Residual 16 9.41325E+13 5.88328E+12
Total 17 1.76845E+14 Coefficients Standard Error t Stat P-value Lower 95% Upper 95% Lower 95.0% Upper 95.0% Intercept 7992002.847 862305.521 9.268180074 7.82328E-08 6163996.804 9820008.89 6163996.804 9820008.89 Cumulative # of vaccines -0.033398198 0.008907342 -3.749513576 0.001749556 -0.052280919 0.014515478 -0.052280919 -0.014515478
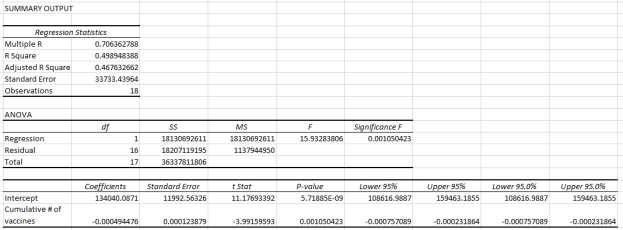
cumulative # of vaccines administered and no. of confirmed deaths
Image transcription text
SUMMARY OUTPUT Regression Statistics Multiple R 0.706362788 R Square 0.498948388 Adjusted R
Square 0.467632662 Standard Error 33733.43964 Observations 18 ANOVA df SS MS F Significance F
Regression 1 18130692611 18130692611 15.93283806 0.001050423 Residual 16 18207119195 1137944950
Total 17 36337811806 Coefficients Standard Error t Stat P-value Lower 95% Upper 95% Lower 95.0% Upper
95.0% Intercept 134040.0871 11992.56326 11.17693392 5.71885E-09 108616.9887 159463.1855 108616.9887 159463.1855 Cumulative # of vaccines -0.000494476 0.000123879 -3.99159593 0.0010504230.000757089 -0.000231864 -0.000757089 -0.000231864
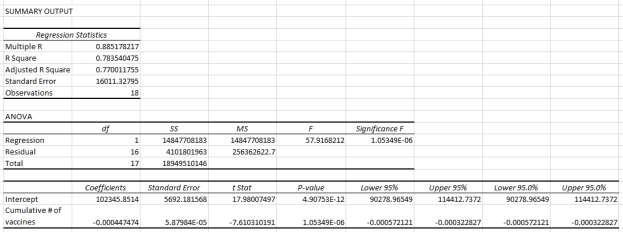
cumulative # of vaccines administered and no. of confirmed hospitalizations
Image transcription text
SUMMARY OUTPUT Regression Statistics Multiple R 0.885178217 R Square 0.783540475 Adjusted R
Square 0.770011755 Standard Error 16011.32795 Observations 18 ANOVA df SS MS F Significance F
Regression 1 14847708183 14847708183 57.9168212 1.05349E-06 Residual 16 4101801963 256362622.7
Total 17 18949510146 Coefficients Standard Error t Stat P-value Lower 95% Upper 95% Lower 95.0% Upper 95.0% Intercept 102345.8514 5692.181568 17.98007497 4.90753E-12 90278.96549 114412.7372
90278.96549 114412.7372 Cumulative # of vaccines -0.000447474 5.87984E-05 -7.610310191 1.05349E-06 0.000572121 -0.000322827 0.000572121 -0.000322827
QUESTIONS:
Comparing these results with that of part A, which one is a better indicator for each of the outcomes: # of Vaccines administered per week, or cumulative # of vaccines administered?
Based on the comparison of coefficients and p-values, the variable "# of Vaccines administered per week" (Part A) is a better indicator for all three outcomes, number of confirmed cases, number of hospital admissions, and number of confirmed deaths compared to the variable "cumulative # of vaccines administered" (Part B). The coefficients for Part A are generally larger in magnitude, indicating stronger relationships with the outcomes of interest.
A larger absolute coefficient value and a lower p-value would suggest a stronger and more significant relationship, which also suggests better indicator.
How many people in total should be vaccinated in the United States to bring down the # of hospitalizations due to COVID to zero?
We can simply let hospitalization = 0, X = no. of people to be vaccinated
Hospitalization = -0.00439634102266903X + 119324.2931534
0 = -0.00439634102266903X + 119324.2931534
X = 119324.2931534 / 0.00439634102266903 = 27141728.2094641 ≈ 27141729
Therefore, 27141729 people should be vaccinated in the United States to bring down COVID to zero