38 minute read
AFRO-INCLUSIVE PHARMACOGENOMICS

A CASE FOR AFRO-INCLUSIVE pharmacogenomics precision medicine
AUTHOR Stewart Masimirembwa
Advertisement
PEER REVIEWER: Buddy Modi
EXECUTIVE SUMMARY
Adverse drug reactions (ADRs) are the unintended negative reactions to a drug. Some ADRs may result in hospital admissions, prolongation of hospital stay, injury or death, leading to economic and clinical costs. Payers and funders can incur extra costs as high as twice the initial cost of the health care services.
More than thirty-five percent (35.4%) of major ADRs are caused by the interaction between a patient’s gene(s) with one or more drug(s). Not only do African populations have unique and different gene sets (genetic diversity), they also collectively have gene sets that are different from those of Causations and Orientals (genetic variability). This is problematic for African populations because most drugs, especially those for non-communicable diseases, are optimised for Caucasian populations. African populations experience ADRs with some drugs that work very well for Caucasians. Furthermore, a drug may work very well in some African populations, while causing ADRs in others. This problem suggests the need to use a person’s genes to determine how he/she will respond to a drug.
Pharmacogenomics precision medicine, known simply as Pharmacogenomics or PGx, uses information about a person's genetic makeup to choose the drugs and drug doses that may work best for that particular person, thereby minimising the possibility or severity of ADRs.
This article advocates for the mainstreaming of clinical pre-emptive pharmacogenomics and making it standard of care. Making patients’ genetic information available in their medical record will render 25% of PGx-guided treatment cost effective and 50% cost saving.
ADRS
Medicinal drugs are chemicals or compounds used to cure, halt or prevent disease, ease symptoms, and help in the diagnosis of illnesses. Most commonly, these intended benefits are realised. However, patients often experience ADRs ranging from minor side effects to death. ‘Any deviation from the intended beneficial effect of a medication results in a drug-related problem (DRP),’ (Classen et al, 1991). In response to an initial drug therapy, a patient may develop one or more DRPs.
The commonly referenced eight possible DRPs are:
Untreated indication
Improper drug selection
Subtherapeutic dosage
Failure to receive drugs
Overdosage
ADRs
Drug interactions
Drug use without indication.
For brevity, ADRs will be a catch-all term for treatment failure, poor efficacy and drug interactions. ADRs often lead to hospital admission, prolongation of hospital stay and emergency medical visits – all resulting in considerable economic as well as clinical costs (Classen et al, 1991).
Genetic basis for ADRs
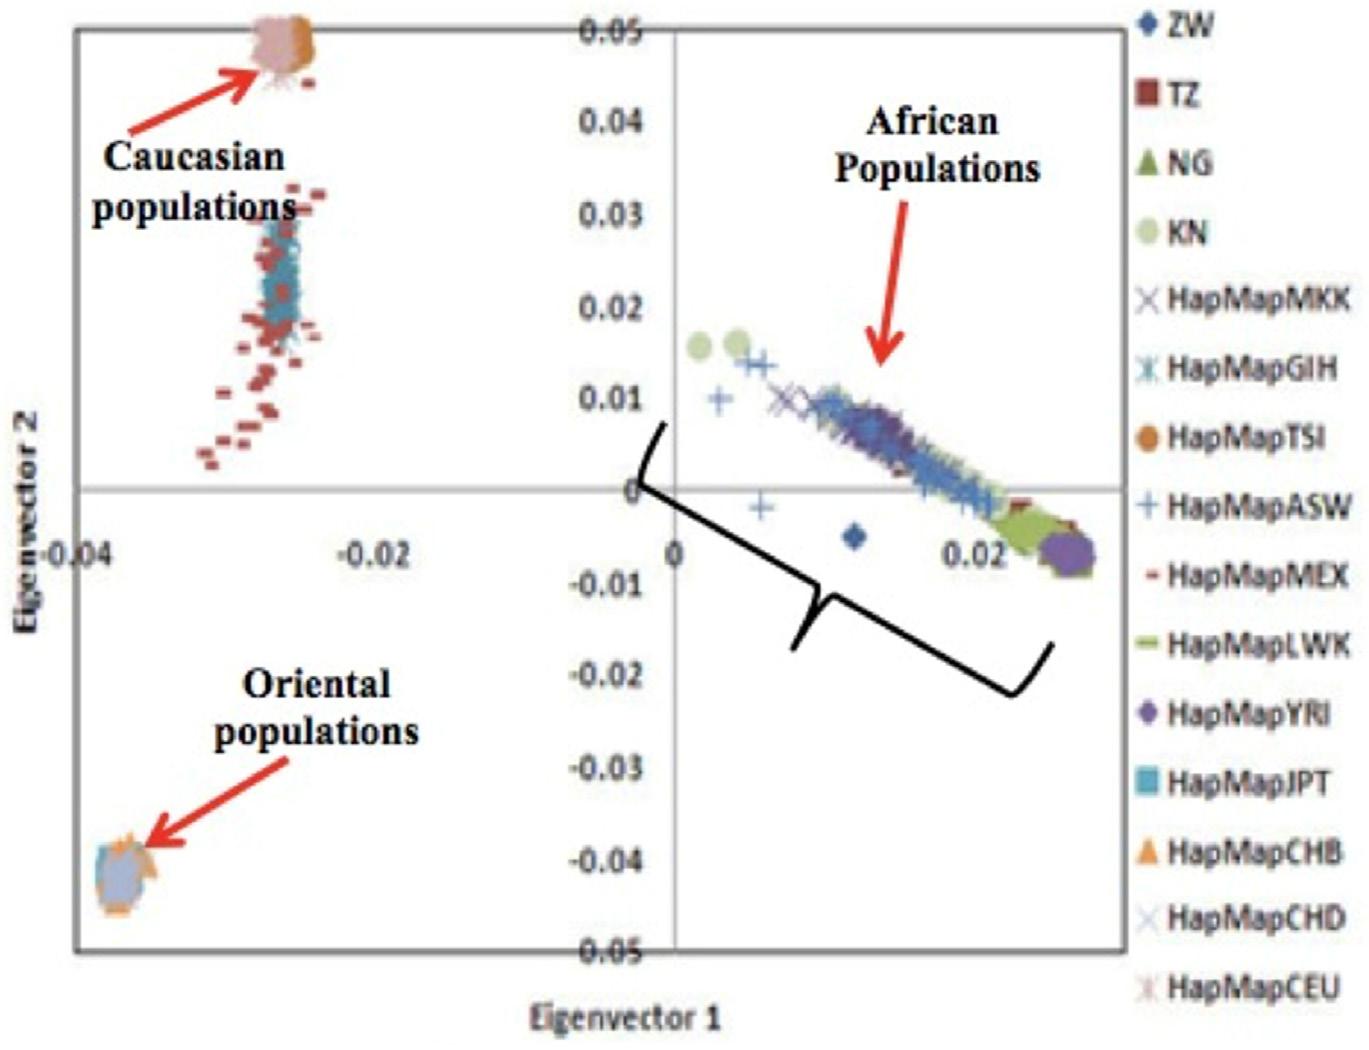
A principal component analysis undertaken in 2008 (Matimba et al, 2008), investigated how the variants of nine genes important for drug metabolism and transport influenced the relationships among African, Caucasian and Oriental population groups (Figure 1).
FIGURE 1. PRINCIPAL COMPONENT ANALYSIS PLOTS FOR TWO KEY COMPONENTS THAT HAD THE MOST SIGNIFICANT IMPACT IN SHOWING THE RELATIONSHIP OF THE THREE POPULATION GROUPS
The component on the horizontal axis shows that the Caucasian populations and Oriental populations are clustered and the clusters are much closer to each other, with the non-clustered African populations further away. This illustrates three important phenomena about the three population groups:
a. Genetic similarities within a population
b. Each population within all three groups has a unique set of the genetic variants important for drug metabolism and transport.
Genetic diversity in populations
c. Unlike the Caucasian and Oriental populations, which tended to cluster, each on the same but different set of genetic variants, the African populations are spread among different sets of genetic variants. Put differently, of the three population groups, African populations have a more diverse set of genetic variants that are important for drug metabolism and transport. This means different African populations may respond differently to the same drug; while, within their separate groups, Caucasian populations and Oriental populations may respond in the same way to the same drug.
Genetic variability among populations
The closeness (on the horizontal axis) of the Caucasian and Oriental clusters demonstrated their significant genetic similarity; while the further away African cluster demonstrated significant genetic variability of the variants important for drug metabolism and transport. In other words Caucasian and Oriental populations are likely to respond in the same way to a drug while African populations respond differently (Masimirembwa and Hasler, 2013).
The implications of genetic variability and diversity
The pharmaceutical industry researches, develops, tests, optimises and manufactures medicinal drugs primarily for Caucasian populations, with little or no consideration for African populations. African populations use these drugs in the hope that they will be as safe and efficacious as they are for Caucasians. Unfortunately that has not been the case, with some African populations experiencing ADRs and/or poor efficacy with a significant number of drugs that have worked well in Caucasians (Dandara et al, 2019) (Klein, Parvez and Shin, 2017).
Drug-drug interactions (DDIs) account for 66.1% of all ADRs. The remaining 33.9% are drug-gene interactions (DGIs) (14.7%) and drug-drug-gene interactions (DDGIs) (19.2%). When considering only major ADRs, DGIs represent 13.9% and DDGIs represent 21.5% - a total of 35.4% of all interactions.
The epidemiology of ADRs in Africa
Results of a review of 18 carefully selected epidemiological research studies of ADRs in Africa, spanning 39 years (1979-2017), are shown in the Table 1 on page 86 (Mekonnen et al, 2018). Paying special attention to the medians in last row, it is instructive to note that 43.5% of ADRs were preventable.
TABLE 1. FREQUENCY, SERIOUSNESS AND PREVENTABILITY OF ADVERSE DRUG EVENTS (ADES) IN AFRICAN HOSPITALS
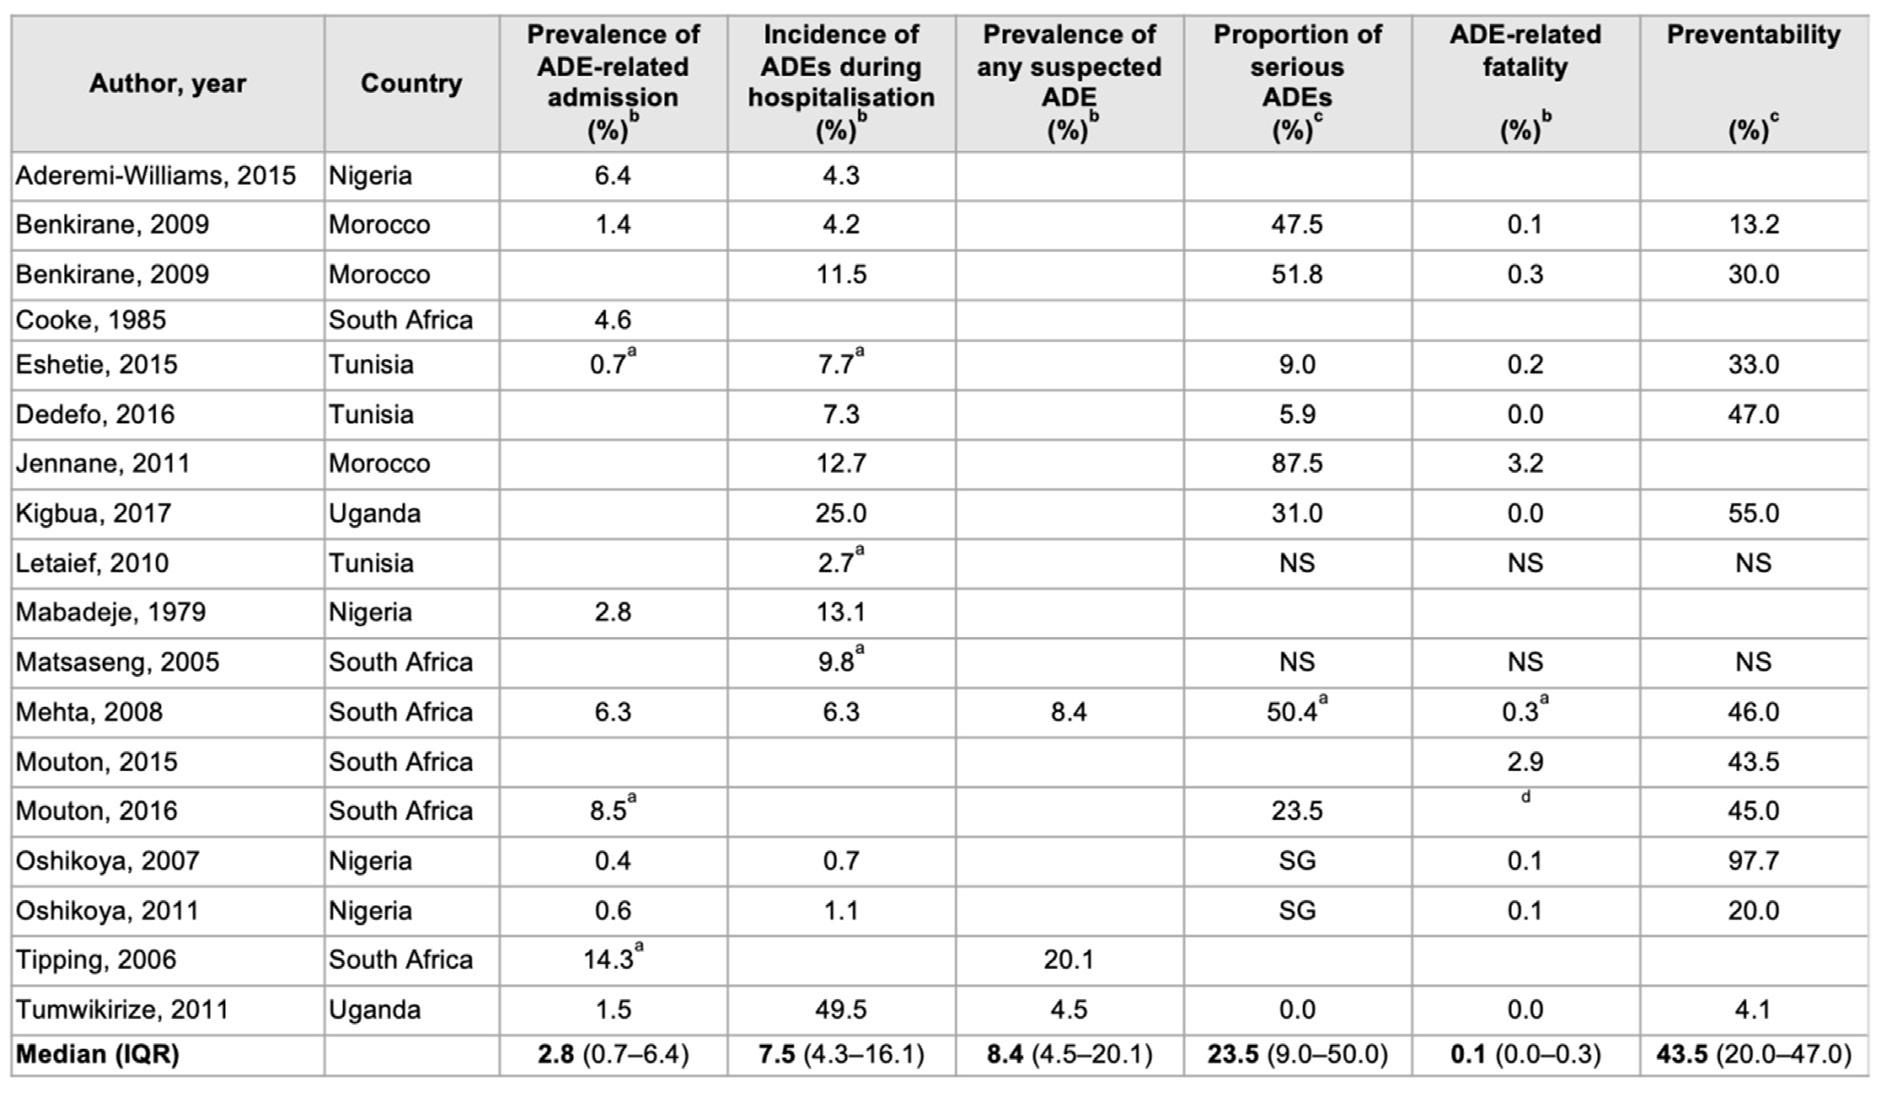

(Aderemi-Williams, Awodele and Boyle, 2015) (Benkirane, 2009) (Benkirane et al, 2009) (Cooke, van der Merwe and Pudifin, 1985) (Eshetie et al, 2015) (Dedefo et al, 2016) (Naoual Jennane et al, 2011)(Kiguba, Karamagi and Bird, 2017) (Letaief et al, 2010) (Mabadeje and Ilawole, 1979) (Matsaseng and Moodley, 2005) (Mehta, 2011) (Mouton et al, 2015) (Mouton et al, 2016) (Oshikoya and Ojo, 2007) (Oshikoya, 2006) (Tipping, Kalula and Badri, 2006) (Tumwikirize et al, 2011)
THE COST OF ADRS IN AFRICA
‘Although ADRs are common, there is little knowledge on their direct, indirect and intangible costs,’ (Goettler, Schneeweiss and Hasford, 1997). Quantification of these costs is complex and complicated because it is tied to the availability and quality of intricate data sets sampled over a long period. Such data are generally not easily available, more so in Africa; suffice to say the indirect costs are incurred as a result of ‘missed days from work and/or morbidity such as anxiety due to the ADR episode,’ (Sultana, Cutroneo and Trifirò, 2013). The direct and main costs are wages, disposable goods and medications. The length of stay (LOS) of hospital admissions due to ADRs is often used as a proxy measure for direct costs (Table 2 on page 87).
TABLE 2. RESULTS OF LITERATURE SEARCH ABOUT LENGTH OF HOSPITALISATION DUE TO ADRS
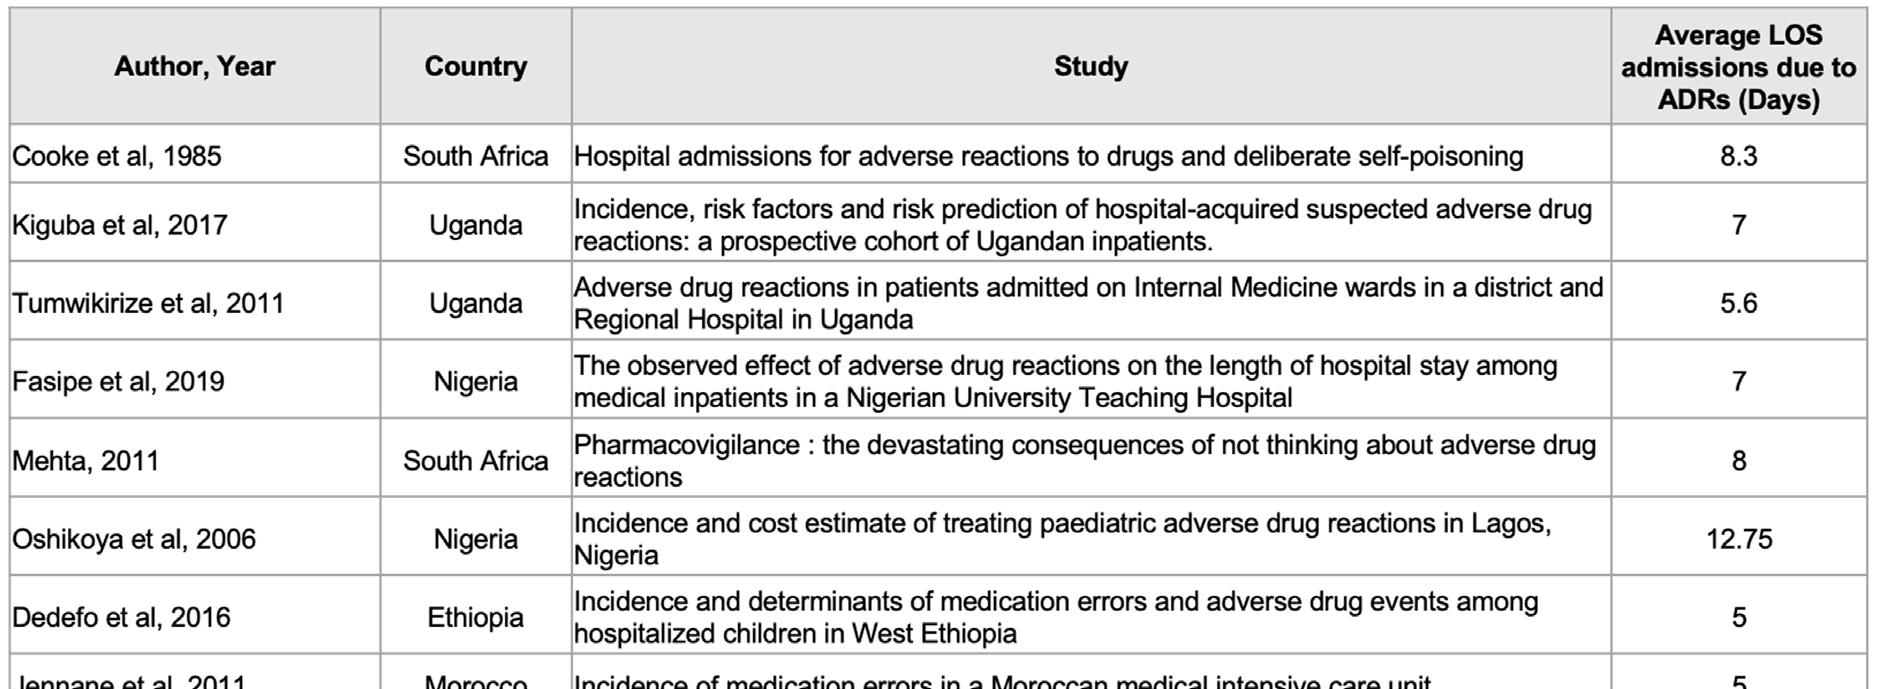

In a study in Nigeria, the management of 40 ADRs cost US$154 000 (US$375/ADR) (Oshikoya et al, 2011). A South Africa study estimated the cost of serious ADRs to be US$521 (Schnippel et al, 2018).
PHARMACOGENOMICS PRECISION MEDICINE
What is precision medicine?
The common considerations in descriptions of precision medicine are the patient’s genome (genes), environment and lifestyle; and the intended outcomes are the elimination or minimisation of ADRs and the maximisation of drug therapy. Another salient point is that in the term ‘precision medicine’, the word ‘precision’ means precise and accurate. Precision medicine is enabled by precise (reproducible) and accurate (exact) measurements of diagnostic and treatment parameters.
Precision medicine that focuses on the genome is known as genomic medicine. Genomic medicine itself is a multi- and inter-disciplinary medical specialisation that involves the use of genomic information to diagnose and treat patients. This article focuses on pharmacogenomics (PGx) precision medicine. ‘Pharmacogenomics uses information about a person's genetic makeup, or genome, to choose the drugs and drug doses that are likely to work best for that particular person,’ (NIH, 2020).
Precision medicine or personalised medicine?
The terms precision medicine and personalised medicine are often used interchangeably, suggesting the same meaning. The National Research Council (USA) introduced and adopted the term precision medicine in place of personalised medicine. In this article the term precision medicine does not mean the same as personalised medicine. Whereas the idea of medical drugs and devices that are unique to a patient is appealing, the nature, form and economics of current technologies and systems for manufacturing, distribution and dispensing make implementation impossible. What is currently possible and feasible is dealing with subpopulations.
Reactive and pre-emptive pharmacogenomics
Clinical pharmacogenomics is either reactive or pre-emptive. Reactive pharmacogenomics is when the serial single-gene testing strategy in employed. The pharmacogenomic testing is prescription-triggered, where there is likelihood that a high-risk drug (one substantially influenced by a specific genetic variation) will be prescribed. The advantage of reactive pharmacogenomics is the increased likelihood that the test results will be used by clinicians. The three main disadvantages of serial single-gene testing are ‘high expense, a slow turnaround time, which may be too slow to be useful for initial prescribing decisions, and a substantial knowledge base needed for clinicians to be aware of important gene/drug relations to prompt ordering of each genetic test,’ (Dunnenberger et al, 2015) (Keeling et al, 2019).
Pre-emptive clinical pharmacogenomics is when multiple gene testing is done and the results are known before a prescription need arises. The main disadvantage is that clinicians may never use the test results, in which case resources would have been wasted. However, this disadvantage is far outweighed by the advantages, which include low cost of testing for many of all relevant genes and fast turnaround times. This article advocates for the implementation of Afro-inclusive pre-emptive pharmacogenomics as standard of care.
The genetic diversity of the African population makes a compelling case for mainstreaming pharmacogenomics in African health care systems. Successful implementation of pre-emptive pharmacogenomics in clinical practice not only involves multidisciplinary coordination among physicians, pharmacists, clinical laboratories, health information specialists and health care system administrators, but also requires collaborative efforts and willingness from the payer, a significant stakeholder in this endeavour. This pre-emptive strategy is still in its infancy, and is not currently covered by insurance. However, more studies have evaluated the clinical outcomes, cost-effectiveness and defined target populations – all this needed to support regulatory and payer decisions on pre-emptive PGx testing.
Having genetic information readily available in the clinical health record would make more genetic tests economically worthwhile. Twenty-five percent of PGx-guided treatment would be cost effective while 50% would be cost saving. Thus, PGx-guided treatment can be a cost-effective and even a cost-saving strategy (Verbelen, Weale and Lewis, 2017) (Chan et al, 2019).
The constraints
Underdeveloped African economies, characterised by widespread poverty, archaic and/or dysfunctional health care infrastructure, exacerbate the six main issues that hinder the clinical implementation of pharmacogenomics (Table 3 on page 89).
TABLE 3. PRACTICAL ISSUES INVOLVED IN CLINICAL IMPLEMENTATION OF PHARMACOGENOMICS TESTING
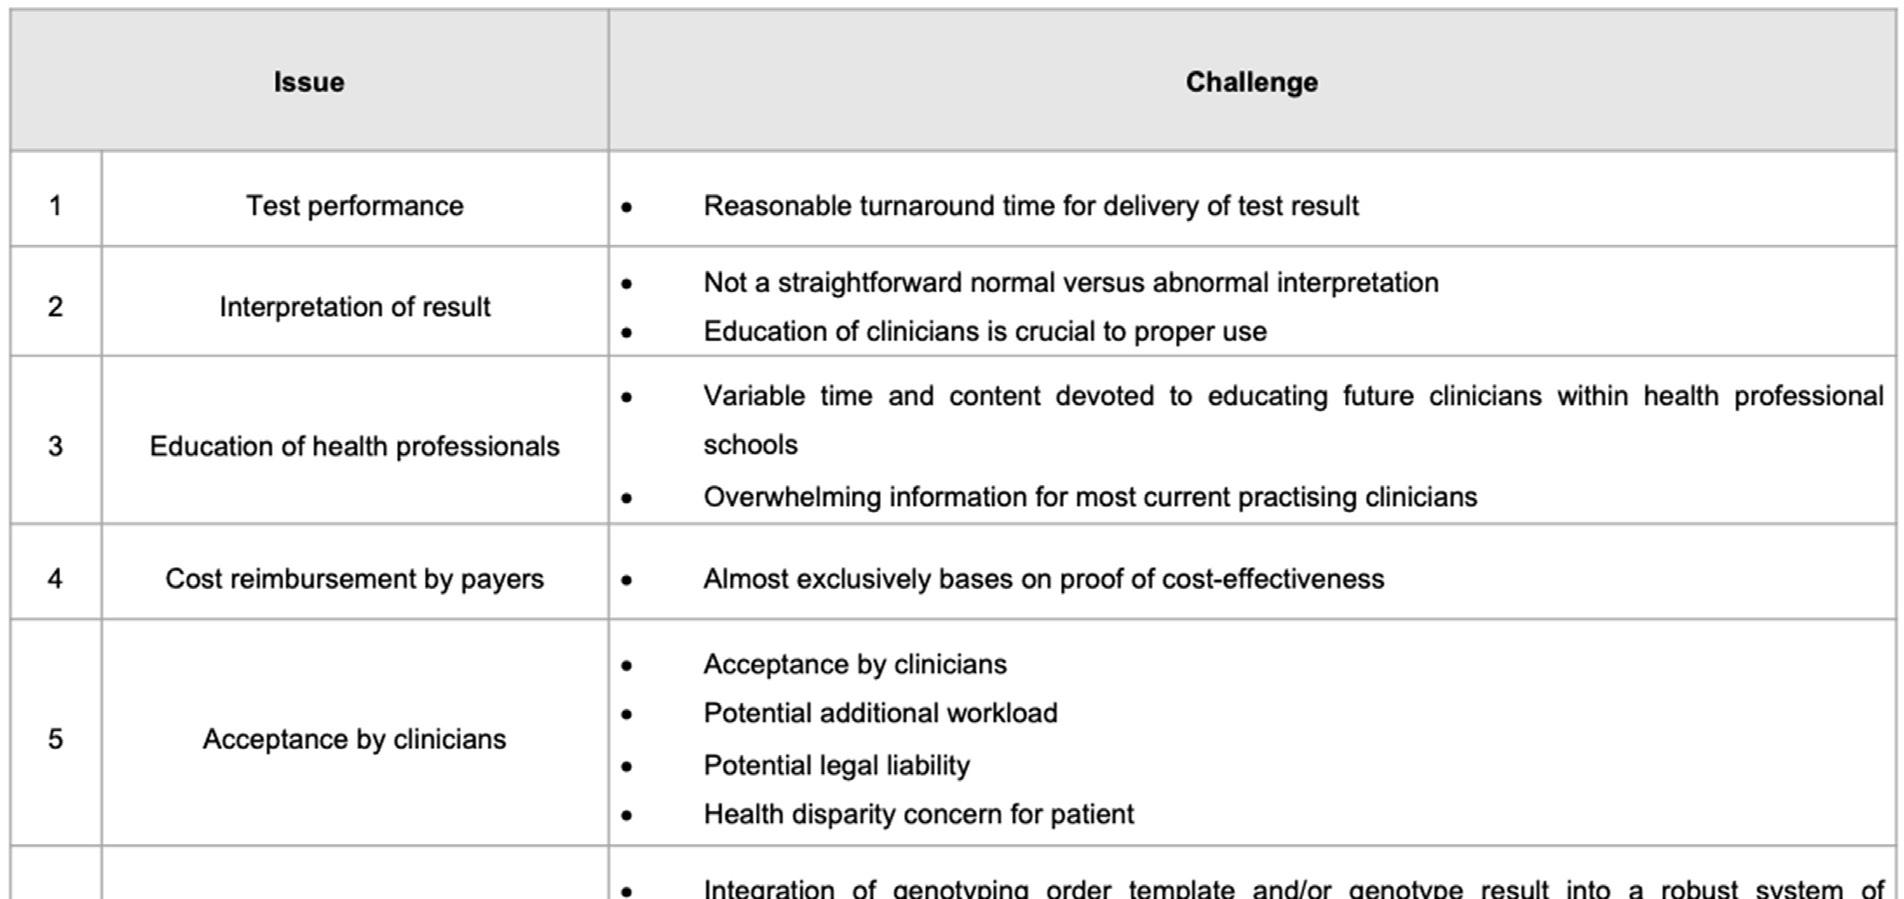

Of the six issues listed in Table 3, the most critical one is issue 4, that of cost reimbursement by payers. The cost of genetic testing is an important parameter of economic evaluations of PGx interventions.
In 2017, the Cancer Association of South Africa fact sheet reported that genetic tests cost between R1500 and R13 400, depending on the type of genetic test required. In a study in Singapore, the estimated breakeven cost of a pre-emptive PGx test for patients taking warfarin, clopidogrel, chemotherapeutic and neuropsychiatric drugs was US$114 per patient. (Chan et al, 2019). In 2014, the cost of genetic testing quoted by the reviewed studies ranged between US$33 and US$710 with a median value of US$175. The price of genetic tests decreased slightly over time (not statistically significant) and this trend has been more pronounced since 2009, the period when most economic evaluations were published (Verbelen, Weale and Lewis, 2017).
Funding and paying for pre-emptive PGx
In Africa, payers for health care services are the government and/or the private sector. Statistics South Africa estimated South Africa’s population (2018) to be 57.7 million. For the same period, the Council for Medical Schemes (CMS) in South Africa reported that only 8.9 million people had medical aid cover. Thus, government pays for 85% while the private sector pays for 15% of the population (CMS, 2018) (SANAC, 2017).
FIGURE 2: DEMOGRAPHICS OF HEALTH FUNDING IN SOUTH AFRICA – 2018
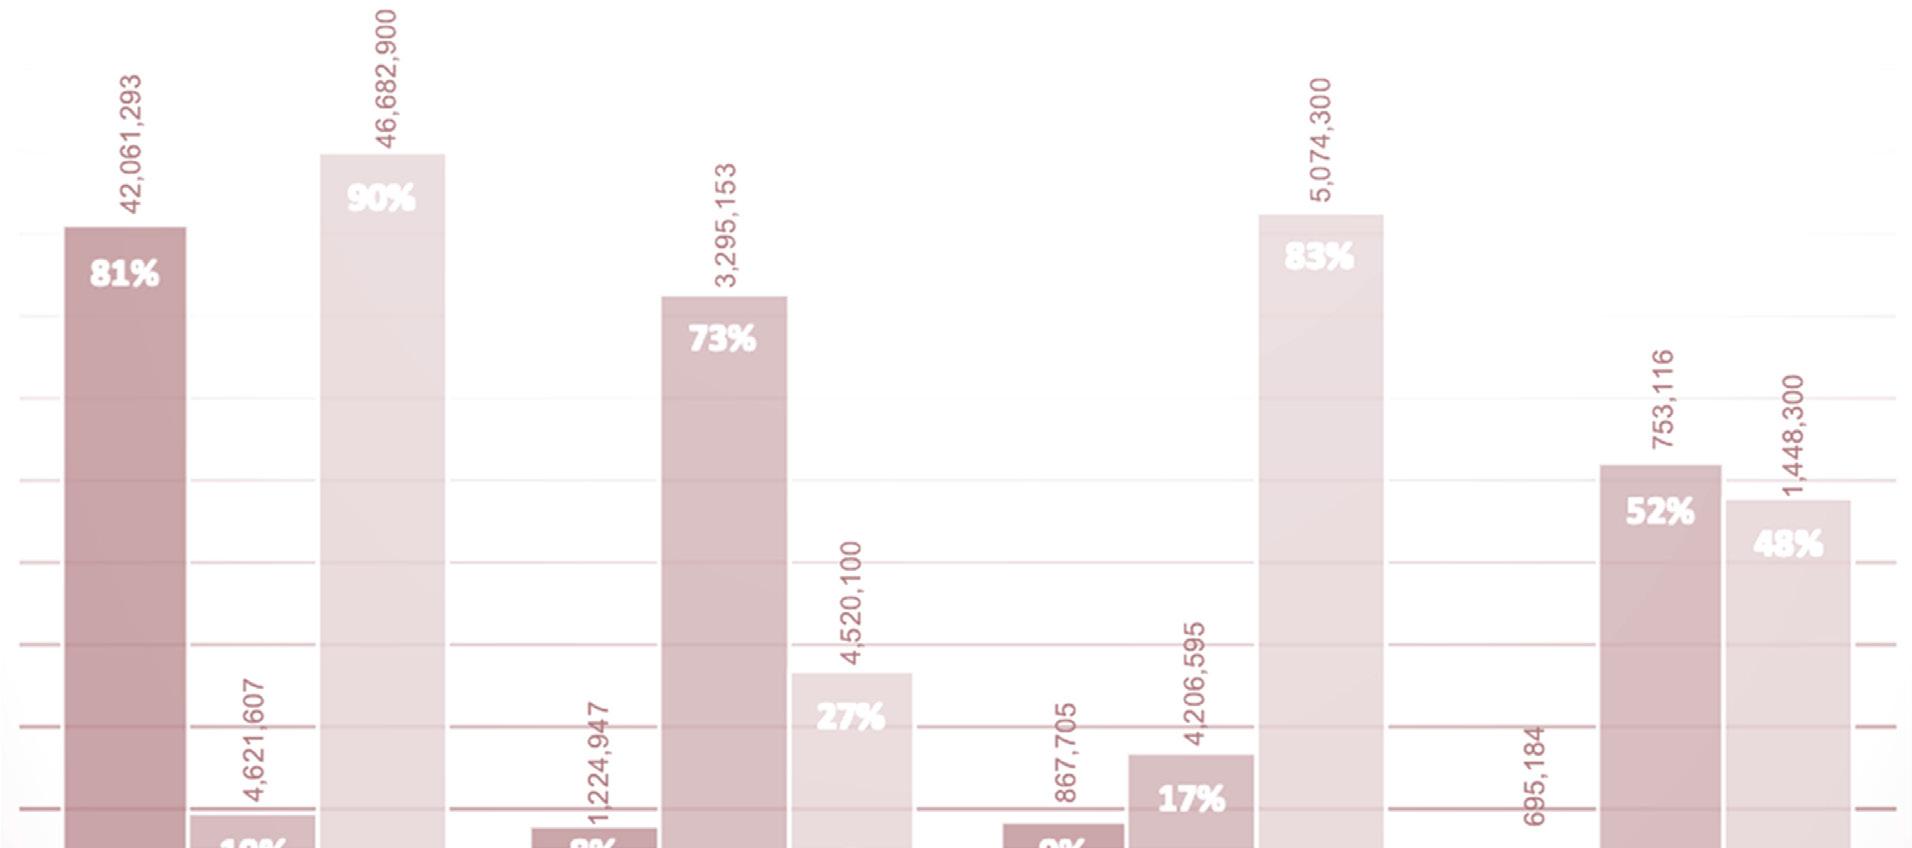

*Coloured people are of mixed ancestry African and/or White and/or Asian
A close look at the demographics of health care funding in South Africa, illustrated in Figure 2 above, reveals that only 10% of the African population had private funding, while 90% depended on the resource-constrained government. This is problematic because the population group that would benefit the most from the mainstreaming of pharmacogenomics is the least funded. For this reason, the government of South Africa has proposed National Health Insurance with the objective of attaining equitable funding of healthcare services.
REFERENCES
Aderemi-Williams R I, Awodele O, Boyle CA. 2015. Adverse drug reactions amongst adult patients admitted in Lagos State University Teaching Hospital, Lagos, Nigeria. Bentham Science Publishers; 10(2): 136-144.
Benkirane RR, Abouqal R, Haimeur CC, et al. 2009. Incidence of adverse drug events and medication errors in intensive care units: a prospective multicenter study. Journal of Patient Safety; 5(1): 16-22.
Benkirane R, et al. 2009. Prevalence and preventability of adverse drug events in a teaching hospital: a crosssectional study’, East Mediterranean Health Journal; 15(5): 1145-1155.
Chan SL, et al. 2019. Economic burden of adverse drug reactions and potential for pharmacogenomic testing in Singaporean adults. Pharmacogenomics Journal; 19(4): 401-410.
Classen DC, et al. 1991. Computerized surveillance of adverse drug events in hospital patients. JAMA; 266: 28472851.
Cooke DI, van der Merwe W, Pudifin DJ. 1985. Hospital admissions for adverse reactions to drugs and deliberate self-poisoning. S Afr Med J; 67(19): 770-772.
Dandara C, et al. 2019. African Pharmacogenomics Consortium: Consolidating pharmacogenomics knowledge, capacity development and translation in Africa. AAS Open Research; 2: 19.
Dedefo MG, et al. 2016. Incidence and determinants of medication errors and adverse drug events among hospitalized children in West Ethiopia. BMC Pediatrics; 16: 81.
Dunnenberger HM, et al. 2015. Preemptive clinical pharmacogenetics implementation: Current programs in five US medical centers. Annual Review of Pharmacology and Toxicology; 55: 89-106.
Eshetie TC, et al. 2015. Adverse drug events in hospitalized children at Ethiopian University Hospital: a prospective observational study. BMC Pediatrics; 15(1): 83.
Goettler M, Schneeweiss S, Hasford J. 1997. Adverse drug reaction monitoring – Cost and benefit considerations part I: Cost and preventability of adverse drug reactions leading to hospital admission. Pharmacoepidemiology and Drug Safety; 6 (Suppl 3): 71-77.
Jennane N, et al. 2011. Incidence of medication errors in a Moroccan medical intensive care unit. International Archives of Medicine; 4: Article no. 32. https://link.springer.com/article/10.1186/1755-7682-4-32
Keeling NJ, et al. 2019. Preemptive pharmacogenetic testing: exploring the knowledge and perspectives of US payers. Genetics in Medicine; 21(5): 1224-1232.
Kiguba R, Karamagi C, Bird SM. 2017. Incidence, risk factors and risk prediction of hospital-acquired suspected adverse drug reactions: a prospective cohort of Ugandan inpatients. BMJ Open; 7(1): e010568.
Klein ME, Parvez MM, Shin JG. 2017. Clinical implementation of pharmacogenomics for personalized precision medicine: barriers and solutions. Journal of Pharmaceutical Sciences; 106(9): 2368-2379.
Letaief M, et al. 2010. Adverse events in a Tunisian hospital: results of a retrospective cohort study. International Journal for Quality in Health Care; 22(5); 380-385.
Mabadeje A F, Ilawole CO. 1979, Adverse drug reactions in the medical wards of the Lagos University Teaching Hospital: an intensive study. Nigeria Medical Association; 9(3): 379–382.
Masimirembwa C, Hasler JA. 2013. Pharmacogenetics in Africa, an opportunity for appropriate drug dosage regimens: on the road to personalized healthcare. CPT: Pharmacometrics and Systems Pharmacology; 2(5); 2-5.
Matimba A, et al. 2008. Establishment of a biobank and pharmacogenetics database of African populations. European Journal of Human Genetics; 16: 780-783.
Matsaseng T, Moodley J. 2005. Adverse events in gynaecology at King Edward VIII Hospital, Durban, South Africa. Journal of Obstetrics and Gynaecology; 25(7): 676-680.
Mehta UC. 2011. Pharmacovigilance : the devastating consequences of not thinking about adverse drug reactions. CME; 29(6): 247-251.
Mekonnen AB, et al. 2018. Adverse drug events and medication errors in African hospitals: a systematic review. Drugs - Real World Outcomes; 5(1): 1-24.
Mouton JP, et al. 2015. Mortality from adverse drug reactions in adult medical inpatients at four hospitals in South Africa: a cross-sectional survey. British Journal of Clinical Pharmacology; 80(4): 818-826.
Mouton JP, et al. 2016. Adverse drug reactions causing admission to medical wards: A cross-sectional survey at 4 hospitals in South Africa. Medicine (United States); 95(19): 1-10.
NIH. 2020. Pharmacogenomics FAQ | NHGRI, National Human Genome Research Institute. Available at: https:// www.genome.gov/FAQ/Pharmacogenomics (Accessed: 23 September 2020).
Oshikoya KA, Ojo OI. 2007. Medication errors in paediatric outpatient prescriptions of a teaching hospital in Nigeria. Nigerian Quarterly Journal of Hospital Medicine; 17(2): 74-78.
Oshikoya K. 2006. Adverse drug reactions in children: types, incidence and risk factors. Nigerian Journal of Pediatrics; 33(2): 29-35.
Oshikoya KA, et al. 2011. Incidence and cost estimate of treating pediatric adverse drug reactions in Lagos, Nigeria. Sao Paulo Medical Journal; 129(3): 153-164.
SANAC. 2017. Let Our Actions Count: South Africa's National Strategic Plan for HIV, TB and STIs 2017-2022. 1-32. https://sanac.org.za/wp-content/uploads/2017/06/NSP_FullDocument_FINAL.pdf (Accessed 26 October 2020)
Schnippel K, et al. 2018. Direct costs of managing adverse drug reactions during rifampicin-resistant tuberculosis treatment in South Africa. International Journal of Tuberculosis and Lung Disease; 22(4): 393-398.
South African Council for Medical Schemes. 2018.) CMS Annual Report. Pretoria, CMS.
Sultana J, Cutroneo P, Trifirò G. 2013. Clinical and economic burden of adverse drug reactions. Journal of Pharmacology and Pharmacotherapeutics; 4(Suppl 1): 73-77.
Tipping B, Kalula S, Badri M. 2006. The burden and risk factors for adverse drug events in older patients - a prospective cross-sectional study, S Afr Med J; 96(12): 1255-1259.
Tumwikirize WA, et al. 2011. Adverse drug reactions in patients admitted on internal medicine wards in a district and regional hospital in Uganda. Africa Health Sciences; 11(1). 72-78.
Verbelen M, Weale ME, Lewis CM. 2017. Cost-effectiveness of pharmacogenetic-guided treatment: Are we there yet?. Pharmacogenomics Journal; 17(5): 395-402.
THE IMPACT OF CHRONIC DISEASE medicine compliance on patient outcomes
AUTHORS Evan Bradley Alice Bock
PEER REVIEWER: Graham Hukins
EXECUTIVE SUMMARY
Although it is generally accepted that improved medicine compliance leads to improved health outcomes for chronic patients, it was considered valuable to demonstrate this through detailed data analysis within the southern African private health care industry. The aim of this analysis was therefore to investigate the correlation between medicine compliance among chronic beneficiaries and their health outcomes. Three common chronic conditions were considered, namely hypertension, diabetes and human immunodeficiency virus (HIV). The health outcomes considered were the chronic disease-related hospitalisation rates for each condition as well as the lower limb amputation rate in the case of diabetes sufferers.
The data considered included claims payment, membership and hospital authorisation data from a mixture of open and restricted southern African medical schemes, covering in excess of 220 000 beneficiaries.
Chronic beneficiaries, diagnosed with hypertension, diabetes or HIV, were identified based on relevant claims experience within 2019 and their medicine compliance was measured as the number of months where there was evidence of relevant medication claims as a percentage of the months of active chronic disease exposure.
The percentage of compliant months had a demonstrable impact on hospital admission rates for each of the three chronic conditions considered, although only HIV and diabetes showed a statistically significant difference in hospitalisation rate between beneficiaries with compliance over 80% compared to those with a lower compliance level. There appears to be a trend towards better outcomes once compliance levels are above 50%.
Further research in this area could include analyses that take into account more chronic conditions, risk-adjustment, measurement of additional outcomes as well as consideration of the drivers of variation in medical compliance rates.
DEFINITIONS
Table 1 provides definitions of a number of concepts discussed in this paper.
TABLE 1. DEFINITION OF TERMS
TERM/CONCEPT Chronic beneficiary/patient
Active chronic disease exposure
Medicine compliance (or medicine adherence)
Health outcomes
Hospitalisation/admission rate
Lower limb amputation rate
ICD 10 code
NAPPI code ATC code DEFINITION A chronic beneficiary or chronic patient is considered for the purposes of this paper to be a medical scheme beneficiary identified as suffering from hypertension, diabetes or HIV. The period of active chronic exposure was considered to be the period between the maximum of the month of the first chronic claim, the date of joining the medical scheme or January 2019 to the minimum of the month of exiting the scheme or December 2019. "This measures the extent to which chronic disease patients follow their intended medicine treatment regimen. This is often measured as a percentage figure representing the proportion of treatment months for which there is evidence of the patient having taken (or collected) their medication for the treatment of their chronic condition. This was calculated as the number of compliant months as a percentage of the months of active chronic disease exposure. A month was considered compliant if there was evidence of a claim for relevant chronic medication. " The health outcomes analysed for the purpose of this investigation were the disease-related hospital admission rate for each of the diseases considered, as well as lower limb amputation rate in the case of diabetes. The means of identifying instances of negative outcomes is considered further below. The hospitalisation rate per disease was calculated as the count of diseasesuffering beneficiaries with a relevant hospital admission divided by the total annual active chronic exposure. The lower limb amputation rate was calculated as the count of diabetes-suffering beneficiaries with a relevant amputation event divided by the total annual active chronic exposure. International Classification of Diseases, Tenth Revision. These codes classify diseases within diagnosis groupings. National Pharmaceutical Product Index. These codes identify medicines. Anatomical Therapeutic Chemical. These codes identify medicines.
INTRODUCTION
Within the South African medical schemes industry, medicine compliance is used as a key managed care metric in order partly to inform the success of managed care programmes. It is generally accepted that improved compliance leads to improved health outcomes for chronic patients.
However, to an extent, there is limited information to demonstrate the extent to which compliance impacts key health outcomes, particularly within a southern African context, as well as to inform what would be considered a reasonable compliance benchmark, below which there is a clear discrepancy in the rate of negative outcomes.
This paper considers the relationship between medicine compliance and certain key health outcomes in respect of hypertension, diabetes and HIV chronic patients. The health outcomes include disease-related hospital events, as well as lower limb amputation in the case of diabetes patients.
Experience, in terms of both compliance and health outcomes, was measured for the year 2019.
Graphical trends related to the rate of negative health outcomes for various levels of medicine compliance were examined to provide a visual assessment of the relationship between compliance and outcomes.
In addition, t-tests were considered for an 80% compliance benchmark to assess whether the rate of negative health outcomes is statistically significantly different for those with a compliance level below and above this benchmark figure.
The aims of this paper are therefore two-fold:
To examine the correlation between medicine compliance and certain health outcomes
To consider the appropriateness of 80% as a compliance benchmark above which outcomes notably improve.
LITERATURE REVIEW
Medication adherence thresholds
An early study into patient compliance by Haynes et al (1980) defined a compliant patient as one who consumed at least 80% of their medications, and this definition has continued to be widely used by researchers. However, in a systematic review of medication adherence thresholds, Baumgartner et al (2018) propose that different diseases, medications and patient characteristics have an impact on the threshold above which the clinical outcome is satisfactory. In their review, five studies found threshold levels ranging from 46% to 92%, while one study confirmed the 80% threshold to be valid.
In a similar study of adherence in schizophrenia, diabetes, hypertension and congestive heart failure sufferers, Karve et al (2009) found the optimal adherence value in predicting disease-specific hospitalisation to range from 58% to 85%. They suggest that the 80% cut-off point often used in research may be valid.
Disease-specific studies have also found that a range of threshold levels may be applicable depending on multiple factors. For example, Lo-Ciganic et al (2015) used machine learning to examine medication adherence thresholds and the risk of hospitalisation in diabetic patients. They found that depending on the patients’ health and medication complexity, adherence thresholds varied from 46% to 94%. Several predictors of hospitalisation were identified including prior hospitalisations, number of prescriptions, diabetes complications, insulin use and number of prescribers. These factors would need to be taken into account together with compliance to accurately predict the likelihood of hospitalisation.
Other disease-specific studies appear to confirm the validity of the 80% benchmark. For example, Mazzaglia et al (2009) investigated the impact of adherence to hypertensive medication on acute cardiovascular events. Patients’ adherence was categorised as high at above 80%, intermediate between 40% and 79%, and low when below 40%. It was found that only high-adherence patients had a significantly decreased risk of acute cardiovascular events.
Diabetes compliance and patient outcomes
There is evidence that compliance with diabetes medication can result in better control of intermediate risk factors, fewer hospitalisations and lower mortality. For example, Ho et al (2006) investigated the association between adherence to medications and mortality among patients with diabetes and ischaemic heart disease. The study focused on compliance with cardioprotective medications and mortality among patients. They found that adherent patients had significantly lower mortality rates.
Similarly, a study by Lin et al (2017) measured the medication adherence and patient outcomes of newly diagnosed diabetic patients in Singapore. They concluded that patients with poor adherence (<40%) had poor glycaemic control and were statistically more likely to have a hospitalisation or emergency department visit.
In a review of available literature on the impact of adherence on glycaemic control in diabetic patients, Asche et al (2011) observed that 57% of studies found an association between improved outcomes and medication adherence. The most common method for assessing compliance was using either pharmacy claims or refill records. Other studies used a variety of subjective patient-reported adherence assessments. The studies using pharmacy claims or refill records tended to show greater association between medicine compliance and improved outcomes.
Hypertension compliance and patient outcomes
Poor adherence to hypertension medication has been linked to a higher risk of hospitalisation as well as mortality. Kim et al (2016) demonstrated that mortality rates were 81% higher in patients with medicine compliance lower than 50% compared to those above 80%. Pittman et al (2010) also concluded that patients with medication adherence above 80% had a 33% lower risk of hospitalisation.
In a meta-analysis, Cramer et al (2008) found that of the 139 studies analysed, 73% showed that good compliance with diabetes, hypertension and hyperlipidaemia medication had a positive effect on patient outcomes.
HIV compliance and patient outcomes
Non-adherence to antiretroviral treatment can result in increasing viral loads and ultimately a greater number of hospitalisations and deaths. In addition, poor adherence can result in drug resistance, which makes future treatment more difficult.
Paterson et al (2000) found that adherence was significantly associated with a decrease in viral load and an increase in CD4 count. They found that patients were admitted to hospital less frequently when they had an adherence rate greater than 95%, and that they were less likely to experience opportunistic infections.
Other studies have found that outcomes can be positively impacted at compliance levels lower than 95%, but this is dependent on the drug regimen implemented.
STUDY DESIGN
The study had a descriptive design based upon a record review of private medical schemes’ data, where the schemes provided cover to in excess of 220 000 beneficiaries in 2019.
Consent
Medical scheme beneficiaries provided informed consent to their respective medical schemes as part of scheme registration and participation agreements, where data captured can be used for the purposes of managing and improving medical treatment approaches and health outcomes, as well as for related analyses.
Confidentiality
Confidentiality of patient information has been maintained. Data were provided to the authors of this paper through the course of consulting appointments to the relevant medical schemes. These appointments required signed non-disclosure agreements. The data considered for the analysis in this paper also did not include names or contact details, and no individualised reporting has been shown.
Inclusion criteria
Chronic patients were identified as those with evidence of relevant claims during 2019, based on examination of ICD 10 diagnosis codes in claims payment data.
Table 2 considers how chronic patients were identified for the purposes of analysing compliance and health outcomes.
TABLE 2. IDENTIFICATION OF CHRONIC PATIENTS
Exclusions DISEASE Diabetes Hypertension HIV METHOD OF IDENTIFICATION OF PATIENT Beneficiaries with claims under ICD 10 codes E10 to E14 with an incurred date within 2019 Beneficiaries with claims under ICD 10 codes I10 to I15 with an incurred date within 2019 Beneficiaries with claims under ICD 10 codes B20 to B24 with an incurred date within 2019
No chronic patients were explicitly excluded. However, it is recognised that certain beneficiaries suffering from hypertension, diabetes or HIV would not have been identified where there was no evidence of claims experience related to their condition.
Sampling
No particular sampling was done, as the aim was to identify and analyse all beneficiaries suffering from the relevant chronic conditions. Table 3 details the number of chronic patients identified per disease (i.e. the size of the cohort) and the prevalence of the disease within the population considered (i.e. the cohort size as a proportion of the total number of beneficiaries participating on the medical schemes).
TABLE 3. SUMMARY OF VOLUME OF CHRONIC PATIENTS ANALYSED
METHODOLOGY DISEASE
Diabetes Hypertension HIV
NUMBER OF PATIENTS IDENTIFIED 12 947 21 811 8 852
DISEASE PREVALENCE (% OF TOTAL BENEFICIARIES) 5.8% 9.8% 4.0%
Collection of data
Data from four southern African medical schemes were considered. These schemes are considered diverse in terms of a number of characteristics, including size, benefit design and population demographics, and also include a mixture of open and restricted medical schemes. This enhances the credibility of the ultimate results.
These schemes provided cover to in excess of 220 000 beneficiaries in 2019, and therefore included relatively significant volumes.
Data were provided to the authors of this paper through the course of consulting appointments to the relevant medical schemes. This included monthly data extracts in a variety of digital file formats, namely XLSX, CSV and TXT. These data were provided via secure file transfer protocol sites.
Data file types included those related to detailed line-by-line claims payment information, membership records and hospital admission authorisations. Consolidated data files were constructed per data type and medical scheme for the period of the study, and the required data fields were extracted from these files for the purposes of the study, as considered in the next subsection.
Extraction of data
Table 4 considers the three types of data required per medical scheme for the purposes of informing the results in this report.
TABLE 4. DESCRIPTION OF DATA EXTRACTED
TYPE OF DATA Claims payments
Membership
Hospital authorisations DESCRIPTION OF DATA Line-level detailed claims payment data including descriptive fields, dates and cost figures per claim event. This included claim service dates during 2019 and payment information until at least March 2020.
Information related to medical scheme registration and active periods of scheme membership per beneficiary Detailed information per hospital admission describing the period and cause thereof. This is often captured KEY DATA FIELDS REQUIRED Service/treatment date NAPPI/ATC medicine code Tariff code Provider discipline code ICD 10 (diagnosis) code
within an authorisation data system. Date of joining scheme Date of leaving scheme Admission date Primary ICD 10 code
The data above were the minimum required in order to achieve the following:
Identification of beneficiaries suffering from hypertension, diabetes or HIV (ICD 10 codes in claims payment data)
Measurement of period of active chronic exposure (treatment dates, date of joining/leaving the scheme)
Measurement of medicine compliance (NAPPI/ATC codes, treatment dates)
Identification of negative health outcomes (tariff code, discipline code, hospital admission dates and hospital primary ICD 10 codes)
The sub-section below further considers how the data were analysed.
Analysis of data
MEASUREMENT OF COMPLIANCE
Medicine compliance was calculated as the number of compliant months as a percentage of the months of active chronic disease exposure. A month was considered compliant if there was evidence of a claim for relevant chronic medication. The period of active chronic exposure was considered to be the period between the maximum of the month of the first chronic claim, the date of joining the medical scheme or January 2019 to the minimum of the month of exiting the scheme or December 2019.
Relevant medication claims were identified as described in Table 5.
DISEASE Diabetes Hypertension
HIV CRITERIA TO IDENTIFY RELEVANT MEDICATION CLAIMS Claims relating to ATC codes beginning with A10 Claims relating to ATC codes beginning with C02, C07 and C09; C04AX02; C08CA01; C08CA02; C08CA03; C08CA13; C10BX03; G04CA01; G04CA03 Claims including an ATC code beginning with J05AR
Figure 1 shows the proportion of chronic patients by compliance level per disease.
patients chronic Proportion
35%
of
30%
25%
20%
15%
10%
5%
0%
Diabetes Hypertension HIV 0% ‐ 9% 10% ‐ 19%20% ‐ 29%30% ‐ 39%40% ‐ 49%50% ‐ 59%60% ‐ 69%70% ‐ 79%80% ‐ 89%90% ‐ 99% 100% 17% 3% 3% 3% 3% 8% 6% 7% 12% 13% 25% 20% 4% 3% 3% 2% 6% 5% 6% 11% 12% 28% 16% 1% 1% 2% 2% 7% 6% 9% 13% 14% 29%
Medicine compliance band
Diabetes Hypertension HIV
Fifty percent of diabetes patients are more than 80% compliant; 51% of hypertension patients are more than 80% compliant. HIV demonstrates the highest average rate of medicine compliance; 56% of HIV patients are more than 80% compliant.
MEASUREMENT OF HEALTH OUTCOMES
The health outcomes analysed for the purpose of this investigation were the disease-related hospital admission rate for each of the diseases considered, as well as the lower limb amputation rate in the case of diabetes.
Table 6 on page 100 outlines the criteria that were applied in identifying relevant hospital admissions.
TABLE 6. IDENTIFICATION OF INSTANCES OF NEGATIVE HEALTH OUTCOMES
DISEASE Diabetes
Hypertension
HIV CRITERIA TO IDENTIFY RELEVANT OUTCOMES Diabetes-related hospitalisation: hospital admissions with primary ICD 10 codes of E10 to E14 with an admission date within 2019. Lower limb amputation: Claims with an incurred date within 2019 displaying either of the following: 1. ICD 10 S88 / S98 2. Tariff code 0697, 0699, 0701, 0703 or 0705 with provider discipline code 10, 14, 28 or 42 Stroke admissions: hospital admissions with primary ICD 10 codes of I63 or I64 with an admission date within 2019. HIV-related hospital admission: hospital admissions with primary ICD 10 codes A09, A15 to A19, B20 to B24 or K52 with an admission date within 2019.
The hospitalisation rate per disease was calculated as the count of disease-suffering beneficiaries with a relevant hospital admission divided by the total annual active chronic exposure.
The lower limb amputation rate was calculated as the count of diabetes-suffering beneficiaries with a relevant amputation event divided by the total annual active chronic exposure.
COMPARING HEALTH OUTCOMES TO MEDICINE COMPLIANCE
The proportion of patients within each compliance band who were hospitalised was established by examining hospital authorisation data for 2019. In addition, for diabetic patients, the lower limb amputation rate was determined per compliance band.
The outcomes of the analysis of the relationship between compliance and health outcomes were derived from the visual and graphical assessment of trends as well as t-tests.
Two-tailed t-tests were used to assess the statistical significance of differences between the average rate of negative outcomes per month for those with compliance levels below 80%, compared to those with higher compliance levels. These tests were conducted using the statistical analysis package within Microsoft Excel.
For the purposes of the t-tests, those with compliance levels below 10% were excluded from the analysis, as many of these individuals appeared potentially not to be true chronic patients. It is expected that many of these patients have been identified as potential chronic patients due to isolated events of diagnosis miscoding in the claims data.
STUDY RESULTS
Hypertension
Figure 2 shows the proportion of hypertension sufferers who had a stroke admission in 2019 per compliance band.
2.0%
hospitalised Proportion
1.8% 25%
1.6%
1.4%
1.2%
1.0%
0.8%
0.6%
0.4% 5%
0.0%
Medicine compliance
Proportion hospitalised Proportion of patients 0% to 9% 10% to 19% 20% to 29% 30% to 39% 40% to 49% 50% to 59% 60% to 69% 70% to 79% 80% to 89% 90% to 99% 100%
0.7% 1.5% 1.8% 1.7% 0.8% 0.8% 0.9% 1.2% 0.8% 0.6% 1.0% 20% 4% 3% 3% 2% 6% 5% 6% 11% 12% 28% 30%
20%
15%
10%
0.2%
patients of Proportion
0%
Stroke admissions were most prevalent in those with a compliance percentage of less than 40%.
In other words, it can generally be concluded that those with relatively higher compliance showed lower rates of hospitalisation, although there was less differentiation above a compliance level of 40%.
The average stroke admission rate for beneficiaries with less than 80% compliance (excluding less than 10% compliance) was 1.2% compared to 0.8% for those with compliance of greater than 80%.
Despite the fact that the hospitalisation rate was slightly lower, the t-test did not show enough statistical evidence (at a 5% significance level) to conclude that those with 80% or higher compliance have a lower hospitalisation rate (t(106,710) = 1.91; p = 0.06).
Diabetes
Figure 3 shows the proportion of diabetes sufferers who had a diabetes-related hospital admission in 2019 per compliance band.
16.0%
hospitalised Proportion
14.0% 25%
12.0% 5%
10.0%
8.0%
6.0%
4.0%
0.0%
Medicine compliance
Proportion hospitalised
Proportion of patients 0% to 9% 10% to 19% 20% to 29% 30% to 39% 40% to 49% 50% to 59% 60% to 69% 70% to 79% 80% to 89% 90% to 99% 100%
8.4% 14.2% 13.0% 14.3% 13.5% 10.3% 11.2% 11.0% 8.5% 7.5% 10.7% 17% 3% 3% 3% 3% 8% 6% 7% 12% 13% 25% 30%
20%
15%
10%
patients of Proportion
2.0%
0%
Diabetes-related admissions were most prevalent in those with a compliance rate of less than 50%. There does also appear to be evidence of continued decline in admission rates above 80% compliance.
The average admission rate for beneficiaries with less than 80% compliance was 11.9% (excluding compliance less than 10%), compared to 9.3% for those with compliance greater than 80%.
A t-test found that the rate of hospitalisation in those with 80% or higher compliance was significantly lower than for those with lower compliance (t(84,432) = 3.75; p = 0.0002).
Figure 4 on page 103 shows the number of diabetes sufferers who had a lower limb amputation event per 1000 diabetes sufferers per compliance band.
14
1,000 per rate amputation limb Lower
12
10
8
6
4
2
‐
Medicine compliance
Proportion hospitalised Proportion of patients 0% to 9% 10% to 19% 20% to 29% 30% to 39% 40% to 49% 50% to 59% 60% to 69% 70% to 79% 80% to 89% 90% to 99% 100%
13
3 3 12 12 11 8 6 2 8 17% 3% 3% 3% 3% 8% 6% 7% 12% 13% 25% 30%
25%
20%
15%
10%
patients of Proportion
5%
0%
Lower limb amputations were most prevalent in those with a compliance rate of less than 10% or between 40% and 70%.
The average rate of lower limb amputations per 1000 beneficiaries with less than 80% compliance was 8.26 per 1000 (excluding compliance less than 10%), compared to 5.77 for those with compliance greater than 80%. A t-test showed no statistical evidence to conclude that those with 80% or higher compliance have a lower amputation rate (t(80,810) = 1.37; p = 0.17).
HIV
10.0%
hospitalised Proportion
9.0%
8.0%
7.0%
6.0%
5.0%
4.0%
3.0%
2.0%
1.0%
0.0%
Medicine compliance
Proportion hospitalised Proportion of patients 0% to 10% 10% to 20% 20% to 30% 30% to 40% 40% to 50% 50% to 60% 60% to 70% 70% to 80% 80% to 90% 90% to 100% 100%
7.3% 5.9% 8.8% 8.8% 2.0% 3.5% 4.1% 1.9% 2.1% 1.5% 2.7% 16% 1% 1% 2% 2% 7% 6% 9% 13% 14% 29% 35%
30%
25%
20%
15%
10%
5%
patients of Proportion
0%
HIV-related admissions were most prevalent in those with a compliance rate of less than 50%.
The average admission rate for beneficiaries with less than 80% compliance was 3.7% (excluding compliance less than 10%) compared to 2.2% for those with higher than 80% compliance. A t-test found that the rate of hospitalisation in those with 80% or higher compliance was significantly lower than those with lower compliance (t(42,282) = 3.11; p = 0.002).
RECOMMENDATIONS AND CONCLUSIONS
Conclusions
For each of the diseases considered there is evidence to corroborate the hypothesis that improved medicine compliance reduces the rate of the negative health outcomes considered. In the case of diabetes hospitalisation and HIV hospitalisation there is a statistically significant difference in the rate of hospitalisation for those with a compliance rate higher than 80% compared to those with a compliance level lower than 80%.
A literature review provided an array of research demonstrating the relationship between improved medicine compliance and improved health outcomes.
The literature review also generally supported 80% as a reasonable medicine compliance benchmark, above which health outcomes were often seen to improve noticeably. However, the results of this study do suggest (as some other studies have also suggested) that different compliance threshold levels may be applicable to different diseases.
Trend analysis suggests that compliance levels lower than 50% notably result in higher hospital admission rates.
The lack of a clear linear trend in some cases of reduced hospital admission rates with improved compliance suggests that additional underlying factors such as demographics or co-morbidities need to be adjusted for.
Recommendations
Risk-adjustment is an area of further research that would enhance understanding of the relationship between compliance and health outcomes.
The number of chronic conditions considered could be increased to compare and contrast experience across a broader range of diseases.
Additional health outcomes could also be measured in order to provide a more consolidated picture of the relationship between medicine compliance and the risk of negative health outcomes, as it is recognised that the health outcomes considered in this paper are not exhaustive. These include mortality rates and pathology test results such as blood pressure levels for hypertension patients, HbA1c levels for diabetes patients and CD4 count and viral load monitoring for HIV patients.
A study to further understand the variation in compliance rates and drivers of low compliance may also add value by providing insight into how to improve medicine compliance and, ultimately, the health of chronic patients.
REFERENCES
Asche C, LaFleur J, Conner C. 2011. A review of diabetes treatment adherence and the association with clinical and economic outcomes. Clin Ther; 33(1): 74-109. doi: 10.1016/j.clinthera.2011.01.019. PMID: 21397776.
Baumgartner PC, Haynes RB, Hersberger KE, Arnet I. 2018. A systematic review of medication adherence thresholds dependent of clinical outcomes. Front Pharmacol; 9: 1290. doi:10.3389/fphar.2018.01290.
Cramer JA, Benedict A, Muszbek N, Keskinaslan A, Khan ZM. 2008. The significance of compliance and persistence in the treatment of diabetes, hypertension and dyslipidaemia: a review. Int J Clin Pract; 62(1): 76-87. doi:10.1111/j.1742-1241.2007.01630.x.
Haynes RB, Taylor DW, Sackett DL, Gibson ES, Bernholz CD, Mukherjee J. 1980. Can simple clinical measurements detect patient noncompliance? Hypertension; 2: 757-764.
Ho PM, Magid DJ, Masoudi FA, McClure DL, Rumsfeld JS. 2006. Adherence to cardioprotective medications and mortality among patients with diabetes and ischemic heart disease. BMC Cardiovasc Disord; 6: 48. doi: 10.1186/1471-2261-6-48. PMID: 17173679; PMCID: PMC1762024.
Karve S, Cleves MA, Helm M, Hudson TJ, West DS, Martin BC. 2009. Good and poor adherence: optimal cut-point for adherence measures using administrative claims data. Current Medical Research and Opinion; 25: 23032310. DOI: 10.1185/03007990903126833.
Kim S, Shin DW, Yun JM, et al. 2016. Medication adherence and the risk of cardiovascular mortality and hospitalization among patients with newly prescribed antihypertensive medications. Hypertension; 67(3): 506-512. doi: 10.1161/HYPERTENSIONAHA.115.06731.
Lin L, Sun Y, Heng BH, et al. 2017. Medication adherence and glycemic control among newly diagnosed diabetes patients. BMJ Open Diabetes Research and Care; 5: e000429. doi: 10.1136/bmjdrc-2017-000429.
Lo-Ciganic WH, Donohue JM, Thorpe JM, et al. 2015. Using machine learning to examine medication adherence thresholds and risk of hospitalization. Med Care; 53: 720-728. 10.1097/MLR.0000000000000394.
Mazzaglia G, Ambrosioni E, Alacqua M, et al. 2009. Adherence to antihypertensive medications and cardiovascular morbidity among newly diagnosed hypertensive patients. Circulation; 120(16): 1598-1605. doi: 10.1161/CIRCULATIONAHA.108.830299. Epub 2009 Oct 5. PMID: 19805653.
Paterson DL, Swindells S, Mohr J, et al. 2000. Adherence to protease inhibitor therapy and outcomes in patients with HIV infection. Ann Intern Med; 133(1): 21-30. doi: 10.7326/0003-4819-133-1-200007040-00004. Erratum in: Ann Intern Med 2002; 136(3): 253. PMID: 10877736.
Pittman DG, Tao Z, Chen W, Stettin GD. 2010. Antihypertensive medication adherence and subsequent healthcare utilization and costs. Am J Managed Care; 16: 568-576.
Schaecher KL. The importance of treatment adherence in HIV. 2013. Am J Managed Care; 19: (12 suppl): S231S237.
