Climate Vulnerability Assessment for the City of Los Altos,
CA
Prepared by EcoShift Consulting
Executive Summary
The City of Los Altos (Los Altos) is located on the eastern edge of the Santa Cruz mountains, roughly 15 miles East of the Pacific Ocean and 5 miles from the San Francisco Bay. Proximity to these large water bodies has made for a stable climate and will somewhat temper future climate hazards compared to other areas in California.
This Vulnerability Assessment is intended to assist Los Altos in understanding the climate risks it faces under future emissions scenarios. In keeping with California Senate Bill 379, the assessment relies on resources provided by the California Governor’s Office of Emergency Services (OES) including Cal-Adapt and the California Adaptation Planning Guide to describe how the frequency and intensity of climate hazards are changing. The Vulnerability Assessment is just the first step in Los Altos’ effort in planning for and adapting to climate change, outlined in Los Altos’ Climate Action & Adaptation Plan (CAAP). The Vulnerability Assessment is an appendix to the CAAP. The documents should be read together.
Purpose of SB 379
Senate Bill No. 379 of the California Legislature requires local jurisdictions to address climate adaptation and resiliency strategies in either the local hazard mitigation plan or an update to the safety element of a jurisdiction’s General Plan, depending on the date of adoption of a local hazard mitigation plan. The update includes a climate vulnerability assessment “identifying the risks that climate change poses...and the geographic areas at risk,” along with a set of goals and strategies to address those risks.
The Cal-Adapt tool and projections of climate change taken from other government plans describe how climate is changing, but they do not describe what the impact will be on Los Altos. The goal of the Vulnerability Assessment is to understand how and how much a changing climate will impact the community sectors - assets, people, economy - that make Los Altos what it is. Adaptation strategies developed in response to the Vulnerability Assessment are described in the CAAP.
Introduction
Natural variability in the climate and weather produce extreme events like droughts, wildfires, and floods over long time periods. While natural systems respond to and even rely on these phenomena, our dense settlement and production of greenhouse gas emissions have greatly changed the impacts of climate hazards. Increased capture of solar radiation, generally referred to as global warming or climate change, is having massive and long-term effects on climatic conditions and global systems like the water cycle, jet stream and ocean currents that transfer energy. Generally, the oceans are rising and temperatures are increasing. Disruptions in jet stream patterns have caused highly unseasonal weather. Some naturally occurring hazards are expected to occur more frequently and with greater intensity, putting our infrastructure, environment, housing, and populations at greater risk.
Indicators of Climate Change in California, a report prepared by the Office of Environmental Health Hazard Assessment, describes the rapidity with which climate change has impacted the state. Included are the following statements. 1
● Average maximum temperatures have increased by 2.2°Farenheit over the past century
● The 2012 to 2016 drought was the most extreme since instrumental records began, producing a moisture deficit not seen in the last 1,200 years. It is consistent with a trend of California becoming increasingly dry.
● Glaciers in the Sierra Nevada have decreased in area dramatically, with several of the largest glaciers decreasing by half.
● The amount of water stored in the state’s snowpack has been highly variable from year to year, dropping to a record low 5% of the historical average in 2015. Snowmelt runoff during April through July has declined.
● The area burned by wildfires across the state is increasing.
● Over the past 80 years, California’s forests have been changing in response to decreasing water availability, driven by warmer temperatures. Small trees and oaks have increased, while pines have decreased.
While efforts at the State and County levels have addressed climate risks and methods to mitigate them, this document is the first to consider the climate risk to Los Altos on the local level, in accordance with SB 379. Although future climate conditions are not certain, models developed by the scientific community and recommended by the California Governor’s Office of Emergency Services (OES) provide a range of possible changes to the climate and serve as the technical basis for understanding Los Altos’ climate risk.
1 Office of Environmental Health Hazard Assessment, California Environmental Protection Agency (2018). Indicators of Climate Change in California. Sacramento, California.
Background
California has been divided into 16 different climate zones based on shared characteristics to understand the energy needs for heating and cooling throughout the year. Los Altos is in California Climate Zone 4, which uses San Jose as a reference city. The climate in Zone 4, of which Los Altos is at the very northern boundary, is inland enough to have hot summers but is influenced by the ocean which moderates high and low temperature extremes. Much of the year falls within the comfort zone of 68-80F. Typically, winters are cool and wet. However, Los Altos is in a “rain shadow” of the Santa Cruz mountains, limiting winter precipitation, as well as wind and fog as shown in Figure 1.
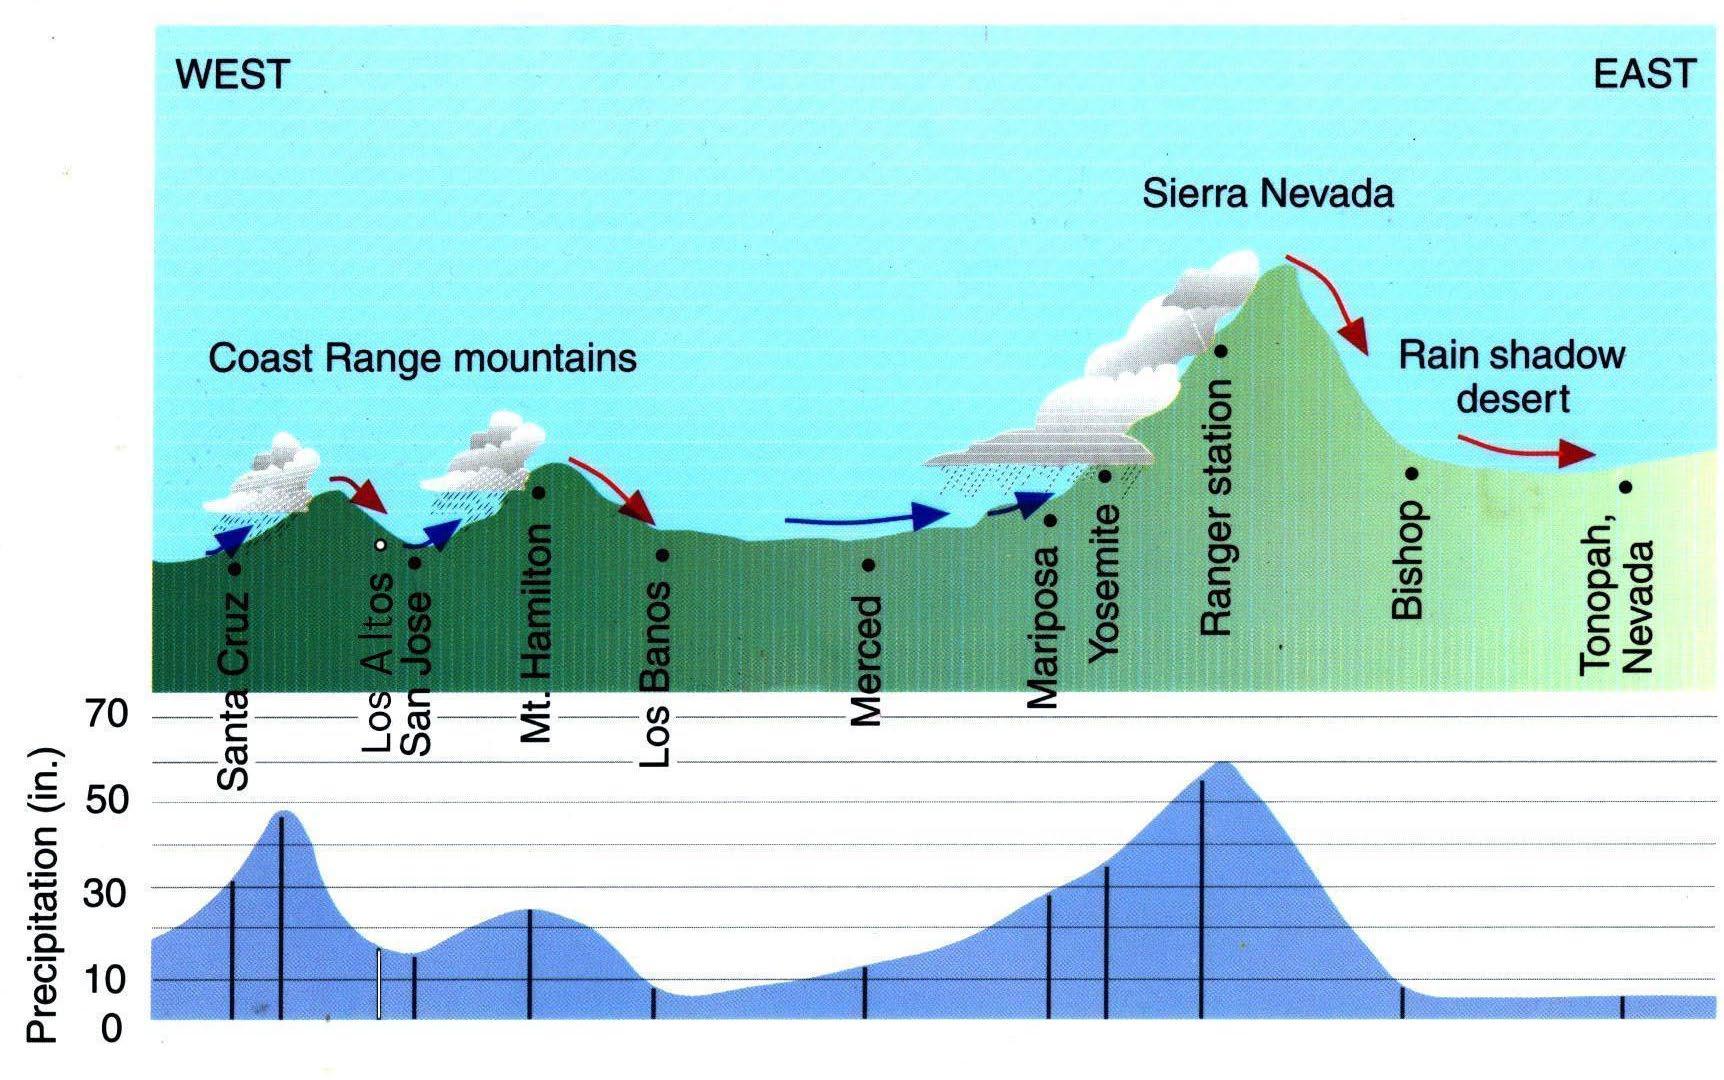
Figure 1: Relationship Between Topography and Precipitation in Simplified Cross Section of California showing how Los Altos is in a rain shadow of the Santa Cruz Mountains (Modified from: C. Ahrens, EssentialsofMeteorology , 2nd Edition)
Climate Hazard History in Los Altos
Los Altos has experienced many climate hazards since its incorporation almost 75 years ago and more in recorded history. The frequency of these hazards provides a baseline for considering future hazards, even if Los Altos continues to change and the rate of climate change is increasing. Greenhouse gas emissions will change the frequency and intensity of experienced climate hazards but will not introduce new hazards altogether. Many of these experienced hazards are enumerated in Table 1 of Federally declared disasters. Table 1 indicates the relative prevalence of climate hazards that reach the level of Federal disaster declaration. Severe winter storms that
caused flooding were the most frequent climate event followed by wildfires. Since the Federal government declares disasters at a county-wide scale, the severity of damage to Los Altos specifically is difficult to ascertain from this data set alone.
Incident Type
Biological
Coastal Storm
Declaration Title
COVID-19
COVID-19 PANDEMIC
COASTAL STORMS, FLOODS, SLIDES & TORNADOES
Drought DROUGHT
Date
FEMA Declaration
March 13, 2020 EM-3428-CA
March 22, 2020 DR-4482-CA
February 9, 1983 DR-677-CA
January 20, 1977 EM-3023-CA
Earthquake LOMA PRIETA EARTHQUAKE October 18, 1989 DR-845-CA
Fire GRASS, WILDLANDS, & FOREST FIRES
CROY FIRE
SUMMIT FIRE
WILDFIRES
SCU LIGHTNING COMPLEX FIRE
WILDFIRES
SEVERE STORMS, FLOOD, MUDSLIDES & HIGH TIDE
Flood
Freezing
Hurricane
Severe Storm(s)
SEVERE STORMS & FLOODING
SEVERE WINTER STORMS, FLOODING, AND MUDSLIDES
July 18, 1985 DR-739-CA
September 25, 2002 FM-2465-CA
May 22, 2008 FM-2766-CA
June 28, 2008 EM-3287-CA
August 21, 2020 FM-5338-CA
August 22, 2020 DR-4558-CA
January 7, 1982 DR-651-CA
February 21, 1986 DR-758-CA
April 1, 2017 DR-4308-CA
SEVERE FREEZE February 11, 1991 DR-894-CA
HURRICANE KATRINA EVACUATION
SEVERE WINTER STORMS, FLOODING, LANDSLIDES, MUD FLOWS
SEVERE WINTER STORMS, FLOODING LANDSLIDES, MUD FLOW
SEVERE STORMS, FLOODING, MUD AND LANDSLIDES
SEVERE WINTER STORMS AND FLOODING
SEVERE WINTER STORMS, FLOODING, AND MUDSLIDES
September 13, 2005 EM-3248-CA
January 10, 1995 DR-1044-CA
March 12, 1995 DR-1046-CA
January 4, 1997 DR-1155-CA
February 9, 1998 DR-1203-CA
February 14, 2017 DR-4301-CA
Table 1: Relative prevalence of climate hazards that reach the level of Federal disaster declaration
FEMA declares disasters on a county level, even if the disaster only affected part of the county. Pandemics and earthquakes, though shown in Table 1, are not climate hazards so are not discussed in this report. Notably absent from the table are several multi-year droughts, based on how FEMA calculates event losses. The only FEMAdeclared emergency classified as a drought - in all of California’s history - occurred in 1977. However, Santa Clara County has experienced three additional extended year droughts: 1987-1992, 2007-2009, 2012-2017. As of this writing (summer 2021), California is experiencing persistent severe drought.
Based on this history and Cal-Adapts projections, this vulnerability assessment has been framed around three climate-related groups of hazards:
1. Temperature, Extreme Heat & Drought
2. Precipitation & Flooding
3. Wildfires & Air pollution
Reports produced by other jurisdictions may include different climate variables and climate hazards, or categorize the variables and hazards differently based on their climate conditions.
Temperature, Extreme Heat & Drought
Average temperatures and the number of extreme heat days are projected to increase throughout the century, according to Cal-Adapt. The number of extreme heat days are projected to be almost 300% more in a high emissions scenario than in a medium emissions scenario.
Whether or not droughts get worse depends on the definition of drought. One definition is a prolonged period with below-average or no precipitation. The length of dry spells is expected to increase as much as 15%, while average annual precipitation is not expected to change. Higher temperatures combined with less consistent rain will impact both water supply and outdoor water demand.
Climate Hazards like droughts, heat waves, and air pollution are stressors that are usually less dynamic than floods or wildfires. Droughts occur on a slower timeline and can last longer than other climate hazards. Droughts may not cause a loss of property or impair infrastructure like other hazards, but prolonged droughts impact the environment, the economy, and residents’ quality of life. The Santa Clara County Operational Area (OA) Hazard Mitigation Plan declares:
Historical drought data regarding Santa Clara County OA indicate four significant droughts over the last 40 years, with drought occurring in 12 of those 40 years. Based on risk factors and this history, droughts likely will continue to occur in the Santa Clara County OA. Moreover, as temperatures increase, probability of future droughts will likely
increase as well. Therefore, droughts likely will occur in Santa Clara County at varied severities in the future, even after conclusion of the current [2012-2017]drought. 2
Similarly, across Santa Clara County, several extreme heat events were experienced in the past 20 years, including during 2000, 2006, and 2009. None of these were Federally-declared disasters. Yet heat waves have become stronger across the region, including mid-summer night-time heat waves and increases in day-time heat waves. Though heat waves are invisible, they can have great impacts on human health, particularly for vulnerable populations.
Precipitation & Flooding
Los Altos has experienced numerous severe winter storms that have caused flooding, and multiple climate models predict at least one severe storm a year under high emissions scenarios by the end of the century (See the section Future Changes to Climate Hazards, below). Interestingly, while severe storms will happen more frequently, they will not be much more intense according to projections produced by Cal-Adapt. Similarly, the average annual precipitation is not expected to change.
Floods are caused by the duration, intensity, and spatial distribution of precipitation interacting with terrain and land use characteristics like ground cover. In other words, floods are not exclusively a climate hazard. They are the result of a climate phenomenon in interaction with physical conditions. These local conditions that influence flooding range from short-term characteristics such as soil moisture to long-standing features like the size of storm sewers. Similarly, the impact of floods depend on what is flooded: The storms of 1998 caused overtopping of Adobe Creek, flooding properties and damaging structures in Los Altos Redwood Grove Nature Preserve, but producing much less damage than if somehow downtown were flooded.
Wildfires & Air Pollution
Despite increased temperatures, wildfires are not projected to be a significantly worse threat in the future for Los Altos, based on the average area burned by wildfires. That indicator of wildfires is projected to decreaseas Los Altos urbanizes. Regionally, Los Altos and the surrounding area is not high risk, though the relative risk for natural areas in the Santa Cruz mountains is projected to increase slightly. CAL FIRE’s somewhat outdated maps do not consider Los Altos or most of the areas around Los Altos to be very high fire hazard severity zones because they are urban. The closest very high fire hazard areas are in southern Cupertino and Saratoga. Some areas west of Los Altos are in a high hazard severity zone.
However, the analysis is limited to direct wildfire impact in Los Altos – acres burned. Secondary impacts like air pollution can be significant and prolonged.
2 Santa Clara County Operational Area Mitigation Plan, Office of Emergency Services, p. 117, http://sanjose.granicus.com/MetaViewer.php?event_id=2690&meta_id=642821, accessed June 8, 2021
In some ways, wildfires are an interesting analog to floods, influenced both by weather and local conditions. The Santa Clara County Climate Adaptation Guidebook describes this complexity. “Weather is one of the most significant factors in determining the severity of wildfires; [however,] natural fire patterns are driven [both] by conditions such as drought, temperature, precipitation, and wind, and also by changes to vegetation structure and fuel (i.e.) biomass availability.” Just as floods are exacerbated by high soil moisture, wildfires are more destructive when they occur on top of strong droughts.
Of course, wildfires can start from any number of human sources and not only during dry weather. Like floods, wildfires present the greatest risk to life and property when they cross the wildland urban interface into developed areas. However, the spread and duration of wildfires is less predictable than floods. Wildfires are most likely to spread through embers directed by wind and the air currents of the fire itself.
These air currents can bring particulate matter hundreds of miles from the fire. During the SCU Fire and even the Paradise Fire, Los Altos was impacted by poor air quality which kept people in their homes. 3 Summer can already produce poor air quality due to photochemical (sunlight) smog and the long-term suspension of particulate matter that rain in the winter and spring dissolves. These periods of air pollution increase the health risk for people with pre-existing respiratory conditions and/or who experience occupational hazards through outdoor work.
3 As shared in the Apr. 23, 2021 focus group
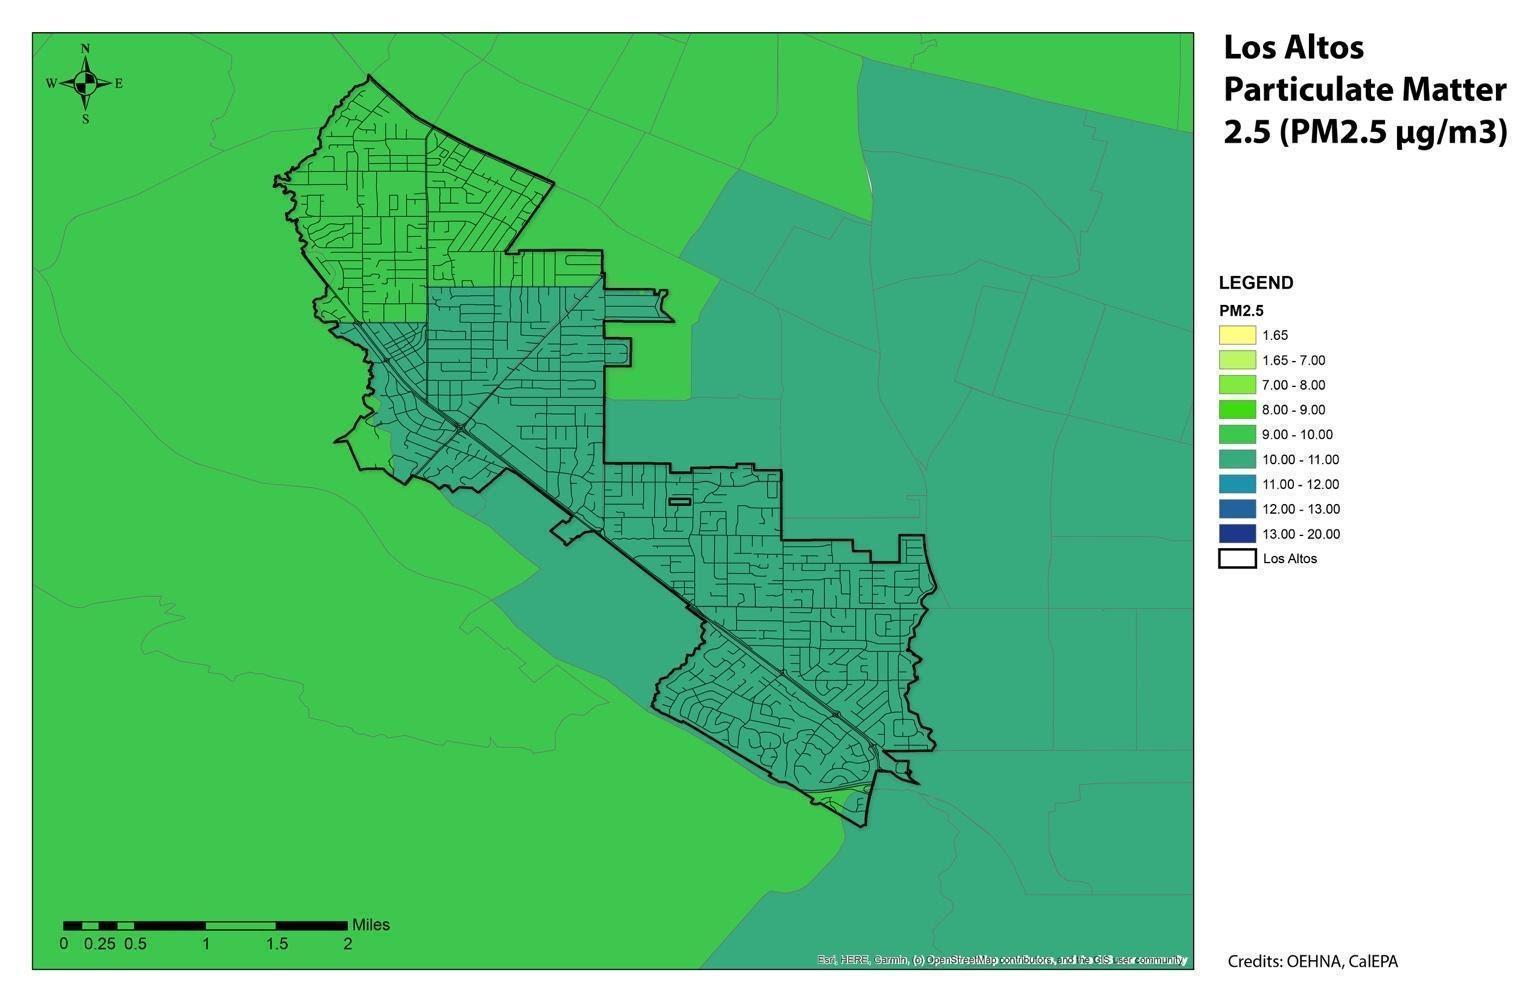
Figure 2: Average concentration of particulate matter 2.5 in Los Altos and surrounding area
Although a verdant city, Los Altos has only average air quality. The Bay Area as well as the Central Valley south of Sacramento are all non-attainment areas for ambient air quality standards. Figure 2 shows the concentration of Particulate Matter 2.5, a specifically harmful irritant. According to OEHHA, “PM2.5…can have adverse effects on the heart and lungs, including lung irritation, exacerbation of existing respiratory disease, and cardiovascular effects. The US EPA has set a new [in the last decade] standard for ambient PM2.5 concentration of 12 μg/m3, down from 15 μg/m3.” Most of Los Altos is higher than 10 μg/m3. The EPA classifies the whole of Santa Clara County as “moderate” in the category of PM 2.5. It should be noted that ozone, another indicator of air quality, has improved considerably throughout the Bay Area since the 1960s. Given the moderate baseline air quality, added pollution from wildfires even far from Los Altos can create unhealthy levels of PM2.5
Future Changes to Climate Hazards
There are several sources of information about future climate hazards and their impact on Los Altos. Described below is information from several State, County, and local documents and tools. These sources are not exhaustive, nor are they entirely in agreement, however, together they provide a helpful composite.
California State Hazard Mitigation Plan
The California State Hazard Mitigation Plan is the state’s primary document which describes historical and current hazards and articulates goals to mitigate those hazards to reduce injury, death, and damage. The Hazard Mitigation Plan is helpful background for the Vulnerability Assessment, although hazard mitigation is not exactly the same as climate adaptation. Specifically, the goal of hazard mitigation planning is to understand the probability and impact of natural and man-made hazards and to outline actions to reduce or eliminate the loss of life and property from those hazards. Some of the hazards in the hazard mitigation plan are natural hazards and most of those natural hazards are climate related. The plan lists fire, flood, and earthquake as the primary hazards based on number of events, deaths, and cost. Climate change, it says, will result in “more frequent incidence of severe events, such as extreme rainfall, wind, wildfire, extreme heat, and extended drought.” 4
California’s Fourth Climate Change Assessment – San Francisco Bay Area Region Report
California’s fourth climate change assessment was produced in 2018. Given the size and physical diversity of California, the assessment was divided into region-specific
4 California State Hazard Mitigation Plan, California Office of Emergency Services, 2018, Section 4.3 – p. 129
reports. The San Francisco Bay Area Region report describes that temperatures in the Bay Area rose almost 2°F between 1950 and 2005 and are expected to rise significantly by mid-century. If emissions continue through the end of the century, temperature changes will be major, with an increase of 7.2°F. However, inland areas will heat up more than coastal areas, both generally and when comparing the hottest day of the year in each area.
According to the report, precipitation will continue to vary significantly year to year, based on the occurrence and path of winter jet stream flows which produce “atmospheric rivers.” Winter storms from the atmospheric rivers will continue to produce significant snowfall in the Sierra Nevada and heavy rainfall capable of causing floods. Under a high emissions scenario, the wettest day of the year in 2100 may produce 30% more rain. The Bay Area may experience precipitation “whiplash” year to year:
Even if total precipitation increases, changes in the timing and form of precipitation (rain or snow) along with expected increases in temperature are likely to cause longer and deeper droughts. Average Sierra snowpack is expected to decline between 30% and 60% by mid-century and over 80% by the end of the century under a high emissions scenario.
Future fire activity is expected to increase as climate warms; however, the distribution of risk is uncertain because it depends on changes in urban development. Where the wildland-urban interface expands, fire risks will increase. Rural and suburban areas that urbanize will see a decline in fire risk.
Santa Clara County Operational Area Hazard Mitigation Plan
The Santa Clara County Operational Area Hazard Mitigation Plan is the county-wide hazard mitigation plan for Santa Clara County. The plan describes briefly how climate will impact the frequency and severity of climate hazards. Specifically, it describes that the number and length of heat waves is expected to increase, as are the number of single-day extreme heat days. According to the document, “precipitation projections for California remain uncertain,” however, the combination of temperature increases combined with the timing and form of precipitation is expected to change stream flow and river flooding. Wildfire risk as defined by area burned in Santa Clara County is not expected to change significantly by mid-century. The average area burned is expected to decreaseby 10-20% by 2085.
Los Altos Hazard Mitigation Plan Annex
The Los Altos Hazard Mitigation Plan Annex is a Los Altos-specific addition to the Santa Clara County Hazard Mitigation Plan. The Los Altos Hazard Mitigation Plan Annex not only lists the history of declared disasters, it also ranks natural hazards based on their probability and their impact. According to the Hazard Mitigation Plan Annex, the hazard with the highest risk score (probability x impact) is earthquake (48)
followed by severe weather (33), flood (18), drought (9), dam and levee failure (6), wildfire (3) and landslide (3). Severe weather includes severe storms from atmospheric rivers or thunderstorms, extreme heat and frosts/freezes, high winds, and so-called space weather, which refers to disruptive variations in the sun’s energy.
The risk score ranking is useful for understanding how the hazards compare to one another. While earthquakes are a natural hazard, it is not considered in this climate Vulnerability Assessment. 5
5With the exception of sea level rise increasing the liquefaction risk in coastal areas outside of Los Altos, there is no relation between atmospheric phenomena and earthquake risk. More simply, whether we reverse or continue climate change will not increase or decrease the risks of earthquakes. Earthquakes are well considered in the Hazard Mitigation Plan for Santa Clara County and its Los Altos Annex.
Rankings of the CAAP Task Force
The CAAP Task Force is a group of City staff and Environmental Commission members who guided the development of the CAAP. They are involved in many aspects of Los Altos operations, planning, and environmental management and so were asked what climate hazards they were most concerned about in the future. They ranked their concern (high, medium, low) for primary and secondary climate hazards. Primary climate hazards are phenomena that are climate variables. Temperature and precipitation defineclimate. Secondary climate hazards are hazards resulting from changes in primary climate hazards in relation to community sectors like the natural environment, the economy, and the public. All twelve respondents on that Task Force completed the survey ranking hazards of concern. Responses are shown below
Primary Climate Hazards Score
Table 3: Average Scores and Ranking for Primary Climate Hazards according to the CAAP Task Force
Table 4: Average Scores and Ranking for Secondary Climate Hazards according to the CAAP Task Force
The CAAP Task Force was most concerned about increasing temperatures and changes in precipitation patterns. Each of the hazards of high and medium concern were related to the impacts of heat, with drought receiving the highest average score and extreme heat, wildfire, and air pollution receiving the next highest scores. The hazard with the highest score, drought, is driven both by heat and by precipitation. Air pollution, wildfires, and urban heat island are hazards that are not entirely a natural phenomenon.
Cal-Adapt & Adaptation Planning in California
The OES issued the California Adaptation Planning Guide (APG) to help municipalities and all stakeholders involved in the vulnerability assessment process with recommendations and tools to develop a scientifically grounded, relevant, and actionable adaptation plan.
One of the public resources provided by OES to be used in consult with the (APG) is a web-based climate projection tool called Cal-Adapt. Cal-Adapt provides historical and projected climate information, including “local snapshots” of several different climate phenomena under different emissions scenarios through 2100. The global climate models selected by OES are particularly well matched to California’s climate.
Cal-Adapt was used for this vulnerability assessment to predict what future temperature and precipitation Los Altos will experience based on scenarios of future global emissions or Representative Concentration Pathways, RCP 4.5 and RCP 8.5, adopted by the International Panel on Climate Change. These emissions scenarios are based on models of population growth, economic growth, food production, technological advancement, political activities to curb greenhouse gas emissions and other factors. RCP 2.6 represents a “very stringent” pathway, in which emissions start declining by 2020 and go to zero by 2100. It is not included in Cal-Adapt. RCP 4.5 represents a global growth scenario in which emissions continue to 2040 and then decline. RCP 8.5 represents a “business as usual” scenario in which emissions continue unabated. Because these scenarios and models are global, they do not consider how Los Altos reduces its emissions.
Cal-Adapt plugs these global emissions scenarios into global climate models (GCMs) to produce local information about areas in California, including Los Altos. Cal-Adapt describes the process on its Guidance on Using Climate Projections webpage, from which the text below is reproduced.
Climate scientists create projections of future climate using powerful tools called global climate models. Global climate models are complex pieces of computer software that crunch through thousands of mathematical equations representing the scientific theory of how the climate system works. They can be used to simulate climate over past periods, or to run experiments in which scientists impose certain conditions on the model to see how the climate system responds. A future climate projection is the product of global climate model experiments in which scientists impose upon the model some scenario of the future atmospheric concentration of greenhouse gases [eg. RCP 4.5 and RCP 8.5].
When climate scientists run a climate model, they divide the area of study into a grid, and the model performs calculations for each individual cell within the grid. The output from those calculations can then be
visualized on a map, similar to the visualizations in Cal-Adapt [shown in Figures 3-9]. In climate model projections, for any given snapshot in time, each grid cell is represented by a single value for temperature, precipitation, or other climate variable of interest.
The grid cells in most global climate models are very large from 100 to 600 kilometers [roughly 100 to 375 miles] squared. This coarse resolution is OK when scientists are studying climate on the global scale, but it is not very useful when we are trying to understand climate change on smaller scales. We know that present-day climate varies greatly from region to region in California, and so we expect future climate to vary accordingly. But that detail is lost in the global climate models, in which all of California may be represented by just a few grid cells. To be able to plan for the future, we need to produce higher-resolution projections of future climate. Climate scientists do just that by using various techniques to "downscale" global climate model output to finer spatial scales. The data in Cal-Adapt is taken from a selection of global climate models and downscaled to about 7-kilometer [roughly 4.5 mile] resolution.
Understanding Cal-Adapt Graphs
The Cal-Adapt graphs presented in this Vulnerability Assessment display several types of data illustrating how variables like temperature, extreme heat, drought, precipitation, and wildfire are expected to change as climate change continues. The next series of images describes how information on the Los Altos graphs are displayed.
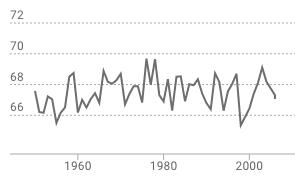
The line in grey represents historical observed values for each year shown on the graph. The year-to-year differences represent the natural variation in climate. Although the planet is warming over the long term, some years are still cooler or warmer than others.
The colored areas of the graph below represent projections under different emissions scenarios, RCP 4.5 representing continued global emissions until 2040 and RCP 8.5 representing continued global emissions through the end of the century.
RCP 4.5 is shown in a light blue or teal color. The blue line represents the most likely outcome for whatever variable is being graphed. Because it is produced by averaging multiple climate models, it smooths out the year-to-year variability that each model predicts. The line does not indicate that year-to-year variability will
disappear. (Figure 6 in the following pages shows how much variability is predicted year-to-year in individual models)
The shaded blue or teal area around the line represents the full range of climate projections for the variable across all the models. If one model predicts a high value and one model predicts a low value, that information is shown in the shaded area.
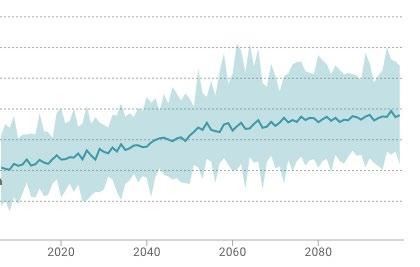
In sum, under a medium emissions scenario, Los Altos may experience any value within the shaded blue area and is most likely to experience the value on the blue line.
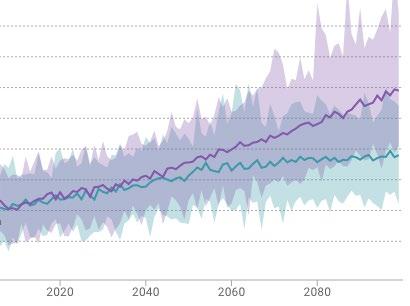
The same explanation for the image holds true under a high emissions scenario, shown in light purple. The purple line represents the most likely outcome for the variable, and the shaded area around the line represents the full range of climate projections for the variable across all models.
When both emissions scenarios are graphed, the darker purple-grey area represents the possible values which are projected in both medium emissions and high emissions scenarios. For some climate variables, like temperature, differences between emissions scenarios become clear later in the century by less and less overlap in blue and purple shaded areas, indicating that reducing emissions will reduce how much temperatures rise. For other variables, like precipitation, there is not a significant visual difference between the blue and purple shaded areas, indicating that the range of values for precipitation is more or less the same in either emissions scenario.
Precipitation & Flooding
Figure 3 shows the observed and projected annual precipitation for Los Altos. The graph indicates that there is expected to be little change in annual average precipitation in a medium or high emissions scenario for both Los Altos and Santa Clara County (not shown), a remarkable reality considering that many areas across California and the country are projected to experience much greater drought in the future. As shown in Table 5, average annual precipitation is projected to increase marginally.
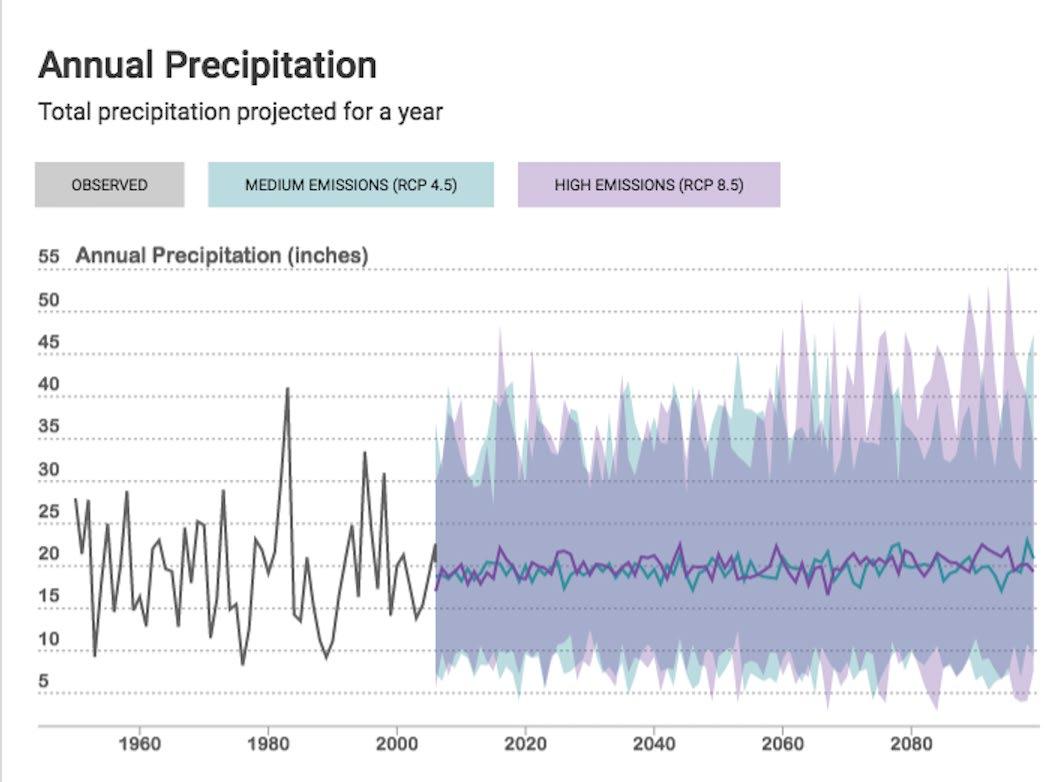
Figure 3: Annual total precipitation, observed and projected under medium and high emissions scenarios. The shaded area represents the range of likely annual precipitation totals in each scenario; the colored lines represent the most likely precipitation total in each scenario. Produced using Cal-Adapt.
End-Century 2070-2099
High (RCP 8.5)
21.3 14.7 - 28.6 inches
Table 5: Annual total precipitation, observed and projected under medium and high emissions scenarios over 30-year periods according to Cal-Adapt. The numbers in the average column represent the averages of the most likely outcome over the 30-year periods. The numbers in the range of averages column represents the averages from all climate models over the 30-year periods. The range of averages is generally greater in the high emissions scenario, indicating the greater uncertainty under high emissions.
Even if annual precipitation is expected to remain consistent as an annual average, the timing of rainfall is expected to vary from the existing seasons. Winters may be wetter and spring and autumn may be drier. The variability may include more intense, infrequent rainfall causing riverine flooding, preceded and followed by longer dry spells without any precipitation. The maximum 1-day precipitation event is expected to increase marginally.
Flooding is likely to increase as a result of an increased number of days with extreme rainfall events. That increased risk may be compounded with a slight increase in the number of wildfires in areas uphill and upstream from Los Altos that reduce the ability of plants and soils to absorb rainfall. Conversely, back-to-back extreme rainfall events in late winter may fall on areas already saturated and unable to absorb rainfall. The result in either case is a change in the intensity and pattern of flooding. Determining flood risk requires hydrologic and hydraulic analyses that are outside the scope of this assessment- the last study performed for FEMA was in 1977, indicating that a new analysis should be performed.
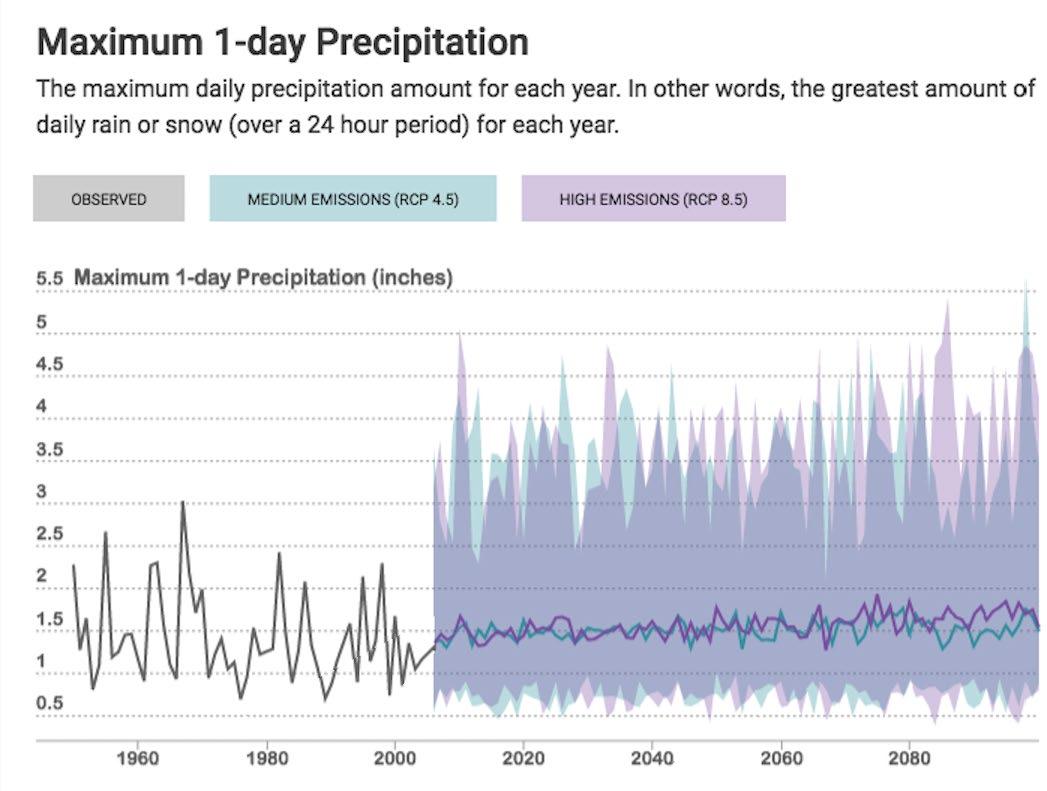
Figure 4: Maximum 1-day precipitation, observed and projected under medium and high emissions scenarios. The shaded area represents the range of likely precipitation totals in each scenario; the colored lines represent the most likely total in each scenario. Produced using Cal-Adapt.
Table 6: Maximum 1-day precipitation, observed and projected under medium and high emissions scenarios over 30-year periods according to Cal-Adapt. The numbers in the average column represent the averages of the most likely outcome over the 30-year periods. The numbers in the range of averages column represents the averages from all climate models over the 30-year periods.
Figure 5 shows a slightly different representation of future precipitation under a high emissions scenario and, using four models recommended by Cal-Adapt, shows an increase in the number of extreme precipitation events annually. Through midcentury, all of the models predict some years with no extreme precipitation events annually. By the end of the century, three of the four models predict several extreme events annually – it will be more likely than not to experience at least one extreme event annually. Since the annual precipitation is not expected to increase, it can be assumed that there will be a decrease in the amount of precipitation occurring during non-extreme precipitation events.
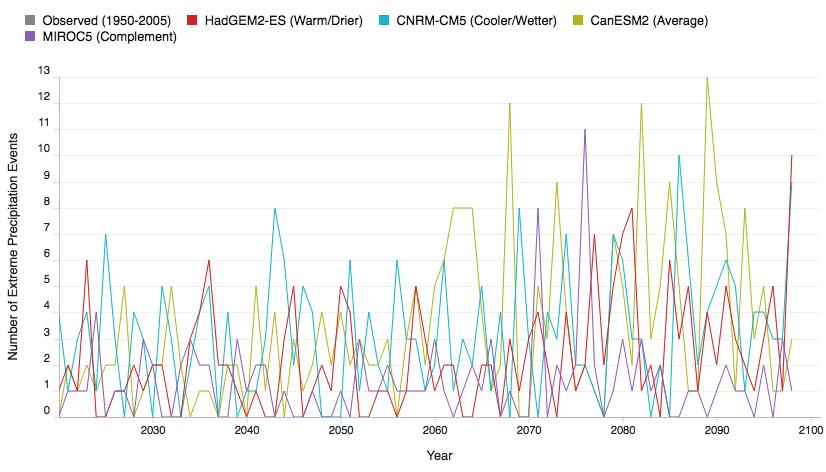
5: Number
precipitation events projected under high emissions scenarios according to 5 different global climate models (GCMs) recommended by Cal-Adapt.
Temperature, Extreme Heat & Drought
As shown in Figure 6, the annual average maximum temperature is expected to increase over the rest of the 21st century. Under the high emissions scenario (RCP 8.5), temperature is projected to increase nearly 8 degrees F, nearly twice as much as under a medium emissions scenario (RCP 4.5). Table 7 indicates the certainty of temperature increases. Even the low end of the range of averages is higher than the observed average, 1961-1990.
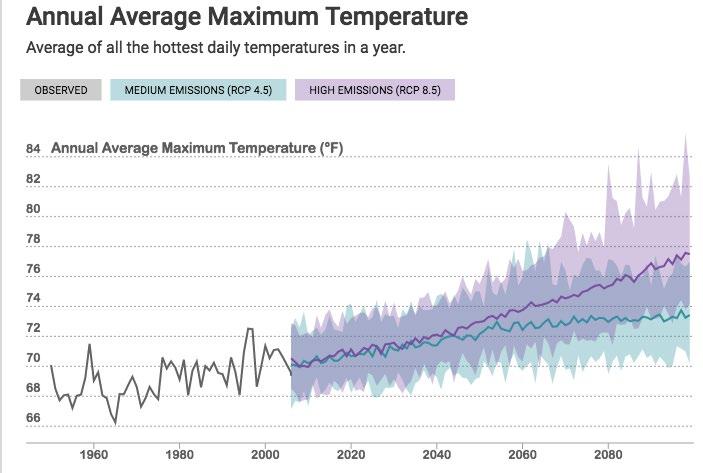
Figure 6: Annual average maximum temperatures, observed and projected under medium and high emissions scenarios. The shaded area represents the range of likely temperatures in each scenario; the colored lines represent the most likely temperature in each scenario. Produced using Cal-Adapt.
Table 7: Annual Average Maximum Temperature, observed and projected under medium and high emissions scenarios over 30-year periods according to Cal-Adapt. The numbers in the average column represent the averages of the most likely outcome over the 30-year periods. The numbers in the range of averages column represents the averages from all climate models over the 30-year periods.
Drought
As a product of increasing temperatures and increasing precipitation variability, including less spring and autumn precipitation, drought may increase. The maximum length of dry spell is expected to increase by 10-15% as shown in the table below.
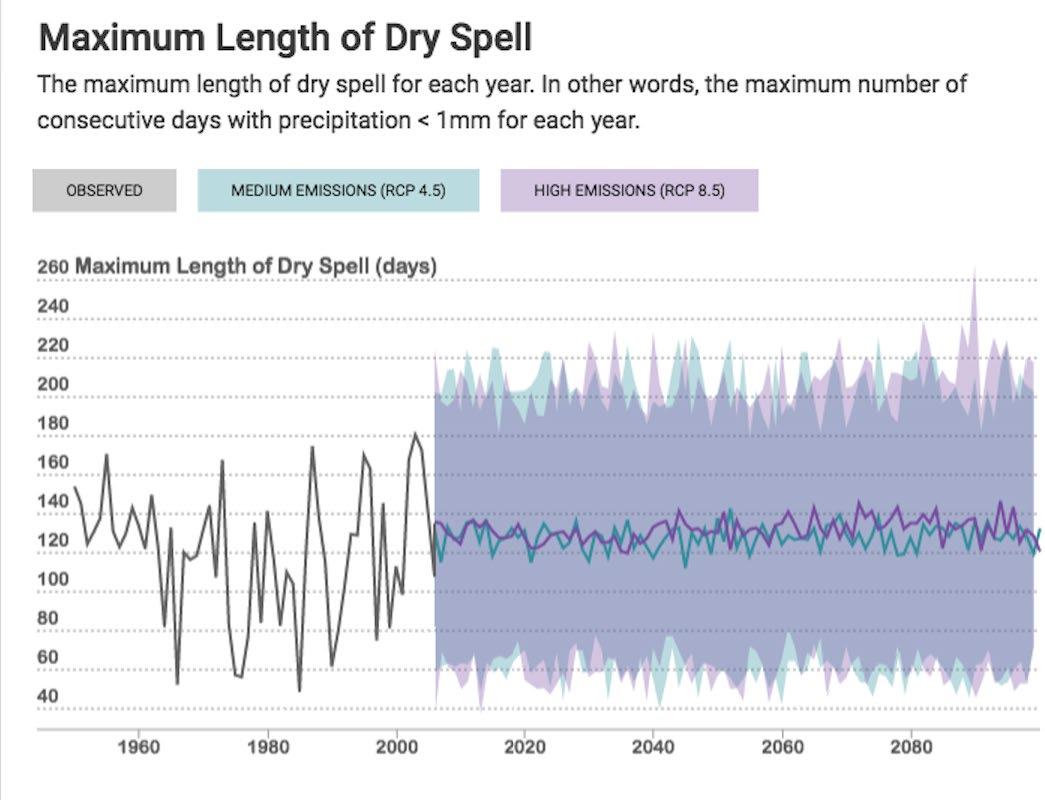
Figure 7: Maximum length of dry spell, observed and projected under medium and high emissions scenarios. The shaded area represents the range of likely number of days of dry spell totals in each scenario; the colored lines represent the most likely maximum length in each scenario. Produced using Cal-Adapt.
Table 8: Maximum length of dry spell, observed and projected under medium and high emissions scenarios over 30-year periods according to Cal-Adapt. The numbers in the average column represent the averages of the most likely outcome over the 30-year periods. The numbers in the range of averages column represents the averages from all climate models over the 30-year periods. Under a high emissions scenario, the range of averages at the end of century (112-172 days) is significantly wider than the range of averages mid-century (125-151 days), indicating the uncertainty of the impact of high emissions longer term.
Average temperatures and days with extreme heat are expected to increase, increasing evaporation and evapotranspiration (release of water vapor by plants) in turn. Residential water use for landscaping may increase in response. Defining drought as simply the length of a dry spell obscures the complexity of Los Altos’ water supply and use. Future droughts will be defined not just by precipitation and temperature, but by water supply storage levels across the water system and water use by end users. In other words, drought is not an entirely natural phenomenon.
Extreme Heat/Heat Waves
Heat waves are expected to increase in severity, frequency, and duration.
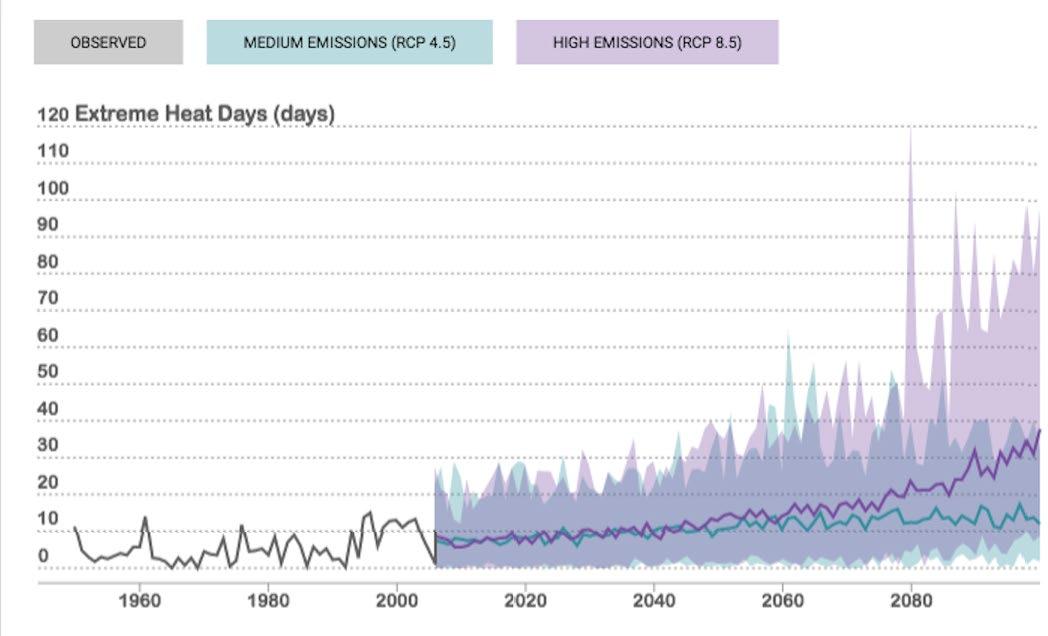
Figure 8: Number of extreme heat days, observed and projected under medium and high emissions scenarios. The shaded area represents the range of likely number of extreme heat days in each scenario; the colored lines represent the most likely number of extreme heat days in each scenario. Produced using Cal-Adapt.
Mid-Century 2035-2064
End-Century 2070-2099
(RCP 4.5) 11 7-17 days
(RCP 4.5) 13 9-23 days
Mid-Century 2035-2064 High (RCP 8.5) 14 8-20 days
End-Century 2070-2099
(RCP 8.5) 24 13-49 days
Table 9: Number of extreme heat days, observed and projected under medium and high emissions scenarios over 30-year periods according to Cal-Adapt. The numbers in the average column represent the averages of the most likely outcome over the 30-year periods. The numbers in the range of averages column represents the averages from all climate models over the 30-year periods.
As shown in Figure 8, the number of extreme heat days (defined as days with high temperatures above 90.2F for Los Altos) is expected to increase above 10 by midcentury. By the end of the century, Cal Adapt projects more than three times as many days of extreme heat under the medium emissions scenario and as many as 40 days of extreme heat under the high emissions scenario.
Wildfires & Air Pollution
Remarkably, given the expected increases in average and extreme temperatures, the area of Los Altos burned by wildfires is projected to decrease,according to Cal Adapt, under both medium and high emissions scenarios.
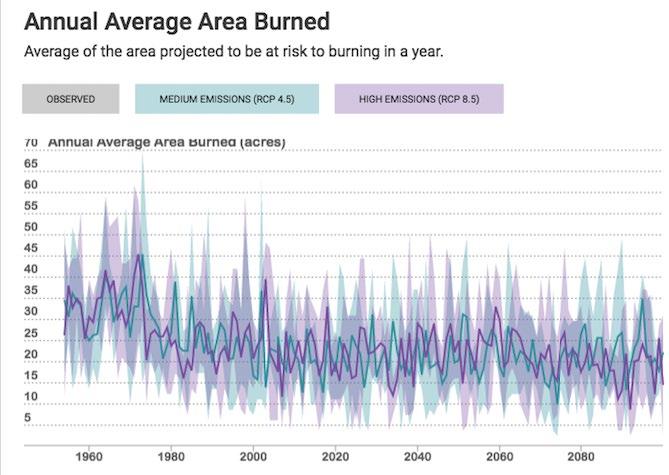
Figure 9: Annual average area burned, projected under medium and high emissions scenarios. The shaded area represents the range of likely average area burned in each scenario; the colored lines represent the most likely average area burned in each scenario. Produced using Cal-Adapt.
Table 10: Number of average acres burned, modeled and projected under medium and high emissions scenarios over 30-year periods. The average number of acres burned is expected to decrease under both medium emissions and high emissions scenarios.
Additional Sources for Wildfire
Since the Cal-Adapt projections and the Local Hazard Mitigation Plan Annex indicated that wildfire was low risk and yet wildfire was a relatively high concern of the CAAP Task Force, additional research was conducted on the future risk of wildfires. Sources identified were the Santa Clara County Climate Adaptation Guidebook, Caltrans Vulnerability Assessment for District 4 (San Francisco Bay Area), and CAL FIRE.
According to the Santa Clara County Climate Adaptation Guidebook, climate change is projected to increase the frequency of wildfires, the extent of burned areas, and the duration of wildfire seasons. “Wildfire seasons are projected to begin earlier in the spring due to drier and warmer spring conditions on average.” However, this increase in wildfire seems to be minor in the areas surrounding Los Altos and other already urbanized areas, as shown in the CALFIRE maps of Santa Clara County.
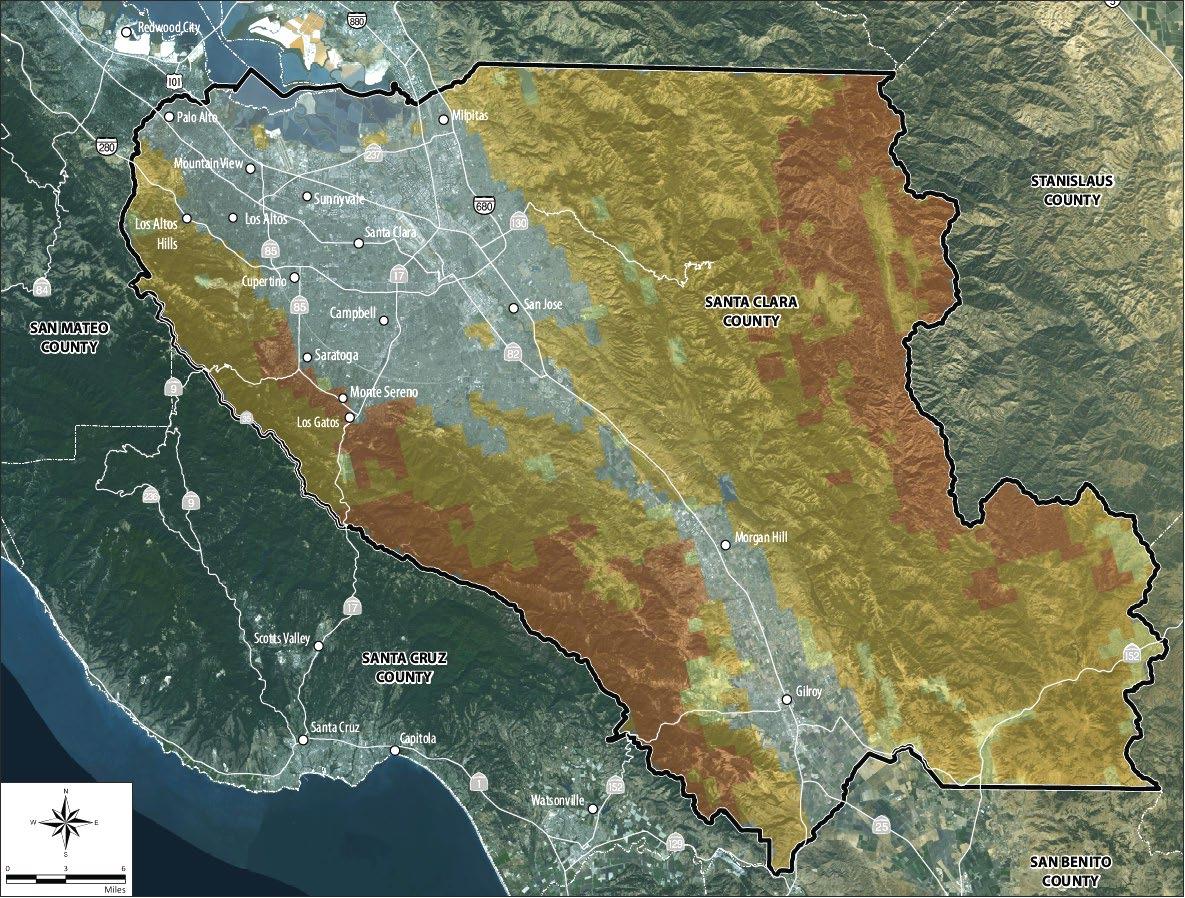
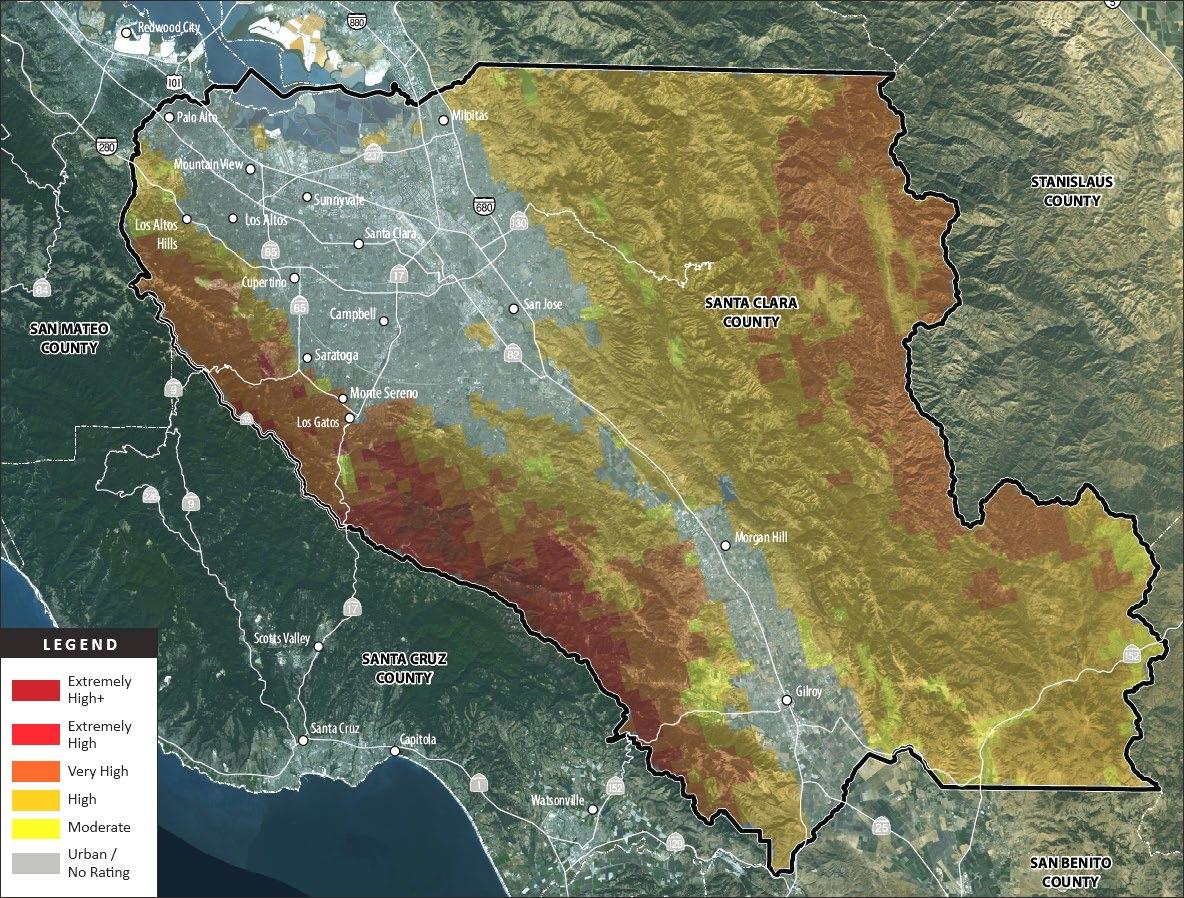
In Figure 10, some mountainous areas west of Los Altos move from “moderate” to “high” risk and a large area southwest of Los Altos moves from “high” to “very high” risk.
The section of Caltrans’ Vulnerability Assessment focusing on wildfire risk shows the likelihood of wildfire in 2085 increasing in some areas of Santa Clara County, but not Los Altos or the entire San Francisco Peninsula.
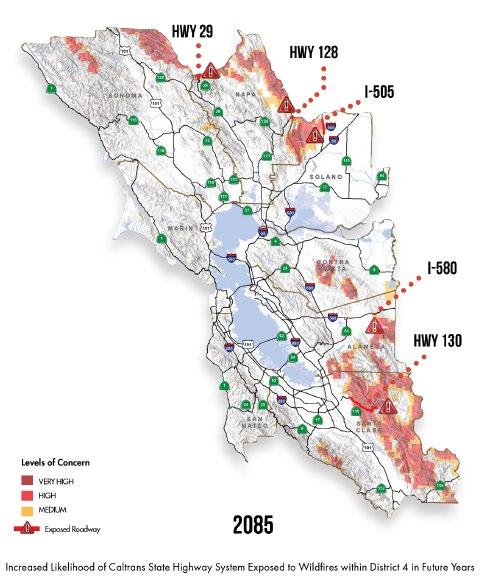
Figure 11: Caltrans’ Vulnerability Assessment focusing on wildfire risk showing the likelihood of wildfire in 2085.
Air Pollution/Air Quality
The minor increase in risk of wildfire in areas surrounding Los Altos may relatively worsen air quality in Los Altos, however, climate projections focus on the relative risk of areas to wildfire, not to air quality impacts based on prevailing wind patterns. Air quality was not a climate variable for which Cal-Adapt produced projections. The California State Hazard Mitigation Plan describes how air pollution could deteriorate in the future
Climate change has the potential to worsen PM concentrations in California due to increased incidence of wildfire as well as the increased temperature and reduced precipitation in many locations. Smoke and ash produced by fire increase PM
concentrations. Similarly, dry, warm weather can result in greater amounts of dust being blown and suspended in air. 6
In summary, even if Los Altos isn’t as vulnerable to direct impacts from wildfires, it should be prepared for the indirect impact of air pollution.
Impacts on Los Altos’ Assets/Community Sectors
Information about the impacts of climate hazards was supplemented by a survey of the CAAP Task Force and a focus group with City staff and non-profit leaders. Specifically, the CAAP Task Force was asked to rank what natural and built assets and facilities and what sectors of the economy were most important to Los Altos’ quality of life. Results receiving 40% or more are shown below.
Natural Environment Assets
landscapes (yards, parks, street trees)
& air quality
habitat (soil, plants, wildlife)
Creeks, rivers and other water bodies
Local Assets
A former orchard, Los Altos has an incredible canopy of native and non-native trees on streets, in parks, and in homeowner’s yards. Those trees, along with a creek and the Santa Cruz mountains, grace the seal of the City. According to the City’s website, there are approximately 12,000 trees on Los Altos streets creating a stunning tree canopy, which helps to promote better air quality, cooler summers, natural shade and less reliance on air conditioning.” 7
In addition to trees, yards and parks are well regarded by residents. Shoup Park and the Redwood Grove Nature Preserve were mentioned multiple times by respondents as assets that provide a real sense of nature. The Hillside Trail connecting both parks features a boardwalk along Adobe Creek.
6 California State Hazard Mitigation Plan, California Office of Emergency Services, 2018, SECTION 9.1 - PAGE 583
7 https://www.losaltosca.gov/publicworks/page/tree-maintenance, accessed May 6, 2021
Adobe Creek along with Stevens Creek, Permanente Creek and Hale Creek are significant natural features that provide habitat corridors that connect beyond Los Altos’ boundaries and contribute to groundwater recharge. Their importance is demonstrated by a pending (2021) lawsuit regarding pollution from a permit for Lehigh Quarry expansion upstream.
In such a verdant city, it is not surprising that many respondents in the CAAP Task Force mentioned air quality as an important asset. Outdoor recreation and outdoor living are prized and are dependent on comfortable temperatures and clean air.
Description of Impacts & Sensitivities
Temperature, Extreme Heat & Drought
The biggest impact of extreme temperatures and extended heat waves on the natural environment will be heat stress on plants with the potential for slow native species die-out and replacement by non-native species. These tipping points will depend on many factors including species and age.
Managed landscapes will require greater care and watering. California Water Service predicts roughly 3.5% increase in mean temperature by 2040 and will correspond to a roughly 2% increase in demand. 8 Home gardeners and city staff may find formerly tried and true ornamental plants less reliable – or untenable due to new ordinances or demand management measures. Having dealt with drought, Parks & Facilities staff has a reasonable capacity to manage the landscape for temperature increases and increased drought. The capacity of native, non-native, and ornamental plants to survive in a hotter, drier climate is not known.
Precipitation & Flooding
Severe precipitation and repeated flooding may increase stream bank erosion and flooding and erosion of managed landscapes. As the probability of multiple severe winter storms increases toward the end of the century, downed trees may be more common as trees rooted in soils saturated from previous storm events contend with heavy winds.
Wildfires & Air Pollution
Acres burned in Los Altos is expected to decrease. Increases in acres burned in the Santa Cruz mountain areas surrounding Los Altos are expected to be minor. Thankfully, Redwood Grove is being managed by Parks & Facilities staff for wildfire, as redwoods are not native to Los Altos and so require extra care. The greatest wildfire risk to Los Altos is expected to be from wildfires in and even beyond the Santa Cruz mountains creating unhealthy levels of air pollution in Los Altos.
8 2015 Urban Water Management Plan Los Altos Suburban District, p. 36