



Tule River Indian Tribe of California JUNE 30, 2025 PREPARED

Tule River Indian Tribe of California JUNE 30, 2025 PREPARED


This project has been funded wholly or in part by the United States Environmental Protection Agency (EPA) under assistance agreement No. 98T79601 to the Tule River Indian Tribe of California. The contents of this document do not necessarily reflect the views and policies of the EPA, nor does the EPA endorse trade names or recommend the use of commercial products mentioned in this document.
Lester R. Nieto, Jr., (Shine) • Chairperson
Franklin Carabay, Jr. • Vice-Chairman
Amanda Sierra • Secretary
Michele McDarment • Treasurer
Neil Peyron • Member
Charmaine McDarment • Member
Nick Martinez • Member
Heather Teran • Member
Douglas Vera • Member
PROJECT TEAM
Sabino Martinez • Tribal Project Manager
Victor Silvas • Tribal Administrator
Valerie Williams • Grants & Contracts Coordinator
Hope Romero • Deputy Tribal Administrator
Nancy McDarment • Grants & Contracts Compliance Officer
Kerri Vera • Director, Department of Environmental Protection
Wendi Correa • Director of Planning & Community Development
John Gichuki • Director of Public Works
Jossalyne Carrillo • Executive Administrative Assistant
Janeah Perez • Department Assistant, Department of Environmental Protection
Liam Huber • Department of Energy Fellow
Carla Carothers • Project Administrative Assistant

Rich Swanson, Energy & Climate Director, Blue Strike Environmental
Anna Bugankova, Energy & Climate Senior Manager, Blue Strike Environmental
Sol Shepherd, Energy & Climate Analyst, Blue Strike Environmental
Marley Dooling, Energy & Climate Analyst, Blue Strike Environmental
Zane Cintas, Sustainability Program Manager, Blue Strike Environmental
Brittany Mahoney, Energy & Climate Technical Analyst, Blue Strike Environmental
With deep gratitude, we acknowledge the Tule River Indian Tribal community, Tribal Council, and all the individuals, staff members, nonprofits, community groups, and partners who contributed to the creation of this Plan. We extend special thanks to the broader tribal community for participating in our surveys and to everyone who provided data, shared expertise, offered insights, and supported the development of this Comprehensive Climate Action Plan. Thank you!


ACRONYM FULL MEANING
GHG Greenhouse Gas
CO₂ Carbon Dioxide
CH₄ Methane
SO₂ Sulfur Dioxide
N₂O
Nitrous Oxide
TOC Total Organic Compounds
SF₆ Sulfur Hexafluoride
EF Emission Factor
HFCs Hydrofluorocarbons
PFCs
Perfluorocarbons
CO₂e / MTCO₂e Carbon Dioxide Equivalent / Metric Tons of CO₂ Equivalent
Lbs Pounds
VOC Volatile Organic Compounds
CAP Criteria Air Pollutants
HAP Hazardous Air Pollutants
GWP Global Warming Potential
PM Particulate Matter
PM2.5 Fine Particulate Matter
BOD₅ Biochemical Oxygen Demand (5-Day)
NOX Nitrogen Oxides
TOF Trees Outside Forests
HWP Harvested Wood Products

CLIMATE PLANNING & REPORTING TOOLS
ACRONYM FULL MEANING
CCAP
PCAP
RPS
ICLEI
Comprehensive Climate Action Plan
Priority Climate Action Plan
Renewable Portfolio Standard
International Council for Local Environmental Initiatives
USCP U.S. Community Protocol
IPCC
LEARN
EUI
Intergovernmental Panel on Climate Change
Land Emissions and Removals Navigator
Energy Use Intensity
AVERT Avoided Emissions and Reduction Tool
LGO
CARB
Local Government Operations Protocol
California Air Resources Board
TCR The Climate Registry
EPIC
eGRID
NEI
NLCD
Electric Program Investment Charge
Emissions & Generation Resource Integrated Database
National Emissions Inventory
National Land Cover Database
GAP Gap Analysis Program (land protection classifications)
CY Calendar Year

ACRONYM FULL MEANING
AMI
SCADA
Advanced Metering Infrastructure
Supervisory Control and Data Acquisition
TUA Tribal Utility Authority
PV Photovoltaic
PPA
BESS
DER
VFD
HVAC
LEED
Power Purchase Agreement
Battery Energy Storage System
Distributed Energy Resource
Variable Frequency Drives
Heating, Ventilation, and Air Conditioning
Leadership in Energy and Environmental Design
EE Energy Efficiency
RE Renewable Energy
kWh Kilowatt-hour
kW Kilowatt
h Hour
t Tonn
KV Kilovalt
ROW Right of Way (Referring to the Right of Way Agreement form)
BTU British Thermal Unity
MMBtu Million British Thermal Units
CAMX California-Mexico eGRID Subregion
TRANSPORTATION & MOBILITY
ACRONYM FULL MEANING
EV
VMT
CAFE
Electric Vehicle
Vehicle Miles Traveled
Corporate Average Fuel Economy

ACRONYM FULL MEANING
EPA Environmental Protection Agency
DOE Department of Energy
DEMD Division of Energy and Mineral Development
USDA REAP
United States Department of Agriculture Renewable Energy Development Assistance
USDA United States Department of Agriculture
BIA Bureau of Indian Affairs
IHS Indian Health Service
CEC California Energy Commission
CPUC California Public Utilities Commission
CPRG Climate Pollution Reduction Grant
AERI America’s Ecosystem Restoration Initiative
IRS Internal Revenue Service
HUD U.S. Department of Housing and Urban Development
REDA Renewable Energy Development Assistance
WMPPD BIA Water Management, Planning, and Pre-Development
TECR Tribal Energy and Climate Resilience Program
EERE Energy Efficiency and Renewable Energy
SCE Southern California Edison
BLS Bureau of Labor Statistics
SETO Solar Energy Technologies Office
ICERP Indian Community Energy Resilience Program
EDA Economic Development Administration

ACRONYM
IRA Inflation Reduction Act
WIOA
Workforce Innovation and Opportunity Act
FTA Federal Transit Authority Grants
EECBG Energy Efficiency and Conservation Block Grant
WAP Weatherization Assistance Program
LIHEAP Low Income Home Energy Assistance Program
SGIP Self-Generator Incentive Program
PTC Production Tax Credit
ITC Investment Tax Credit
CWISA Clean Water Indian Set Aside (EPA Program)
DWIG-TSA Drinking Water Infrastructure Grants - Tribal Set Aside
UTI
Utility Savings Initiative
WIFIA Water Infrastructure Finance and Innovation Act
WMPDD Water Management, Planning, and Pre-Development (BIA Program)
ICDBG Indian Community Development Block Grant
DEQ Department of Environmental Quality
EILP Energy Improvement Loan Program
ECAA Energy Conservation Assistance Act
SCDW Small Community Drinking Water Program
TPA Tribal Priority Allocations
CWSRF Clean Water State Revolving Fund
TSWGP Tribal Solid Waste Grant Program
SWIFR Solid Waste Infrastructure for Recycling Program
WIIN Water Infrastructure Improvements for the Nation

ACRONYM FULL MEANING
START
LEARN
Strategic Technical Assistance Response Team
Land Emissions Removals Navigator
SWANA Solid Waste Association of North America
GBES
BPI
CEA
EMP
PPP
Green Building Education Services
Building Performance institute
Certified Energy Auditor
Energy Management Professional
Public Private Partnerships
EPC Energy Performance Contracts
IASS
IRR
NPV
CEM
TEDC
Infrastructure Services
Internal Rate of Return
Net Present Value
Certified Energy Manager Certification
Tribal Energy Development Capacity
OTHER
ACRONYM FULL MEANING
KPI
ABAU
BAU
C&D
SOP
CY
FTE
Key Performance Indicator
Adjusted Business As Usual
Business As Usual
Construction and Demolition
Standard Operating Procedure
Calendar Year
Full-Time Employee




The Tule River Indian Tribe of California proudly presents its first Comprehensive Climate Action Plan (CCAP), a foundational roadmap that affirms the Tribe’s commitment to environmental stewardship, energy sovereignty, and long-term climate resilience. Rooted in Tribal values and informed by scientific analysis and community collaboration, the CCAP outlines strategic actions to reduce greenhouse gas (GHG) emissions, improve public health and safety, and protect cultural and natural resources for future generations.
Developed through a rigorous, inclusive process, the CCAP builds upon the Tribe’s GHG Inventory and previous climate planning efforts. It identifies nearterm and long-term GHG reduction targets and offers tailored strategies that reflect the realities of the Tribe’s geography, infrastructure, and governance. These strategies span the energy, buildings, water, and waste sectors, and are designed to enhance energy efficiency, reduce environmental risks, and strengthen Tribal sovereignty.
The CCAP includes six actionable measures: forming a Tribal Utility Authority (TUA) to increase energy independence; deploying smart meters in government buildings; conducting energy retrofits of existing facilities; integrating advanced monitoring systems into water infrastructure; and advancing waste reduction through diversion programs. Each measure is supported by implementation timelines, quantified benefits, and funding pathways, ensuring feasibility and accountability.
As a living document, the CCAP will guide the Tule River Indian Tribe’s climate journey into the coming decades, aligning Tribal governance with sustainability, resilience, and the preservation of ancestral lands. Through this Plan, the Tribe reaffirms its leadership in climate action and its enduring responsibility to protect its people and environment.

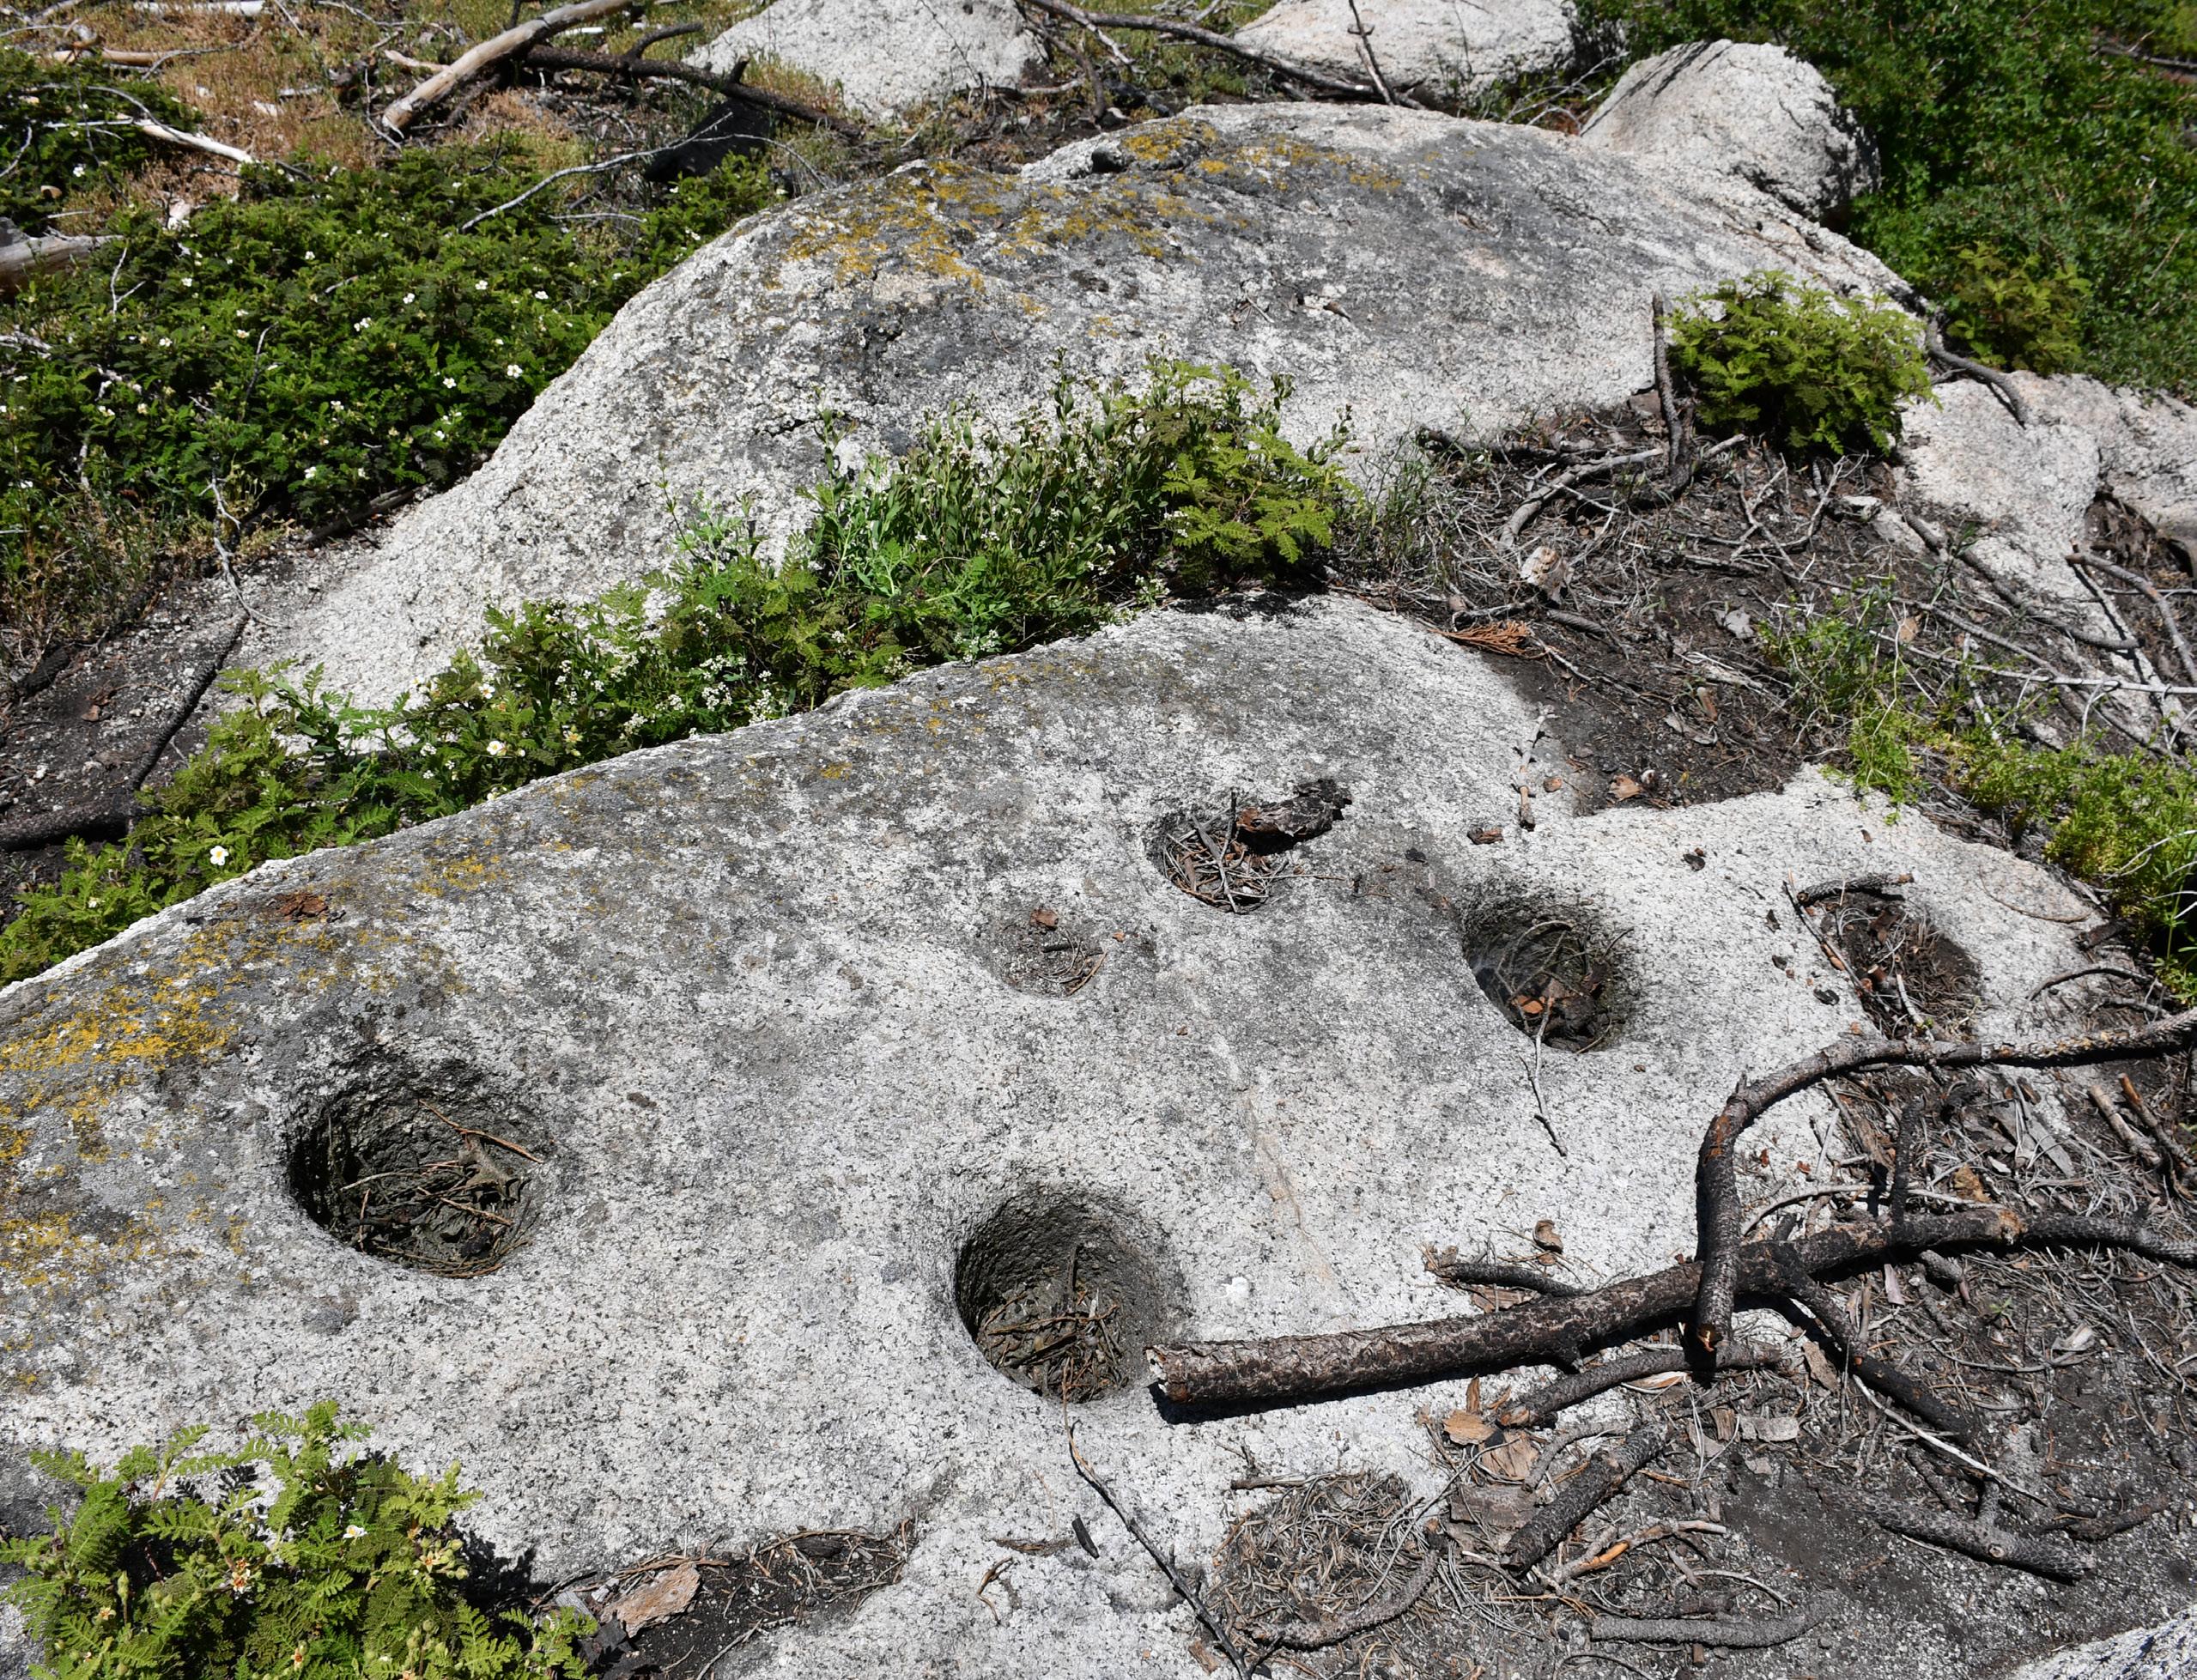
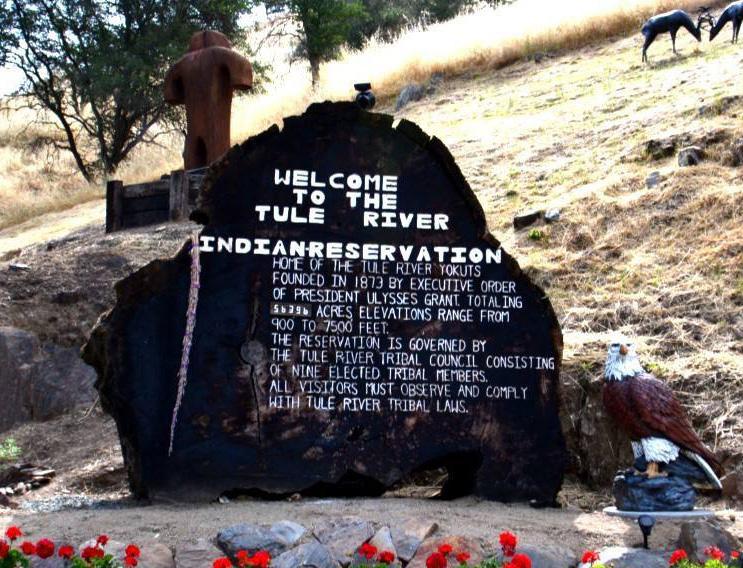
The Tule River Indian Reservation was established by Executive Order in 1873 as a permanent homeland to the Tule River Indian Tribe of the Tule River Indian Reservation, California. The Tribe is governed by a nine-member Tule River Tribal Council. The Reservation is located in southeastern Tulare County in the Sierra Nevada Mountains and originally encompassed 55,356 acres of trust land. The terrain is predominantly mountainous and rugged, with elevations ranging from around 900 feet at the western edge to over 7,500 feet at the eastern boundary. Tribal settlements are primarily located at lower elevations along the South Fork Tule River, near the Reservation’s western portion. Over time, the Tribe has reacquired approximately 17,598.40 acres of its aboriginal territory beyond the original Reservation boundaries.
The Tribe is one of the largest landholding tribes in California. It has a total membership of 2,014 enrolled Tribal members, with approximately 1,198 individuals residing on the Reservation. Residential areas extend roughly seven miles along North Reservation Road, with an additional four miles of housing served on the southern route. The closest urban center, Porterville, located approximately 23 miles away, is a critical hub for goods, services, and access to broader regional resources.
This CCAP has been developed in response to the increasingly visible effects of climate change on the Tribe’s lands, infrastructure, and community well-being. The Tribe is already experiencing the consequences of these changes, including heightened wildfire risk, temperature extremes, shifts in precipitation, summer water shortages, frequent power outages, and increased vulnerability of infrastructure. These challenges underscore the urgent need for longterm, coordinated action.
The Plan boundary for the CCAP includes the entirety of the original reservation - 55,356 acres of trust land- plus approximately 2,013.12 acres of trust and fee lands adjoining the original reservation boundary. While this does not represent all lands owned by the Tribe or held in trust, it allows the CCAP to focus on strategies that directly impact Tribal operations and the Reservation’s residential community. Although the Tribe’s cultural and historical connections extend far beyond these boundaries, this targeted approach ensures more effective and actionable outcomes.

Building on prior efforts, such as the Priority Climate Action Plan (PCAP), this CCAP integrates technical analysis, GHG inventories, and the lived experiences of Tribal members. It establishes a strategic framework for reducing emissions while strengthening community resilience to both current and future climate-related threats.
The CCAP addresses four key sectors:
• Energy and the Built Environment
• Water, Wastewater, and Solid Waste Management
• Land Use and Cultural Resource Preservation
• Community Health and Resilience
Once adopted, this CCAP will serve as a living document, regularly updated to reflect new data, technologies, evolving climate conditions, and ongoing community input. It will incorporate clear performance metrics to track progress, promote accountability, and maintain alignment with the Climate Pollution Reduction Grant (CPRG) program’s long-term goals for emissions reduction.
Through this Plan, the Tule River Tribal Council reaffirms its commitment to environmental stewardship, tribal sovereignty, and the protection of future generations. This CCAP marks a critical and forward-looking step in securing a sustainable, resilient future for the Tribe and its lands.
The CPRG program, administered by the EPA, is an initiative funded by the Inflation Reduction Act of 2022 (IRA) to provide grants to states, local governments, Tribes, and territories for the development and implementation of ambitious plans for reducing GHG emissions and other harmful air pollutants. CPRG is structured to diminish GHG emissions, thereby mitigating climate change. It provides financial support to states, municipalities, Tribes, and territories for devising and executing measures to reduce emissions. Alongside GHG reduction, CPRG endeavors to revive ecosystems, enhance infrastructure, stimulate economic growth, and enhance public health by alleviating the pollution burden disproportionately borne by disadvantaged communities. Through this program, the EPA aims to achieve three overarching objectives:
• Address damaging climate pollution while promoting the creation of employment opportunities and reducing energy expenses for households.
• Expedite efforts to rectify environmental injustices and empower community-led solutions in areas burdened by environmental issues.
• Improve air quality by curbing harmful air pollutants in residential, occupational, recreational, and educational environments.

To realize these objectives, the CPRG program comprises two primary phases:
1. Planning (PCAP & CCAP): This phase focuses on the development of PCAPs and CCAPs, both of which are funded through CPRG Planning Grants. The PCAP focuses on short-term, high-priority emission reduction measures, while the CCAP provides a more comprehensive roadmap for long-term strategies.
2. Implementation: This phase entails the execution of PCAP and CCAP objectives by CPRG Planning grant recipients; to accomplish these objectives, eligible participants may apply for competitive CPRG Implementation Grants. Overarching CRPG program goals for this phase include:
• Implementation of ambitious measures to achieve significant cumulative GHG reductions by 2030 and beyond.
• Pursuit of measures yielding substantial community benefits, particularly in low-income and disadvantaged communities, such as the reduction of Criteria Air Pollutants (CAPs) and Hazardous Air Pollutants (HAPs).
• Complementary utilization of other funding sources to maximize GHG reductions and community benefits.
• Pursuit of innovative policies and programs that are replicable and scalable across multiple jurisdictions.
The Tribe’s PCAP satisfied the first deliverable outlined in the CPRG Planning Grant. It became the framework for this CCAP, which satisfied the remaining Planning Grant deliverable.
A CCAP serves as an actionable, community-informed roadmap to reduce GHG emissions across all major sectors. Building on the foundational yet sector-specific work of the PCAP, the CCAP identifies a comprehensive suite of GHG reduction measures spanning all economic sectors. These measures are informed by a comprehensive GHG emissions inventory, and each measure is accompanied by detailed assessments of both qualitative and quantitative co-benefits, including a robust co-pollutant reduction analysis. The plan also evaluates implementation authorities, funding pathways, and workforce development needs to ensure effective execution.
While the constituent parts of a CCAP certainly define its purpose, the resulting plan is more than the sum of its parts. A CCAP is the product of a sustained and collaborative process that engages multiple levels of government, integrates meaningful community input, and incorporates feedback from a wide range of stakeholders. It reflects the unique local context of the planning region and is designed to be both ambitious and implementable. Ultimately, this CCAP strengthens and expands the Tule River Tribe of California’s understanding of its GHG sources and sinks and sets both near-term and long-term emission reduction targets.

This CCAP was developed through a collaborative process involving the Tribe, Tribal Departments, broader Tribal community, key stakeholders, and contracted professionals with expertise in climate strategy development, energy analysis, and community engagement. Building on the foundation established during the development of the PCAP, the CCAP employed a similar methodology to ensure a comprehensive understanding of GHG sources and sinks. This process helped identify community climate priorities and develop GHG reduction strategies tailored to the Tribe’s unique needs.
The planning process included biweekly meetings with a dedicated project team, as well as presentations to the Tribal Council at pivotal stages of the CCAP’s development. Multiple community-wide surveys were conducted to capture environmental concerns and gather feedback on proposed GHG reduction measures. A site visit to the Tule River Reservation further grounded the planning in the local context. In addition, individual meetings were held with topic area advisors from within the Tribe, agency partners, and other stakeholders essential to implementing the plan. Additional details on the planning process can be found in the Tribal CCAP Management and Development Team section.

The Tribal CCAP development team was composed of Tribe representatives and stakeholders, including departmental directors, grant managers, topic-area advisors, and third-party consultants. This team met biweekly throughout both PCAP and CCAP development to track project progress, identify ongoing development needs (i.e., funding constraints, data availability, etc.), and provide guidance during GHG reduction measure ideation.
Due to the Tribe’s size, many Tribal government employees are also direct stakeholders within the Tribal community, with many living on the reservation and in the City of Porterville. Feedback was regularly solicited from staff within government departments most relevant to issues concerning the environment, natural resources, water, and land use, to ensure that measures could be implemented by the Tribe and reflect broader community priorities around climate action. These meetings complemented traditional stakeholder engagement and outreach efforts, such as community-wide and data collection surveys, which are detailed below in Appendix B.
Finally, the development team reported to the Tribal Council at key junctures within the planning process to align GHG reduction measures with broader Tribal priorities and ongoing initiatives. These meetings with the Tribal Council were crucial for the CCAP adoption by the Tribe and provided important opportunities for feedback from Tribal leaders.
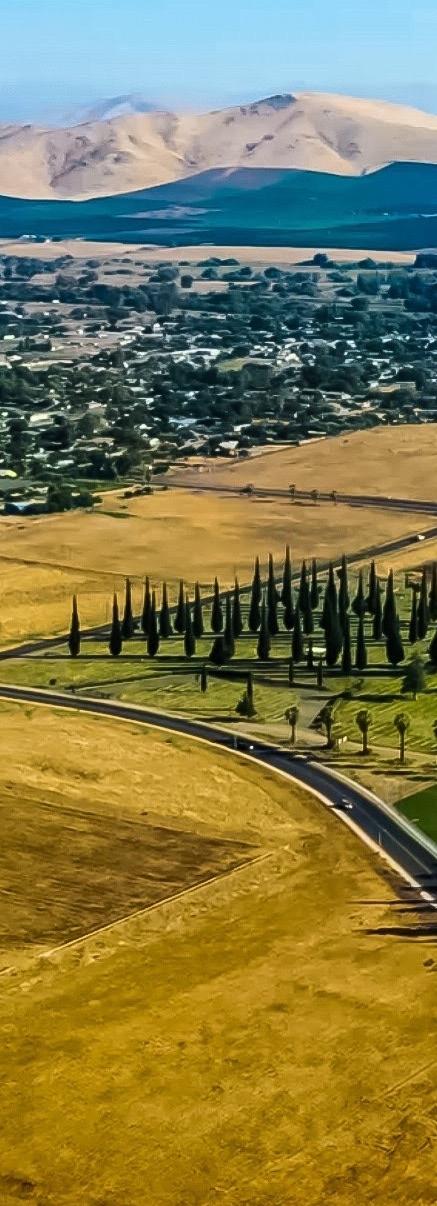
In 2022, the Tribe completed a comprehensive energy feasibility study funded by the California Strategic Growth Council. This study aimed to assess the Tribe's energy usage, estimate GHG emissions, and propose measures to reduce emissions from various sources on the reservation. Results were compiled into a document that became the 2022 Tule River Indian Tribe Energy Feasibility Report (herein referred to as the Energy Feasibility Report). To build on the work completed in this study and address urgent environmental challenges (i.e., sustainable energy management, air pollution, and public health outcomes), the Tribe chose to participate in the CPRG program. Participation in the CPRG program offered an opportunity to address these challenges proactively, as it provided resources such as funding, planning frameworks, and technical support for implementing climate action measures within the Tribe’s jurisdictions.
This support includes the ability to leverage expertise from contractors to complete GHG emissions inventories, coordinate stakeholder engagement activities, and develop emissions reduction measures, alleviating the burden of solely completing these tasks from the Tribe itself. The Tribe manages and oversees several essential infrastructure systems, including water and wastewater services, transportation, internet, and public safety. These sectors are vital to the Tribe’s selfgovernance and sovereignty, yet they remain vulnerable to increasingly severe climate-related hazards. The reservation has already experienced significant impacts from extreme weather events, including wildfires, floods, and prolonged drought. For example, during recent atmospheric river flood events of 2023, there were disruptions to the power supply and compromised water and sewer systems and hindered transportation access. The Tribe also operates its own emergency response services, including a 24/7 structure and wildland fire department, as well as round-the-clock ambulance services. Public transportation includes a fleet of school buses and a tribal route in partnership with the Porterville City Council, which provides service between the reservation and the City of Porterville.
These facts were crucial to consider during CCAP development, as this planning process provided the Tribe with the opportunity to address climate vulnerabilities and create an actionable roadmap to accelerate it towards a more sustainable future. However, due to the Tribe’s capacity constraints, the CCAP needed to be realistic, rather than overly ambitious, to be readily implemented, which limited the number and scope of GHG reduction measures. For example, due to Tribe’s remote location and the fact that most land within its jurisdiction is undeveloped, it would be inadvisable to include GHG reduction measures centered around increasing EV usage or deploying EV infrastructure. The technology for long-range vehicles that can travel over rugged terrain is not yet advanced enough to meet Tribe’s needs. As such, each of the six GHG reduction measures contained within this plan is the product of a robust development process that considered both short-term and long-term project execution to position the Tribe to readily implement the CCAP and, subsequently, build upon it with future environmental action plans, studies, and projects.
The CCAP was developed through a community-driven planning process rooted in inclusive engagement with tribal members, elders, youth, and key stakeholders. Thus, GHG reduction strategies were locally informed and aligned with tribal traditions, values, and priorities. A key strength of the process was that many tribal government employees are also tribal members, which allowed them to provide insights from both a community and governmental perspective, bridging policy and lived experience in shaping the plan.
Throughout the process, tribal members and staff played central roles, many serving multiple capacities as residents, government employees, and subject matter advisors. Various tribal departments contributed to the CCAP’s development, supporting survey distribution, outreach coordination, and data collection and analysis. A data collection survey for the heads of households was conducted to inform the GHG inventory, with some tribal staff going door to door to gather information directly from residents. To encourage participation, the Tribe ran gift card giveaways tied to survey completion.
Collaboration extended beyond the Tribe. Southern California Edison supported electricity data collection, and various tribal departments contributed key data to complete the GHG inventory. External stakeholders were engaged as needed to support data gathering and technical analysis.
The Tribal Council played a pivotal role in shaping the CCAP. It ensured alignment between the plan and the Tribe’s broader climate action priorities and offered guidance on how the strategies connected with ongoing initiatives. For more information on stakeholder engagement and outreach activities, please refer to Appendix B.
This GHG Inventory utilized the ICLEI ClearPath tool1 for tracking emission sources, factors, and Carbon Dioxide equivalent (CO₂e) emissions. The GHG inventory methodology followed the U.S. Community Protocol for Accounting and Reporting of Greenhouse Gas Emissions (U.S. Community Protocol),2 developed by ICLEI USA, as well as the U.S. Local Government Operations Protocol, also developed by ICLEI USA.3 The categories reported in this community inventory are: residential energy, non-residential energy, on-road transportation, water and wastewater, and solid waste. GHG emissions are calculated by multiplying activity data (e.g., kilowatt-hours of electricity, tons of solid waste) by an emission factor (e.g., pounds of CO₂e per unit of electricity). For these categories, methods based on the U.S. Community Protocols were modified with regional or Tribal-specific data when available. All activity data and GHG emissions reported in this document are annual values, and all emission factors reported in this document are annual average values, unless stated otherwise. This inventory follows the reporting protocol outlined by ICLEI as referenced in the US Community Protocol4 and Local Government Operations Protocol.5 Local governments are expected to evaluate emissions of the six internationally recognized greenhouse gases under the Kyoto Protocol,6 including Carbon dioxide (CO₂), Methane (CH4), Nitrous oxide (N2O), Hydrofluorocarbons (HFCs), Perfluorocarbons (PFCs), and Sulfur hexafluoride (SF6 ).7 To ensure consistency and comparability, GHG emissions are expressed in terms of CO₂e, which accounts for the varying impacts of different GHGs. The Global Warming Potential (GWP) metric is used to calculate CO₂e by comparing the heat-trapping ability of each gas to that of CO₂ over a specific time horizon, typically 100 years. The GWPs used in this inventory are from the IPCC Fifth Assessment Report (AR5),8 provided in Table 1
The U.S. Community Protocol is the standard rulebook for developing community-scale inventories for municipalities.9 Protocols and guidance for reporting GHG emissions for entities, such as corporations and public agencies, are different from those for communities, and had to be augmented further to meet the limitations of a small Tribe. The Local Government Operations Protocol, developed by ICLEI, CARB, and the Climate Registry (TCR), and the General Reporting Protocol, developed by TCR, are widely used to develop GHG inventories for local governments and public agencies.10 The method to determine boundaries in the U.S. Community Protocol is different from the method in the Local Government Operations Protocol or the General Reporting Protocol, which depends on the entity’s financial or operational control. The community inventory accounts for the emission-generating activities in the Tule River Reservation, while the Tribal Government Operations Inventory is based on the government's operational control.
The study year in a GHG inventory is critical because it defines the time period for which emissions are measured and analyzed. Selecting a consistent and well-documented year ensures that the inventory reflects actual activity levels, energy use, and emissions patterns. Calendar year (CY) 2023 was selected as the study year because it is the most recent year with complete and reliable data across all relevant sectors. Using the latest full year of data strengthens the accuracy of the inventory and provides a timely baseline for tracking future emissions trends and evaluating the effectiveness of climate action strategies. More information can be found in Appendix A.
Emissions are divided into two primary tracks: the community and the local government inventory. The community inventory focuses on emissions from individuals residing within the Tule River jurisdiction, encompassing those mainly within the Reservation limits, as well as those resulting from residents' activities. The local government operations inventory focuses on emissions stemming from government activities and facilities. Emissions for this project were calculated using the ICLEI ClearPath Tool. As the TRIT does not have any industrial or agricultural activities, emissions from these sectors are assumed to be zero.11
stemming from government activities and facilities Emissions for this project were using the ICLEI ClearPath Tool 11
ity Inventory
amount of GHG emissions produced by the Tule River Reservation for 2023 was 3,307 s of carbon dioxide equivalent (MT CO2e) emissions
The total amount of GHG emissions produced by the Tule River Reservation for 2023 was 3,307 metric tons of carbon dioxide equivalent (MT CO2e) emissions.
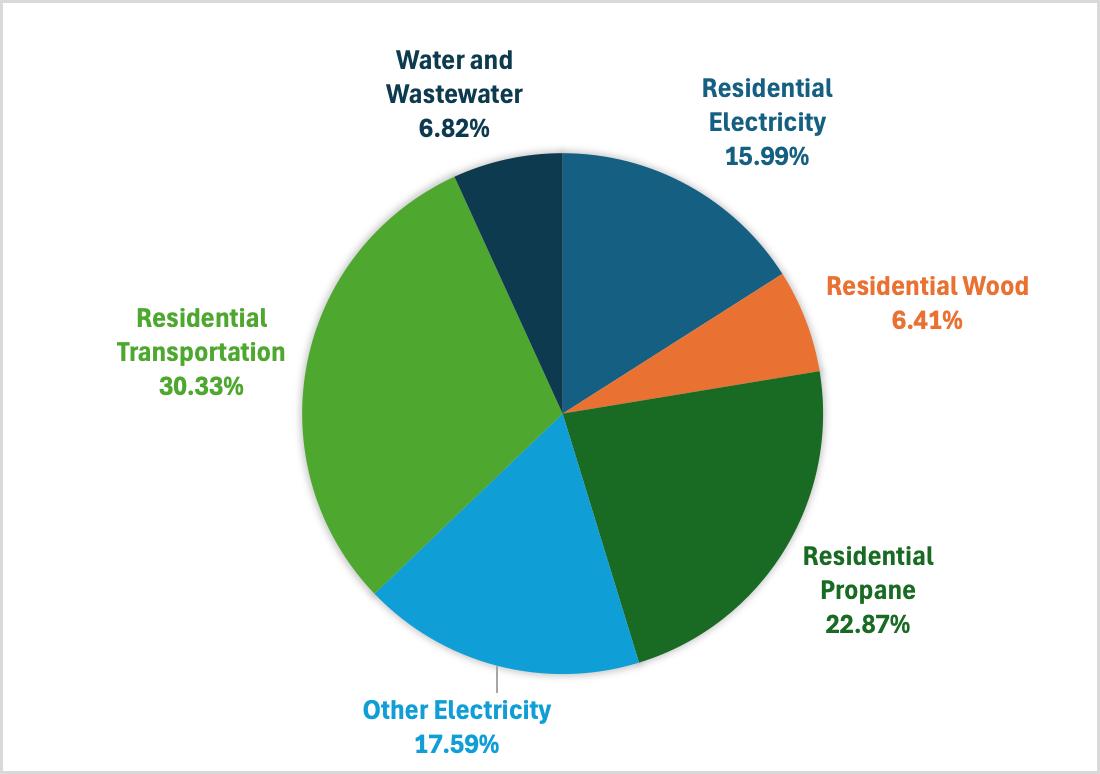
2023 Community Emissions Breakdown
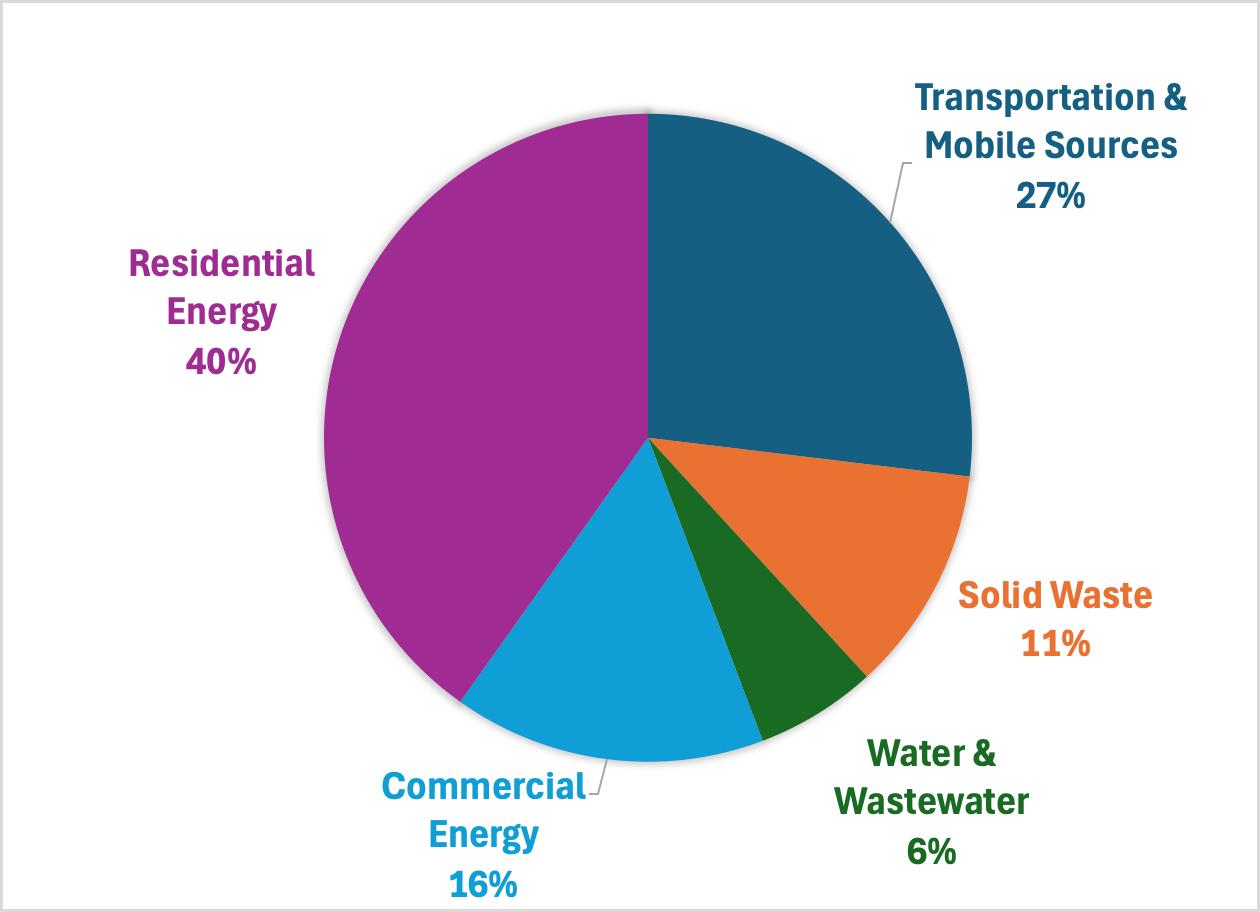
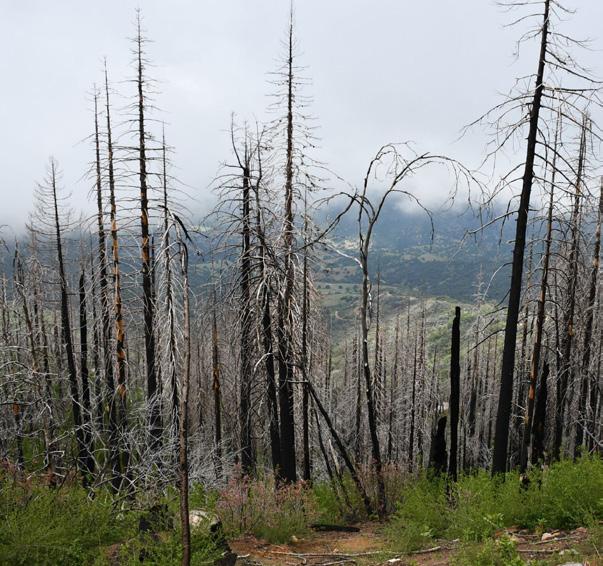
Table 2a. Community Emissions Detailed Table for Year 2023
nment Operations Inventory
tal amount of emissions produced by the Government Operations of the Tule River vation for 2023 was 1,656 MT CO2e
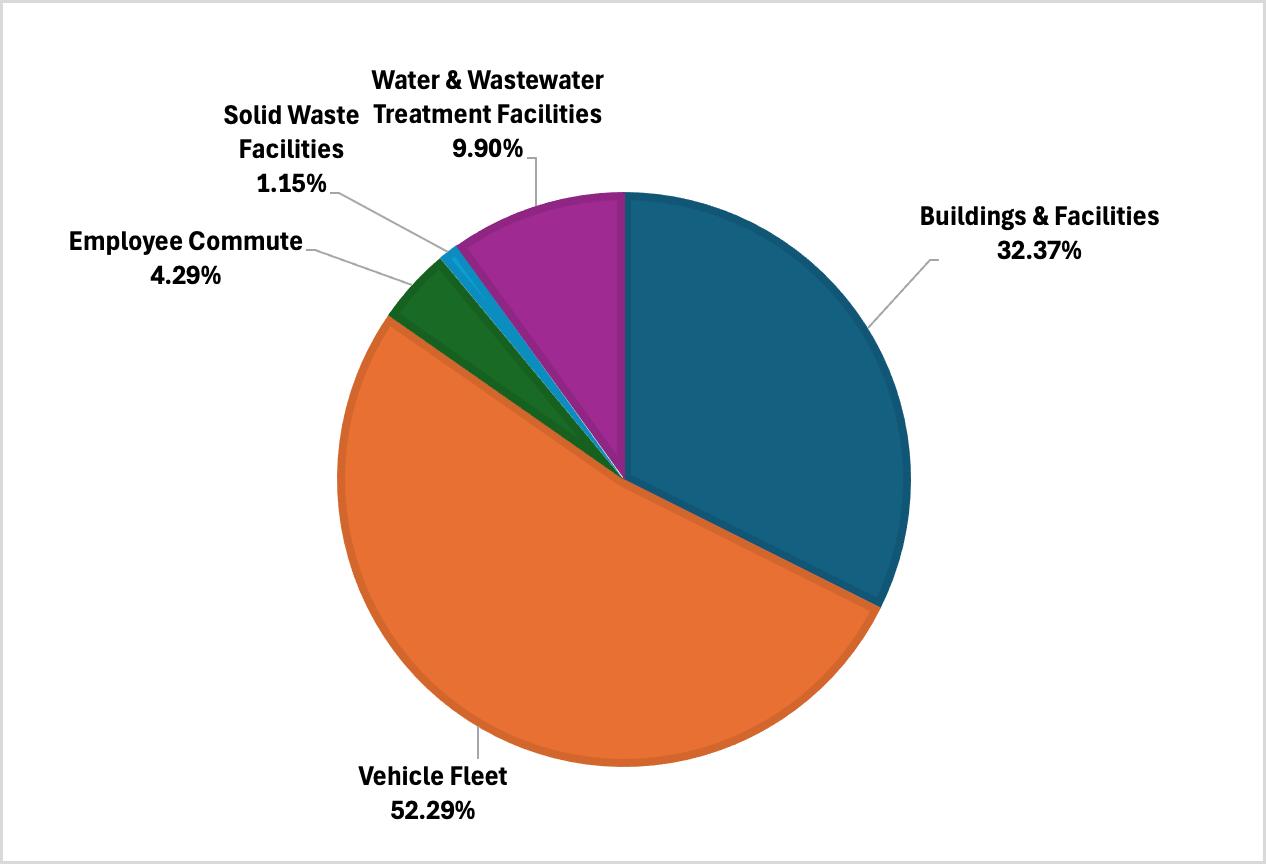
The total amount of emissions produced by the Government Operations of the Tule River Reservation for 2023 was 1,656 MT CO2e.
Figure 2a 2023 Local Government Operations Emissions Breakdown
3. Local Government Operations GHG Emissions for Year 2023
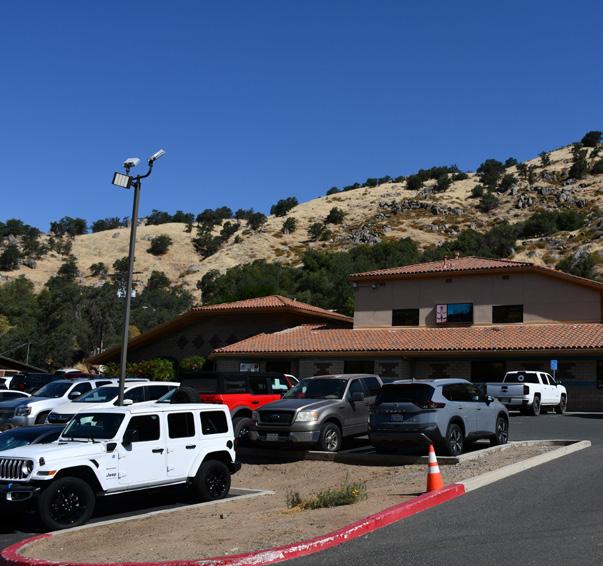
Table 3. Local Government Operations GHG Emissions for Year 2023
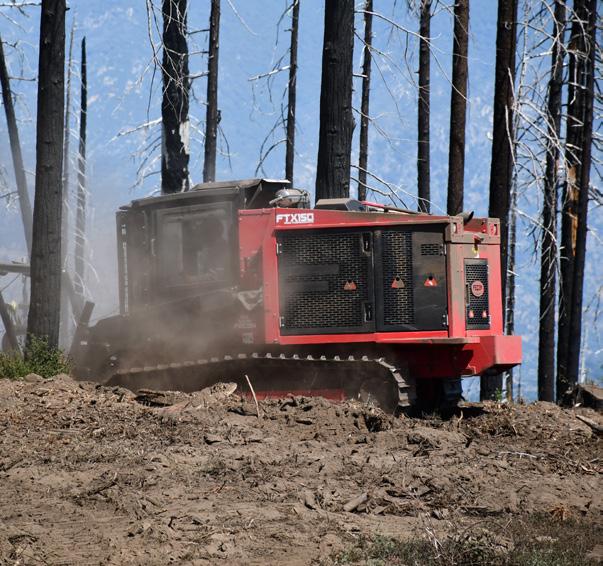
Forests and land use play an important role in a community’s greenhouse gas profile by both releasing and absorbing carbon. Activities such as tree harvesting, land clearing, and changes in vegetation can result in emissions, while forest growth and conservation efforts can remove carbon from the atmosphere.
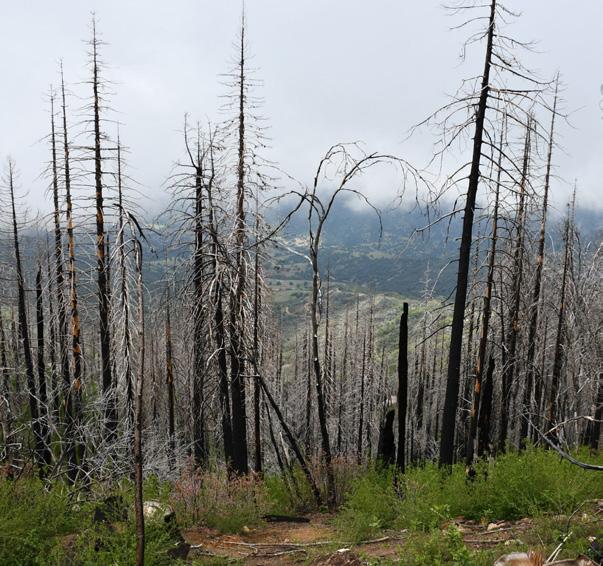
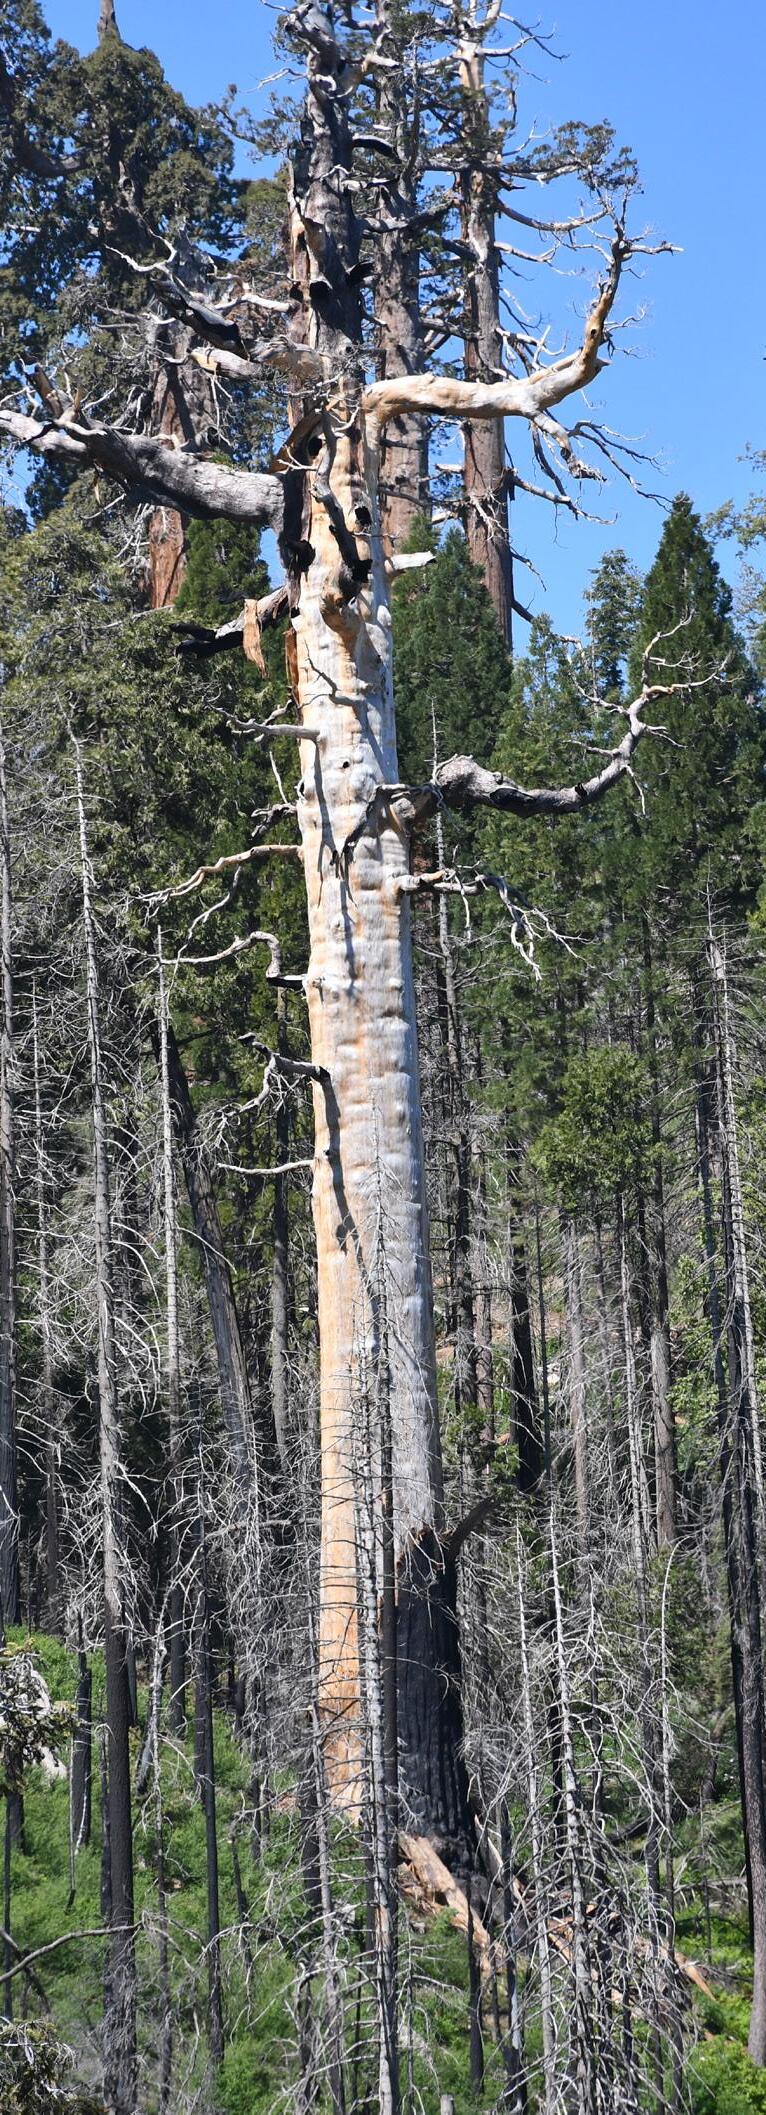
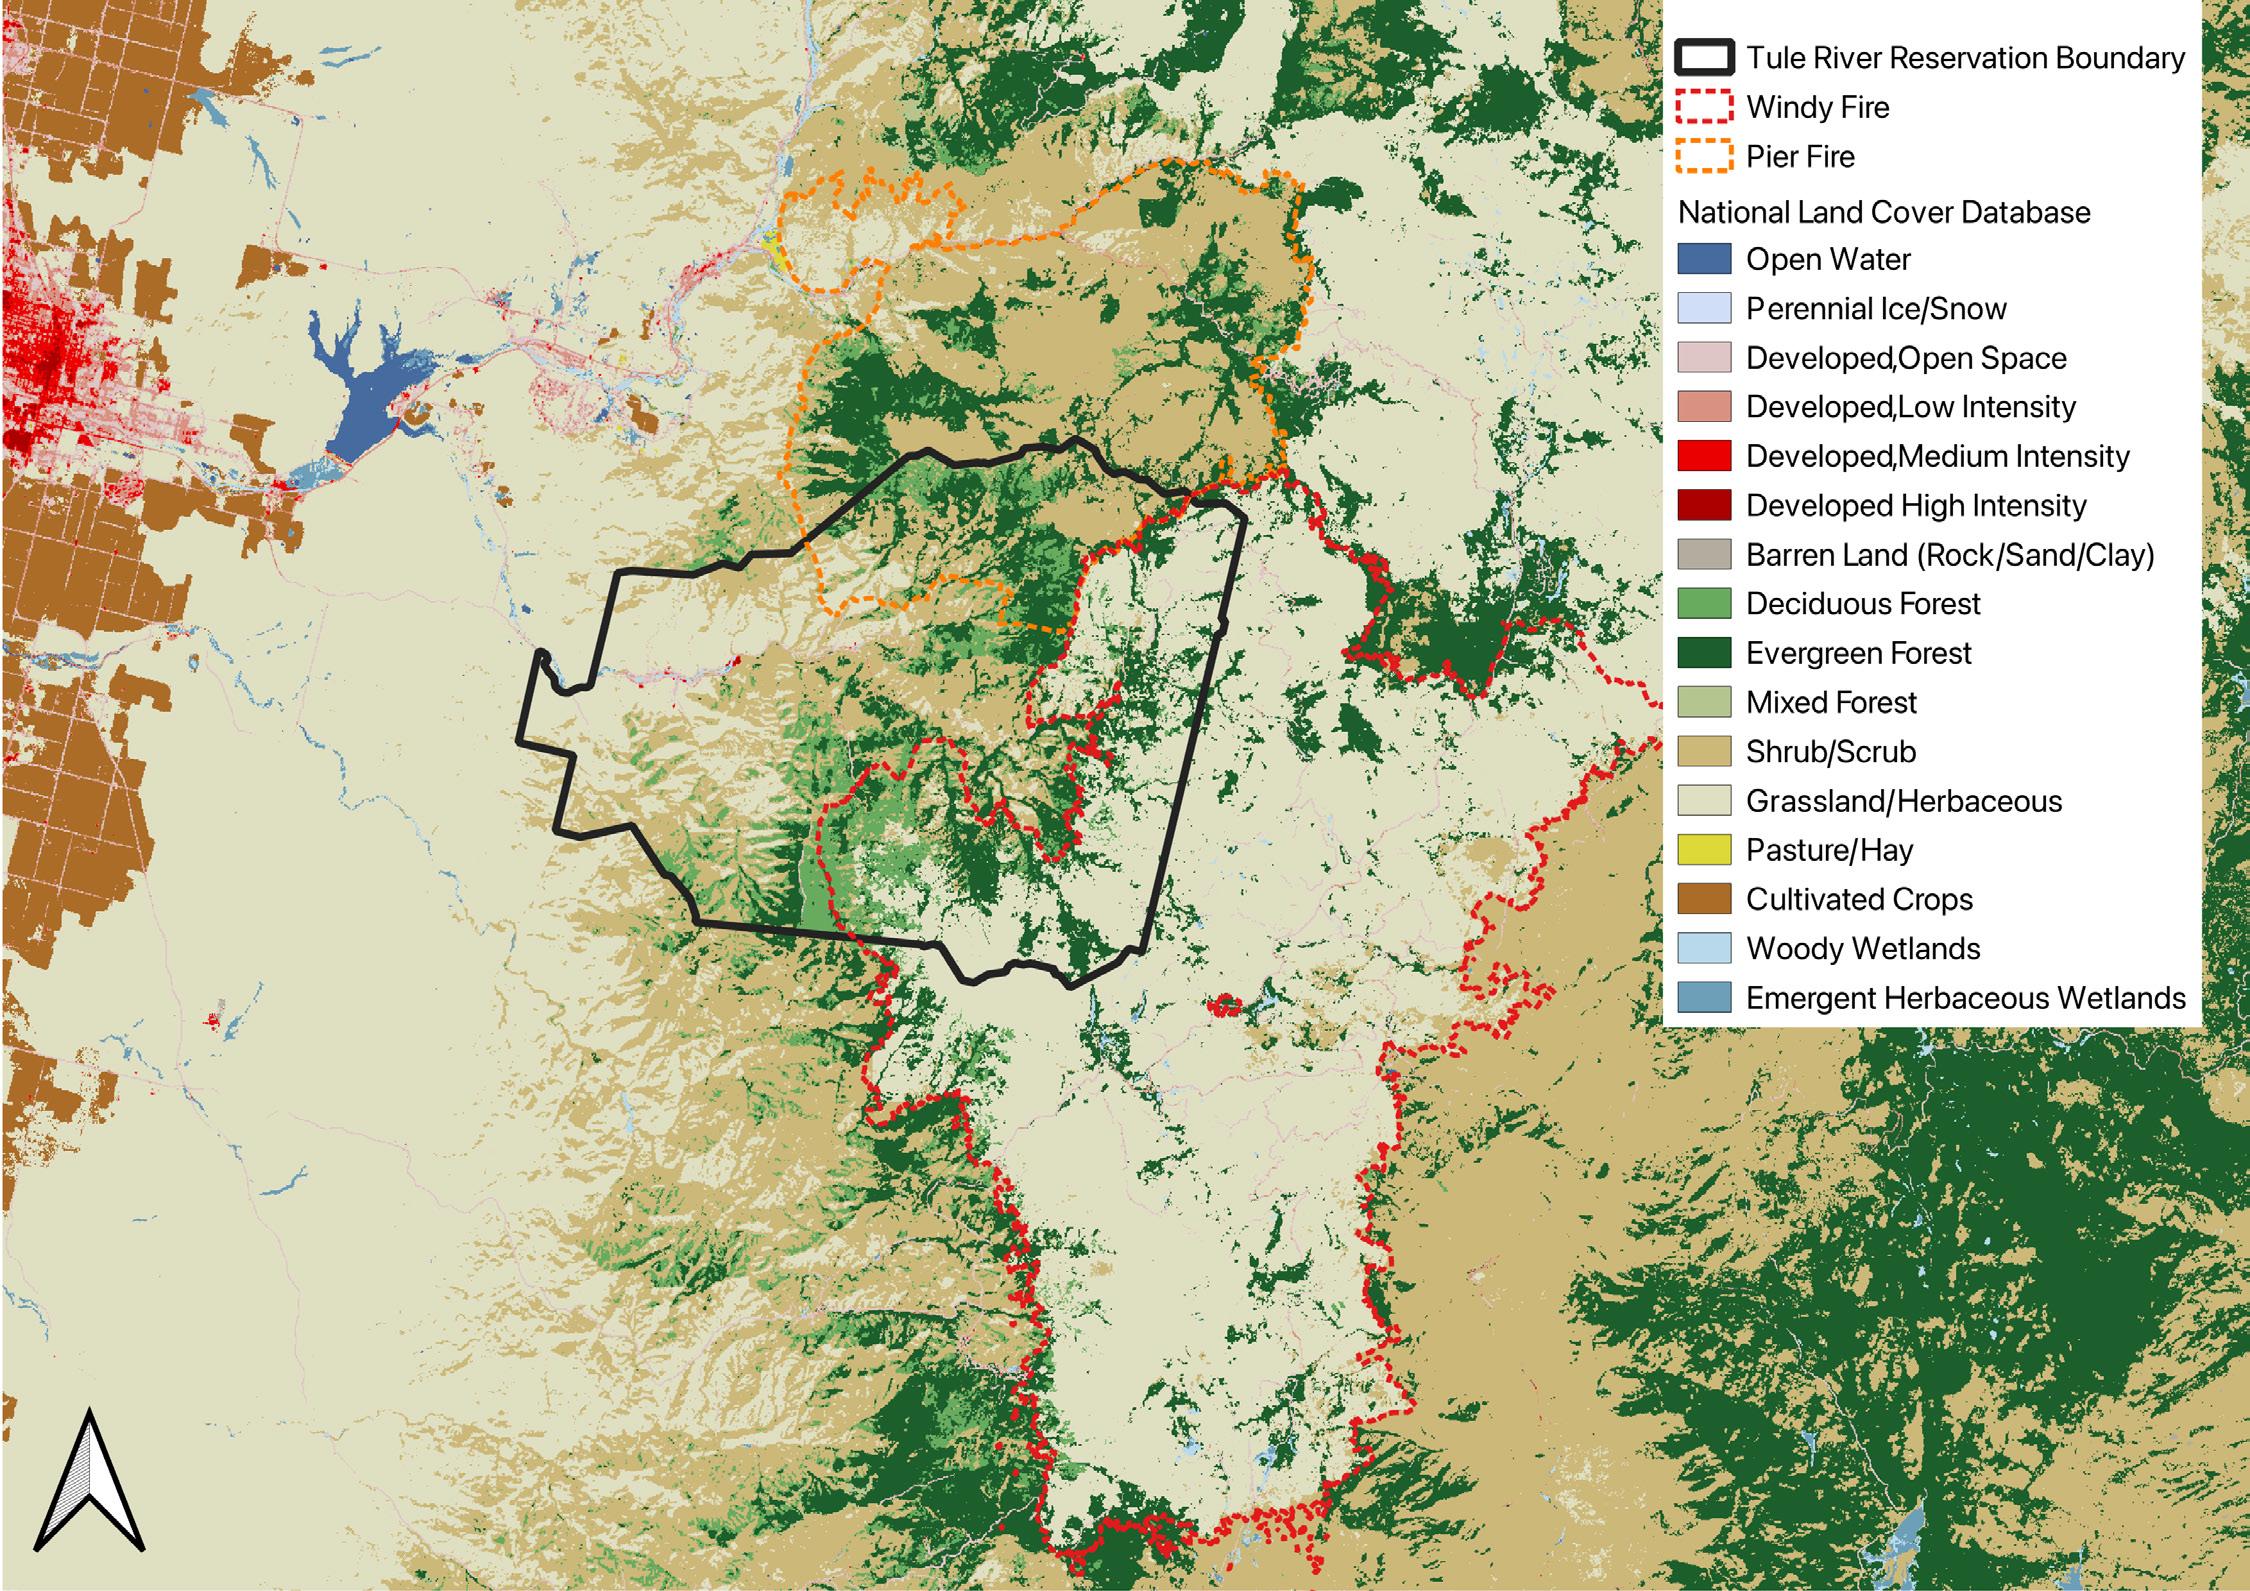
The analysis is based on the U.S. Community Protocol and uses ICLEI’s Land Emissions and Removals Navigator (LEARN) tool, which integrates land cover and biomass data to quantify sources and sinks. Land use change insights provide a more complete picture of the community’s carbon balance and support land use planning that aligns with climate goals. Wildfires are a major driver of land use emissions for the Tribe. In recent years, catastrophic fires such as the 2021 Windy Fire and the 2017 Pier Fire have severely impacted the reservation’s forested lands. These events caused immediate carbon releases through biomass combustion and resulted in long-term emissions due to the conversion of forested areas to non-forest land. This shift has reduced the land’s carbon sequestration capacity.
Table 4 below shows a simplified report of land use emission categories based on Intergovernmental Panel on Climate Change (IPCC) categories. The total net flux from land use results in emissions of 149,283 MT CO₂e per year. This is primarily due to the shifting landscape change from forests to non-forests. These emissions dwarf those from human activities and have been separated due to the vast differences in quantity of emissions.
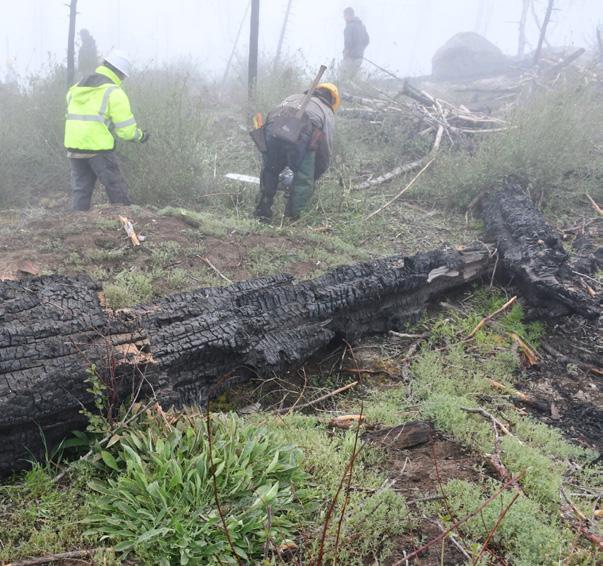
Figure 3: 2025 National Land Cover Database overlaid with the Boundary and Catastrophic Fires Boundary
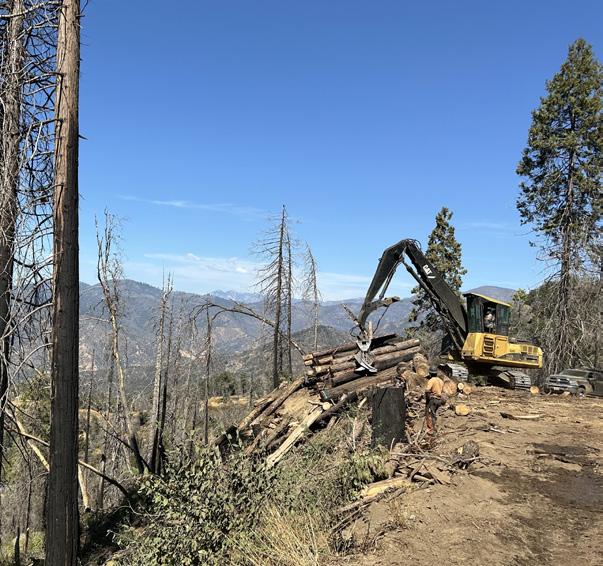
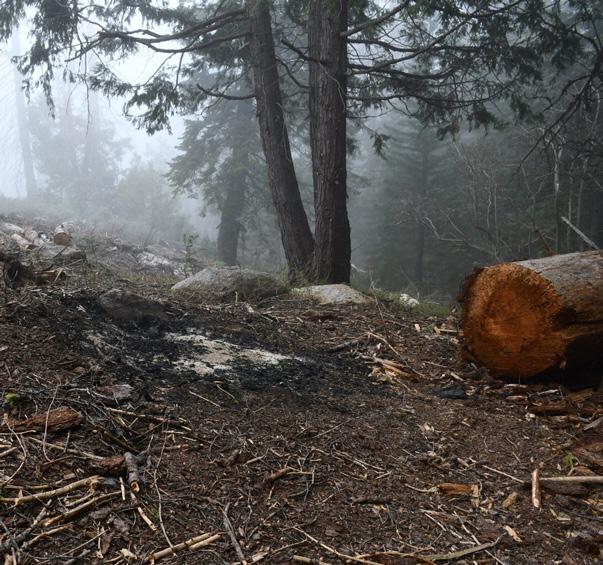
The Tule River Indian Tribe has committed to reforestation efforts, which have been largely successful, particularly in areas affected by the Pier Fire. While the primary focus of the CCAP is on reducing human-caused emissions, it will also support ongoing reforestation initiatives. Future planning documents may include targets and quantified emissions reduction estimates related to reforestation and land use change. More information on emissions from land use change can be found in Appendix C.
The 2023 GHG inventory establishes the Tule River Tribe’s first comprehensive baseline of GHG emissions across both community-wide activities and local government operations. Although trend analysis is not yet possible, this section provides an interpretation of the inventory results, identifies the primary sources of emissions, and outlines key considerations for future planning.
In the calendar year 2023, community-wide activities on the Tule River Reservation generated approximately 2,990 MTCO₂e. Emissions were primarily driven by residential energy use (45.0%) and transportation (29.8%).
Residential energy emissions, totaling 1,346 MTCO₂e, resulted from the use of electricity, propane, and wood-burning stoves for cooking and heating. These fuels are essential in meeting daily energy needs and ensuring comfort and safety in homes, especially during colder months. Wood burning in particular remains a valued cultural practice among Tribal members.
Transportation emissions, estimated at 890 MTCO₂e, reflect the rural setting of the community and the corresponding reliance on personal vehicles for commuting, accessing goods and services, and participating in cultural and social activities. The lack of public transit infrastructure is a known contributor to higher per-capita vehicle emissions in rural Tribal communities.
Emissions from government-owned facilities, solid waste disposal, water pumping, and wastewater systems made up the remainder of community-wide emissions. The water and wastewater sector includes the electricity and fugitive emissions used to operate potable water distribution and wastewater treatment plant systems.
The Tule River Tribal government’s operations produced approximately 1,656 MTCO₂e in 2023. Emissions were largely dominated by the Tribal vehicle fleet, which is essential for service delivery across departments, including maintenance, emergency response, public safety, and natural resources management.
Employee commuting and water and wastewater treatment were additional sources of government emissions. Emissions from solid waste operations and buildings, and facilities were comparatively low. Government buildings generated minimal emissions due to electricity being the sole energy source.
Although this inventory represents a single point in time, it provides a clear picture of the Tribe’s largest emission sources. Residential energy use and vehicle travel are the primary drivers of community-wide emissions, while the Tribal fleet is the most significant contributor among government operations.
Many of these sources present challenges for near-term emissions reductions due to cultural, financial, and infrastructure realities. Wood burning is not only a practical heating method but also a cultural tradition that holds importance for many Tribal members. Similarly, propane is the dominant home heating fuel, and every home is already outfitted for its use. Transitioning away from propane would require widespread retrofits and significant investment.
Electric vehicles (EVs), while promising for reducing transportation emissions, currently face multiple barriers. They remain cost-prohibitive for many residents, and limited public charging infrastructure, combined with regular power outages, makes EV use impractical in the near term. These issues are common across rural communities and particularly acute in Tribal areas.
These realities underscore the importance of pursuing emission reduction strategies that are culturally appropriate, financially feasible, and resilient to local infrastructure limitations. Long-term opportunities may include expanded renewable energy access, home weatherization and energy efficiency programs, clean vehicle incentives, and greater energy independence. These efforts must be designed in collaboration with the community to ensure they are responsive to local needs and values.
Looking ahead, this inventory establishes a foundation for future emissions tracking. As the Tribe repeats this process in future years, it will be able to measure changes, evaluate the effectiveness of climate actions, and adjust strategies accordingly.
A near-term mitigation target refers to a GHG emissions reduction goal set for achievement by the year 2035 It involves measurable actions and outcomes over the next several years, using currently available technologies and practices. The purpose of a 2035 target is to achieve substantial progress in reducing emissions within the short-to-medium timeframe, and to establish a trajectory toward deeper reductions. The 2035 year is chosen as it is a mid-term target that is less aggressive than the U.S. 2030 mid term goal, and allows TRIT appropriate time to achieve emission reductions.
A long-term mitigation target refers to a GHG emissions reduction goal set for achievement by the year 2050. This target provides a planning horizon for comprehensive and sustained emissions reductions over the next several decades. A 2050 target is often used to align with broader national or international climate objectives and frameworks. The 2050 target is chosen to align with the timeline of EPA and US national goals, although zero emissions may not be achieved in 2050. These targets provide a structured timeline for planning, implementing, and evaluating climate mitigation measures over both short and extended periods.
The Tribe is committed to setting GHG reduction targets that are both achievable and grounded in empirical data. The Tribe recognizes that ambitious but unrealistic goals can undermine implementation efforts and community trust. Therefore, Tribe’s mitigation targets are based on their own GHG inventory and reflect a pragmatic, evidence-based approach to emissions reduction. This target is based on reducing all emissions other than transportation-related emissions and household cooking and heating from propane and wood.

Using 2023 as the baseline year, with total emissions measured at 3,308 MTCO₂e, the Tribe has established the following targets:
These targets represent a 25% reduction by 2035 and a 55% reduction by 2050. They are designed to reflect what can be realistically achieved through a combination of local policy actions, capacity-building, and technical interventions available to the Tribe. The targets also account for the Tribe’s current infrastructure, resource constraints, and projected development.
By tying its climate goals directly to its GHG inventory, the Tribe ensures that mitigation efforts are transparent, trackable, and tailored to the specific conditions of the Tribe’s lands, operations, and communities. This approach allows for continuous evaluation and adjustment of strategies over time and supports both accountability and long-term sustainability.
To estimate future GHG emissions for the Tule River Reservation under a Business-As-Usual (BAU) scenario, this study used sector-specific methodologies that rely on historical data, emission factors, and conservative assumptions about future activity. BAU projections assume no new policies or mitigation measures are implemented beyond those already in place as of the inventory year. The Tribe has no previous GHG inventory data available prior to the study year of 2023, which was chosen as the baseline year for all emission reductions to be compared to.
• Residential Electricity and Other Electricity:
Emissions were projected using historical electricity consumption data and emissions factors aligned with Southern California Edison’s (SCE) forecasted grid decarbonization targets. Because the Tribe does not purchase or use natural gas, emissions from stationary combustion were excluded. SCE’s public climate commitments and Renewable Portfolio Standard (RPS) compliance were assumed to continue on track, resulting in a consistent decline in emissions from electricity use through 2050.
• Transportation and Mobile Sources:
Emissions were estimated using ICLEI’s ClearPath default carbon intensity growth rates, which apply a 1.8% annual reduction to reflect improvements under the Corporate Average Fuel Economy (CAFE) standards and expected fleet turnover. Due to limitations in tribal transportation data, vehicle miles traveled (VMT) were assumed to remain constant, consistent with the stable population assumption.
• Solid Waste and Water/Wastewater:
Emissions from waste disposal and water/wastewater systems (outside of electricity) were held constant through 2050. This reflects the absence of detailed activity forecasts and the assumption that per capita waste generation and water use will not change significantly without intervention.

• No Natural Gas Usage: The Tule River Tribe does not use or purchase natural gas, as described in the GHG inventory section.
• SCE Grid Decarbonization: SCE’s clean energy transition is assumed to occur on schedule, resulting in declining emissions intensity for electricity.
• Stable Population: Due to inconsistent reporting and large changes in recent Census figures, the Tule River population is assumed to remain stable through 2050. This avoids over- or under-projecting emissions growth. Updated population figures will be incorporated as they become available.
• Default CAFE-Driven Reductions: A 1.8% annual emissions intensity reduction was applied to the transportation sector using ICLEI’s ClearPath default rates.
• Emissions from land use change are not included in the BAU, as this study is focused on human-caused emissions.
All emissions are expressed in MTCO₂e, using 100-year GWPs from the Intergovernmental Panel on Climate Change’s Fifth Assessment Report (IPCC AR5):
CO₂ = 1
CH₄ = 28
N₂O = 265
LIMITATIONS
• Lack of tribal-scale transportation and demographic forecasts introduces uncertainty into long-range projections.
• Proxy data and default assumptions (e.g., vehicle efficiency trends) may not fully capture localized shifts.
• Potential changes in water use or waste disposal practices are not reflected in the projections.

Limitations and Uncertainties
● Lack of tribal-scale transportation and demographic forecasts introduces uncertainty into long-range projections
● Proxy data and default assumptions (e.g., vehicle efficiency trends) may not fully capture localized shifts
● Potential changes in water use or waste disposal practices are not reflected in the projections
The Tribe’s BAU GHG projections reflect expected changes in emissions from 2023 through 2050, assuming no new policies or mitigation measures are adopted. The analysis covers five major sectors: Residential Energy, Commercial Energy, Transportation & Mobile Sources, Solid Waste, and Water & Wastewater.
The Tribe’s BAU GHG projections reflect expected changes in emissions from 2023 through 2050, assuming no new policies or mitigation measures are adopted. The analysis covers five major sectors: Residential Energy, Commercial Energy, Transportation & Mobile Sources, Solid Waste, and Water & Wastewater
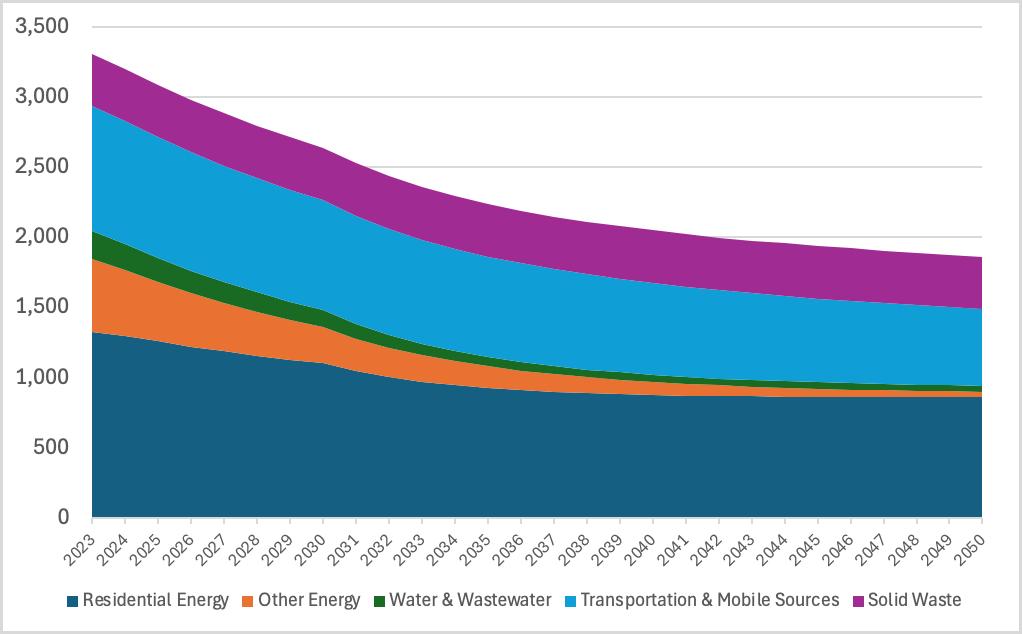
Figure 4a. Stacked Area Chart Showing Sector-Specific Community GHG Emissions From 2023 to 2050
4a. Stacked Area Chart Showing Sector-Specific Community GHG Emissions From 2023 to 2050
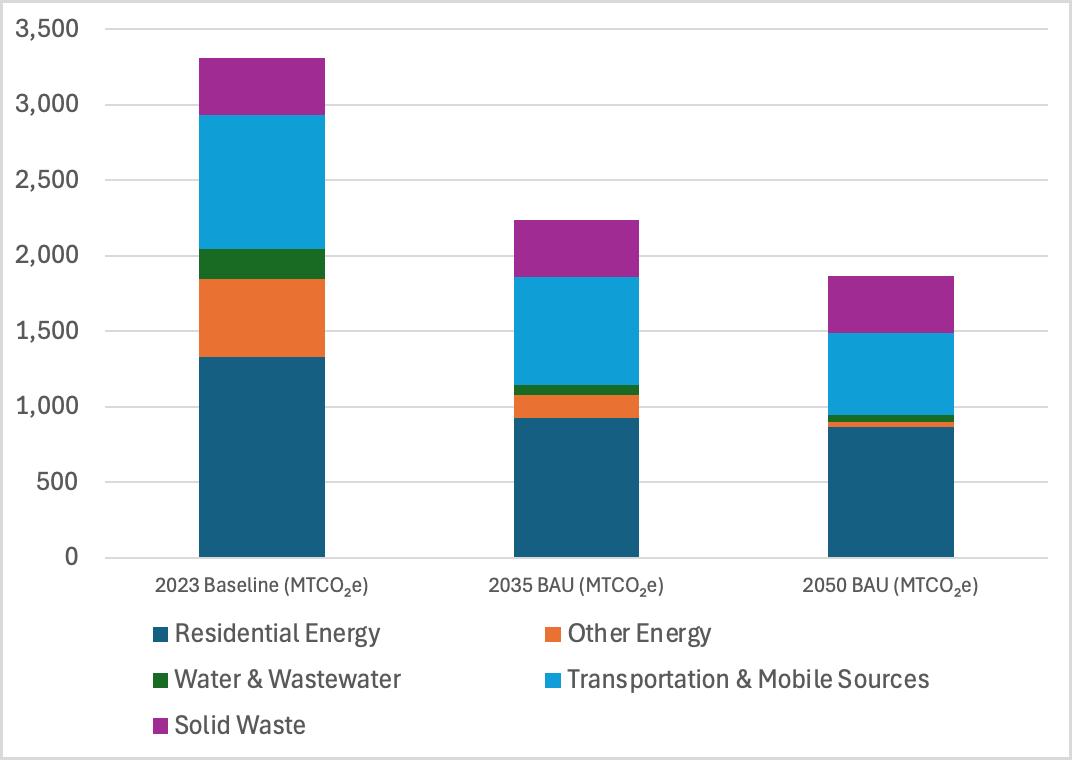
Table 6. Projected GHG Emissions for BAU Scenario
Percent Change in Emissions (2023–2050)
1 Overall Emissions Decline
1. OVERALL EMISSIONS DECLINE
• Total emissions are projected to decline from 3,308 MTCO₂e in 2023 to 1,863 MTCO₂e by 2050, a 44% decrease.
2. RESIDENTIAL ENERGY
• Emissions decrease from 1,328 MTCO₂e in 2023 to 864 MTCO₂e in 2050, a 36% reduction.
• This remains the largest single sector contributor throughout the forecast period.
3. OTHER ENERGY
• Sharp decline from 516 MTCO₂e in 2023 to 3 MTCO₂e in 2050.
• This is the most significant sectoral reduction in percentage terms, due to electricity emission reductions from grid renewable energy policies.
4. WATER & WASTEWATER
• Emission reduction from 200 MTCO₂e in 2023 to 45 MTCO₂e in 2050 due to electricity emissions reduction.
• Remaining emissions are from Wastewater processes, such as fugitive emissions and nitrification.
5. TRANSPORTATION & MOBILE SOURCES
• Emissions fall from 890 MTCO₂e in 2023 to 545 MTCO₂e in 2050, a 39% reduction.
• This remains the second-largest emissions source through 2050.
6. WASTE AND MATERIALS MANAGEMENT
• Emissions are constant at 374 MTCO₂e from 2023 through 2050.
• Indicates no expected change in this sector under ABAU.
These reductions are driven primarily by the decarbonization of electricity generation (in line with SCE’s climate goals) and improvements in vehicle fuel efficiency under the CAFE standards.
The Tribe’s GHG Reduction Measures, as outlined in the CCAP, constitute a targeted six-part strategy focused on reducing emissions while enhancing energy resilience and self-determination. These measures address key sectors including energy, building efficiency, water and wastewater systems, and waste management, and are tailored to the Tribe’s environmental conditions and resource constraints.
• Measure 1 calls for a feasibility study and implementation plan to establish a Tribal Utility Authority (TUA). This would increase energy independence, stabilize electricity supply, and support renewable energy integration.
• Measure 2 involves transitioning all government buildings to smart electricity meters, enabling real-time monitoring, energy savings, and data-informed decision-making, and laying groundwork for future grid management under the TUA.
• Measure 3 includes the deep retrofit and electrification of the former Eagle Mountain Casino to serve as a new government center. The project integrates solar PV, battery storage, and high-efficiency systems.
• Measure 4 focuses on phased energy efficiency retrofits in 20 government buildings, improving HVAC, lighting, and insulation to reduce operational costs and energy use over a 15-year period.
• Measure 5 will complete the integration of SCADA technology across water distribution and wastewater infrastructure. This allows realtime system control, energy-efficient pump operation, and improved reliability during seasonal shortages.
• Measure 6 aims to minimize landfill waste through recycling improvements, organics and construction material diversion, and policy updates to prevent illegal dumping. Community education and monitoring will support long-term waste reduction.

Each measure is accompanied by specific tasks, cost estimates, implementation timelines, and tracking metrics, ensuring they are actionable and accountable. Together, they form a strategic path to reduce emissions, enhance climate resilience, and promote sustainable development in alignment with tribal priorities.

MEASURE 1.
Complete a Feasibility Study and Implementation Plan to Develop a Tribal Utility Authority
DESCRIPTION
The reservation receives electricity from SCE via two circuits: the 12 KV Soda Spring (Boxwood Substation) serving 824 accounts, and the 12 KV Success (Porterville Substation) serving 2,356 customers. These circuits are subject to rolling blackouts, which significantly impact Tribe’s capacity to operate Tribe facilities, including their health center, which jeopardizes the well-being of reservation residents. Establishing a local TUA offers numerous benefits that cater specifically to the unique needs, environmental goals, and economic development strategies of the Tule River Indian Tribe. Energy authorities can enable the development and implementation of tailored energy solutions that consider local climate, geography, and resources, increasing energy independence and reducing reliance on external sources. The approach offers more stable energy prices and supply, and stimulates the tribal economy through job creation in construction, maintenance, and operation of energy facilities.
By focusing on local energy expenditures, the establishment of a TUA can generate a powerful economic multiplier effect, significantly benefiting businesses and residents across the Reservation. Local control of power ensures that revenues from energy production and sales remain within the community, rather than flowing to external utilities. This enables reinvestment into critical tribal programs, services, and infrastructure projects. Additionally, local control improves the Tribe’s ability to prioritize energy reliability for essential facilities, reducing vulnerability to rolling blackouts and grid disruptions. It also allows the Tribe to align energy projects with cultural values, environmental stewardship goals, and long-term sustainability planning. Ultimately, a locally controlled energy system strengthens tribal sovereignty and builds a more secure, prosperous future for the Tule River Indian Tribe.

Another advantage is that local TUAs can swiftly adopt innovative technologies and practices, placing a greater emphasis on renewable energy sources and energy efficiency measures, which align with environmental sustainability goals. A diversification of energy sources and an increase in local generation capacities can help to enhance the community's resilience to supply disruptions caused by natural disasters, policy decisions, or market fluctuations. Being directly accountable to the communities they serve, these authorities provide a higher level of transparency and responsiveness compared to larger utilities, fostering a culture of sustainability through community engagement and education on energy conservation and the benefits of renewable energy.
Moreover, local authorities are positioned to offer innovative financing options, incentives, and rebates to encourage the adoption of renewable energy technologies and energy efficiency improvements. They can effectively tailor and deliver programs designed to address energy affordability and access, ensuring support for vulnerable populations. The enhanced flexibility and adaptability of TUAs allow them to quickly respond to changing technologies, market conditions, and community needs, making them more effective in managing their energy strategies over time.
Establishing a local TUA significantly enhances a community's environmental, economic, and social well-being. The implementation steps for this measure are outlined below:
This task involves assessing the feasibility of establishing a sustainable utility system for the Tribe. It will evaluate the Tribe's technical and financial capacity to implement and maintain the utility system, focusing on its ability to provide affordable and reliable service, enhance energy efficiency, and reduce operational costs. A preliminary rate structure will be developed based on the Tribe's priorities and will consider options for offsetting costs or generating profits. The task will also involve calculating long-term capital and operational costs for the utility system and identifying risks, providing a comprehensive evaluation of the system's financial sustainability.

This task aims to create a detailed map of the existing utility infrastructure within the Tribe’s jurisdiction. The map will serve as a key planning tool for future expansions, maintenance, and vulnerability assessments. It will involve gathering and digitizing existing infrastructure data, developing a geographic prioritization plan, and collecting detailed information on utility assets such as poles, meters, and transformers. Additionally, infrastructure data will be linked to existing right-of-way agreements to streamline future evaluations and upgrades.
The task focuses on developing an organizational framework for the TUA that defines roles, responsibilities, and communication channels. It will involve reviewing and revising the Tribe's existing policies and regulations, drafting new ordinances, codes, and procedures, and ensuring these are aligned with the Tribe’s governance structure. Training sessions will be conducted to ensure the effective application of new policies and procedures, with metrics established to track their success and alignment with strategic goals.
This task focuses on identifying the workforce needs for the TUA, assessing the Tribe’s current staffing capabilities, and developing strategies to attract, train, and retain qualified personnel. It will involve identifying staffing gaps, developing a continuity plan to address turnover and retirements, and identifying workforce development opportunities for Tribal members. Partnerships with nearby community colleges, Vocational-Technical schools, and industry training programs can also be explored and planned. The task aims to ensure that the TUA has the necessary human resources to manage utility operations effectively and sustain future growth.
This task ensures that all findings, recommendations, and strategies from the previous tasks are compiled and delivered to key stakeholders. It will involve delivering a final presentation to Tribal leadership summarizing key findings and next steps, completing a comprehensive final report, and submitting progress and financial reports to the Bureau of Indian Affairs (BIA) Division of Energy and Mineral Development (DEMD). The deliverables will include a full narrative of the grant activities and necessary documentation for grant reporting.

The Tule River Indian Tribe holds primary authority for implementing the proposed GHG reduction measure. Oversight and decision-making are led by the Tribal Council and executed by key personnel with the relevant expertise and leadership roles.
Per Article VI, Section 1 of the Constitution of the Tule River Indian Tribe of the Tule River Reservation, the Tribal Council has the authority “to enter into negotiations with the Federal, State, and local governments on behalf of the Tule River Indian Tribe.” This provision establishes the Tribal Council’s governing authority to direct and manage intergovernmental relations and implement strategic initiatives, including energy projects and GHG reduction measures.
The Tribal Electrical Department, with support from other departments where necessary, will participate in the measure implementation and ensure that all activities are fully aligned with tribal governance, policies, and protocols.
No additional authority is currently anticipated. However, should the need arise, such as for work involving cross-jurisdictional coordination or non-Tribal properties, additional permissions will be pursued through formal Tribal Council resolution and, if necessary, coordination with federal, state, or local agencies.
This work is being supported through the Tribal Energy Development Capacity (TEDC) Grant, administered by the Bureau of Indian Affairs (BIA). The Tribe will provide regular progress reports, expenditure updates, and outcomes to the BIA to ensure the project aligns with federal guidelines and maintains transparency throughout its development.

The Tribe contracted a consultant to conduct feasibility studies and provide technical support. The consultant will serve as a third-party technical advisor under the direct oversight of tribal leadership. Their role will include:
• Conducting feasibility analysis for renewable energy and GHGreduction projects
• Providing guidance on project finance and development strategies
• Supporting compliance with grant requirements and permitting processes
The consultant will not hold authority to implement measures independently; all final decisions and actions will remain under the jurisdiction of the Tule River Indian Tribe.
The project began following the receipt of funding and was launched on February 1, 2025, with an expected duration of approximately 12 months. The following table provides an overview of specific project tasks, timelines, and key milestones, outlining critical activities necessary to successfully complete the project objectives.
Progress on this measure will be evaluated through several key metrics, each of which is designed to be measurable and provide transparent tracking of project implementation:
• Capacity Assessment: Creation of a comprehensive assessment detailing the Tribe’s current technical, administrative, organizational, and managerial capacity related to energy resource development
• Vision and Strategic Planning: Development of a clear vision and actionable strategies for environmental policies, regulations, laws, and procedures to address identified capacity gaps
• Finalized Roadmap: Delivery of a finalized, actionable roadmap approved by Tribal leadership, guiding future efforts in establishing a TUA and initiating targeted energy projects within Tribal Lands
• Energy Savings: Anticipated measurable reductions in energy consumption resulting from future clean energy purchases and on-site generation
• Cost Savings: Expected financial savings from lower energy bills due to increased efficiency and renewable energy projects
• GHG Emissions Reductions: Significant anticipated reductions in GHG emissions from integrating clean energy solutions
QUANTIFIED GHG EMISSION REDUCTIONS
Table 9. Quantified Emission Reductions from Measure 1
To support the creation of a sovereign TUA, this cost estimate outlines the anticipated expenses for both a comprehensive feasibility study and the formation of the legal and operational foundation for the authority. The feasibility study, totaling approximately $112,592, covers utility operations analysis, infrastructure mapping, organizational design, workforce planning, and community deliverables. The legal formation phase is estimated at $143,000 and includes the development of governance structures, regulatory planning, intergovernmental coordination, and an initial staff salary. Altogether, the total estimated investment to launch this effort is approximately $255,592, with opportunities to offset costs through federal and state grant programs.

Table 10. Estimated Costs for a Tribal Feasibility Study and Utility Authority Formation
The DOE and BIA grant programs (like the DOE Office of Indian Energy’s Strategic Technical Assistance Response Team (START) or CommunityScale Energy Deployment programs) are common funding sources for these stages. Part of this project has already received funding from the BIA TEDC Grant. Additional information about funding opportunities is available in the Funding Roadmap section and in Appendix D.

PROGRAM
Tribal Energy Development Capacity (TEDC) Grant
Office of Indian Energy – Planning and Capacity Grants
Office of Indian Energy – Deployment of Energy Infrastructure on Tribal Lands
Indian Community Energy Resilience Program (ICERP)
Energy Efficiency and Conservation Block Grant (EECBG)
Renewable Energy Development Assistance (REDA)
Economic Development Administration (EDA) – Public Works & Economic Adjustment Assistance
BIA – Division of Energy and Mineral Development (DEMD)
U.S. DOE – Office of Indian Energy
PURPOSE
Supports the development of tribal legal and regulatory infrastructure to manage energy resources
Funds strategic energy planning and technical capacity building
Feasibility studies, utility governance planning, legal framework development
TUA formation, workforce planning, energy roadmaps, stakeholder engagement
U.S. DOE - Office of Indian Energy
U.S. DOE (Inflation Reduction Act)
U.S. DOE- Office of Indian Energy
USDA – Rural Energy for America Program (REAP)
Supports development and implementation of tribalowned energy systems
TUA-aligned solar, battery storage, microgrids, and energy infrastructure
U.S. Department of Commerce (EDA)
California Tribal Energy Investment Programs (if applicable) California Energy Commission (CEC)
Advanced Grid Technology Acceleration Projects (if applicable) CEC
Funds projects that improve energy resilience in tribal communities
Supports energy planning, efficiency programs, and clean energy initiatives
Offers technical assistance for planning renewable energy projects in tribal and rural communities
Supports infrastructure development for economic resilience and job creation
Offers grants for clean energy planning, grid resilience, and energy sovereignty
Accelerates deployment of advanced grid and distributed energy technologies
Grid modernization, TUA formation, interconnection studies
Staff capacity, policy development, incentive program design
Community-scale project development tied to energy authority goals
Utility setup, energy workforce training centers, clean energy transition planning
Tribal energy roadmaps, distributed energy siting, community outreach
Microgrid integration, grid interoperability pilots, resilience-enhancing innovations
The Tule River Indian Tribe currently receives electric service through traditional analog metering infrastructure, which limits real-time energy monitoring, data tracking, and demand response capabilities. This outdated metering system restricts the Tribe’s ability to proactively manage energy use, identify inefficiencies, and respond to energy market signals or grid disruptions. Transitioning all government buildings to smart electricity meters represents a foundational step toward modernizing energy management, improving operational efficiency, and advancing the Tribe’s broader climate and energy goals.
Smart meters enable real-time communication between energy consumers and the utility provider. These devices allow for continuous monitoring of energy usage, providing Tribal facility managers with detailed, actionable insights into consumption patterns. Even prior to the establishment of the Utility Authority, this data can be used to detect energy waste, optimize building performance, and identify costsaving opportunities through load shifting or behavioral interventions. Furthermore, smart meters enable more precise energy auditing and inform future renewable energy and energy efficiency projects by providing baseline and post-implementation usage data.
The Tribe can also enhance grid reliability and resilience by transitioning to smart meters. During periods of high demand or rolling blackouts— frequent in the region due to wildfire risk and aging infrastructure— smart meters can provide near-instantaneous usage data to help prioritize critical loads and manage demand. Additionally, they support integration with distributed energy resources (DERs), such as solar photovoltaics and battery storage, enabling automated load management, improved peak shaving, and better alignment of on-site generation with building loads.
The modernization of the Tribe’s metering infrastructure will help strengthen administrative functions, develop demand response programs, and provide customized energy services. Automated meter readings reduce the potential for human error, eliminate the need for manual site visits, and provide transparent billing information. The TUA, if established, will be able to use smart meter data for accurate billing and revenue collection within its own system. Over time, the transition will support the development of energy policies and incentivize demand-side management measures as part of larger tribal energy strategies. With full control, the Tribe could offer tailored energy services to different government buildings or even future residential customers based on real-time data.
To fully capture the benefits of smart meter installations, the Tribe plans to take the following steps:
1. Real-Time Energy Monitoring and Analysis: Use smart meters to track building energy use in real time, identifying inefficiencies and opportunities for immediate savings.
2. Energy Efficiency and Demand Management Programs: Implement targeted efficiency upgrades and load-shifting strategies based on meter data to lower costs before full energy control is achieved.
3. Load Forecasting and System Planning: Analyze consumption patterns to design appropriately sized solar, battery, and microgrid systems aligned with actual facility needs.
4. Transition to TUA Operations: After establishing the Authority, use smart meters for precise billing, rate setting, and energy management across tribal government buildings.
5. Ongoing Optimization and Economic Development: Continuously refine energy operations and explore new revenue streams, using smart meter data to maximize system performance and community benefits.
The implementation steps for this measure include:
This task will involve conducting a detailed audit of all electric meters installed across government buildings on the Reservation. The audit will catalog the age, type, and condition of existing meters and assess compatibility with available smart metering technologies. This will include mapping meter locations and linking them to building types and energy usage profiles to inform prioritization for upgrades.
This task will assess the technical and logistical feasibility of implementing smart meters across the Tribe’s facilities. It will include evaluating communications infrastructure (e.g., wireless, cellular, or fiber connections), data security protocols, compatibility with existing utility systems (SCE), and integration with energy management platforms.
Based on the audit and feasibility results, an implementation plan will be developed outlining procurement needs, capital costs, installation phasing, and training requirements. Procurement of meters will follow Tribal policies and include a competitive bidding process for smart meter vendors. The implementation plan will also identify opportunities for grant support, rebates, or utility partnerships to offset upfront costs.
Once contracts are awarded, this task will cover the physical installation of smart meters across government buildings, followed by integration with a centralized energy data platform. Facility managers will be trained in using the system to monitor energy consumption, set alerts, and generate reports. Technical testing will be performed to confirm successful installation and system communication.
This task focuses on evaluating performance outcomes and establishing ongoing protocols for data use and reporting. Energy use baselines will be compared to post-installation metrics to quantify savings and identify additional areas for efficiency improvements.
The Tule River Indian Tribe maintains full authority over this GHG reduction measure, with leadership provided by the Tribal Council and technical oversight from the Energy and Technology Director. Under Article VI, Section 1 of the Tule River Indian Tribe’s Constitution, the Council retains authority to manage strategic infrastructure projects and enter into utility coordination agreements. This includes decisions on metering technologies, vendor selection, and infrastructure upgrades.
The project can be strategically launched following the formal establishment of the TUA. This contingency ensures the project aligns with broader long-term energy governance plans. The Environmental Department, Tribal facilities management, other departments, and selected contractors will work on the implementation and deployment of smart meters.
Should the TUA become operational during implementation, governance and oversight responsibilities may be transitioned or shared accordingly. Programming and deployment plans will be designed by the Tribal Energy and Technology Director with flexibility to ensure continuity in decision-making, vendor engagement, and technology integration. Oversight will include ensuring compliance with Tribal policies, timelines, and budget requirements. Additional coordination with the Tribal IT Department may be required for data integration and communications infrastructure.
• Utility Interconnection: Coordination with SCE will be required to ensure that smart meters meet utility compatibility standards and can effectively communicate with their grid systems
• Building Code Compliance: All electrical upgrades and device installations will adhere to NEC, Tribal building codes, and applicable state regulations
This measure is planned to launch following the establishment of the TUA, approximately in 2026, with a planned duration of 3 years. The table below presents the proposed tasks, timelines, and key milestones, highlighting the essential activities needed to accomplish the project's objectives.
Table 12. Implementation Timeline and Milestones for Measure 2
Task 1: Audit of Existing Metering Infrastructure 1-2 months
Task 2: Technical Feasibility and Technology Selection 2-3 months
Task 3: Implementation Planning and Procurement 2-4 months
Task 4: Installation and Integration 9-12 months
Task 5: Post-Installation Monitoring and Optimization
Continuous after measure implementation
Complete audit report, including full inventory
Finalize smart meter technology and communication system design
Develop implementation plan, secure vendor contracts, and order equipment
Complete installation and test system functionality
Evaluate performance, generate first quarterly report, and recommend next step
Progress on this measure will be tracked using a set of defined metrics to ensure transparency and measurability throughout project implementation:
• Meter Installation Count: Number of smart meters successfully installed across government buildings
• Data Accessibility: Percentage of buildings with active real-time monitoring enabled
• Energy Use Reduction: Decrease in kWh consumption compared to pre-installation baseline
• Operational Efficiency: Reduction in manual meter reading time and billing errors
• GHG Emissions Reductions: Calculated reduction in emissions from improved energy management and peak load control
• Cost Savings: Measured financial savings in monthly electricity costs due to load management or efficiency gains
The estimated total cost to transition all 26 government buildings on the Tule River Reservation to smart electricity meters is approximately $121,250. This includes a full infrastructure audit, technical evaluation of compatible meter technologies, procurement and installation of smart meters ($3,000 per meter), integration with a centralized monitoring platform, and post-installation performance optimization. These highlevel planning estimates reflect typical costs for institutional-scale smart metering projects and assume integration with utility systems and Tribal operations. Final costs may vary based on vendor pricing, communications infrastructure, and potential in-kind contributions from Tribal staff or partners

Several federal and state funding sources are well aligned with the goals of this smart metering initiative. Agencies such as the U.S. Department of Energy, Bureau of Indian Affairs, and U.S. Department of Agriculture offer grants and technical assistance specifically for Tribal utility infrastructure modernization. Smart meter deployment, building-level energy monitoring, and load management strategies are eligible uses under programs like the DOE Office of Indian Energy Deployment Grants, the Inflation Reduction Act’s Direct Pay provisions, and California's energy innovation programs. These resources can help offset both capital and planning costs while supporting longterm energy efficiency and resilience. More information on funding opportunities can be found in the Funding Roadmap section and in Appendix D.
PROGRAM ADMINISTERING AGENCY
DOE Office of Indian Energy – Energy Infrastructure Deployment Grants
Energy Efficiency and Conservation Block Grant (EECBG)
Inflation Reduction Act (IRA) – Section 179D (Direct Pay)
BIA Tribal Climate Resilience Program
USDA Rural Energy for America Program (REAP) –Tribal Track
State Programs –California Energy Commission (CEC) & California Public Utilities Commission (CPUC)
DOE START Program –Technical Assistance
Tribal Government Challenge Planning Grant (California Energy Commission)
U.S. DOE Office of Indian Energy
U.S. DOE Office of Indian Energy
PURPOSE / DESCRIPTION
Funds Tribal energy infrastructure, including energy management systems and advanced metering
Formula and competitive grants for energy conservation and technology upgrades
ELIGIBLE USES & FUNDING AVAILABILITY
Up to $5M per project; smart meter installation, software integration, and staff training eligible
Smart meter installation, energy audits, energy tracking software; funding varies by Tribe size
U.S. Treasury / IRS
Bureau of Indian Affairs (BIA)
U.S. Department of Agriculture (USDA)
Offers cash payments equivalent to commercial building energy efficiency tax credits
Supports Tribal climate planning and resilience, including energy system modernization
Offers technical and financial assistance for rural energy efficiency upgrades
Covers energy-saving components enabled by smart meters (e.g., demand response, HVAC control); up to $5/sf in credits
Energy audits, buildinglevel monitoring, meterenabled load forecasting and efficiency strategies
Smart metering systems and energy management tools for Tribal government facilities
California State Government
U.S. DOE Office of Indian Energy
Offers grants and incentives for smart grid, load management, and distributed energy readiness
Smart meter deployment, software integration, load forecasting systems; varies by grant cycle
California State Government
Free technical support for energy planning and infrastructure deployment
Supports California Native American Tribes in planning to reduce GHG emissions, improve clean energy access, and build climate resilience
Includes help with smart meter program design, RFP development, and funding strategy
Clean energy and clean transportation planning, energy efficiency strategies, affordability assessments, climate risk planning, and public health-focused energy analysis
The Tule River Indian Tribe plans to implement a comprehensive renovation of the former Eagle Mountain Casino to convert it into a government center. Within the renovation, the Tribe will pursue the highest level of energy performance available. This transformation will support the Tribe’s goals of achieving energy independence, reducing GHG emissions, increasing climate resilience, and providing long-term cost savings and social benefits to the community.
The project will include integration of solar PV systems, full electrification of building systems, and energy efficiency retrofits. The Tribe will dramatically reduce energy use intensity in the building and reduce GHG emissions associated with the building operation.
Constructed in the early 1990s and operational until 2023, the Eagle Mountain Casino was the Tribe’s original gaming facility before the new Eagle Mountain Casino was relocated off-reservation near Porterville. The original building is located within the Tule River Indian Reservation's original boundaries and spans approximately 30,000 square feet. The building was designed primarily for gaming and hospitality and includes large open spaces, commercial kitchens, restrooms, offices, and utility infrastructure typical of casinos. While it played a key role in the Tribe’s economic development for over two decades, the building was not optimized for energy performance.
Since its closure, the building has remained largely unoccupied, creating an opportunity for adaptive reuse. Given its central location, large square footage, and existing structural integrity, the Tribe identified the building as an ideal candidate for conversion into a multi-use Government Center. However, its existing systems, including poor insulation, inefficient lighting, and outdated controls, result in high energy consumption and operating costs.
This GHG reduction measure aims to completely retrofit the building to meet LEED Platinum energy standards. In doing so, the Tribe will significantly cut emissions and utility expenses as well as create a resilient and accessible space for Tribal members. It will also be designated as an emergency warming and cooling shelter in response to extreme heat events, wildfires, and power outages.
The measure will incorporate best practices in sustainable building renovation and draw on innovative clean energy technologies, including:
• High-Efficiency Envelope Upgrades: Insulation, thermal windows, weatherization, and air sealing to dramatically reduce heating and cooling loads.
• High-Performance HVAC and Hot Water Systems: Replacement of current equipment with ENERGY STAR-certified electric heat pump systems.
• All-Electric Cooking and Appliances: Transition to electric ranges, convection ovens, and kitchen equipment to remove combustion-based energy sources.
• On-site Solar Power Generation: Rooftop solar PV designed to offset part of the building’s annual energy load.
• Smart Controls and Building Automation: Demand response energy management systems for real-time monitoring and optimization of energy use.
• Electric Vehicle (EV) Charging Infrastructure: Installation of Level 2 EV chargers to support Tribal staff and visitors utilizing electric transportation.

The implementation of this project will be integrated within the overall building design and carried out in five phases as outlined below:
This task involves conducting a detailed energy audit of the former casino facility to establish a performance baseline, identify opportunities for efficiency gains, and guide the development of a retrofit strategy. The audit will evaluate the building envelope, lighting, HVAC, water heating, plug loads, and current energy sources. It will also assess the structural capacity of the building to support rooftop solar panels. The task will incorporate stakeholder input, including intended uses of the new Government Center, anticipated occupancy levels, and programming needs. Based on the audit results, a full retrofit plan will be developed. This plan will define building performance targets, electrification requirements, energy efficiency specifications, renewable energy system sizing, and integration of smart building controls.
This task focuses on securing the necessary approvals, completing technical design work, and procuring contractors and equipment required for the project. It will begin with submissions to the Tule River Tribal Council and Tribal Historic Preservation Office to ensure cultural, environmental, and regulatory compliance. The engineering team will finalize architectural, structural, electrical, and mechanical plans based on the retrofit plan developed in Task 1. Simultaneously, interconnection applications will be submitted to Southern California Edison for the rooftop solar system, and all necessary building permits will be obtained. This task will also include the development of procurement packages for general contractors, and solar PV installers. A competitive bidding process will be used to select qualified firms, ensuring that proposals meet technical specifications and provide cost-effective, culturally respectful solutions. Preference will be given to firms with experience working with Tribal Nations and familiarity with prevailing wage and workforce development goals.
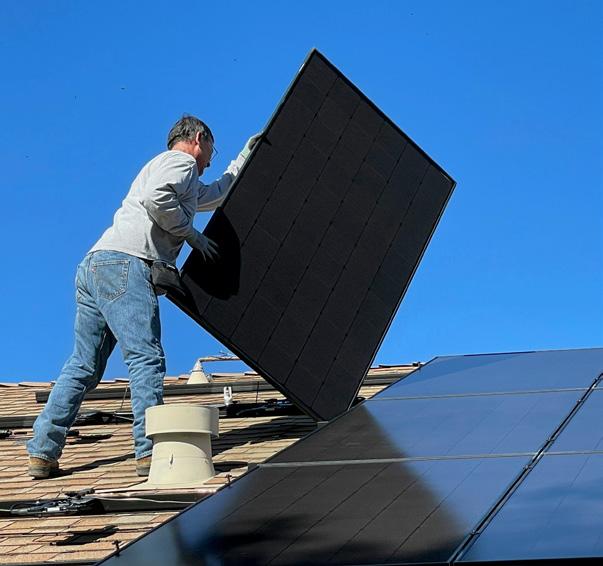
This task involves the physical renovation of the building’s envelope, systems, and interior to meet energy performance and programmatic goals. Construction activities will begin with envelope improvements, including insulation upgrades, window replacements, and air sealing to minimize thermal loss and improve indoor comfort. All propane-powered systems, such as furnaces, water heaters, and kitchen appliances, will be removed and replaced with high-efficiency electric alternatives, including heat pump HVAC systems and induction cooking equipment. Energyefficient lighting systems, occupancy sensors, and programmable thermostats will be installed to optimize energy use throughout the facility. Additionally, the building’s electrical infrastructure will be upgraded to accommodate expanded load capacity from electrification and renewable energy systems.
This task includes clean energy technologies installation to power the building and provide resilience during utility grid outages. A commercial-scale rooftop solar photovoltaic system will be installed. System commissioning will ensure all components operate as designed and interoperate with existing building systems.
This final task ensures the successful transition of the building into operational use and long-term sustainability. All new systems will be commissioned to ensure they perform according to design specifications, including HVAC, lighting, solar PV, and battery systems. Any deficiencies will be corrected before the facility is occupied. Staff from the Tribal Facilities Department will receive hands-on training and detailed operations manuals to ensure they can operate and maintain the building’s systems effectively. Public tours and educational events will be held during the launch to celebrate the building’s transformation and highlight its role as a leading initiative for sustainability and resilience.
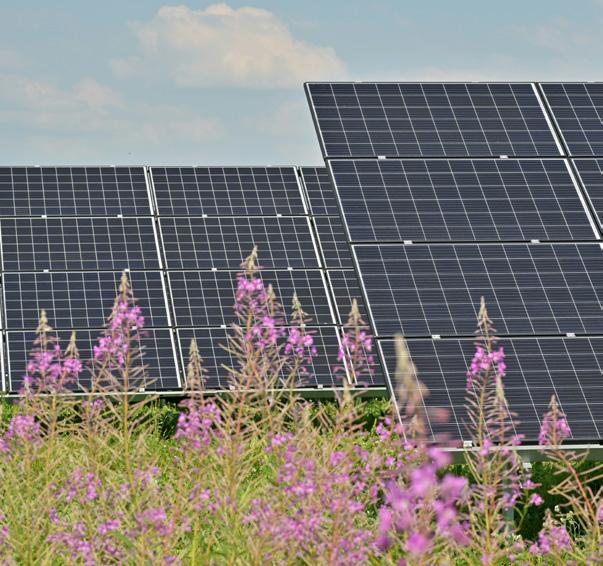
The primary implementation authority is the Tule River Indian Tribe Tribal Council, which holds authority over infrastructure development, environmental protection, and capital improvement projects under Article VI of the Tribe’s Constitution. Specific responsibilities are assigned as follows. If the specific departments mentioned are unavailable, a backup department will be identified, as designated by the Council.
Project implementation will be managed by the Planning and Community Development. The department will ensure project delivery is aligned with Tribal policies, energy and environmental goals, and community priorities.
• Engineering and Architecture Firm – Responsible for energy modeling, mechanical design, and permitting
• Tribal Facilities Department – Responsible for overseeing building upgrades, contractor coordination, and post-construction operations
• Tribal Historic Preservation Office: Review for potential cultural or archaeological impacts
• Tule River Tribal Council: Ensure alignment with land use regulations and building codes
• Southern California Edison: Coordination for solar interconnection, net metering, and battery integration
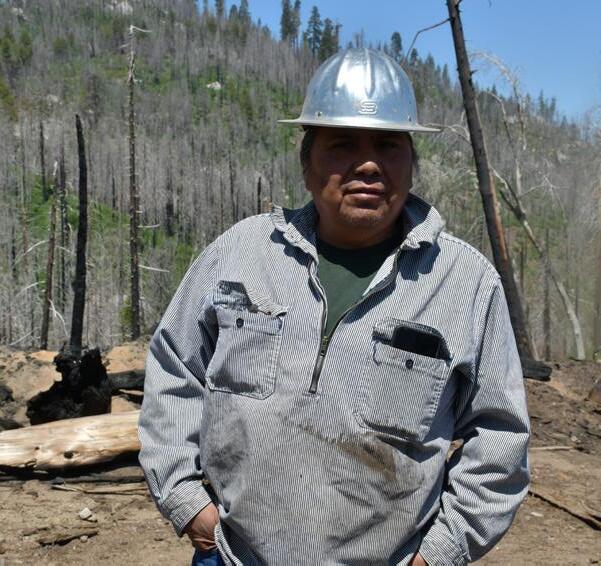
The table below outlines the key implementation tasks, associated timelines, and major milestones for the project, which began implementation in 2025 and is expected to last for 2 years. Each task represents a distinct phase in the building’s renovation and energy improvement process with specific milestones to track the measure progression.
16. Implementation Timeline and Milestones for Measure 3
Task 2: Permitting and Contractor Procurement
Task 3:
Task
Completion of energy audit, electrification plan, and energy efficiency design specifications
Finalization of building permits, contractor selection, and utility interconnection applications
Complete shell upgrades, insulation, HVAC replacement, LED conversion, and electrification
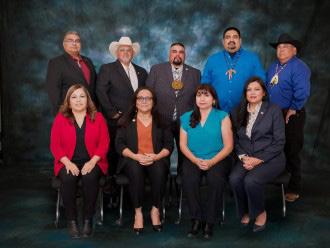
Launch of new community center, installation of energy monitoring system, staff training
Progress will be tracked through clear, measurable indicators tied to energy use, emissions reductions, and resilience capacity:
• Energy Use Intensity (EUI): Reduction in EUI (measured in kBtu/ sq-ft/year) from baseline to post-retrofit
• GHG Emissions Reduction: Annual decrease in building-related GHG emissions compared to baseline
• Renewable Generation Capacity: Installed solar PV system size (kW) and projected annual generation (kWh)
• Building Electrification Metrics: Number of fossil-fuel systems replaced and conversion of the building to 100% electric
• Operational Cost Savings: Estimated annual reduction in utility bills due to energy efficiency and renewable generation
• Community Engagement: Number of Tribal members participating in training, tours, or workshops related to the retrofit and clean energy transition
QUANTIFIED GHG EMISSION REDUCTIONS
The total estimated cost for energy efficiency and renewable energy components of the casino renovation is approximately $3.3 million. This includes deep energy retrofits, full building electrification, and installation of onsite solar PV to support the Tribe’s goals for sustainability and resilience. Further details on funding opportunities can be found in the Funding Roadmap section and Appendix D.
Task 1: Energy Audit & Retrofit Design
Task 2: Permitting, Engineering & Procurement
Task 3: Energy Efficiency and Electrification
Energy audit, solar feasibility, electrification and efficiency design, stakeholder input
Engineering for HVAC, envelope, solar + battery systems, electrification, energy code compliance, and procurement for energy-related contractors
Insulation, windows, air sealing, heat pump HVAC, electric water heaters, all-electric kitchen appliances, lighting upgrades, building controls, panel upgrades
$150,000
$180,000
Task 4: Solar PV
Rooftop solar (~120–150 kW), grid interconnection, controls integration, commissioning
Task 5: Commissioning, Training & Monitoring Commissioning of all energy systems, staff training, manuals, and installation of energy monitoring dashboard
$1,650,000
$1,200,000
$120,000
TOTAL ESTIMATED COST Energy efficiency + electrification + clean energy scope $3,300,000
Several federal and state programs offer financial support for Tribal Nations undertaking energy efficiency and renewable energy projects. The table below highlights key funding sources that can help the Tule River Indian Tribe implement energy retrofits, full building electrification, and clean energy systems as part of the casino renovation. These programs include competitive grants, direct pay tax credits, and technical assistance tailored specifically to tribal needs.
Tribal Energy Grant Program
U.S. DOE Office of Indian Energy
Inflation Reduction Act (IRA) –Direct Pay
Energy Efficiency and Conservation Block Grant (EECBG)
Indian Community Development Block Grant (ICDBG)
USDA Rural Development –Tribal Programs
State-Level Programs (e.g., CEC EPIC, SGIP)
U.S. Treasury / IRS
Competitive grants to support design and installation of energy efficiency and renewable systems on tribal lands
Allows tax-exempt entities (like tribes) to receive direct cash payments equivalent to tax credits
Up to $5M per project; eligible uses include building retrofits, solar PV, HVAC upgrades, energy storage, and smart controls
Covers up to 30–50% of eligible project costs for solar, batteries, EV chargers, HVAC, and energy efficiency upgrades
U.S. DOE Office of Indian Energy
U.S. HUD
U.S. Department of Agriculture
California Energy Commission and CPUC
Supports energy efficiency, renewable energy, and conservation in tribal and local governments
Supports community infrastructure and facilities, including energy-efficient renovations
Grants and loans for energy infrastructure improvements in rural tribal areas
Offers grants and rebates for clean energy, storage, and efficiency in Tribal communities
Formula + competitive grants, $50k–$1M; covers audits, retrofits, electrification, and planning
Up to $1M for Tribal public facility upgrades including HVAC, lighting, and building shell improvements
Covers solar, HVAC, and storage systems; grant/loan mix based on project scope and need
CEC EPIC and SGIP provide incentives for battery storage, solar PV, and load management tools; levels vary by project type and location
DESCRIPTION
The Tule River Indian Tribe owns and operates a number of government buildings that are essential to the day-to-day life and governance of the community. These include facilities such as the Tribal Administration Building, Public Works Department, and Education Center, among others. Most of these facilities are located along Reservation Road within the original Reservation boundary near Porterville, California. Several of them were built before energy efficiency was a design priority, and still rely on outdated lighting, HVAC systems, and insulation standards. There are approximately 20 buildings that are candidates for energy efficiency retrofits.
This measure proposes a coordinated effort to assess and upgrade these key government buildings to reduce energy waste, lower operating costs, and improve overall performance. The first step will be to conduct comprehensive energy audits. From there, the Tribe can prioritize retrofits based on factors like building use, occupancy, and potential energy savings.
Upgrades may include replacing fluorescent and incandescent lighting with high-efficiency LED systems, installing modern HVAC units that use less electricity and provide better indoor air quality, sealing air leaks around doors, windows, and ductwork to improve insulation and reduce heating and cooling loss, adding or upgrading roof and wall insulation, and installing smart thermostats and building controls to enhance system performance and enable real-time monitoring.
The work will be carried out in phases, starting with buildings that are used most frequently, equipment that is approaching the end of life, or equipment that has the highest energy intensity. Rolling upgrades out in stages will allow for distributing funding needs over time, minimizing operational disruptions, and securing funding incrementally. Energy efficiency retrofits will aim to reduce energy bills and enhance the long-term sustainability of the Tribe’s infrastructure. As building performance improves, Tribal staff and community members who use these facilities daily will benefit from more comfortable and reliable spaces.
This measure will include the following steps to implement:
This task involves performing on-site energy audits of all major government facilities operated by the Tule River Tribe. The audits will assess current energy use, conduct building equipment inventory, inspect building systems, and identify opportunities for energy savings. Once the audits are complete, the findings will be used to develop a prioritized list of buildings for retrofitting, based on potential impact, cost-effectiveness, and operational importance. The result will be a clear roadmap outlining where to begin and how to phase the upgrades.
Following the audits, this task focuses on the technical design of retrofits tailored to each building. Engineering teams will prepare detailed retrofit plans, ensuring all proposed upgrades meet current building and energy codes. These designs will account for the unique needs of each facility and identify efficient ways to group or bundle work. At this stage, coordination with tribal staff will ensure that all design elements are aligned with operational needs and minimize disruptions during implementation.
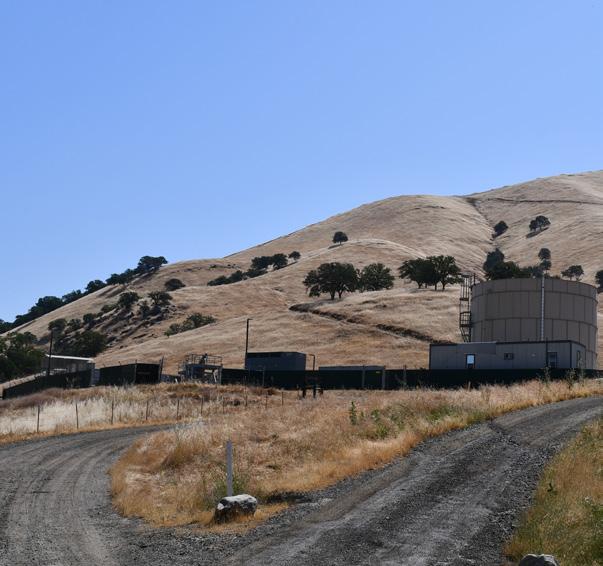
The project targets to improve the water systems and provide sewer connections to more homes on a growing Tribal community on Black Mountain. The project is a grant from Health Service (IHS). The project started on April 1- 2025 trenching and laying the main has covered about 4000ft out of total 5000 ft to Shane Christie property using Tribal, Labor The project will be ready in about 4 months
Once designs are finalized, the Tribe will initiate a formal procurement process. Requests for Proposals will be developed and issued to qualified contractors and equipment suppliers. Bids will be reviewed based on experience, cost, technical quality, and preference for local or tribal labor participation.
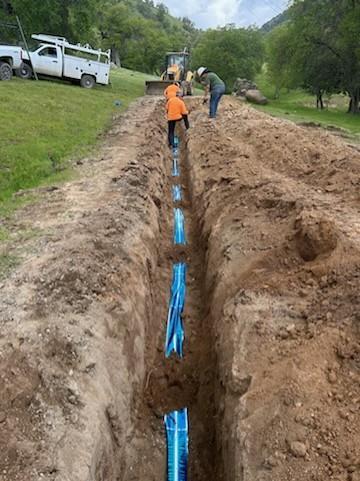
This task involves carrying out the physical installation of energy efficiency upgrades in the Tribe’s priority government buildings. Implementation will occur in multiple phases, with the sequencing determined by factors such as funding availability, building prioritization, the type of equipment being replaced, and logistical considerations. The overall timeline for installation will also be guided by these variables. Each phase will be carefully managed to ensure that all work meets the quality standards and design specifications established in earlier stages. To maintain accountability and ensure successful outcomes, regular coordination with facility staff and on-site inspections will be conducted throughout the installation process. These steps will help confirm that all systems are properly installed, fully operational, and delivering the expected performance improvements.
Once retrofits are complete, systems will undergo commissioning to verify performance and ensure they operate efficiently. Any deficiencies will be addressed and adjustments made as necessary. In parallel, the Tribe will provide hands-on training to its facilities and maintenance staff to ensure they are equipped to manage, monitor, and maintain the new systems over time. At this stage, energy efficiency improvements can be evaluated and compared to preretrofit baselines to quantify energy savings and cost reductions.
Black mountain Water extension project for 12 Tribal community homes using the Labourforce
Page 1 of 2
The Tule River Indian Tribe maintains full authority over the implementation of this energy efficiency measure, with oversight provided by the Tribal Council. The Planning and Community Development Department, Department of Public Works, and other stakeholders will be involved in the measure implementation, including project coordination, technical oversight, and compliance. If the specified departments are unavailable, an alternate department will be identified by the Council.
The Facilities and Maintenance Division will provide essential support during the assessment and installation phases, including access to building infrastructure, scheduling, and follow-up maintenance. The Tribe will engage qualified external contractors through a competitive bidding process for the design and installation of energy efficiency upgrades. These contractors will work under the direct supervision of Tribal leadership and will not have independent authority to make decisions outside the scope of their contract.
All retrofits will comply with applicable building codes and safety standards. Any additional permits or reviews will be conducted in accordance with the Tribe’s internal policies and applicable federal or state regulations, when necessary.
The project targets to improve the water homes on a growing Tribal community Health Service (IHS). The project started has covered about 4000ft out of total 5000 The project will be ready in about 4 months
Implementation of this measure is projected to begin in 2025, with an estimated duration of approximately 15 years, depending on the types of efficiency upgrades, funding availability, and building access. The timeline below outlines major tasks and key milestones.
Table 20. Implementation Timeline and Milestones for Measure 4
Task 1: Conduct Energy Audits and Prioritization
Task 2:
Task 3: Procurement and Contractor Selection
Task 4: Installation and Implementation
Task 5: System Commissioning and Staff Training Ongoing starting with the first installation
Complete system testing and staff training; verify performance
The success of the energy efficiency retrofit measure will be evaluated using a combination of quantitative and qualitative metrics, which will help track progress, measure impact, and inform future projects:
• Energy Use Reduction: Comparison of energy consumption before and after retrofits, tracked through utility billing and energy consumption
• Cost Savings: Analysis of changes in monthly and annual energy costs for each upgraded building.
• GHG Emissions Reduction: Calculation of CO2e reductions using standard EPA conversion factors based on reduced energy use
• Project Completion Metrics: Number of buildings retrofitted, total square footage improved, and types of systems upgraded
• Occupant Feedback: Survey responses from building users to assess improvements in comfort, lighting quality, and indoor air quality post-retrofit
Table 21. Quantified Emission Reductions from Measure 4
The total estimated cost to implement energy efficiency retrofits across 20 Tribal government buildings is approximately $3.1 million. This includes comprehensive energy audits, tailored retrofit designs, equipment procurement, phased installation of efficiency measures such as HVAC upgrades and LED lighting, and staff training to ensure long-term system performance.
There are several strong funding opportunities specifically targeted at Tribal energy efficiency retrofit projects like the one proposed here. These include federal grants, tax credit programs, and technical assistance designed to support Tribal government buildings. More information on funding opportunities is provided in the Funding Roadmap section and Appendix D.
mountain Water extension project for 12 Tribal community homes using the Labourforce
Page 1 of 2
PROGRAM ADMINISTERING AGENCY PURPOSE / DESCRIPTION
DOE Office of Indian Energy – Energy Infrastructure Deployment Grants
Inflation Reduction Act (IRA) – Direct Pay Tax Credits (e.g., Section 179D)
Energy Efficiency and Conservation Block Grant (EECBG)
Indian Community Development Block Grant (ICDBG)
BIA Tribal Climate Resilience Program
USDA Rural Energy for America Program (REAP) –Tribal Track
California Energy Commission (CEC) –Tribal and Local Government Programs
Utility Rebates and Incentives (e.g., Southern California Edison)
DOE START Program – Technical Assistance
U.S. DOE
U.S. Treasury / IRS
Competitive grants to fund energy efficiency and building retrofit projects on tribal lands
Allows tribes to receive cash payments equivalent to energy efficiency tax credits
U.S. DOE
U.S. HUD
Bureau of Indian Affairs (BIA)
U.S. Department of Agriculture (USDA)
Supports efficiency and conservation projects in public buildings
Funds Tribal community facility improvements, including energy retrofits
Supports Tribal resilience and energy adaptation efforts
Offers grants and loans for energy efficiency improvements in rural Tribal buildings
CEC (State of California)
Local Utilities
U.S. DOE Office of Indian Energy
Funds planning and implementation of building decarbonization and efficiency in Tribal communities
Rebates for installing high-efficiency equipment and energy management systems
Provides free support with energy audits, engineering reviews, and funding applications
Up to $5M per project; covers HVAC upgrades, lighting, insulation, design, and construction
Covers 30–50% of project costs for HVAC, envelope upgrades, lighting, and controls
Formula and competitive grants; eligible for lighting, HVAC, and envelope retrofits
Up to $1M for public-serving facility upgrades such as HVAC and weatherization
Covers energy audits, retrofit planning, staff training, and building upgrades
Covers building retrofits; grant/ loan mix based on community status and project type
Grant levels vary; eligible uses include energy audits, HVAC, insulation, and demand controls
Incentives for lighting, HVAC, smart controls, and wholebuilding performance upgrades
Non-financial assistance but critical for early-stage planning and grant-readiness
General Projects at Public Works
Public Works Department (PWD) services include the following: Road Maintenance, Asphalt Paving, Installation and Cleaning of Culverts, Rock Removal, Erosion Control, Traffic Control, Installation of Road Signs, Land leveling, Dust Control, House Pads, Removal/Burial of dead animals, Driveway Rock and Gravel, Storm Repairs, Septic Tank and Leach field repairs, Water Line installation and repairs and Fire Breaks in the upper timber country. Tribal members need fill in a Work Request at Public Works offices located 487 South Reservation Road , Porterville 93257 to get services.
In addition, the following programs will be useful:
• DOE Technical Assistance (START Program) – Free support with audits, design reviews, and funding applications.
• Utility Rebates and Incentives – Southern California Edison may offer incentives for HVAC replacement, lighting retrofits, and energy management systems.
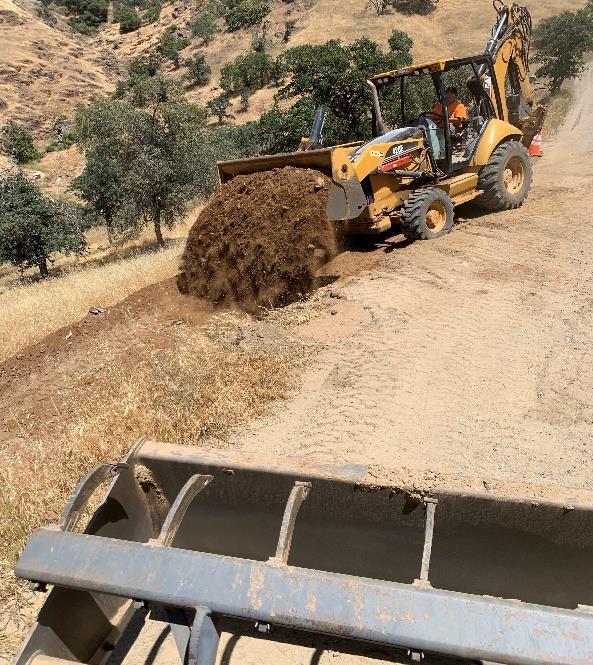
Roadworks on Chimney Road with addition of new Culverts
Public Works Department Water system
PWD operates and maintains 2 separate water systems: The Main Water System; Tule River Main: PWSID 090600156 and Apple Valley Water system; Tule River Apple Valley: (PWSID 090605074). Both systems contain miles of underground piping, water wells, pumps, ta nks service connections. The three systems service the Community, Administrative offices, Judicial Building, the Health Clinic, the School and Day Care. The daily demand is 200, 000 gallons per day
MEASURE 5.
Ensure All Water Distribution Meters Are SCADA-integrated, and Install SCADA Meters On Wastewater Treatment Infrastructure
DESCRIPTION
The Tule River Indian Tribe’s water and wastewater systems are currently under strain due to increasing community demand, limited monitoring capabilities, and capacity challenges within the distribution network. Some homes experience seasonal water shortages, particularly during the early summer months, when demand peaks and supply cannot keep pace. These shortages, which can last from a day to a week, are becoming more common as more Tribal members return to the Reservation and move into new housing. Additionally, limited system-wide visibility makes it difficult to manage water resources efficiently and respond quickly to changing conditions.
The existing water storage system consists of tanks ranging from 3,000 to 200,000 gallons, but they are not coordinated or automated. The Tribe currently relies on manual visual inspections to monitor tank levels and infrastructure status—an inefficient and reactive approach that limits the Tribe’s ability to manage supply, prevent outages, and optimize energy use.
Roadworks on Chimney Road
Public Works Department Water PWD operates and maintains 2 PWSID 090600156 and Apple 090605074). Both systems contain service connections. The three Judicial Building, the Health Clinic, gallons per day
High-efficiency electric pumps and a comprehensive SCADA (Supervisory Control and Data Acquisition) system would address these gaps by automating real-time monitoring, energy metering, and system control across the water and wastewater infrastructure. SCADA metering would provide visibility into flow rates, pressure levels, tank volumes, pump performance, and energy usage. This would significantly reduce electricity use through smarter pump scheduling and load management, detect and prevent system leaks, and ensure better distribution system performance during peak demand.
This measure is closely aligned with ongoing infrastructure improvements led by the Indian Health Service (IHS), including pipe and tank replacements and the installation of residential water meters. The Tribe has already installed smart meters using AMI technology and Neptune 360 meters, in 252 locations, covering most of their potable water infrastructure. However, several critical components directly tied to emissions and energy efficiency, such as new pump installations, electrical metering, and SCADA integration, fall outside IHS’s scope. To fill these gaps, a partnership with EPA and other federal agencies is recommended to ensure the system operates efficiently and holistically.
In addition to potable water, wastewater infrastructure also lacks adequate monitoring and energy tracking. The Tribe is currently planning to install two wastewater distribution lines spanning 10 miles, incorporating 20 electric pumps. Without smart metering and pump upgrades, these systems will not function at optimal performance levels. Moreover, the Tribe lacks the ability to track graywater usage and cannot verify whether agricultural users are using graywater or potable water in designated systems. Integrating SCADA across both water and wastewater systems will enable monitoring of lift stations, storage tanks, agricultural systems, and energy consumption—all essential to managing the Tribe’s future energy, water, and climate goals.
Ultimately, transitioning to smart meters will reduce electricity consumption and GHG emissions associated with water pumping and treatment. It will also improve system reliability, responsiveness, and long-term resilience to climate-related stressors. With real-time monitoring and control, the Tribe will be able to proactively manage its water resources and optimize energy use across the system. Additionally, this measure will integrate with ongoing and planned infrastructure upgrades and deliver peak efficiency and maximum benefit to the community. The implementation steps include:
Conduct an assessment of the existing wastewater treatment systems, including pump stations, storage tanks, lift stations, and treatment facilities. This task will include compiling a full inventory of system components, mapping current monitoring practices, and system integration.
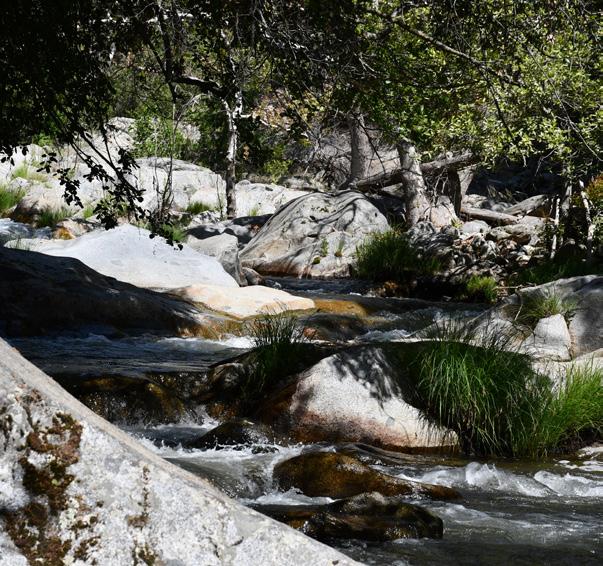
Develop a technical plan for SCADA integration across the water and wastewater systems. This includes specifying hardware and software needs, communication protocols, remote access features, cybersecurity protections, and compatibility with planned IHS infrastructure upgrades.
Procure SCADA-compatible equipment, including smart meters, sensors, programmable logic controllers, and data transmission systems. Install and commission equipment at identified locations, including unfinished portions of the potable water system and all of the wastewater system. This will include configuring SCADA workstations, integrating energy meters at key pump stations, and conducting system calibration.
Replace or retrofit existing pumps with high-efficiency models based on the findings of recent studies and system performance data. Where applicable, install variable frequency drives and integrate pumps into the SCADA platform to allow for optimized control based on demand, tank levels, and flow conditions.
Train Public Works and Environmental Department staff on SCADA operations, troubleshooting, data interpretation, and emergency response. Develop new standard operating procedures for pump scheduling, leak detection, alarm response, and system reporting. Training will also focus on using real-time data to reduce energy use and water loss.
Design and install monitoring systems to track graywater usage in agricultural applications. This task will focus on differentiating between graywater and potable water usage and integrating the data into the centralized SCADA dashboard. Results will inform future conservation and water reuse planning.
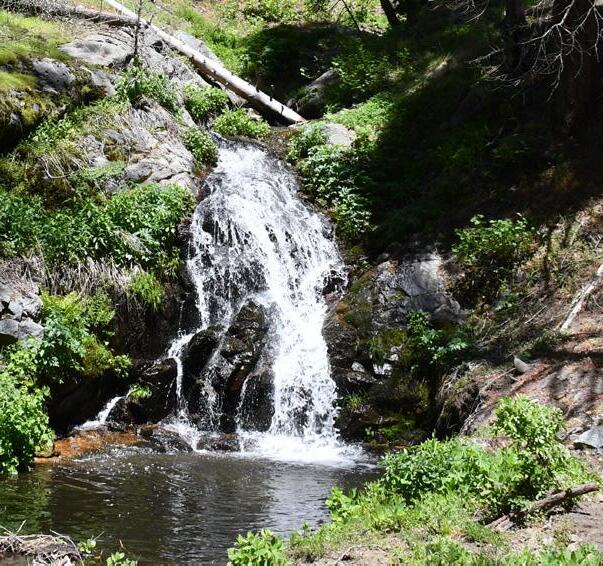
Establish data analysis protocols to monitor system performance, identify inefficiencies, and track electricity consumption and GHG emissions. Use this data to generate regular performance reports for Tribal leadership and to inform future expansions of the SCADA system, including additional tank sites, distribution lines, or agricultural systems.
The Tule River Indian Tribe’s Public Works Department will serve as the lead implementing authority for the SCADA integration and related infrastructure upgrades, with direct oversight from the Environmental Department to ensure alignment with climate, energy, and water conservation goals. The Tribal Council will provide executive oversight and final approval for key procurement and budget decisions. The Tribe will coordinate closely with the Indian Health Service (IHS) to ensure compatibility with ongoing water infrastructure improvements, particularly in areas involving pipe replacements, tank installations, and residential metering.
Specific responsibilities are assigned as follows. If the specific departments mentioned are unavailable, a backup department will be identified, as designated by the Council.
• Public Works Department: Project management, vendor coordination, equipment installation, SCADA performance monitoring, and staff training
• Environmental Department: Emissions tracking and reporting
• Third party: SCADA software support, cybersecurity, and data management

Table 24. Implementation Timeline and Milestones for Measure 5 TASK TIMELINE MILESTONES
Task 1: System Assessment and Infrastructure Inventory 2-3 months
Task 2: SCADA System Design and Integration Plan 3-4 months
Task 3: Equipment Procurement and Installation 9-24 months
Task 4: Pump Upgrades and Efficiency Improvements 4-7 months
Task 5: Operations Training and SOP Development 1-2 months
Task 6: Graywater and Agricultural Monitoring Integration 3-5 months
Task 7: Data Analytics, Reporting, and Expansion Planning Ongoing after measure implementation
Complete full inventory of water and wastewater infrastructure, assess current monitoring capabilities, and map integration needs
Finalize technical specifications for SCADA components, develop integration plan, and assess compatibility with IHS upgrades
Procure smart meters, sensors, and controllers; install and commission equipment at key system locations
Replace or retrofit priority pumps with high-efficiency models and integrate with SCADA for optimized control
Train staff on SCADA operations, develop SOPs for energy efficiency, leak detection, and emergency response
Install monitoring systems for graywater tracking in agricultural zones and integrate data into SCADA dashboard
Launch data analysis protocols, generate performance reports, and identify future SCADA expansion opportunities
Progress on this measure will be tracked using a set of defined metrics to ensure transparency and measurability throughout project implementation:
• AMI Coverage: Percentage of water and wastewater system components (tanks, pumps, lift stations) integrated with SCADA monitoring
• Pump Efficiency: Reduction in electricity consumption (kWh) at pump stations following efficiency upgrades
• Leak Detection: Number of leaks detected and resolved through SCADA alerts
• Training Completion: Number of Tribal staff trained and proficient in SCADA operations and data interpretation
• GHG Emissions Reduction: Estimated metric tons of CO₂e avoided through energy savings and system optimization
• System Reliability: Decrease in seasonal water shortages and unplanned outages
• Community Impact: Number of residents directly benefiting from improved service reliability and resource efficiency
Table 25. Quantified Emission Reductions from Measure 5
Ensure All Water Distribution Meters Are SCADAintegrated, And Install SCADA meters On Wastewater Treatment Infrastructure
The total estimated cost to complete the water AMI system and implement SCADA-based monitoring and control across the Tribe’s wastewater infrastructure is approximately $1.02 million. This includes essential upgrades to pumps, installation of smart monitoring equipment, integration with existing systems, and staff training to support efficient, resilient water and wastewater operations.
Table 26. Estimated Costs For Water & Wastewater SCADA and AMI Completion
Several federal and state programs offer strong funding opportunities to support the Tule River Indian Tribe’s efforts to complete its AMI system and implement SCADA technology across its water and wastewater infrastructure. These programs, administered by agencies such as the EPA, DOE, USDA, and BIA, are designed specifically to help Tribal Nations improve utility efficiency, reduce energy use, and increase resilience. Grant and loan opportunities can fund activities such as installing smart meters, upgrading pumps, integrating SCADA monitoring, and training staff. Additionally, California-based programs offer targeted support for small and disadvantaged communities, further enhancing the Tribe’s ability to secure resources for this project. By strategically combining these funding sources, the Tribe can modernize its infrastructure while aligning with federal energy and water conservation priorities. For more details on funding opportunities, refer to the Funding Roadmap section and Appendix D.

PROGRAM
Clean Water Indian SetAside (CWISA)
Drinking Water
Infrastructure Grants –Tribal Set-Aside (DWIG-TSA)
Water Infrastructure Finance and Innovation Act (WIFIA)
EPA
EPA
EPA
BIA Water Management, Planning, and Pre-Development (WMPPD) BIA
BIA Water Sanitation Program BIA
BIA Tribal Priority Allocations (TPA) – Water Resources
Water Infrastructure Improvements for the Nation (WIIN) Act
USDA Rural Development – Tribal Water/Wastewater Programs
Small Community Drinking Water (SCDW) Program
CA State Water Board
Supports wastewater infrastructure improvements for tribes
Improves drinking water systems on tribal lands
Offers low-interest loans for water infrastructure
Supports planning, modeling, and monitoring of tribal water systems
Improves BIA-owned tribal water and wastewater facilities
Funds water staff and sustainability efforts
Provides water infrastructure funding for eligible tribes
Supports drinking water and wastewater projects in rural tribal communities
Funds drinking water projects for small, disadvantaged communities
Wastewater SCADA, pump upgrades, flow metering
AMI completion, water metering, tank SCADA integration
Larger SCADA projects, integration with distribution systems
System mapping, SCADA design, integration planning
Equipment, remote sensors, system automation
Long-term monitoring and staff training
SCADA and wastewater infrastructure modernization
SCADA hardware, AMI meters, wastewater monitoring
AMI upgrades, smart water distribution controls
The Tule River Indian Tribe currently manages solid waste through contracted collection services, with all waste deposited at a central community transfer station where it is later picked up. While some recycling is conducted at the site, primarily by part-time staff who sort through materials, there is currently no dedicated organics diversion or construction and demolition (C&D) recovery program in place. As a result, most waste generated from government buildings, Tribal housing, events, and C&D activities is landfilled without separation, contributing to methane emissions, environmental degradation, and rising hauling and disposal costs.
In addition to managing its own waste, the Tribe faces the significant challenge of illegal dumping by individuals from outside the reservation. Unauthorized waste disposal not only strains the Tribe’s limited landfill and waste management resources but also increases the environmental burden and inflates GHG emissions from the waste sector. These activities lead to additional cleanup costs and increased hauling and disposal fees.
The Tribe is already actively engaged in environmental education and outreach. Through the Department of Environmental Protection, community members are reached via newsletters, youth programs, social media, and educational events such as River and Roadside Cleanups, the Youth Environmental Campout, and Earth Day outreach. The Department also collaborates with the Tribal Youth Council’s recycling initiative and supports youth environmental education efforts upon request. At the solid waste transfer station, waste reduction is promoted through the recycling of glass, plastic, cardboard, newspaper, and office paper. The Department of Environmental Protection also educates the community on the proper disposal of hazardous waste and provides recycling amenities at community events, government offices, and public gatherings.

Reducing waste sent to landfills through enhanced diversion programs is a high-impact strategy to decrease GHG emissions, conserve natural resources, and support the Tribe’s long-term environmental goals. Methane, a potent greenhouse gas, is generated in landfills through the anaerobic decomposition of organic materials such as food scraps, yard trimmings, and untreated wood. Additionally, the extraction, manufacturing, and transport of raw materials for packaging and construction are carbon-intensive processes. Diverting recyclable and recoverable materials reduces emissions by decreasing the demand for raw resource extraction and energy use in manufacturing.
This measure will focus on implementing an integrated waste reduction strategy that includes the following steps:
Conduct an assessment of current waste sources and generation, collection, and sorting practices across Tribal facilities and housing. This includes quantifying volumes of landfilled waste, recyclables, organics, and C&D materials. Conduct a waste composition assessment by sorting waste into material categories and analyzing the data to determine the types and proportions of waste generated.
Update the Tribal waste management policy to include measures that prevent illegal dumping and address unauthorized disposal in areas not designated for waste disposal, including sensitive locations such as forests and other natural or culturally significant sites on the reservation. The updated policy should incorporate enforcement strategies such as clear signage, fines, monitoring, and community reporting systems. Additionally, the Tribe should consider partnering with external organizations to establish safe and accessible collection options for materials that cannot be disposed of in landfills, such as household hazardous waste, electronics, and bulky items.

Upgrade and expand recycling systems at the community transfer station site and across all government buildings and public facilities. This includes installing clearly labeled bins and improving waste disposal signs. Coordination with contracted waste haulers will be critical to ensure materials are appropriately handled and disposed of.
Develop and adopt a Tribal policy requiring the separation and recovery of C&D materials for all projects funded, permitted, or managed by the Tribe. The policy will include guidance on acceptable materials, contractor requirements, and compliance documentation. Templates and technical assistance will be provided to Tribal departments and project teams to ensure implementation.
Continue ongoing outreach efforts through expanded education on recycling, composting, and waste reduction. This includes updating materials for newsletters, social media, events, schools, and Tribal media, as well as developing workshops and signage for public spaces. Special focus will be placed on contamination prevention, youth engagement, and alignment with existing community programs such as the Youth Environmental Campout and Earth Day celebrations. Expand the ongoing community outreach efforts by integrating organics diversion education into existing recycling, composting, and waste reduction programs. This initiative will focus on raising awareness about the importance of composting organic waste, with a particular emphasis on schools (e.g., Towanits School) and Tribal offices. Educational materials, workshops, and events will introduce organics diversion as a sustainable practice, encouraging participation in composting and waste reduction. The Tribe will develop resources such as compost bin demonstrations, staff training, and collection logistics to ensure effective implementation. Special attention will be given to contamination prevention, youth engagement, and the integration of organics diversion into existing community programs like the Youth Environmental Campout and Earth Day celebrations.

Establish systems for tracking diversion rates, participation levels, and contamination rates across the different waste streams. This task includes setting up data collection protocols with the waste contractor, collecting feedback from the community, and using findings to refine and expand programs.
The Tule River Indian Tribe, under the leadership of the Tribal Council, holds the authority to implement this waste reduction measure. In accordance with Article VI, Section 1 of the Tule River Indian Tribe’s Constitution, the Council maintains the authority to negotiate service agreements, adopt waste-related regulations, and implement environmental programs aligned with the Tribe’s priorities. Multiple departments will oversee the measure implementation, coordination with waste haulers, community outreach facilitation, and monitoring compliance with diversion standards, including but not limited to the Department of Environmental Protection, Public Works, and others. They will work closely with the Tule River Indian Housing Authority, Department of Public Safety, Tribal School, and Facilities Maintenance teams to ensure smooth implementation across departments.
No additional authority is currently required; however, new policies or waste ordinances adopted under this measure will be reviewed and approved by the Tribal Council. Permitting coordination with federal or state agencies may be needed for large-scale composting infrastructure or construction project oversight.
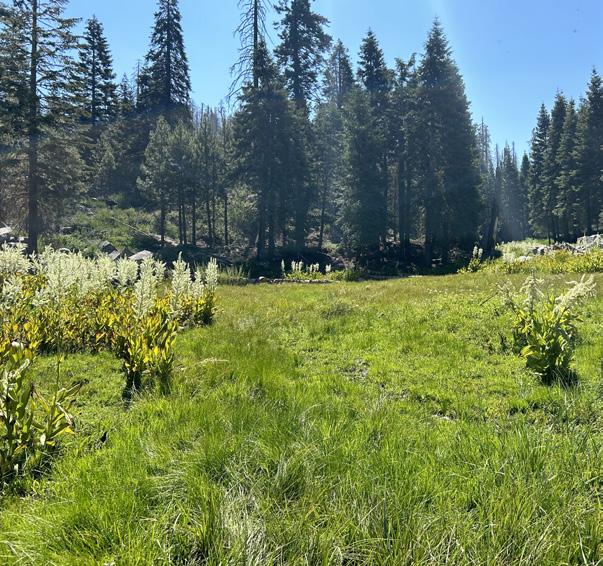
Table 28. Implementation Timeline and Milestones for Measure 6
TASK TIMELINE MILESTONES
Task 1: Solid Waste Assessment and Program Design
Task 2. Update Waste Management Policy and Establish Partnerships for Non-Disposable Waste Collection
Task 3: Recycling Infrastructure Improvements
Task 4: C&D Waste Diversion Standards
Task 5: Community Engagement and Education
Task 6: Monitoring, Evaluation, and Program Refinement
6-9 months
9-18 months
5-9 months
4-7 months
Continuous
Continuous after measure implementation
Complete waste audit and analysis of landfill, recycling, organics, and C&D waste streams. Develop draft program design for recycling, composting, and diversion improvements
Update waste management policy and establish partnerships for hazardous, electronic, and bulky waste collection
Install or upgrade recycling bins at landfill site and key Tribal facilities. Finalize signage and coordinate with hauler on material handling
Develop and adopt Tribal C&D diversion policy
Update outreach materials, host public workshops, support youth-led initiatives, and align with annual events
Establish a tracking system for waste diversion rates. Analyze pilot results, compile community feedback, and recommend program refinements
• Diversion Rate: Percentage of total waste diverted from landfill through recycling, composting, or reuse
• Waste Amount: Total waste amount sent to landfill per year compared to the baseline, due to minimizing waste contributions from outside the reservation, and waste diversion
• Recycling Infrastructure: Number of new recycling bins installed and maintained across Tribal properties and public spaces
• C&D Compliance: Number of Tribal projects meeting C&D diversion requirements
• Community Engagement: Number of outreach events held and participants reached through education efforts
• GHG Emissions Reduction: Estimated metric tons of CO2e reduced through landfill avoidance and material recovery
The total estimated cost to implement the Tule River Indian Tribe’s waste diversion and landfill reduction strategy is approximately $275,000, based on a streamlined, phased approach across six key tasks. These costs cover planning, policy development, recycling infrastructure, education, and program monitoring. It’s important to note that these are high-level planning estimates intended to inform budgeting and funding applications; actual costs may vary depending on final program design, vendor pricing, and available in-kind Tribal resources. Where possible, costs may be offset through federal and state grant programs, technical assistance, or local partnerships.
Multiple federal and state funding programs are available to support the Tule River Indian Tribe’s efforts to reduce landfill waste and expand recycling and diversion infrastructure. These programs, administered by agencies such as the EPA, HUD, USDA, and CalRecycle, offer grants for planning, education, equipment, infrastructure upgrades, and illegal dumping prevention. While some funding sources are highly competitive, others include dedicated Tribal set-asides or recurring opportunities. The table below highlights key programs aligned with the Tribe’s goals, but additional eligibility requirements, deadlines, and match conditions may apply and should be reviewed carefully during proposal development. More Information on available funding opportunities can be found in both the Funding Roadmap section and Appendix D.
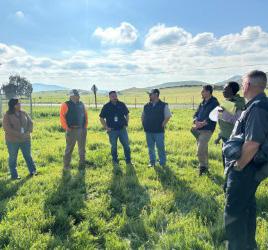
PROGRAM
EPA Tribal Solid Waste Grant Program (TSWGP)
EPA Environmental Education Grants – Tribal Track
EPA Recycling Education and Outreach Grant Program
AGENCY PURPOSE FUNDING USE
Indian Community Development Block Grant (ICDBG)
EPA
Solid Waste Infrastructure for Recycling (SWIFR) – Tribal SetAside
EPA
EPA (Inflation Reduction Act funding)
U.S. Department of Housing and Urban Development (HUD)
Supports development of integrated solid waste management plans and diversion strategies for Tribal communities
Supports environmental education and outreach activities
Funds recycling education, signage, and contamination reduction campaigns
Can support facility upgrades and community services, including waste management improvements
Planning, waste audits, recycling programs, illegal dumping prevention; up to $100,000+ per grant cycle
Educational materials, youth engagement, workshops, signage; typically $50,000–$100,000
Tribal applicants eligible; grants up to $2M for largescale outreach and education
Recycling bins, signage, transfer station upgrades; grants up to $1M
California CalRecycle Grants – Local Conservation Corps or Beverage Container Recycling Program (if applicable)
EPA / IRA
BIA Tribal Climate Resilience Program
CalRecycle
Provides capital grants to improve post-consumer materials management infrastructure
Supports beverage container recycling, illegal dumping abatement, and community education
BIA
Funds planning and implementation of climate mitigation, including waste diversion
Bins, carts, sorting equipment, signage, transfer station improvements; grants typically $500,000–$4M
Equipment, staff, and outreach for tribal governments; grant levels vary
Waste audits, methane reduction from landfill avoidance, composting planning
USDA Rural Utilities Service –Solid Waste Management Grants
U.S. Department of Agriculture
Technical assistance and training to improve solid waste facilities and systems in rural communities
Planning, equipment training, and program design; grants generally $50,000–$150,000
DESCRIPTION
Emissions from land use are a significant source of GHG emissions within the Reservation boundary. These emissions result from ecosystem changes driven by both natural and human-caused factors, including forest degradation, catastrophic wildfire events, insect infestations, and other disturbances. In particular, emissions from forest change are substantial, producing an average of approximately 150,000 MTCO₂e per year (see Appendix C for methodology and data sources). Given the magnitude of these emissions, land use management presents a critical opportunity for climate action. Strategic forest management, fire prevention, and ecosystem restoration can not only reduce GHG emissions but also enhance climate resilience, biodiversity, and cultural values tied to the land.
The Tribe has undertaken a series of coordinated efforts to mitigate wildfire risk, restore forest ecosystems, and protect cultural resources in response to recent catastrophic wildfires, including the Pier Fire and the Windy Fire. These initiatives are supported by a combination of federal, state, and collaborative funding sources and are guided by environmental planning and co-stewardship principles.

The following tables summarize key projects related to these efforts:
PROJECT COMPONENT
Parker Peak Forest Restoration and Resilience Project
America’s Ecosystem Restoration Initiative (AERI) Funding
Co-Stewardship with U.S. Forest Service
Giant Sequoia Lands Coalition Participation
Environmental Assessment for Emergency Stabilization
DESCRIPTION
$1.7 million grant from Sierra Nevada Conservancy to treat 1,500 acres affected by the Windy Fire. Includes hazardous fuel reduction, wildfire restoration, and stabilization of burn scars to improve forest health and hydrologic function.
Restoration of Parker Peak Giant Sequoia Grove and tribal lands impacted by the Windy Fire, with an emphasis on ecological restoration and cultural preservation using AERI funding.
Collaboration under the Tribal Forest Protection Act for fire recovery and ecological restoration in the Sequoia National Forest, including hazardous fuels removal and meadow restoration near the reservation.
Active tribal participation in the Coalition to support restoration in giant sequoia groves and implementation of cultural burning to boost wildfire resilience.
Assessment of environmental effects related to post-Windy Fire recovery efforts, such as reforestation and commercial timber salvage, addressing land management and public safety.
PROJECT COMPONENT
Tule River Tribe Fuels Reduction Project
Supplemental Environmental Assessment
Hazard Mitigation Plan Update
DESCRIPTION
Wildfire mitigation project proposed by the Tule River Tribe under FEMA’s Hazard Mitigation Grant Program. Targets over 2,392 acres on the reservation and includes hazardous fuels reduction, erosion control, and post-fire mitigation in areas affected by the Pier Fire and adjacent high-risk zones.
Evaluates potential environmental impacts of proposed activities such as hazardous fuel removal, erosion control measures, and infrastructure repairs related to the fuels reduction and post-fire mitigation project.
Updates to the Tribe’s Hazard Mitigation Plan to address climate-related hazards like wildfires (e.g., Pier Fire), enhancing preparedness and response strategies.
Reducing land use emissions on the Reservation will require a combination of proactive forest management and ecological stewardship. Strategies include prescribed burning and cultural fire practices to reduce fuel loads and prevent catastrophic wildfires; forest thinning and replanting to restore ecosystem balance; and monitoring for invasive species and insect outbreaks. Land use strategies also support climate adaptation goals by improving watershed health, reducing erosion risk, and enhancing carbon sequestration. In addition, partnerships with regional, state, and federal agencies can unlock funding and technical support to implement these strategies at scale.
Expanded Prescribed Burning
Forest Thinning
Reforestation with Climate-Adapted Species
Soil Carbon Enhancement Projects
Increase use of low-intensity fires during safe weather windows to reduce fuel loads and wildfire risk.
Mechanical or manual thinning of overly dense forests to reduce fire risk and increase ecosystem resilience.
Planting diverse, native, and drought-resilient species to accelerate forest regeneration and carbon uptake.
Apply compost or biochar in degraded lands to improve soil health and sequester carbon.
Buffer Restoration Reestablishing vegetation along streambanks to stabilize soils, filter runoff, and store carbon.
Invasive Species Management Removal of carbon-disruptive invasive plants and pests to maintain forest health and function.
Break Installation Construct and maintain defensible zones to reduce wildfire spread near vulnerable infrastructure.
$1,000–$2,500/acre (site dependent)
annually
foot Community Fire Stewardship Program
Support tribal workforce to lead fuel management, monitoring, and public education efforts.
NOTES:
• Cost ranges depend heavily on site conditions, labor intensity, and whether mechanized or manual methods are used.
• You can add an “Estimated GHG Reduction Potential (MTCO₂e)” column if you have modeled impacts or even rough estimates.
• If a strategy is already underway (e.g. baseline prescribed burning), these should focus on scaling up or applying the approach in new contexts or intensities.
Transportation is a recognized source of GHG emissions in Tule River, but several local challenges currently limit the ability of including targeted transportation measures in this CCAP. While transportationrelated emissions have been estimated through a head of household survey and employee commuting survey, the Tribe faces significant barriers to reducing these emissions in an equitable and effective way. As a result, this CCAP focuses on sectors where Tule River has greater control and clearer opportunities for impact, such as building energy use and renewable energy development.
The Tule River Reservation is a rural community with an estimated population of 1,611 residents at the time the CCAP data was collected. These residents live in dispersed households across mountainous terrain, with approximately 413 homes throughout the area. The reservation has only one paved access road, and the majority of residences are connected to this main road by unpaved, gravel, or dirt roads. This low-density layout makes community-wide transit systems, such as buses or shuttles, difficult to route efficiently and unlikely to attract sufficient ridership. Most residents depend on personal vehicles for essential travel, including access to employment, healthcare, and services outside the Reservation.
While residents may not be opposed to the idea of transitioning to low-emission vehicles, the realities of the local terrain and road conditions must be seriously considered. Weather conditions have a significant impact on road accessibility. Heavy rainfall creates muddy and unstable driving conditions, rendering some unpaved roads temporarily impassable. Prolonged rain can lead to severe erosion, deep ruts, and a washboard effect on dirt and gravel roads—issues that not only increase wear and tear on vehicles but also pose safety risks. Seasonal snowfall further restricts travel especially to homes in higher elevations. These persistent challenges make the adoption and long-term use of low-emission vehicles difficult for many households, regardless of interest or intent, due to the limitations of current road infrastructure within the Reservation.

Economic constraints also limit the feasibility of low-emissions vehicle adoption. As a low-income community, many residents cannot afford to purchase electric vehicles, even with available incentives. Frequent power outages across the Reservation further complicate EV use, given the need for reliable charging infrastructure and concerns about transportation access during emergencies.
Regarding the government vehicle fleet, electrification also faces challenges. The Tribe is currently in the planning phase for an EV charging station at the renovated casino within the reservation boundary. Many government vehicles have been purchased within the past 10 years, and currently, none are electric. This is primarily due to the specific use cases of the fleet: the vehicles must be durable, easy to maintain, and capable of traveling long distances through mountainous terrain.
Finally, there is limited access to detailed local data such as vehicle miles traveled or fuel type, which constrains the Tribe’s ability to design and evaluate targeted reduction measures.
Potential future transportation strategies have been listed in the Table 36 below.

Table 36. Potential Transportation Emission Reduction Strategies
STRATEGY DESCRIPTION
Government Vehicle Inventory
All vehicles owned by the Tribe would have quarterly fuel purchases recorded by fuel type and mileage per vehicle reported.
ESTIMATED COST
Initial Setup: $2,000–$5,000 (staff time or consultant to design tracking system)
Ongoing Cost: ~$1,000–$3,000/year (staff time or minor software subscription)
Notes: Could be done in-house with Excel or simple fleet management software.
Government Vehicle Cost Benefit Analysis
Government Vehicle Replacement Policy
A cost-benefit analysis of the fleet could help identify which vehicles would be most costeffective to replace with electric models. Despite higher upfront costs, electric vehicles often yield long-term savings compared to gasoline alternatives, typically becoming more economical after several years of use.
When vehicles are being replaced, a feasibility study for electrification of the replacement vehicle. Information such as cost-benefit analysis of fuel vs electricity, capital investment, and vehicle capabilities should be taken into account when purchasing a vehicle. Hybrid or PEV should be considered before purchasing an ICE vehicle.
One-Time Analysis: $5,000–$15,000 (consultant or staff with technical expertise)
Notes: Higher cost if done by a third-party analyst or includes detailed modeling; lower cost if internal staff with fleet management experience does it.
Policy Development: $2,000–$5,000 (internal staff time or consultant help)
Per-Vehicle Study: $500–$2,000/vehicle (when replacement is due)
Notes: Cost per vehicle will depend on how in-depth each feasibility analysis is.
Community VMT Study
Community Electric Vehicle Promotion
The CCAP had limited capability to understand the full VMT of the Tribe, and improvements to future GHG inventories can be made. A complete traffic study should be conducted to understand the number of vehicles and mileage of those entering and exiting the reservation, as the CCAP focused on reservation residents.
As incentives from the State of California and the U.S. federal government continue to expand, the Tribe government could evaluate which programs may benefit the reservation and promote those that are most feasible and useful to residents.
Traffic Study: $25,000–$75,000 (includes consultant fees, vehicle counters, possibly license plate or survey data collection)
Notes: This is the most expensive item; partnering with regional transportation agencies or universities may lower cost.
Program Evaluation & Outreach Plan:
$3,000–$10,000
Ongoing Outreach/Promotion: $2,000–$5,000/year
Notes: Lower end if done through simple flyers and website updates; higher end if community meetings, translations, and technical assistance are included.
The benefits analysis section summarizes the expected benefits of the Tribe’s priority GHG reduction measures, including associated co-pollutant. In alignment with EPA’s CPRG guidance, the analysis identifies how GHG mitigation strategies may also reduce emissions of criteria air pollutants (CAPs) such as nitrogen oxides (NOX), sulfur dioxide (SO₂), volatile organic compounds (VOCs), and fine particulate matter (PM 2.5), along with select hazardous air pollutants (HAPs), where applicable.
The GHG reduction initiatives are critical to improving local air quality and enhancing public health, particularly for vulnerable and overburdened populations. The GHG measures outlined in this plan emphasize non-industrial sectors, including government building retrofits, clean energy integration, water infrastructure modernization, and waste diversion. Where possible, quantitative estimates of copollutant reductions have been provided using EPA-recommended tools such as Avoided Emissions and Reduction Tool AVERT and the National Emissions Inventory (NEI).
In addition to co-pollutant reductions, this section analyzes the cobenefits and potential disbenefits to the broader community impacts associated with GHG emission reduction measures. Each measure was developed through stakeholder engagement and technical analysis to reflect the Tribe’s unique environmental conditions, infrastructure limitations, cultural values, and implementation capacity. The benefits span four primary categories:
• Public and Community Health
• Energy Cost and Reliability
• Workforce and Economic Development
• Climate Resilience and Environmental Protection
Where applicable, disbenefits and implementation challenges are noted. These assessments are qualitative and are intended to guide prioritization, funding proposals, and stakeholder engagement during implementation.

The baseline year selected for the co-pollutant emissions analysis is 2020, consistent with EPA guidance for Tribes and Territories participating in the CPRG program. The EPA recommends the use of 2020 NEI data as the standard reference point for establishing baseyear emissions, as it represents the most recent, comprehensive, and quality-assured dataset available at the time of planning. The 2020 NEI includes detailed, source-specific emissions estimates for both CAPs and HAPs across a wide range of sectors and allows for a reliable analysis of co-pollutant impacts from GHG reduction measures. To evaluate the GHG reduction potential of each measure, the baseline year for GHG emissions aligns with the year used for the Tribe’s GHG inventories described in the Greenhouse Gas Inventories Section.
GHG measures implementation offers a wide range of benefits, such as cost savings and quality of life improvements. This plan considers how each initiative can contribute to the broader goals of community wellbeing, economic resilience, environmental health, and operational efficiency. This section provides an overview of the primary benefits associated with each priority measure, helping to illustrate the full value of the measures beyond environmental impacts.
These benefits can take many forms, such as improving public health through better air quality, lowering long-term utility costs through energy efficiency, increasing energy sovereignty by investing in local infrastructure, or creating new employment and training opportunities. Measures can also support long-term goals like enhancing community resilience to climate change or modernizing essential infrastructure for future generations.
At the same time, successful implementation requires understanding and planning for potential barriers. These may include high upfront costs, technical complexity, behavior change requirements, or institutional capacity limits. By weighing the expected benefits against potential challenges, the Tribe can prioritize investments that offer the greatest returns, both environmentally and socially.
The following table summarizes each priority measure, outlining its key benefits and any foreseeable disbenefits or barriers to implementation:

MEASURE
Measure 1. Complete a Feasibility Study and Implementation Plan to Develop a TUA
Measure 2. Transition All Government Buildings to Smart Electricity Meters
Measure 3. Improve Energy Performance During Renovation of the Former Casino
Measure 4. Energy Efficiency Retrofits in Government Buildings
Measure 5. Ensure All Water Distribution Meters Are SCADA-integrated, and Install SCADA meters On Wastewater Treatment Infrastructure
Measure 6. Minimize Waste and Increase Waste to Landfill Diversion
Energy sovereignty, grid reliability, local job creation, renewable integration Regulatory complexity
Energy savings, real-time management, foundation for demand response
Major emissions reduction, cost savings healthy building standards, resilient operations
Lower energy use, reduced operating costs (when combined with lower cost energy from TUA), improved comfort, and air quality
Reduced electricity use, improved reliability, operational efficiency
Reduced landfill methane, community education, improved aesthetics, and air quality
Tech compatibility, maintenance, and training needs
High capital cost, renovation disruption
Funding needs, phased scheduling over 15 years
Equipment cost, need for technical training, and ongoing maintenance
Behavior change effort, expanded service costs, regional hauling requirements
Several of the Tribe’s climate measures offer direct health benefits by reducing exposure to harmful pollutants and increasing the reliability of critical services. Building retrofits and electrification efforts (Measures 3 and 4) minimize indoor combustion from propane, improving air quality within community buildings. Likewise, improvements to waste diversion strategies and preventing illegal dumping (Measure 6) can impact both environmental and human health.
Additionally, the integration of SCADA systems into water and wastewater infrastructure (Measure 5) enables better system monitoring and real-time adjustments. This reduces the risk of contamination and service interruptions, particularly during extreme weather events. Lastly, by improving both energy and water service reliability, Measures 1 and 5 offer important protections for vulnerable community members, particularly elders and children, during outages or hazardous climate conditions.
• Cleaner indoor and outdoor air through reduced fossil fuel use and landfill emissions (Measures 3, 4, 6)
• Safer, more reliable water systems through SCADA integration (Measure 5)
• Greater protection for at-risk populations during outages (Measures 1, 5)

Energy efficiency and local grid control are central to the Tribe’s longterm energy strategy. By implementing smart meters and building upgrades (Measures 2, 3, and 4), the Tribe will reduce overall energy use, lower utility costs, and improve visibility into system performance. These upgrades allow for more efficient operations and long-term budget savings across government facilities.
Perhaps most significantly, the creation of the TUA (Measure 1) lays the groundwork for enhanced energy sovereignty, allowing the Tribe to reduce reliance on external providers such as SCE and reinvest energy revenues locally. Additionally, SCADA integration and the future potential for microgrid deployment (enabled by Measures 1 and 2) enhance system reliability during wildfires, blackouts, or natural disasters.
• Long-term operational savings from energy-efficient infrastructure (Measures 2, 3, 4)
• Reduced dependence on regional utilities through energy sovereignty (Measure 1)
• Improved energy and water infrastructure resilience during emergencies (Measures 1, 2, 5)

Each CCAP measure contributes to job creation and workforce development, either directly or through supporting services. Construction and installation activities will employ local labor, especially in Measures 3 and 4, which require major retrofits of government buildings. The development of the TUA (Measure 1) creates longer-term opportunities in utility governance, energy planning, and customer services.
Advanced infrastructure, such as SCADA and smart meter systems (Measures 2 and 5), introduce the need for new technical skills and certifications, creating pathways for upskilling and capacity building within the community. Over time, increased local expertise in managing infrastructure systems can reduce the Tribe’s reliance on outside contractors.
• Local employment opportunities in construction, energy, and waste sectors (all measures)
• Technical skill development through SCADA and metering systems (Measures 2, 5)
• Revenue retention and reinvestment through Tribal utility ownership (Measure 1)

Resilience and environmental stewardship are foundational values reflected in each measure. By upgrading energy and water infrastructure, the Tribe reduces vulnerability to extreme weather, service interruptions, and environmental degradation. Measures 1, 3, and 4 provide the most significant reductions in GHG emissions by transitioning away from propane and improving building efficiency.
Measure 6 addresses one of the most impactful short-lived climate pollutants, methane, by diverting organic waste from landfills and strengthening community education and enforcement around waste practices. Collectively, these efforts contribute to the protection of the Tribe’s forests, air, and water systems while aligning climate action with traditional values of land stewardship.
• Significant GHG reductions through electrification and efficiency upgrades (Measures 1, 3, 4)
• Increased climate resilience and energy sovereignty (all Measures)
• Methane mitigation through improved waste diversion (Measure 6)
• Enhanced environmental protection via reduced waste volumes and fire risk (all Measures)
The below table provides a high-level summary of the benefits for each measure in each benefit category.

MEASURE
Measure 1.
Complete a Feasibility Study and Implementation Plan to Develop a TUA
Measure 2.
Transition All Government Buildings to Smart Electricity Meters
Measure 3. Improve Energy Performance During Renovation of the Former Casino
Measure 4. Energy Efficiency Retrofits in Government Buildings
Measure 5. Ensure All Water Distribution Meters Are SCADAintegrated, and Install SCADA meters On Wastewater Treatment Infrastructure
Measure 6. Minimize Waste and Increase Waste to Landfill Diversion
More reliable energy for health services; reduced blackout impacts
Indoor air quality benefits from smarter usage
Healthier indoor environments; reduction of combustion-based emissions
Improved occupant comfort and air quality
Grid stability for critical facilities; reduced electricity cost
Cost savings from peak demand management
Reduced utility costs through electrification and energy efficiency
Decreased energy usage and costs
Utility planning, energy tech, and service jobs
CLIMATE
Reduced dependence on external utilities; renewable energy readiness
Opportunities for tech training and maintenance roles
Construction and O&M jobs; high-efficiency equipment sourcing
Local contractors employed for phased upgrades
Data supports future microgrid or load balancing
GHG and co-pollutant reductions; climateresilient systems
Reduced load on energy system; long-term emissions reduction
More reliable water access and fewer outages
Reduced illegal dumping and open burning; improved air quality
Lower energy costs for water/ wastewater treatment
O&M training and control system management jobs
Efficiency during climate-driven water shortages and power failures
Long-term landfill cost reduction
Green jobs in recycling and waste education
Reduced methane emissions; longer landfill lifespan
To maintain a balanced and actionable perspective, it is important to recognize that each GHG reduction measure presents not only benefits but also potential implementation challenges. These disadvantages, ranging from high upfront costs and technical complexity to community engagement fatigue, can influence timelines, budgets, and operational capacity. With thoughtful identification of disbenefits, planning, and proactive mitigation strategies, these barriers can be effectively managed or minimized. The table below outlines key anticipated disbenefits for each measure along with proposed strategies to address them to help with successful implementation.
Table 39. Anticipated Disbenefits and Mitigation Strategies
MEASURE
Measure 1.
Complete a Feasibility Study and Implementation Plan to Develop a TUA
Measure 2.
Transition All Government Buildings to Smart Electricity Meters
Measure 3.
Improve Energy Performance During Renovation of the Former Casino
Measure 4.
Energy Efficiency Retrofits in Government Buildings
Measure 5.
Ensure All Water Distribution Meters Are SCADA-integrated, and Install SCADA meters On Wastewater Treatment Infrastructure
Measure 6.
Minimize Waste and Increase Waste to Landfill Diversion
POTENTIAL DISBENEFITS MITIGATION STRATEGIES
Complex utility regulation
Privacy/cybersecurity risks; tech compatibility barriers
High capital investment; construction disruptions
Resource-intensive coordination for phased retrofits
Technical training needs; cost of SCADA systems
Outreach fatigue; lack of local compost/recycle facilities
Continue with feasibility study; create phase implementation; seek grant funding
Vendor selection criteria; staff training and community outreach
Stage construction; communicate plan to users; seek IRA/DOE funding
Use performance contracting; prioritize high-use facilities first
Partner with SCADA vendors for O&M training; phased roll-out
Pilot program in high-waste areas; consider regional service partnerships
A critical dimension of evaluating GHG reduction measures is understanding their financial performance and emissions reduction potential over time. This includes examining metrics such as cumulative emissions reductions, payback periods, net present value (NPV), and internal rate of return (IRR), which help estimate return on investment and inform implementation priorities.
However, it is essential to recognize that these financial metrics, while valuable, do not capture the full scope of a measure’s impact, particularly when it comes to infrastructure resilience, foundational capacity building, and long-term public value. Measures such as SCADA Integration for Water and Wastewater Systems (Measure 5) or the Casino Renovation (Measure 3) may have longer payback periods or lower immediate financial returns, yet are pivotal for enabling reliable service delivery, future climate adaptation, and Tribal energy sovereignty. These foundational investments often unlock opportunities for subsequent emissions reductions and system-level efficiencies not directly quantified in traditional cost-benefit frameworks.
In that context, each measure’s GHG reduction potential should also be considered alongside its financial and strategic role in the broader climate action framework. Measures that show high emissions reductions over time, like the electrification of the former casino (Measure 3) or SCADA Integration for Water and Wastewater Systems (Measure 5), carry long-term environmental benefits that compound even if their initial financial performance is less favorable or their benefits are realized over longer time horizons.
To support a balanced, multi-criteria decision-making approach, the table below presents the projected emissions reductions, payback period, and financial performance metrics for each priority measure, covering near- and long-term planning horizons. Appendix E includes detailed data and assumptions used for financial calculations and GHG and co-pollutant reduction projections.

Table 40. Emissions Reduction and Financial Performance by Measure
Measure 4.
Measure 5.
* Note that for Measure 1 payback period, NPV, and IRR were calculated based on the cost of TUA conducting a feasibility study and an estimated cost of establishing the TUA. These calculations don’t include O&M, cost associated with energy procurement, and other expenses.
The emissions and cost reduction estimates for Measure 1 were based on a modeled counterfactual scenario in which the Tribe gradually replaces utility-purchased electricity with direct procurement from wholesale markets over a 10-year period. The modeling assumed an annual 10% shift from utility-provided power to wholesale electricity, culminating in 100% replacement by year ten. This transition eliminates the 10.75% shareholder rate of return embedded in SCE’s retail rates, which translates into significant long-term cost savings. Annual electricity consumption for the Tribe was set at 5.7 million kWh, and emissions reductions were calculated using an initial grid emission factor of 0.0002064 MT CO₂e per kWh, which was assumed to decline by 5% annually. Energy cost savings were estimated by applying a 3% annual escalator to the current average retail rate of $0.28 per kWh, with proportional savings each year as the share of utility electricity decreased. By 2035, full implementation is projected to reduce GHG emissions from electricity to zero and save the Tribe more than $230,000 annually in electricity costs.
Calculations for Measure 2 assumed that installing 26 smart meters across all Tribal government buildings would produce a modest 1.8% reduction in electricity consumption. These savings stem from improved energy visibility, data-driven decision-making, and detection of inefficiencies. Annual electricity use for the affected buildings was set at 2,562,842 kWh, with a baseline cost of $0.28 per kWh and a 3% yearly cost escalation. This results in an annual reduction of 46,131 kWh and corresponding cost savings of approximately $25,367. These assumptions support the measure’s role as a high-impact, low-cost enabler of broader grid control and efficiency strategies.

Measure 3 evaluates the transformation of the former Eagle Mountain Casino into a high-performance Tribal Government Center through deep energy retrofits. The energy modeling first accounted for a baseline change in usage from a 24/7 casino to an office-like building operating during standard hours, cutting energy demand from 22.15 million to 9.23 million kBtu. Further savings were projected from switching all propanebased systems to electric, implementing envelope improvements, LED retrofits, smart thermostats, and installing a 670-kW solar PV system expected to offset approximately 87% of the building’s electricity use. Solar generation was modeled at 1,173,003 kWh annually. Energy efficiency upgrades were estimated to reduce electricity use by 45%, saving nearly 995,000 kWh annually. GHG reductions were calculated using electricity and propane emission factors, with total reductions of 3,407 MT CO₂e by 2035 and 5,720 MT CO₂e by 2050. Financial analysis yielded a net present value of $3.46 million, an IRR of 13%, and a payback period of just over five years, which improves further under a TUA scenario. This flagship measure can enhance climate resilience while serving as a community hub and emergency shelter.
The modeling for Measure 4 assumed that selected Tribal government buildings would achieve an average 35% reduction in electricity use following upgrades to lighting, HVAC systems, insulation, and building envelopes. Annual electricity consumption for these buildings was estimated at 3,354,262 kWh, and the model included an additional 10,000 gallons of propane usage converted to electric alternatives. The propane-to-electric transition was factored in by accounting for added electricity demand and offsetting propane-related emissions, using an emission factor of 0.00568 MT CO₂e per gallon of propane. Electricity emissions were calculated using an initial factor of 0.0002064 MT CO₂e per kWh, declining annually. Energy cost savings and emissions reductions were projected out to both 2035 and 2050. By 2050, this measure is expected to avoid 2,221 MT CO₂e. The total implementation cost is $3.1 million. With the assumption of lower electricity costs under a TUA, financial modeling yielded a positive NPV of $374,090, IRR of 7%, and a payback period of 10.1 years, reflecting a long-term infrastructure investment with solid emissions reduction outcomes.
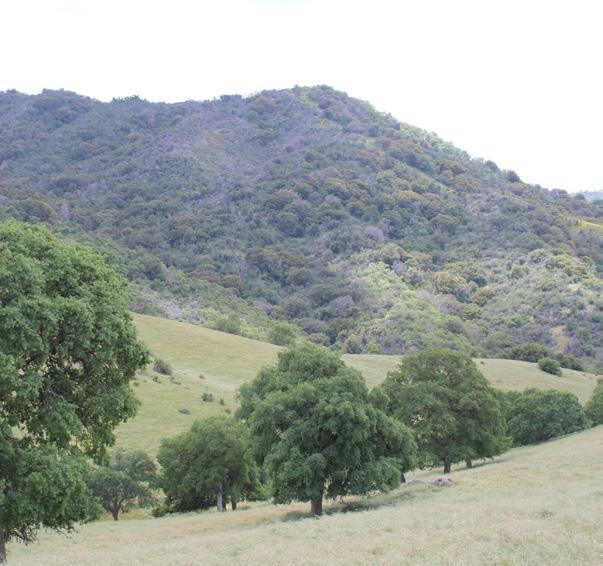
Ensure All Water Distribution Meters Are SCADAintegrated, and Install SCADA Meters on Wastewater Treatment Infrastructure
The model for Measure 5 projected a 25% electricity savings from the combined impact of SCADA integration and the installation of highefficiency electric pumps. The baseline electricity use for the water and wastewater systems was estimated at 357,569 kWh per year, with cost savings modeled at a rate of $0.28 per kWh and escalating by 3% annually. The energy savings, about 89,392 kWh annually, were consistent with industry estimates for energy use reduction in systems that combine VFDs and SCADA control. These estimates also consider operational improvements such as better scheduling and peak demand avoidance. Emissions reductions were calculated using a starting electricity emission factor of 0.0002064 MT CO₂e per kWh, which declines annually. The implementation cost of $1,015,000 results in an NPV of -$568,256, a payback period of 31.3 years, and an IRR of -1%.
Minimize Waste and Increase Waste to Landfill Diversion
The emissions and financial modeling for Measure 6 assumed a 30% reduction in waste from unauthorized dumping and an overall 35% diversion of waste from landfill due to expanded recycling, composting, and C&D recovery programs. The Tribe’s annual waste generation was estimated at 693.76 short tons, and the cost of landfill disposal was set at $214 per ton. Emissions were calculated using a landfill emissions factor of 0.5387 MT CO₂e per ton of waste. The resulting waste diversion is expected to reduce emissions from 374 to 268 MT CO₂e per year and yield $21,083 in annual waste disposal cost savings. With a total implementation cost of $275,000 over a 3-year period, the measure has a strong financial profile, including an NPV of $448,089, an IRR of 19%, and a payback period of 4.5 years, making it one of the most costeffective GHG mitigation strategies in the CCAP portfolio.
For a more detailed overview of data inputs, assumptions, and calculations for each measure, refer to Appendix E.
In addition to GHG reductions, CCAP measures can also lead to the reduction of various air pollutants that pose direct risks to human health and the environment. These co-pollutants are released during the combustion of fossil fuels and the degradation of organic waste, and they include criteria pollutants and toxic air contaminants such as nitrogen oxides (NOX), carbon monoxide (CO), particulate matter (PM), total organic compounds (TOC), ammonia (NH₃), sulfur dioxide (SO₂), and heavy metals.
This section evaluates the co-benefits of the Tribe’s measures by quantifying estimated reductions in co-pollutants across the electricity, propane, and waste sectors. All six mitigation measures modeled for the CCAP contribute to reductions in these pollutants, reinforcing the public health and environmental benefits of the Tribe’s broader sustainability goals. The table below identifies the co-pollutants included in the analysis and specifies which pollutants were modeled for each mitigation measure (e.g., NOX from propane combustion, PM from solid waste incineration).
The trajectory of co-pollutant reductions mirrors the GHG reduction modeling used in this plan. As GHG emissions decrease over time, due to transitions to cleaner energy sources, electrification of buildings, and diversion of organic waste from landfills, associated co-pollutants also decline. Most pollutants follow a declining trajectory through 2049, with sharp reductions or near-complete elimination modeled by 2050, especially where transitions to carbon-free electricity and clean technologies are complete.
This bar chart below presents the estimated reductions in co-pollutants associated with propane combustion, measured in pounds per gallon (lbs/gal) of propane displaced. Results are shown for the years 2035 and 2050, reflecting the long-term progression of electrification measures that reduce propane use in buildings and equipment.
Among the pollutants analyzed, NOX is the dominant co-pollutant emitted from propane combustion, followed by CO, total organic compounds TOC, and PM. The data show that reductions in each of these pollutants approximately double from 2035 to 2050, due to continued implementation of electrification strategies that reduce propane consumption over time.
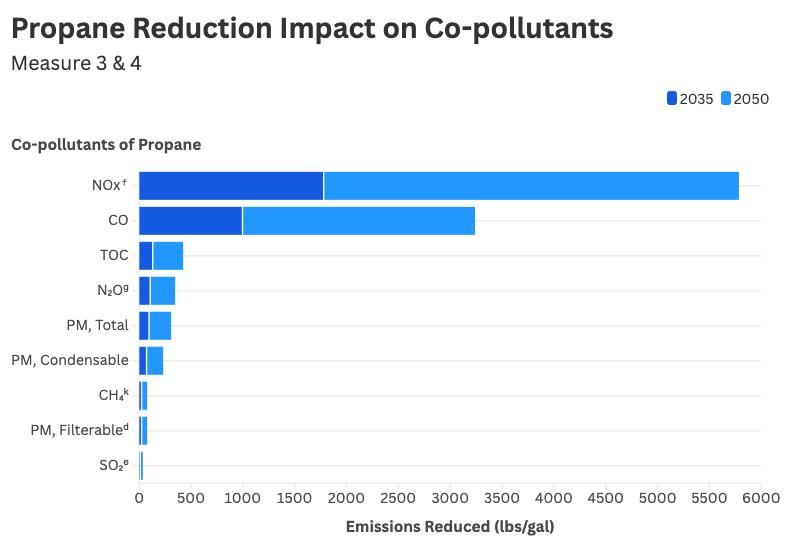
This line chart below illustrates annual changes in key electricityrelated co-pollutants over the 2026–2050 timeframe. These reductions are a result of two converging trends: (1) reduced reliance on utilitypurchased electricity through energy efficiency and self-generation, and (2) statewide grid decarbonization efforts that reduce the emission intensity of electricity.
The pollutants modeled include NOX, PM2.5, and NH₃, which are all emitted during fossil fuel combustion in power plants. As the share of renewables on the grid increases and energy demand is reduced through conservation measures, emissions of these pollutants steadily decline. By 2050, co-pollutant emissions from electricity are modeled to approach zero, reflecting full alignment with clean energy goals.
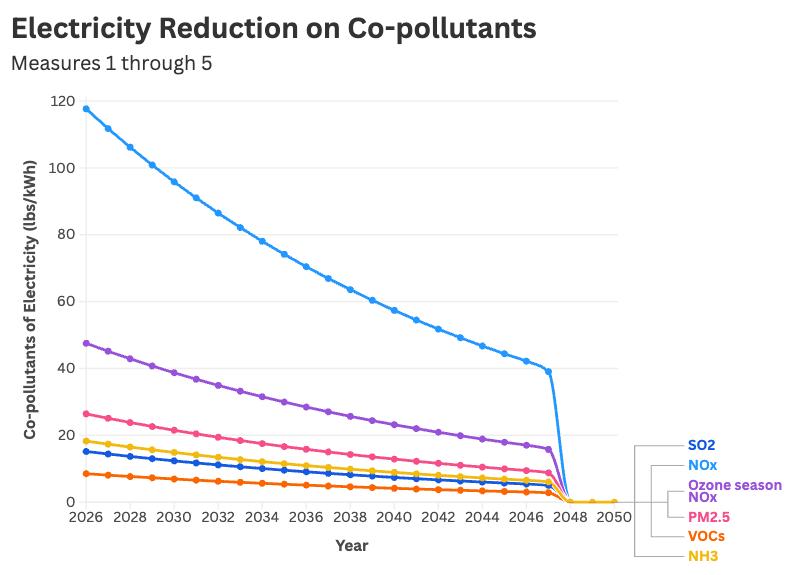
Figure 6 summarizes the co-pollutant reductions attributable to improved solid waste management practices, including organics diversion, composting, and reduced landfill use. Emissions reductions are shown for pollutants typically released during landfilling and waste incineration, such as NOₓ, SO₂, PM, Heavy Metals (e g , mercury, lead) These reductions are driven by avoided methane generation in landfills and improved handling of hazardous or toxic waste streams The reductions in heavy metals and SO₂ represent important health co-benefits, especially for vulnerable populations living near disposal sites
Figure 6 summarizes the co-pollutant reductions attributable to improved solid waste management practices, including organics diversion, composting, and reduced landfill use. Emissions reductions are shown for pollutants typically released during landfilling and waste incineration, such as NOX, SO₂, PM, Heavy Metals (e.g., mercury, lead). These reductions are driven by avoided methane generation in landfills and improved handling of hazardous or toxic waste streams. The reductions in heavy metals and SO₂ represent important health cobenefits, especially for vulnerable populations living near disposal sites.
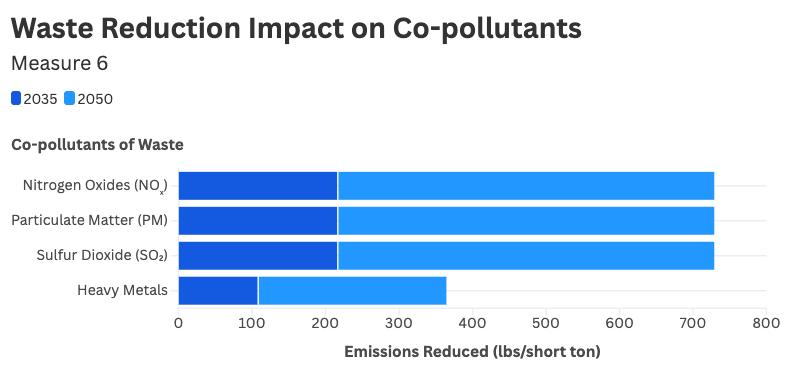
The CCAP measures provide a wide spectrum of benefits that reach far beyond GHG reductions As shown throughout this section, these initiatives contribute to improved public health, increased energy affordability and reliability, enhanced workforce development, and greater climate resilience While each measure has distinct strengths, their true value emerges when viewed as interconnected components of a broader strategy for Tribal sustainability, equity, and sovereignty
It is important to note that the financial viability, environmental impact, and social benefits of these measures should not be evaluated in isolation While some investments may show clear returns through energy savings, others, such as Measure 5: SCADA Integration for Water and Wastewater Infrastructure, may not offer immediate cost savings or high emissions reductions on paper However, they represent critical infrastructure upgrades that enable long-term system resilience, protect public health, and support future climate mitigation strategies that are not directly quantified in this analysis
For instance, SCADA systems improve operational control and data monitoring, which are essential during extreme weather events, scenarios that are increasing in frequency and
The CCAP measures provide a wide spectrum of benefits that reach far beyond GHG reductions As shown throughout this section, these initiatives contribute to improved public health, increased energy affordability and reliability, enhanced workforce development, and greater climate resilience While each measure has distinct strengths, their true value emerges when viewed as interconnected components of a broader strategy for Tribal sustainability, equity, and sovereignty
It is important to note that the financial viability, environmental impact, and social benefits of these measures should not be evaluated in isolation While some investments may show clear returns through energy savings, others, such as Measure 5: SCADA Integration for Water and Wastewater Infrastructure, may not offer immediate cost savings or high emissions reductions on paper However, they represent critical infrastructure upgrades that enable long-term system resilience, protect public health, and support future climate mitigation strategies that are not directly quantified in this analysis
For instance, SCADA systems improve operational control and data monitoring, which are essential during extreme weather events, scenarios that are increasing in frequency and
The CCAP measures provide a wide spectrum of benefits that reach far beyond GHG reductions. As shown throughout this section, these initiatives contribute to improved public health, increased energy affordability and reliability, enhanced workforce development, and greater climate resilience. While each measure has distinct strengths, their true value emerges when viewed as interconnected components of a broader strategy for Tribal sustainability, equity, and sovereignty.
It is important to note that the financial viability, environmental impact, and social benefits of these measures should not be evaluated in isolation. While some investments may show clear returns through energy savings, others, such as Measure 5: SCADA Integration for Water and Wastewater Infrastructure, may not offer immediate cost savings or high emissions reductions on paper. However, they represent critical infrastructure upgrades that enable long-term system resilience, protect public health, and support future climate mitigation strategies that are not directly quantified in this analysis. For instance, SCADA systems improve operational control and data monitoring, which are essential during extreme weather events, scenarios that are increasing in frequency and severity. Similarly, the TUA in Measure 1 may take time to establish, but it lays the foundation for energy sovereignty, local revenue retention, and deeper clean energy integration.
This approach to evaluating benefits highlights that implementation decisions reflect not only technical performance or financial payback, but also community priorities and long-term climate resilience. The following table summarizes each measure’s performance across key criteria, which should be considered during implementation planning and prioritization.
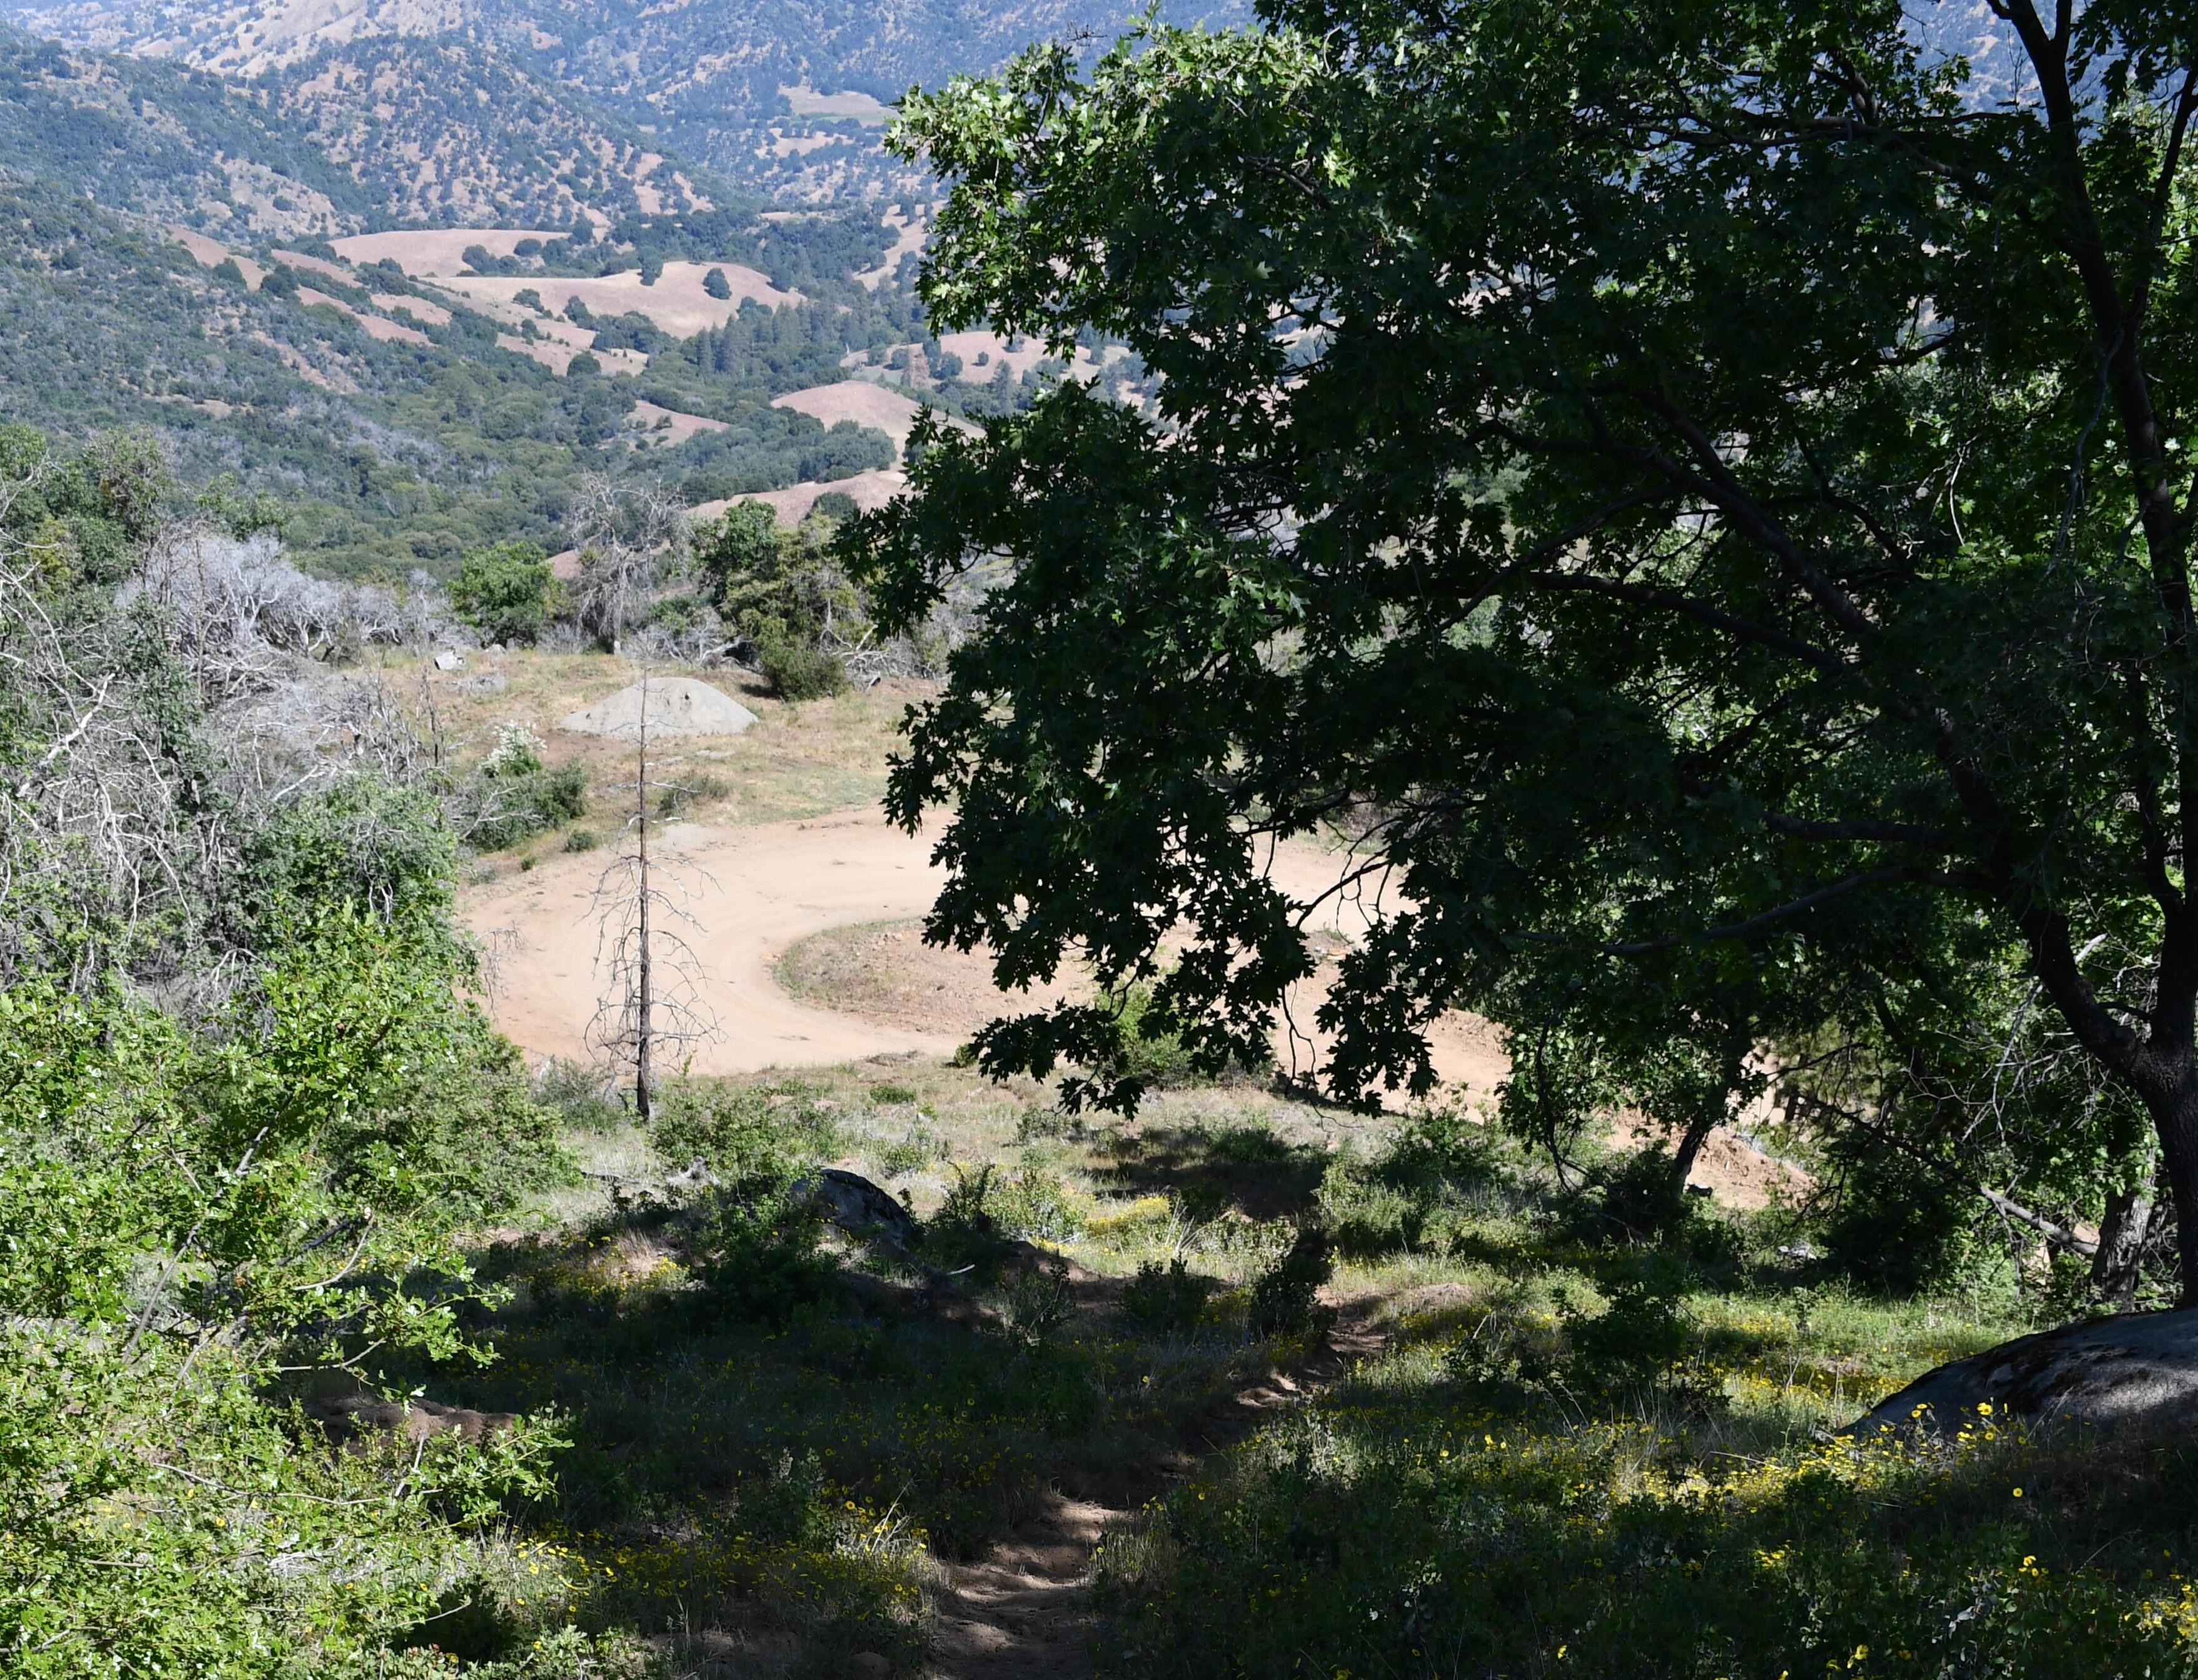
In support of the Tule River Tribe’s CCAP, the workforce planning analysis was developed to identify and align the essential job roles needed to implement the associated measures outlined in the CCAP. The primary objective of this analysis is to create a clear roadmap of workforce needs, defining the positions, functions, and capacities required to carry out initiatives ranging from retrofitting government buildings to be energyefficient to establishing a TUA. This process was informed through direct engagement with tribal leadership and departmental staff, whose insights helped shape a deeper understanding of the current workforce landscape. Through these collaborative discussions, we identified the current workforce capacity, areas where critical staffing gaps exist, and partnerships that can help fill them. This analysis helps identify a workforce pathway to meet the current CCAP measures but also provides a foundation for the Tribe to build upon, strengthening the local workforce in its ongoing future goals and endeavors.
Through careful analysis of the CCAP measures, the key roles necessary to successfully implement each strategy were identified by reviewing technical requirements and mapping them to appropriate job functions. It included assessing the Tribe’s existing workforce capacity by crossreferencing each measure with personnel availability and evaluating demand per measure. The accompanying table provides a clear snapshot of the staffing needs, serving both as a current workforce inventory and a guide for future recruitment, training, and strategic investment. Gaps in key implementation roles would need to be addressed through targeted hiring and expanded partnerships to bolster the Tribe’s ability to meet its climate goals effectively and equitably.
ASSOCIATED MEASURES
Key Measures to be executed by each role
Measure 1.
Complete a Feasibility Study and Implementation Plan to Develop a TUA*
The occupations needed to execute the associated measures effectively
• Energy and Technology Director
• Electrical Engineer/Electrician
• IT & Systems Integration
• Grants Manager
• Engagement and Education Lead
• Electrical Engineer/Electrician
Measure 2.
Transition All Government Buildings to Smart Electricity Meters
Measure 3.
Improve Energy Performance During Renovation of the Former Casino
Measure 4.
Energy Efficiency Retrofits in Government Buildings
• Facilities Manager
• IT & Systems Integration
• Energy and Technology Director
• Grants Manager
• Energy and Technology Director
• Energy Auditor
• IT & Systems Integration
• Facilities Manager
• Grants Manager
• Engagement and Education Lead
• Energy Auditor
• IT & Systems Integration
• Facilities Manager
• Grants Manager
• Engagement and Education
• Energy and Technology Director
• Electrical Engineer/Electrician
• SCADA Engineer
Measure 5.
Ensure All Water Distribution Meters Are SCADA-integrated, and Install SCADA meters On Wastewater Treatment Infrastructure
Measure 6.
Minimize Waste and Increase Waste to Landfill Diversion
• IT & Systems Integration
• Electrical Engineer/Electrician
• Water/Wastewater Technician
• Grants Manager
• Engagement and Education Lead
• Waste Auditor
• Grants Manager
• Engagement and Education Lead
To better understand the Tribe’s current workforce capacity and identify where strategic investments are most needed, the following table with staffing matrix evaluates the availability of key roles across each CCAP measure. This table cross-references essential job functions with existing workforce capabilities, using "X" to indicate a role that is needed but not currently available, and "V" to denote a role that is both needed and presently filled.
Study
Measure
* This function will be performed after each measure implementation, as time and staff capacity permit
X – Need this role; don’t have this function
V – Need this role; have this function
To further clarify key roles and implementation responsibilities, the table outlines roles, functions, and expected hire status (contract vs full-time) for each missing role required for the measures’ implementation. One of the core roles is a full-time Energy and Technology Director, guiding the Tribe’s energy strategy and coordinating agencies. Supporting this vision are contracted specialists: engineers, auditors, technicians, and educators, who tackle everything from renewable energy installations and building efficiency assessments to waste stream analysis and community outreach.
To further inform workforce development strategies, a market analysis of the current workforce was conducted to help better understand how key occupational sectors are projected to evolve within the next decade. This analysis builds upon the previous section of identified roles by providing a deeper look into the job demands and labor market trends of these key roles. The graph below depicts these market projections, offering insight into which sectors, such as construction, education, and professional business services, are expected to expand. By aligning the Tribe’s workforce planning with these trends, this analysis helps to ensure that the roles being developed are necessary not only for the CCAP measures but also for providing long-term employment opportunities for the community.
within the next decade This analysis builds upon the previous section of identified roles by providing a deeper look into the job demands and labor market trends of these key roles The graph below depicts these market projections, offering insight into which sectors, such as construction, education, and professional business services, are expected to expand. By aligning the Tribe’s workforce planning with these trends, this analysis helps to ensure that the roles being developed are necessary not only for the CCAP measures but also for providing long-term employment opportunities for the community
Using the BLS (Bureau of Labor Statistics), the above statistics, and stakeholder meetings, we conducted a detailed gap analysis to assess the current workforce against the future needs. This analysis revealed where critical roles remain unfilled or underdeveloped to execute certain measures in the CCAP. These missing roles were identified as Energy and Waste Auditors and a Tribal Director of Energy. The table below highlights the specific roles needed for each measure and the current gaps in the workforce.
Energy & Technology Director
Leads Tribal Energy Projects, overseeing project implementation, staff management, and coordination with key departments. They identify energy opportunities, pursue grants, advise on energy policy, and ensure costeffective, sustainable energy solutions, with expertise in green technologies and Climate Action Plan integration.
Waste Auditors
Energy Auditor
Conducts assessments of waste streams to evaluate contamination and diversion potential. Ensures compliance with state laws such as SB-1383.
Evaluates how energy is being used in a building or facility and identifies opportunities to reduce energy consumption, improve efficiency, and lower utility costs.
No role currently available.
Plan to leverage national Training programs (i.e. CEM and EMP certificates) and national certification programs to fill roles.
No role currently available.
Planning to train an individual through local partnerships (i.e. Porterville College, UC Davis Extension )
No role currently available.
Plan to fill the role through both local/state and national training and certification programs (i.e. CPI training program, Everblue Training program, College of Sequoias courses)
The Tribe currently maintains valuable jurisdictional partnerships with both local and state institutions, which will be instrumental in addressing existing workforce gaps and in fostering a stronger, greener workforce. One such partnership is with California State University, Bakersfield, which is focused on energy-related opportunities, specifically solar energy and HVAC programs, as well as construction and maintenance fields. Additionally, the Tribe has an ongoing relationship with Porterville College. This partnership is intended to be expanded by developing specialized coursework aimed at training candidates for roles such as energy auditors, thereby directly supporting workforce development in the clean energy sector.
Building on the gap analysis, this jurisdictional support section highlights potential partnerships that can help strengthen the Tribe’s workforce capacity. The Tribe can seek collaborations with local, state, and national training providers, including workforce boards and technical assistance programs, to support key roles identified in the CCAP. The partnerships could also be leveraged to recruit program participants and alumni for CCAP measures as well as future projects. Expanding these partnerships will help address critical workforce gaps, enhance skill development within the community, and ensure the long-term success and sustainability of the CCAP.
JOB ROLE LOCAL/STATE
Energy & Technology Director
CSU Bakersfield
• Plan to leverage current partnerships with CSU Bakersfield to tap into courses to that can train candidates in Mechanical, environmental, and broad engineering disciplines
• Offer courses designed around energy and power engineering, as well as a degree in engineering management
Porterville College (Opportunity for Development)
• Collaborate with Porterville College to host a local course focused on waste auditing
Waste Auditors
• It would create a pathway for tribal members and residents to gain this sustainability skill
UC Davis ExtensionEnvironmental Management and Auditing Certificate
• Offers an Environmental Management and Auditing Certification pathway that emphasizes key learnings and practices in Solid Waste Auditing
NATIONAL
COMBINATION OF THESE PROGRAMS:
Certified Energy Manager Certification (CEM) (Offered by the Association of Energy Engineers)
• The Certified Energy Manager Pathway aligns individuals with renewable project management and technical skills.
• Offers classes in-person or online across the nation
Energy Management Professional (EMP) Certification
• Provides training in effective energy management, budgeting and finance, implementing energy-efficient projects, and energy communications
Circular Innovation Council - Waste Auditor Training
• Combines classroom instruction with hands-on waste auditing workshops
• Focuses on data collection, sampling, and audit reporting.
GBES- Waste Auditor Certification (Online)
• A professional credentialing course that trains individuals to assess waste generation, disposal, and diversion practices
• Ideal for those working in sustainability, facility management, or compliance roles
SWANA (Solid Waste Association of North America)
• Offers a variety of online trainings and certifications in Solid Waste Auditing and reporting
JOB ROLE LOCAL/STATE
Seed Program (Sustainable Energy Efficiency Development)
• Offered at the William M. Maguy School of Education
• Provides hands-on training in energy efficiency, HVAC systems, and weatherization
• Prepares participants for careers in energy auditing and related fields
(SCE) Energy Education Center
• Offers online or in-person technical training for individuals pursuing careers as Energy Auditors
• Offered at the SCE center in Tulare County, CA
• Includes courses in energy efficiency, building systems, and energy code compliance
College of the Sequoias - A.S. in Environmental Control (HVAC)
Energy Auditor
• Provides foundational training in HVAC systems and energy efficiency
• Equips students with the skills needed for energy auditing and supports further certification
Porterville Unified School District – CAPS Internship Program
• A high school internship program where students have conducted real-world energy audits
• Opportunity to collaborate with students for auditing projects
De Anza College, Cupertino, CA - Energy and Facility Management Program
• Offers certificates and associate degrees focused on energy auditing and facility operations
• Covers core competencies in energy efficiency, HVAC, and building performance
BPI Energy Auditor Certification Program-
• Industry-recognized certification course for aspiring Energy Auditor
• Focuses on residential energy auditing skills, tools, and diagnostic techniques, but applies to other levels of energy auditing
Certified Energy Auditor (CEA Program)Association of Energy Engineers
• National certification program available in person and online
• Designed for professionals seeking official certification as Energy Auditors
Everblue Training Program (Online only)
• Self-paced courses for professionals with backgrounds in HVAC, construction, or facilities management
• Prepares participants for certification as Energy Auditors
Sustemy - Online Energy Auditing Courses
• Offers a range of online prep courses for various energy auditing certification exams
Addressing workforce development without considering the current job market's access and equity status leaves behind the very communities most impacted by climate and economic challenges. Therefore, understanding and addressing barriers to workforce participation is essential to creating inclusive opportunities. This section outlines key structural and social barriers faced by the underserved local workforce of the region and presents strategies to ensure equitable access to education, training, and employment pathways tied to the plan.
• High unemployment (11.2%)
• Low educational attainment: The Tribe's adult members have a significantly lower rate of college education at approximately 7%, compared to the County at 13.3%
• Rural transportation gaps: The Tribe sits in a remote rural area, which may inhibit job seekers from being able to reach the job site
• Language/cultural barriers (63.7% of individuals in Tulare County are Spanish-speaking), which may lead to difficulties in accessing opportunities due to the language barriers
• Small population within the Tule River Tribe (913 individuals approximately), there is a small local workforce to pull from
• Partner with local organizations to reach out to underserved populations to offer training and opportunities in workforce development
• Use bilingual and culturally responsive training materials
• Collaborate with workplaces to provide transportation services for those who don't have access to a vehicle
• Develop or expand apprenticeship programs with local companies to provide hands-on experiences
• Develop custom certificate programs with local colleges that are aligned with the tribal CCAP job needs, that are equitable for all
• Utilize the Workforce Innovation and Opportunity Act (WIOA) to facilitate more job opportunities and assist job seekers with finding employment
Key performance indicators (KPI) measure the success and impact of initiatives designed to build job-ready skills and strengthen the labor force. These indicators help evaluate how effectively a program prepares individuals for employment through education, hands-on experience, and certification
KPI
% of training programs established
# of certifications earned
# of partnerships formed
DESCRIPTION
Out of all recommended programs (e.g., SCADA, compliance), How many have been initiated?
Number of certifications obtained (e.g., Project Management, Waste Auditing)
New agreements with colleges, unions, or employers to develop talent pipelines
The workforce planning analysis provides a clear and actionable path that the Tule River Tribe can follow to build out a sustainable and equitable workforce that effectively implements the CCAP’s strategies. By identifying the key roles needed for each CCAP measure, mapping the current workforce, and highlighting critical gaps, this analysis can assist the Tribe in strategically investing in training, recruitment, and partnerships to build a resilient, future-ready workforce. Through collaboration with regional and state partners and by leveraging existing programs, the Tribe can develop the workforce that is equipped to meet immediate climate goals and support the community’s longterm sustainability and prosperity.
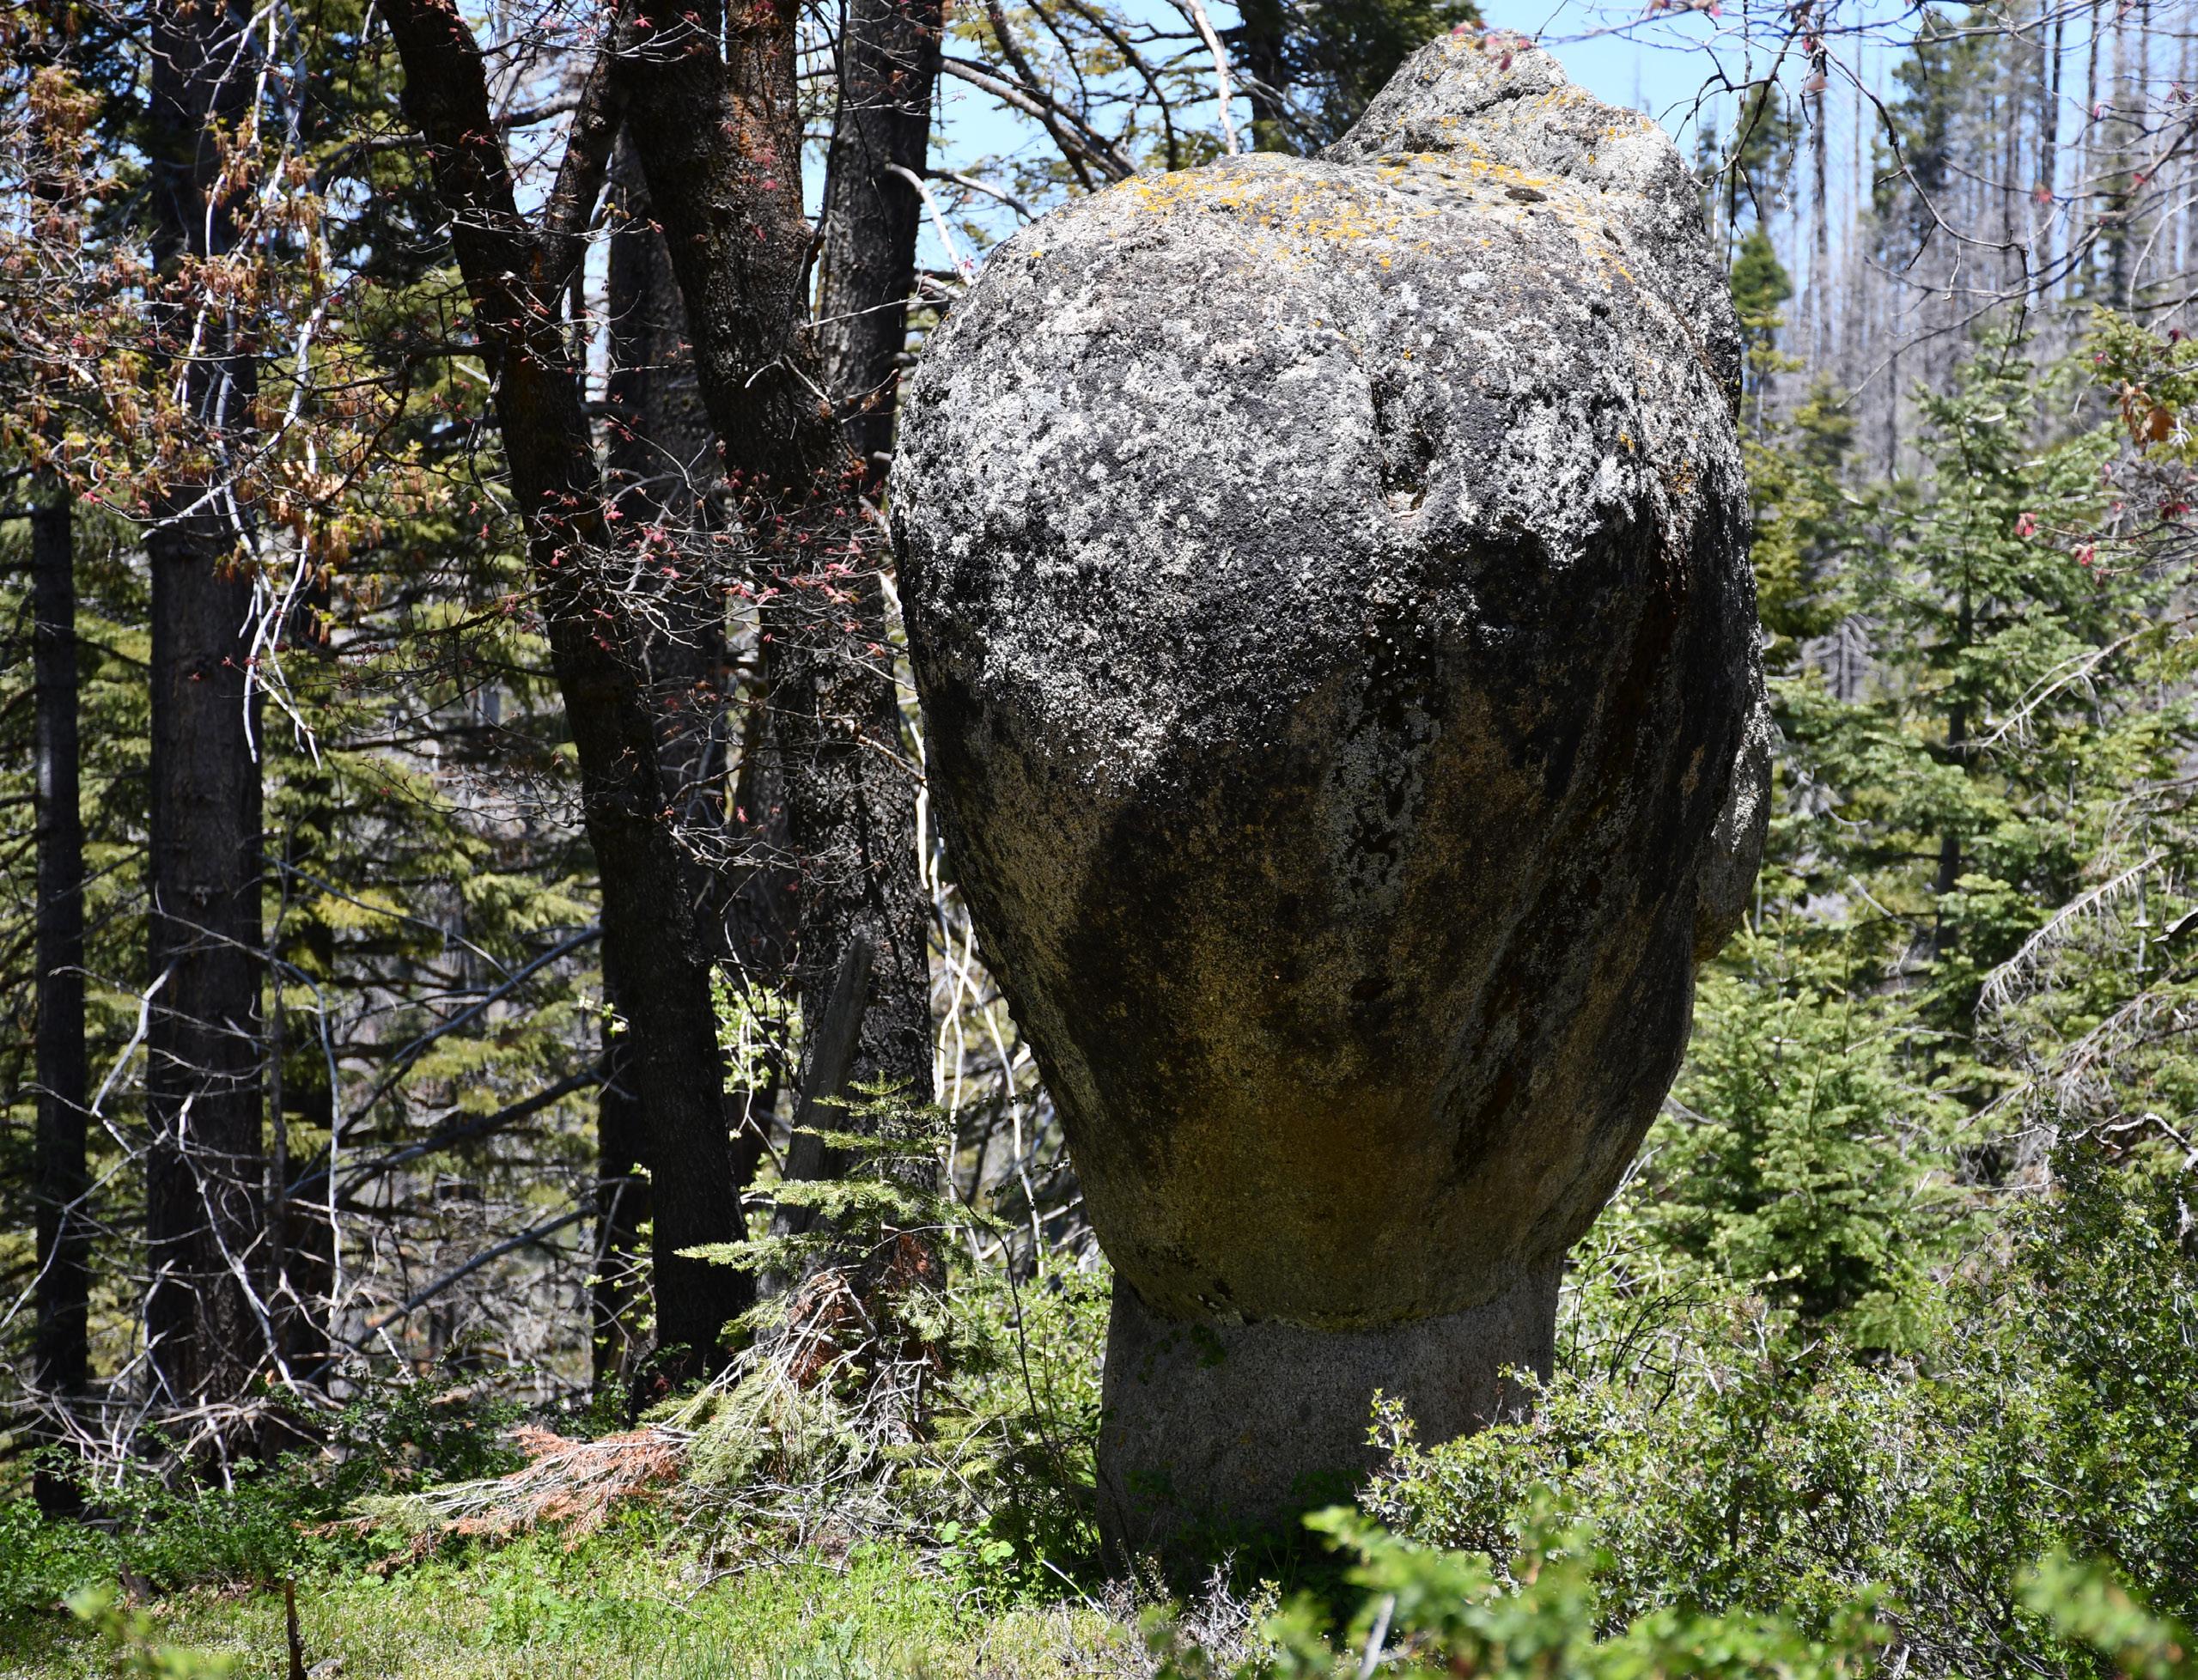
The following table outlines existing and potential funding sources aligned with each CCAP measure. It provides a roadmap to finance proposed programs, leveraging previously awarded grants and identifying additional federal, state, and utility opportunities. This funding matrix serves as a strategic tool to support implementation, reduce financial barriers, and align each measure with available programs tailored to Tribal energy, infrastructure, and sustainability goals.
Measure 1. Complete a Feasibility Study and Implementation Plan to Develop a TUA BIA Tribal Energy Development Capacity Grant
U.S. DOE – Office of Indian Energy Office of Indian Energy – Planning and Capacity Grants
U.S. DOE – Office of Indian Energy – Deployment of Energy Infrastructure on Tribal Lands
U.S. DOE – Indian Community Energy Resilience Program
U.S. DOE – Energy Efficiency and Conservation Block Grant
USDA REAP – Renewable Energy Development Assistance
U.S. Department of Commerce – Public Works & Economic Adjustment Assistance
California Energy Commission – California Tribal Energy Investment Programs
California Energy Commission – Advanced Grid Technology Acceleration Projects
U.S. DOE – Office of Indian Energy – Energy Infrastructure Deployment Grants
U.S. DOE – Energy Efficiency and Conservation Block Grant
U.S. Treasury / IRS – IRA Section 179D (Direct Pay)
BIA – Tribal Climate Resilience Program
Measure 2. Transition All Government Buildings to Smart Electricity Meters N/A
USDA – Rural Energy for America Program Tribal Track
U.S. DOE – Office of Indian Energy – Deployment of Energy Infrastructure on Tribal Lands
State Programs – California Energy Commission & California Public Utilities Commission
U.S. DOE –Office of Indian Energy – START Program – Technical Assistance
State Programs – Tribal Government Challenge Planning Grant Utility Rebates
Table 48. Funding Roadmap
MEASURES PREVIOUSLY AWARDED GRANTS
U.S. DOE – Tribal Energy Grant Program:
• Energy Technology Deployment on Tribal Lands
• Tribal Clean Energy Planning and Development Grant
• Clean Energy Technology Deployment on Tribal Lands
• Tribal Energy and Climate Resilience (TECR) Program
• Tribal Renewable Energy Development Grants
• Tribal Energy Program – Energy Efficiency and Renewable Energy (EERE)
• Tribal Clean Energy Technology Deployment Program
• Solar Energy Technologies Office (SETO) – Tribal Solar Program
• Community Solar for Tribes Program
IRA – Direct Pay
U.S. DOE – Energy Efficiency and Conservation Block Grant
Measure 3. Improve Energy Performance During Renovation of the Former Casino N/A
U.S. HUD – Indian Community Development Block Grant (ICDBG)
USDA Rural Development – Tribal Programs
California Energy Commission – State-Level Programs (e.g., CEC EPIC, SGIP):
• Advanced Grid Technology Acceleration Projects
• Energy Conservation Assistance Act (ECAA) Program
• Tribal Research Grant Program
• Tribal Electric Vehicle (EV) Infrastructure and Workforce Development
• Long-Duration Energy Storage Program
• Tribal Microgrids Program
U.S. DOE – Energy Efficiency and Conservation Block Grant
Southern California Edison – Microgrid Incentive Program
U.S. DOE – Smart Grid Grants
BIA – Energy and Mineral Development Program
Power Purchase Agreements (PPAs)
Utility Rebates
MEASURES PREVIOUSLY AWARDED GRANTS
U.S. DOE – Office of Indian Energy – Energy Infrastructure Deployment Grants
U.S. Treasury / IRS – IRA Section 179D (Direct Pay)
U.S. DOE – Energy Efficiency and Conservation Block Grant
Measure 4. Energy Efficiency Retrofits in Government Buildings N/A
Measure 5. Ensure All Water Distribution Meters Are SCADAintegrated, And Install SCADA meters On Wastewater Treatment Infrastructure Indian Health Services Water Meters
U.S. HUD – Indian Community Development Block Grant (ICDBG)
BIA – Tribal Climate Resilience Program
USDA REAP – Tribal Track
California Energy Commission (CEC) – Tribal and Local Government Programs
U.S. DOE START Program – Technical Assistance
U.S. DOE – Tribal Clean Energy Planning and Development Grant Utility rebates
EPA – Clean Water Indian Set-Aside (CWISA)
EPA – Drinking Water Infrastructure Grants – Tribal Set-Aside (DWIG-TSA)
EPA – Water Infrastructure Finance and Innovation Act (WIFIA)
BIA – Water Management, Planning, and Pre-Development (WMPPD)
BIA – Water Sanitation Program
BIA – Tribal Priority Allocations (TPA) – Water Resources
BIA – Water Infrastructure Improvements for the Nation (WIIN) Act
USDA Rural Development – Tribal Water/Wastewater Programs
CA State Water Board – Small Community Drinking Water (SCDW) Program
EPA – Tribal Water Infrastructure Programs
EPA – Clean Water State Revolving Fund (CWSRF)
EPA – Tribal Solid Waste Grant Program (TSWGP)
EPA – Environmental Education Grants – Tribal Track
EPA – Recycling Education and Outreach Grant Program
EPA – Tribal Waste Management Program
U.S. HUD – Indian Community Development Block Grant (ICDBG)
Measure 6. Minimize Waste and Increase Waste to Landfill Diversion N/A
EPA – Solid Waste Infrastructure for Recycling (SWIFR)
California CalRecycle Grants – Local Conservation Corps or Beverage Container Recycling Program (if applicable)
BIA – Tribal Climate Resilience Program
USDA Rural Utilities Service – Solid Waste Management Grants
CalRecycle – Tire Recycling, Cleanup, and Enforcement Grants
CalRecycle – Household Hazardous Waste Grants
CalRecycle – Solid Waste Disposal and Codisposal Site Cleanup Program
CalRecycle – Farm and Ranch Solid Waste Cleanup and Abatement Grant Program

APPENDIX A.
APPENDIX C.
APPENDIX
APPENDIX E.
APPENDIX E.
APPENDIX F.

This Appendix provides a summary of the GHG emissions estimate for the Tule River Reservation (referred to as Tule River or the Reservation) in calendar year 2023 for community and governmental operations, the BAU and ABAU emissions projections through 2045, and the methods used to calculate the GHG emissions reductions from the actions included in the CCAP.
This Appendix includes the following sections:
• Section 2 describes the background sources used for this Appendix
• Section 3 provides the calendar year 2023 GHG emissions inventory results summary and the methods used to prepare each emissions category of the inventory
• Section 4 provides a summary of the emissions projections for 2030, 2035, and 2045, and the methods used to prepare projections for each emissions category
Rounding is applied to the final GHG values presented in the tables and figures throughout this document. However, values are not rounded during intermediary calculation steps. As a result of this rounding, some totals in the tables or figures may not match the exact sum of their components.
This inventory follows the reporting protocol outlined by ICLEI as referenced in the US Community Protocol and LGO Protocol. Local governments are expected to evaluate emissions of the six internationally recognized greenhouse gases under the Kyoto Protocol, namely CO2, CH4, N2O, HFCs, PFCs, and SF6. To ensure consistency and comparability, GHG emissions are expressed in terms of CO2e, which accounts for the varying impacts of different GHGs. The GWP metric is used to calculate CO₂e by comparing the heattrapping ability of each gas to that of CO₂ over a specific time horizon, typically 100 years. The GWPs used in this inventory are from the IPCC AR5, provided in Table 1.
Table 1: IPCC GWP for Greenhouse Gases
The Reservation is located in the foothills of the southern Sierra Nevada Mountains in Tulare County, California. Established in 1873, it spans approximately 84.3 square miles (218.3 km²). The terrain is largely mountainous and forested, offering scenic views and natural resources. The reservation is situated southeast of Porterville, and the Tule River runs through parts of the land, giving the tribe its name.
The landscape includes a mix of rugged canyons, oak woodlands, and chaparral, and it ranges in elevation from around 1,000 to over 6,000 feet above sea level. The US Census Data reports fluctuating population due to challenges in data reporting and collection. The most recent census estimate reports 913 residents living within the reservation boundary in 2023. In 2020, according to the US Census Data, the population was reported to be 924 residents. This population change is within a margin of error, and the growth can be considered stable within the last 5 years.
GHG inventories are required to report Scope 1 and 2 emissions, and some Scope 3 emissions with significant influence.
Scope 1 emissions are those that are produced directly on-site within the boundary of the study. These emissions result from fuel combustion in stationary sources like government buildings and facilities, as well as mobile sources such as city-owned vehicle fleets and public transit buses. Additionally, Scope 1 includes fugitive emissions from sources like landfill methane release and leaks from refrigeration or wastewater treatment processes. Because these emissions stem from activities that The Reservation directly controls or operates, they are a key focus for local governments aiming to reduce their carbon footprint through efficiency upgrades, fleet electrification, and improved waste management practices.
Scope 2 emissions refer to indirect GHG emissions associated with the consumption of purchased electricity, steam, heating, or cooling within The Reservation’s boundary. While these emissions do not come from sources directly owned or controlled by the Tribe, they result from the generation of energy that Tule River uses in its operations. For municipalities, Scope 2 emissions primarily come from electricity consumption in government buildings, public lighting, water and wastewater treatment facilities, and other infrastructure. The amount of Scope 2 emissions depends on the carbon intensity of the electricity grid, meaning cities that rely on fossil fuel-based power generation will have higher emissions than those using cleaner energy sources. Reducing Scope 2 emissions often involves increasing energy efficiency in municipal operations, investing in renewable energy procurement, and implementing local policies to support a cleaner electricity supply.
Scope 3 emissions refer to indirect GHG emissions that occur outside a city's direct control but are influenced by its activities. These emissions result from sources not owned or directly operated by the Reservation but are still a consequence of its operations, services, and community activities. Scope 3 emissions can include employee commutes, emissions from the production and transportation of goods and services procured by the Reservation, solid waste disposal, and others. Not all Scope 3 emissions are required to be reported by the U.S. Community Protocol, and those required to report are included in this inventory.
stemming from government activities and facilities Emissions for this project were using the ICLEI ClearPath Tool.11
ity Inventory
For The Tule River I emissions are divided into two primary tracks: the community and the local government inventory. The community inventory focuses on emissions from individuals residing within Tule River jurisdiction, encompassing those mainly within The Reservation limits, as well as those resulting from residents' activities. The local government operations (LGO) inventory focuses on emissions stemming from government activities and facilities. Emissions for this project were calculated using the ICLEI ClearPath Tool.
amount of GHG emissions produced by the Tule River Reservation for 2023 was 3,307 s of carbon dioxide equivalent (MT CO2e) emissions.
The total amount of GHG emissions produced by the Tule River Reservation for 2023 was 3.307 MT CO2e emissions.
2023 Community Emissions Breakdown
1 Other energy includes electricity and propane from Governmental, faith based, and other uses not included in the residential sector.
overnment Operations Inventory
e total amount of emissions produced by the Government Operations of the Tule River eservation for 2023 was 1,656 MT CO2e
The total amount of emissions produced by the LGO of the Tule River Reservation for 2023 was 1,656 MT CO2e.
Figure 2a 2023 Local Government Operations Emissions Breakdown
This report utilized the ICLEI ClearPath tool for tracking emission sources, factors, and CO2e emissions. The GHG inventory methodology followed the U.S. Community Protocol for Accounting and Reporting of Greenhouse Gas Emissions, developed by ICLEI USA, as well as the U.S. LGO Protocol, also developed by ICLEI USA. The categories reported in this community inventory are: residential energy, non-residential energy, on-road transportation, water and wastewater, and solid waste. GHG emissions are calculated by multiplying activity data (e.g., kilowatt-hours of electricity, tons of solid waste) by an emission factor (e.g., pounds of CO2e per unit of electricity). For these categories, methods based on the U.S. Community Protocols were modified with regional or Tribal-specific data when available. All activity data and GHG emissions reported in this document are annual values, and all emission factors reported in this document are annual average values, unless stated otherwise.
The U.S. Community Protocol is the standard rulebook for developing communityscale inventories for municipalities. Protocols and guidance for reporting GHG emissions for entities, such as corporations and public agencies, are different from those for communities. The LGO Protocol, developed by ICLEI, CARB, and the TCR, and the General Reporting Protocol, developed by TCR, are widely used to develop GHG inventories for local governments and public agencies. The method to determine boundaries in the U.S. Community Protocol is different from the method in the LGO Protocol or the General Reporting Protocol, which depends on the entity’s financial or operational control. The community inventory accounts for the emission-generating activities in the Tule River Reservation, while the Tribal Government Operations Inventory is based on the Tribal government’s operational control.
To estimate VMT and vehicle types within the Tule River Reservation, the CCAP conducted a community survey targeting heads of households. The survey collected data on annual mileage, the number and type of vehicles per household, and general vehicle usage patterns. Outreach efforts reached approximately 50% of households within the Reservation, providing a representative sample to inform our analysis. This data was instrumental in estimating community-wide transportation emissions and understanding local travel behavior.
To further delineate the data, it was categorized into several vehicle types: gasoline light trucks, gasoline passenger cars, electric passenger vehicles, diesel heavy trucks, and diesel light trucks. This classification was achieved by applying the percentage distribution of each vehicle category from the Tule River Reservation, which is calculated using the heads of household survey done in conjunction with the CCAP project.
Following the determination of the VTM or each vehicle category, the next step involved calculating the fuel consumption for each vehicle category. This was achieved by multiplying the miles traveled by the average fuel efficiency rates. These rates are provided on an annual basis in able 4-23, provided in the Average Fuel Efficiency of U.S. Light Duty Vehicles page by the US Department of Transportation. Through this process, we were able to estimate the gallons of gasoline and diesel consumed by each vehicle category in Tule River.
Following the determination of the VTM or each vehicle category, the next step involved calculating the fuel consumption for each vehicle category This was achieved by multiplying the miles traveled by the average fuel efficiency rates. These rates are provided on an annual basis in able 4-23, provided in the Average Fuel Efficiency of U.S. Light Duty Vehicles page by the US Department of Transportation. Through this process, we were able to estimate the gallons of gasoline and diesel consumed by each vehicle category in Tule River
Following the determination of the VTM or each vehicle category, the next step involved calculating the fuel consumption for each vehicle category. This was achieved by multiplying the miles traveled by the average fuel efficiency rates. These rates are provided on an annual basis in Table 4-23, provided in the Average Fuel Efficiency of U.S. Light Duty Vehicles page by the US Department of Transportation. Through this process, we were able to estimate the gallons of gasoline and diesel consumed by each vehicle category in Tule River.
The emission factors for gasoline and diesel vehicles are sourced from the EPA’s GHG Emission Factors Hub, specifically from tables 2, 3, and 4 as outlined below.
The CO2 emission factors for each vehicle type are listed in Table 2, Mobile Combustion CO2, shown in kilograms per gallon (kg/gallon) for gasoline and diesel vehicles. To convert these figures to metric tons per gallon (mt/gallon), divide by 1,000.
The emission factors for gasoline and diesel vehicles are sourced from the EPA’s GHG Emission Factors Hub, specifically from tables 2, 3, and 4 as outlined below.
The emission factors for gasoline and diesel vehicles are sourced from the EPA’s GHG Emission Factors Hub, specifically from tables 2, 3, and 4 as outlined below.
The CO2 emission factors for each vehicle type are listed in Table 2, Mobile Combustion CO2, shown in kilograms per gallon (kg/gallon) for gasoline and diesel vehicles. To convert these figures to metric tons per gallon (mt/gallon), divide by 1,000.
The CO2 emission factors for each vehicle type are listed in Table 2, Mobile Combustion CO2, shown in kilograms per gallon (kg/gallon) for gasoline and diesel vehicles. To convert these figures to metric tons per gallon (mt/gallon), divide by 1,000.
However, the annual emission factors for CH4 and N2O are differentiated between gasoline and diesel vehicles and are expressed in grams per vehicle-mile (g/vehicle-mile):
However, the annual emission factors for CH4 and N2O are differentiated between gasoline and diesel vehicles and are expressed in grams per vehicle-mile (g/vehicle-mile):
However, the annual emission factors for CH4 and N2O are differentiated between gasoline and diesel vehicles and are expressed in grams per vehicle-mile (g/vehicle-mile):
● Gasoline: Emission factors for Passenger Cars, Light-Duty Trucks (Vans, Pickup Trucks, SUVs), and buses (Gasoline Heavy-Duty Vehicles) are found in Table 3, Mobile Combustion CH4 and N2O for On-Road Gasoline Vehicles
• Gasoline: Emission factors for Passenger Cars, Light-Duty Trucks (Vans, Pickup Trucks, SUVs), and buses (Gasoline Heavy-Duty Vehicles) are found in Table 3, Mobile Combustion CH4 and N2O for On-Road Gasoline Vehicles
● Diesel: Emission factors for Light-Duty Trucks, Heavy-Duty Vehicles, and Buses are found in Table 4, Mobile Combustion CH4 and N2O for On-Road Diesel and Alternative Fuel Vehicles.
● Gasoline: Emission factors for Passenger Cars, Light-Duty Trucks (Vans, Pickup Trucks, SUVs), and buses (Gasoline Heavy-Duty Vehicles) are found in Table 3, Mobile Combustion CH4 and N2O for On-Road Gasoline Vehicles
• Diesel: Emission factors for Light-Duty Trucks, Heavy-Duty Vehicles, and Buses are found in Table 4, Mobile Combustion CH4 and N2O for On-Road Diesel and Alternative Fuel Vehicles.
● Diesel: Emission factors for Light-Duty Trucks, Heavy-Duty Vehicles, and Buses are found in Table 4, Mobile Combustion CH4 and N2O for On-Road Diesel and Alternative Fuel Vehicles.
For the Passenger Vehicles, Light Trucks, and Heavy Trucks, it is necessary to convert emissions from g/vehicle-mile to mt/gallon. The US Department of Energy provides miles per gallon (MPG) values for each vehicle type and fuel source, as indicated in the Average Fuel Economy of Major Vehicle Categories data. To perform this conversion, multiply the MPG by the g/vehicle-mile to obtain mt/gallon. This result should then be divided by 1,000,000 to convert the value from g/gallon to mt/gallon:
For the Passenger Vehicles, Light Trucks, and Heavy Trucks, it is necessary to convert emissions from g/vehicle-mile to mt/gallon. The US Department of Energy provides miles per gallon (MPG) values for each vehicle type and fuel source, as indicated in the Average Fuel Economy of Major Vehicle Categories data. To perform this conversion, multiply the MPG by the g/vehicle-mile to obtain mt/gallon. This result should then be divided by 1,000,000 to convert the value from g/gallon to mt/gallon:
For the Passenger Vehicles, Light Trucks, and Heavy Trucks, it is necessary to convert emissions from g/vehicle-mile to mt/gallon. The US Department of Energy provides miles per gallon (MPG) values for each vehicle type and fuel source, as indicated in the Average Fuel Economy Major Vehicle Categories data. To perform this conversion, multiply the MPG by the g/vehicle-mile to obtain mt/gallon. This result should then be divided by 1,000,000 to convert the value from g/gallon to mt/gallon:
CH4 or N2O factor (mt/gallon) = CH4 or N20 factor (g/vehicle-mile) * MPG (miles/gallon) 1,000,000
The resulting CO2e emission factor is determined by multiplying the emission factors of CO2, CH4, and N2O by their respective GWPs - 1 for CO2, 28 for CH4, and 265 for N2O. This process is conducted separately for gasoline and diesel; the results are then summed to calculate the CO2e emission factor for each fuel type.
CH4 or N2O factor (mt/gallon) = CH4 or N20 factor (g/vehicle-mile) * MPG (miles/gallon)
The resulting CO2e emission factor is determined by multiplying the emission factors of CO2, CH4, and N2O by their respective GWPs - 1 for CO2, 28 for CH4, and 265 for N2O. This process conducted separately for gasoline and diesel; the results are then summed to calculate the CO2e emission factor for each fuel type. 8
1,000,000
CO2e Factor (mt/gallon) = 1 * C02 factor (mt/gallon) + 28 * CH4 factor (mt/gallon) + 265 * N20 factor (mt/gallon)
The resulting CO2e emission factor is determined by multiplying the emission factors of CO2, CH4, and N2O by their respective GWPs - 1 for CO2, 28 for CH4, and 265 for N2O. This process conducted separately for gasoline and diesel; the results are then summed to calculate the CO2e emission factor for each fuel type.
3.3.2 Electricity
Emissions from electricity in the Tule River Reservation were estimated using the Built Environment (BE.2) method from the U.S. Community Protocol, by multiplying electricity use
Emissions from electricity in the Tule River Reservation were estimated using the Built Environment (BE.2) method from the U.S. Community Protocol, by multiplying electricity use by the region-specific electricity emission factor in 2023. Annual electricity data was provided to the Reservation by SCE.
Emissions from electricity in the Tule River Reservation were estimated using the Built Environment (BE.2) method from the U.S. Community Protocol, by multiplying electricity use by the region-specific electricity emission factor in 2023. Annual electricity data was provided to the Reservation by SCE.
There is no industrial electricity in the Reservation, so no emissions occurred for that sector.
The emission factors for electric energy in Tule River are sourced from the EPA's eGRID Subregion Total Output Emission Rates table, presented in pounds per megawatt-hour (lb/MWh).
Under the title Supplemental Files, click on Summary Data. Tule River is located within the Subregion CAMX WECC California. To obtain the Tule River final CO2e emission factor in kg/MWh, the following methodology was deployed:
There is no industrial electricity in the Reservation, so no emissions occurred for that sector. The emission factors for electric energy in Tule River are sourced from the EPA's eGRID Subregion Total Output Emission Rates table, presented in pounds per megawatthour (lb/MWh). Under the title Supplemental Files, click on Summary Data. Tule River is located within the Subregion CAMX WECC California. To obtain the Tule River final CO2e emission factor in kg/MWh, the following methodology was deployed:
● Step 1: Emissions of CO2, CH4, and N2O, each measured in lbs/MWh, are individually multiplied by their corresponding GWPs - 1 for CO2, 28 for CH4, and 265 for N2O.
• Step 1: Emissions of CO2, CH4, and N2O, each measured in lbs/MWh, are individually multiplied by their corresponding GWPs - 1 for CO2, 28 for CH4, and 265 for N2O.
• Step 2: After applying the GWPs, the products are summed to aggregate the total emissions in lbs/MWh. The conversion factor of approximately 0.453592 kilograms (kg) per pound (lb) can convert the CO2e emission factor from lbs/MWh to kg/MWh.
● Step 2: After applying the GWPs, the products are summed to aggregate the total emissions in lbs/MWh. The conversion factor of approximately 0.453592 kilograms (kg) per pound (lb) can convert the CO2e emission factor from lbs/MWh to kg/MWh.
CO2e factor (kg/MWh) = (1 * CO2 factor (lbs/MWh) + 28 * CH4 factor (lbs/MWh) + 265 * N2O factor (lbs/MWh) * 0 453592
Table 6: Electricity Emission Factors
Electricity: EPA eGRID 2023
Total Output Emission Rates
Table 6: Electricity Emission Factors
Table 6: Electricity Emission Factors
Electricity: EPA eGRID 2023
Please note that for solar electric energy, the emission factor is zero because solar panels generate electricity without burning fossil fuels, thereby not producing carbon emissions during operation.
Please note that for solar electric energy, the emission factor is zero because solar panels generate electricity without burning fossil fuels, thereby not producing carbon emissions during operation.
The Tule River Reservation does not purchase or use natural gas for any residential, commercial, or industrial uses. Therefore, there are no emissions occurring from natural gas sources.
The Tule River Reservation does not purchase or use natural gas for any residential, commercial, or industrial uses. Therefore, there are no emissions occurring from natural gas sources.
U.S. Community Protocol's Solid Waste (SW.4) method was employed to estimate emissions from decomposing organic material in landfilled waste. This was achieved by multiplying the quantity of waste disposed of by the Reservation in 2023 by an emission factor within the ICLEI ClearPath Tool. The result represents both immediate and future emissions from the waste's decay.
The U.S. Community Protocol's Solid Waste (SW.4) method was employed to estimate emissions from decomposing organic material in landfilled waste. This was achieved by multiplying the quantity of waste disposed of by the Reservation in 2023 by an emission factor within the ICLEI ClearPath Tool. The result represents both immediate and future emissions from the waste's decay
In The Tule River Reservation solid waste is disposed of in landfills outside of the jurisdiction. The landfill that receives solid waste reported methane capture, as it follows California Regulations. The emission factor of mixed solid waste depends on the percentage of each waste type within the waste stream disposed of in a landfill. Only the CH4 emissions from waste degradation are considered non-biogenic and included in this category. The CO2 emissions from waste degradation are considered biogenic and not included in this category. For this specific study, all waste sent to the landfill is considered to be MSW. This is due to limited information on waste characterization. In the plan and for future inventories, further analysis can be taken to determine more specific waste characteristics. Table 11 identifies the specific emission factor used in this inventory.
In The Tule River Reservation solid waste is disposed of in landfills outside of the jurisdiction. The landfill that receives solid waste reported methane capture, as it follows California Regulations. The emission factor of mixed solid waste depends on the percentage of each waste type within the waste stream disposed of in a landfill. Only the CH4 emissions from waste degradation are considered non-biogenic and included in this category. The CO2 emissions from waste degradation are considered biogenic and not included in this category. For this specific study, all waste sent to the landfill is considered to be MSW. This is due to limited information
Table 7: Solid Waste Detailed Emission Table
GCoM Common Reporting Framework Reference
3.3.5
The Tule River Reservation owns and operates its own potable water treatment plant. This information was sourced from the Water Treatment plant. Water usage and electricity usage were sourced from the Tule River water department and SCE, respectively.
Emissions from wastewater treatment were estimated using the U.S. Community Protocol appendix on Wastewater and Water Emission Activities and Sources Two types of emissions (Process Emissions from WWTP with Nitrification/Denitrification and Process Emissions from Effluent Discharge to Rivers and Estuaries) are calculated from the Community Process Wastewater and each has their own subset of emissions factors, as described below.
3.3.6.1
The emissions factors for nitrification and denitrification are detailed in Section 10.3.2.1 Process Emissions from WWTP with Nitrification/Denitrification by the US Community Protocol. Specifically, the factor for industrial and commercial waste codischarged into the sewer system, denoted as F(ind-com), is set at 1.25. Additionally, the emission factor for a WWTP implementing nitrification/denitrification processes, abbreviated as EF, is established at 7.0 g N2O/person/year. By multiplying these factors and then dividing the product by 1,000,000, the final emissions are expressed in MTN2O/person/year:
N2O/person/year. By multiplying these factors and then dividing the product by 1,000,000, the final emissions are expressed in MTN2O/person/year:
The emissions factors for effluent discharge to rivers and estuaries are detailed in the section 10.10 Process N2O Emissions from Effluent Discharge (default N load data) by the US Community Protocol. They are defined as:
The emissions factors for effluent discharge to rivers and estuaries are detailed in the section 10.10 Process N2O Emissions from Effluent Discharge (default N load data) by the US Community Protocol. They are defined as:
• Find-com, factor for industrial and commercial co-discharge waste into the sewer system, set as 1.25
• The total nitrogen load is 0.026 kg N/person/day
• The nitrogen uptake for cell growth in aerobic system as 0.05
• The amount of BOD5 produced per person per day, BOD5 Load, as 0.09 kg BOD5/ person/day
• The emission factor for the effluent is 0.005 kg N2O-N/kg sewage-N produced
• The molecular weight ratio of N2O to N2, 44/28, as 1.57
• The fraction of nitrogen removed for the centralized WWTP with nitrification/ denitrification, F plant nit/denit, is 0.7
• And the days per year is 365.25
To estimate CH₄ emissions from septic systems on the Reservation, we used the alternative method WW.11(alt) from the U.S. Community Protocol for Greenhouse Gas Emissions. This method is designed for situations where detailed wastewater data, such as BOD₅ load, is unavailable, relying instead on population estimates. For Tule River, we were able to obtain the number of households served by septic systems through direct communication with the Tribe’s Wastewater Treatment Plant operator. Using this data, we determined that 337 people are served by septic systems. Annual methane emissions were calculated using the following equation:
Annual CH₄ emissions (mtCO₂e)=(P × BOD5 × Bo × MCFs × 365.25 × 10⁻³)×GWP
Where:
P = population served by septic systems
BOD₅ = 0.090 kg/person/day (Biochemical Oxygen Demand)
Bo = 0.6 kg CH₄/kg BOD₅ (methane production potential)
MCFs = 0.22 (methane correction factor for septic systems)
365.25 = days/year
10¯³ = converts kg CH₄ to metric tons
GWP = Global Warming Potential of CH₄ (e.g., 28 or 34 depending on the assessment year)
Annual methane emissions from septic systems on the reservation are estimated to be approximately 40.94 metric tons of CO₂-equivalent (mtCO₂e).
This inventory follows the LGO Protocol, developed by ICLEI, CARB, and the TCR, and the General Reporting Protocol, developed by TCR, which is widely used to develop GHG inventories for local governments and public agencies. The scope of this inventory differs compared to the community inventory. This inventory follows operational control of the Reservation level government for Tule River. All emissions that Tule River has operational control over are documented and included in this LGO inventory.
The LGO inventory captures emissions across a range of municipal activities, organized into six primary categories: Buildings and Facilities, Vehicle Fleet, Employee Commute, and Water & Wastewater. Each category includes subcategories that provide a more detailed breakdown of emissions sources. For example, the Buildings and Facilities category accounts for emissions from purchased grid electricity and natural gas combustion, while the Vehicle Fleet category distinguishes between emissions from gasoline and diesel consumption. Other categories, such as Water & Wastewater, focus on electricity consumption specific to their operations. This structure ensures that all significant sources of emissions are comprehensively and transparently accounted for across LGO.
Emissions from buildings and facilities are broken down into scope 1 and 2 emissions. Scope 1 emissions include fuels used, such as natural gas, propane, and other generators. Scope 2 emissions include generation from purchased electricity.
3.4.1.1
To calculate electricity emissions from energy usage, this inventory followed the recommended methodology from Chapter 6.2 of the LGO Protocol. This data was sourced from SCE reporting information specifically for the GHG inventory. Emissions were calculated by multiplying the usage data in kWh by the emission factor. This sector was reported using FY 2025 data due to limitations from 2023.
Table 10: LGO Reported Electricity per industry, 2025
The same methodology used to determine MTCO2e emissions from electric energy in the Community Inventory was also used to determine MTCO2e emissions from electric energy used in government operations.
GHG emissions from propane use on the Tule River Indian Reservation were estimated using expenditure data provided by the Tribe. In the absence of direct fuel volume records, propane usage was derived from the total annual cost of $26,410, applying a regional average price of $2.64 per gallon as of May 2025. This results in an estimated consumption of approximately 10,000 gallons of propane
The propane volume was then converted to energy using a standard heat content value of 0.091 MMBtu per gallon, yielding an estimated 910 MMBtu of energy consumed. Emissions were calculated in ClearPath using default emission factors for propane combustion, as shown below:
Table 11: LGO Emission factor, 2023
ClearPath applied these factors to the estimated energy use to generate total emissions of 56.474 MTCO₂e. While the exact number of gallons consumed is unknown, this approach provides a reasonable estimate based on cost and standard conversion values, ensuring the propane emissions are appropriately captured in the GHG inventory.
Emissions from the TRIT vehicle fleet were calculated using estimated fuel data from the purchasing department. Unfortunately, gallons of fuel were not available, so some estimates were taken using the yearly spending data from the Tribe. A fleet inventory was compiled per department, categorizing vehicles by fuel type (gasoline or diesel) to establish a fleet-wide fuel allocation ratio. Fuel usage was estimated from expenditure records provided by the Purchasing Department and converted to gallons using an average fuel price of $4.50 per gallon. VMTs were estimated by applying average fuel economy values (miles per gallon) based on vehicle class, using default assumptions from the U.S. Department of Energy or manufacturer specifications where available. VMT estimates were cross-validated against typical duty cycles to ensure plausibility.
Emissions were calculated using fuel-based emission factors from the U.S. EPA’s Emission Factors for Greenhouse Gas Inventories (2022). We applied CO₂, CH₄, and N₂O emission factors by fuel type and converted non-CO₂ gases to CO₂e using GWPs from the most recent IPCC Assessment Report adopted by the EPA. For additional validation, we used the EPA’s on-road per-mile emission factors for representative vehicle types in the fleet. In cases where the fuel-based and mileage-based estimates diverged by more than 10%, we deferred to the fuel-based method due to higher data fidelity.
A commuting survey was distributed to government employees to collect data and calculate emissions from employee commuting. The Reservation has 291 fulltime employees; approximately 200 of them took the survey, resulting in a 68.7% sample size. Employee commuting is a scope 3 emissions source, although it is recommended to be included in this inventory, as the Reservation has influence over the commuting habits of its employees. As the Reservation does not have gasoline fuel purchasing data from employee commuting, the Alternate Approach detailed in Section 7.1.1.2.1 of the LGO protocol was followed. Through the completion of the commuting habits survey, employees answered questions about their vehicle type, days per week they commuted, and distance traveled. This information was used to extrapolate the VMT per vehicle type for the entire government staff. Fuel efficiency was also calculated from the commuting survey. Table 3 shows all the relevant information for calculating.
To calculate the amount of solid waste produced by the Governmental Operations of the Reservation, estimations were taken. Since the local government does not operate a landfill, nor is there one within the jurisdictional boundary, emissions from waste disposal were estimated using a proportional allocation method. The fraction of community MSW attributed to government operations was based on the ratio of government employees to the total community population.
To calculate the amount of solid waste produced by the Governmental Operations of the Reservation, estimations were taken. Since the local government does not operate a landfill, nor is there one within the jurisdictional boundary, emissions from waste disposal were estimated using a proportional allocation method. The fraction of community MSW attributed to government operations was based on the ratio of government employees to the total community population.
The total amount of community MSW disposed of annually was obtained from local waste management agencies through the community inventory data collection. To determine the portion of this waste generated by government operations, the following formula was applied:
The total amount of community MSW disposed of annually was obtained from local waste management agencies through the community inventory data collection. To determine the portion of this waste generated by government operations, the following formula was applied:
2 Estimated from reported employee VMT.
This method assumes that per capita waste generation is similar across all employees in the community, including those working in government. While this introduces some uncertainty, it provides a reasonable and practical estimate given the lack of available data.
After determining the quantity of waste attributable to government operations, emissions were calculated based on the assumption that all
This method assumes that per capita waste generation is similar across all employees in the community, including those working in government. While this introduces some uncertainty, it provides a reasonable and practical estimate given the lack of available data.
After determining the quantity of waste attributable to government operations, emissions were calculated based on the assumption that all waste is landfilled following California regulations. The landfill where the community’s waste is disposed of is subject to state-mandated methane capture and oxidation requirements, which influence the emission factor used in the calculations. The GHG emissions from government MSW disposal were then estimated using the equation:
Government Waste Emissions (kg CO2e) = Government Solid Waste (tonnes) X MSW Emission Factor
The landfill emission factor accounts for methane generation, gas capture efficiency, and oxidation rates as outlined in CARB regulations. This ensures that emissions calculations reflect real-world landfill practices and regulatory compliance. Several assumptions and limitations were considered in this methodology. The most significant assumption is that government employees generate waste at the same rate as the general workforce. By following this methodology, the local government can quantify its MSW-related emissions in alignment with the LGO Protocol. This approach allows for a standardized and replicable method of estimating emissions from solid waste, even in cases where the government does not own or operate a landfill. As new data become available, refinements can be made to improve the accuracy of these estimates.
For the Water and Wastewater sector, GHG emissions were calculated based on electricity consumption data obtained directly from the Water and Wastewater Treatment Plants. Annual electricity usage was provided by the department head and SCE and reflects total energy consumed by both facilities over the reporting year. This electricity data was then multiplied by the appropriate emission factor sourced from the electricity section of the inventory to determine total emissions in MT CO₂e. These emissions are the same as those for the community inventory, as Tule River does not import or export any water or wastewater. This sector was reported using FY 2025 SCE electricity usage data due to limitations in SCE 2023 reporting. Methodology from sections 3.3.6.1 Nitrification/Denitrification and 3.3.6.2 Effluent Discharge to Rivers and Estuaries was also applied to the government inventory.
4.1
To estimate future GHG emissions for the Tule River Reservation under a BAU scenario, we used sector-specific methodologies that rely on historical data, emission factors, and conservative assumptions about future activity. BAU projections assume no new policies or mitigation measures are implemented beyond those already in place as of the inventory year.
TOOLS AND METHODS BY SECTOR
• RESIDENTIAL AND OTHER ENERGY:
Emissions were projected using historical electricity consumption data and emissions factors aligned with SCE’s forecasted grid decarbonization targets. Because the Tule River Tribe does not purchase or use natural gas, emissions from stationary combustion were excluded. SCE’s public climate commitments and Renewable Portfolio Standard (RPS) compliance were assumed to continue on track, resulting in a consistent decline in emissions from electricity use through 2050.
• TRANSPORTATION AND MOBILE SOURCES:
Emissions were estimated using ICLEI’s ClearPath default carbon intensity growth rates, which apply a 1.8% annual reduction to reflect improvements under the CAFE standards and expected fleet turnover. Due to limitations in tribal transportation data, VMTs were assumed to remain constant, consistent with the stable population assumption.
• SOLID WASTE AND WATER/WASTEWATER:
Emissions from waste disposal and water/wastewater systems were held constant through 2050. This reflects the absence of detailed activity forecasts and the assumption that per capita waste generation and water use will not change significantly without intervention.
KEY ASSUMPTIONS
• SCE GRID DECARBONIZATION: SCE’s clean energy transition is assumed to occur on schedule, resulting in declining emissions intensity for electricity.
• STABLE POPULATION: Due to inconsistent reporting and large changes in recent Census figures, the Tule River population is assumed to remain stable through 2050. This avoids over- or under-projecting emissions growth. Updated population figures will be incorporated as they become available.
• DEFAULT CAFE-DRIVEN REDUCTIONS: A 1.8% annual emissions intensity reduction was applied to the transportation sector using ICLEI’s ClearPath default rates.
All emissions are expressed in metric tons of MTCO₂e, using 100-year GWPs from the IPCC AR5:
• CO₂ = 1
• CH₄ = 28
• N₂O = 265
LIMITATIONS AND UNCERTAINTIES
• Lack of tribal-scale transportation and demographic forecasts introduces uncertainty into long-range projections.
• Proxy data and default assumptions (e.g., vehicle efficiency trends) may not fully capture localized shifts.
• Potential changes in water use or waste disposal practices are not reflected in the projections.
The Reservation’s BAU GHG projections reflect expected changes in emissions from 2023 through 2050, assuming no new policies or mitigation measures are adopted. The analysis covers five major sectors: Residential Energy, Commercial Energy, Transportation & Mobile Sources, Solid Waste, and Water & Wastewater.
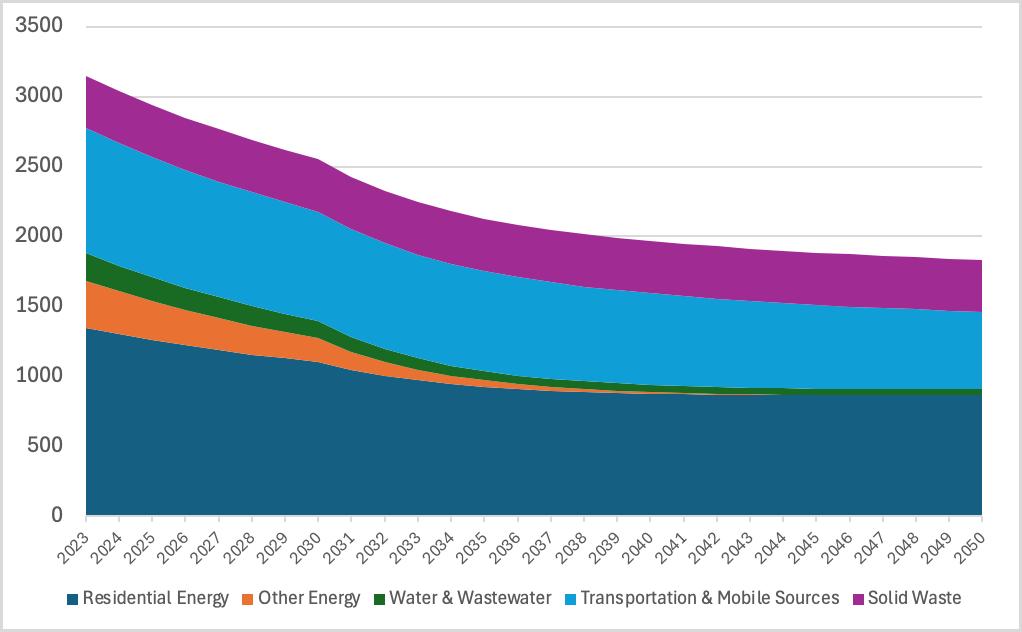
Figure 5: Stacked Area Chart Showing Sector-Specific Community GHG Emissions From 2023 to 2050
5: Stacked Area Chart Showing Sector-Specific Community GHG Emissions From 2023 to 2050
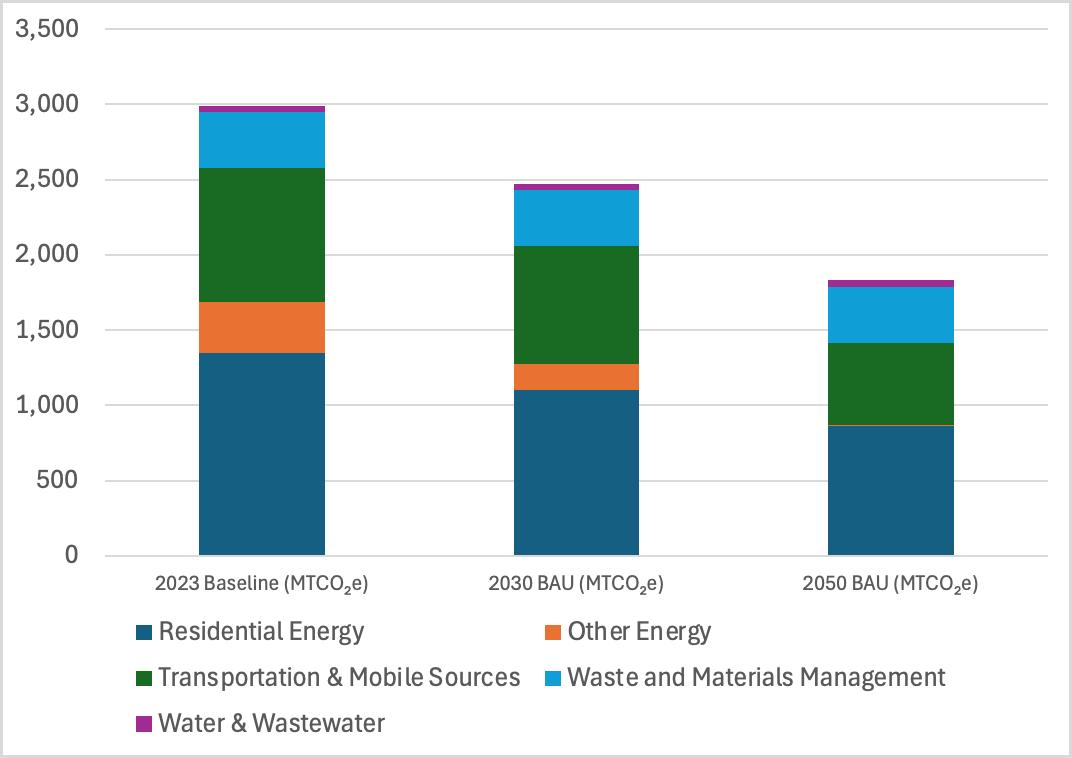
1. Overall Emissions Decline
• Total emissions are projected to decline from 3,149 MTCO₂e in 2023 to 1,832 MTCO₂e by 2050, a 39% decrease.
2. Residential Energy
• Emissions decrease from 1,346 MTCO₂e in 2023 to 864 MTCO₂e in 2050, a 36% reduction.
• This remains the largest single sector contributor throughout the forecast period.
3. Other Energy
• Sharp decline from 338 MTCO₂e in 2023 to 3 MTCO₂e in 2050, a 99% decrease.
• This is the most significant sectoral reduction in percentage terms.
4. Water & Wastewater
• Emission reduction from 200 MTCO₂e in 2023 to 45 MTCO₂e in 2050 due to electricity emissions reduction.
• Remaining emissions are from Wastewater processes, such as fugitive emissions.
5. Transportation & Mobile Sources
• Emissions fall from 890 MTCO₂e in 2023 to 545 MTCO₂e in 2050, a 39% reduction.
• This remains the second-largest emissions source through 2050.
6. Waste and Materials Management
• Emissions are constant at 374 MTCO₂e from 2023 through 2050.
• Indicates no expected change in this sector under ABAU.
These reductions are driven primarily by the decarbonization of electricity generation (in line with SCE’s climate goals) and improvements in vehicle fuel efficiency under the CAFE standards.
In conducting stakeholder engagement throughout this project, our ultimate goal was to create buy-in and awareness of the CCAP’s strategies and implementation. To do so, we aimed to gather diverse feedback and input, educate internal stakeholders on the CCAP’s impact, and cultivate ownership and encourage active participation. The objectives of the engagement process include:
• Improved Understanding: deepen the understanding of stakeholders’ attitudes and preferences concerning the CCAP and foster an environment of mutual learning and shared knowledge.
• Facilitate Feedback: offer platforms where stakeholders can review and articulate their feedback on preliminary strategies outlined in the CCAP.
• Local and Programmatic Attunement: ensure the CCAP is aligned with the local needs and values of the Tule River community, as well as CPRG requirements, to create a cohesive and inclusive blueprint for environmental resilience and sustainability.
Throughout the CCAP development process, a project team consisting of key Tribal staff members and consultants met biweekly to discuss project progress, present findings, and offer feedback and assistance when necessary.
To engage a wider variety of stakeholders at key junctures within the project, one-on-one interviews with various Tribal staff, subject matter experts, and community members were conducted. These interviews were used to gain an in-depth understanding of current projects and funding sources utilized by the Tribe, as well as the Tribe’s bandwidth to undertake future initiatives. The feedback received in each interview directly influenced GHG reduction measure development, workforce planning, and the development of a funding plan to implement both PCAP and CCAP measures.
At the beginning of PCAP development, the consulting team presented both PCAP and CCAP components to the Tribal Council and addressed questions. As the plan was developed, the Project Team met with the Tribal Council at key junctures to inform the Council on project progress and ensure that the CCAP remained in line with broader Tribal needs. Later, to secure final approval for the CCAP, a formal presentation of the final CCAP was given before the Tribal Council, showcasing the detailed initiatives and measures aimed at improving the quality of life for the Tribe and reducing GHG emissions.
Blue Strike and the Project Team published and publicized four surveys during the CCAP development process. Each survey was designed to target a specific audience, from Tribal department directors to reservation employees to the entire community, to collect robust stakeholder input to inform ideation for the CCAP’s GHG reduction measures. The type of questions in each survey varied from open-ended short answer questions to multiple choice and ranking questions. Once the surveys were closed, the Project Team analyzed its results and, where feasible, translated these findings into CCAP measures.
This survey was conducted through Google Forms and ran from January through April of 2025. In total, 33 Tule River Tribe directors shared their vision for strategic green priorities for the Tribe. This survey was provided exclusively to Tribal department Directors, whose daily involvement in Tribal operations gives them a deep, practical understanding of internal operational needs and environmental concerns. Their direct experience in government operations makes their survey feedback essential to developing actionable GHG reduction measures, as these Directors will ultimately be overseeing CCAP implementation. However, their perspective is not fully representative of the Tribe as a whole.
In collecting each Director’s feedback on climate-action priorities, several clear themes emerged. First, respondents were generally less enthusiastic about restriction-based clean energy strategies, such as reducing the use of fossil fuels; only about 24% of respondents considered these approaches a priority. In contrast, building decarbonization was widely supported, with approximately 58.6% of respondents expressing enthusiasm for programs like energy efficiency upgrades and other electrification initiatives. In contrast, the Director’s preferred transportation strategies were straightforward: 83.3% favored promoting alternative modes of transportation (walking, biking, public transit, etc.), as opposed to 33.3% that favored strategies aimed at increasing EV usage and fleet conversion. In spite of the Director’s preference for these transportation strategies, none were included in the CCAP because of implementation barriers like geographic location, grid resilience, and lack of active transportation infrastructure. In the future, this represents a promising area for increased GHG emissions reduction.
When it came to resource conservation, 71% of respondents expressed interest in strategies that promote open space protection as well as water conservation through sustainable land management and landscaping practices. Regarding water conservation specifically, 58% of Directors endorsed strategies that improve stormwater management and enhance the resiliency of critical infrastructure overall. On the topic of solid waste management, Directors generally favored strategies aimed at increasing recycling rates and the availability of composting programs.
Public safety and public health were two other key focus areas. A significant 65% of Directors favor implementing strategies that enhance emergency preparedness and address environmental health risks. This finding aligns with responses given to questions about public health concerns, as 62.5% stated that outdoor air quality was their most pressing public health concern. 78.8% stated that emergency response and preparedness were their top public safety priority.
Survey respondents identified a range of pressing environmental concerns, including water availability, land use, air quality, and public health, with open-ended responses revealing deeper priorities around health, safety, and community well-being. Tribal Directors emphasized the importance of disaster preparedness and safeguarding infrastructure against climate-driven threats such as heat waves and wildfires. Access to green spaces and outdoor recreation was also highlighted, with concerns about biodiversity loss and limited access to parks and trails. Pollution and water scarcity were recurring themes, with respondents calling for stronger environmental protections and efficient water management strategies. Additionally, there was strong interest in cultural and community events that promote sustainability education and foster a sense of connection through topics like renewable energy, extreme weather, and environmental stewardship.
As part of our analysis, the Project Team identified alignment between survey responses and CCAP measures. The results can be explored below:
Measure 1:
Complete a feasibility study and implementation plan to develop a Tribal Utility Authority
58% of Directors listed Building Decarbonization and Electrification as their highest “Energy Conservation & Renewables” priority.
79% of Directors listed Emergency Response and Preparedness (which includes access to consistent power and a reduction in rolling blackouts) as their main “Public Safety ” concern
Measure 2: Transition all Government Buildings to SMART Meters
Measure 3: Improve Energy Performance During Renovation of the Former Casino
58% of Directors listed Building Decarbonization and Electrification as their highest “Energy Conservation & Renewables” priority
58% of Directors listed Building Decarbonization and Electrification as their highest “Energy Conservation & Renewables” priority.
58% listed Constructing and Renovating Buildings with Resilient Design as their co-top priority for “Critical Infrastructure”
Measure 4: Energy Efficiency Retrofits in Government Buildings
58% of Directors listed Building Decarbonization and Electrification as their highest “Energy Conservation & Renewables” priority
58% listed Constructing and Renovating Buildings with Resilient Design as their co-top priority for “Critical Infrastructure”
Measure 5: Ensure All Water Distribution Meters Are SCADA-integrated, And Install SCADA meters On Wastewater Treatment Infrastructure
Measure 6: Minimize Waste and Increase Waste to Landfill Diversion
58% of Directors listed Improve Stormwater Management as their co-top “Critical Infrastructure” priority
66% of Directors listed Water Scarcity as their top Water-related environmental concern
84% of Directors favored increasing recycling rates at their top Solid Waste priority, and 77% listed enhancing composting as their second-highest Solid Waste priority
The most frequently cited challenges include more frequent and intense heatwaves and wildfires, open space protection, and community health and well-being, with many respondents highlighting the interconnectedness of these issues Respondents identified
The most frequently cited challenges include more frequent and intense heatwaves and wildfires, open space protection, and community health and well-being, with many respondents highlighting the interconnectedness of these issues. Respondents identified health, natural spaces, and critical water infrastructure as the areas most vulnerable to environmental changes. The connection between health, nature, and infrastructure underscores the need for integrated climate adaptation strategies that address these overlapping vulnerabilities.
A commuting survey was distributed to all employees working on the reservation to collect data and calculate emissions from employee commuting. The survey was conducted via Google Forms from March 31 to April 11, 2025.. The Reservation has approximately 400 full-time employees at the time of the survey; approximately 200 of them took the survey, resulting in a 68.7% sample size. Through the completion of the commuting habits survey, employees answered questions about their vehicle type, days per week they commuted, and distance traveled. This information was used to calculate Scope 3 GHG emissions for employee commuting for the Government Inventory.
To estimate VMT and vehicle types within the Tule River Reservation, the Project Team conducted a community survey targeting heads of households. Each respondent filled out the survey in person with a pen and paper, and the survey itself ran from February through April of 2025. In total, 202 Tule River “heads of household” shared data on annual mileage, the number and type of vehicles per household, and general vehicle usage patterns. Outreach efforts reached approximately 50% of households within the Reservation, providing a representative sample to inform our analysis.
This data was instrumental in estimating community-wide transportation emissions and understanding local travel behavior, revealing several clear themes in local travel behavior. First, 89% of respondents stated that they used a personal vehicle as their primary mode of transportation, with the remaining 11% split between walking, biking, and public transportation. 92% stated that their personal vehicle utilizes gasoline, and only one respondent stated that they drive an electric vehicle. These findings could indicate that the Tribe should implement policies to reduce emissions within its transportation sector; however, due to the Reservation’s remote location and aging grid infrastructure, encouraging a transition from gas-powered vehicles to EVs is currently untenable. This is further reflected by the percentage of respondents (55%) who reported owning trucks (both light and heavy duty), which could not be functionally replaced by current EV truck models due to the Reservation’s aforementioned constraints. Regarding public transportation modes, 85% of respondents stated that they do not use public transit, with the next largest response category being “buses” at 8.2%.
When asked to provide information on household fuel consumption by fuel type, 62% reported using 1-5 cords of wood per year, while 35% reported using no wood. Wood is primarily used as a source of heat within 62% of households surveyed, followed by cooking at 16%. More than half of respondents (63%) estimated that their households also use over 200 gallons of propane per year, with 21% of respondents estimating that they use over 500 gallons annually. Unlike wood, propane is used for a variety of functions within each household, with 93% of respondents reporting that they use it for cooking, while 80% use it for water heating, and 54% use it for general heating. Overall, these findings suggest that Tribe’s residential transportation and energy sectors represent opportune areas for further GHG reductions should extant issues like grid resilience, grid extent, and EV technology and infrastructure be ameliorated in the future. Currently, these findings demonstrate the importance of fossil fuels and wood-burning appliances to the broader community, suggesting that any transition away from these fuel utilization will require strategic planning and strong community support.
This community survey was conducted based on the responses of 14 residents of the Tule River Tribe reservation. It was open to the entire community and made accessible through multiple channels, including paper flyers with QR codes posted at all central community buildings and offices, as well as an online flyer with a QR code and direct survey link shared via Tribal and community social media pages. Participation was entirely voluntary; no incentives were offered, specific individuals were not targeted, and staff did not actively promote the survey beyond the initial postings. This approach was intended to provide a genuine opportunity for community members to engage if they felt inclined, without incentives.
This survey also served as the first formal outreach effort to the community on this topic and helped establish a structured framework for future survey distribution. It was designed to inform and improve future engagement strategies to increase participation in subsequent outreach efforts. The survey remained open from March through May 2025.
The survey highlights various concerns and priorities of these citizens within the Tule River Tribe as it relates to the effects of climate change on their reservation. While the sample size provides insights into community preferences and concerns, results should be interpreted cautiously due to potential response bias. For example, it’s important to note that not all questions received the same number of answers. For instance, while 14 people completed the survey, some questions related to specific climate strategies had as few as 2 responses. This variation may reflect differing levels of relevance or familiarity with the topics among respondents, illustrating the variation in project understanding among respondents. As such, it must be reaffirmed that survey respondents may not fully represent the broader community demographics.
Climate change is a pressing issue for all of the respondents within the Tule River Tribe. All survey participants expressed extreme concern about climate change and its future impacts (100%). This suggests broad recognition that climate change poses significant risks to the community’s well-being. Respondents often linked their concern to observable local impacts, like disastrous weather, and impacts to animals and plants, indicating that global climate trends are becoming tangible in daily life.
Throughout this section of the Tule River Tribe community survey, residents identified several priority areas for climate resilience and adaptation, with clear thematic groupings emerging around water conservation, energy reliability, health protection, and emergency preparedness. Water emerged as a top concern, with all respondents supporting expanded conservation programs and half emphasizing the need for flood risk mitigation. Energy resilience also received strong backing, with unanimous support for renewable energy development and the installation of microgrids with battery storage at community facilities. Health and safety concerns, particularly regarding extreme heat, led all respondents to endorse the creation of cooling centers for residents. Emergency preparedness and public education were also valued, with half of the participants supporting efforts to improve awareness of local emergency plans. Additionally, one respondent highlighted land stewardship by recommending the reduction or elimination of cattle grazing to protect vulnerable ecosystems. Overall, the responses reflect a comprehensive and community-driven vision for climate adaptation that balances infrastructure improvements with public education and environmental protection.
In this section of the survey, respondents were asked to rank the most important factors contributing to their quality of life. The weighted average of the following factors was ranked as follows:
1. Resource Management (e.g., drinking water quality)
2. Natural Environment (e.g., ecosystem restoration)
3. Electricity Reliability (e.g., eliminate power outages)
4. Community Health & Social Initiatives (e.g., educational programs)
5. Economic Growth and Resilience (e.g., supporting local businesses)
6. Utility Cost Savings (e.g., energy-efficient buildings)
7. Transportation and Connectivity (e.g., expanding public transit
8. Waste Management (e.g., enhancing recycling)
This ranking is based on how often and how highly each item was placed in the top ranks across the two respondents' answers. While the sample size is small, it still reflects that water quality, environmental restoration, and power reliability are perceived as the top contributors to quality of life in the Tule River community.
As part of the survey, respondents were asked to select strategies that residents/ businesses should focus on to reduce fossil fuel consumption. Respondents demonstrated a strong preference for widely proven, high-impact technologies like solar panels, while they offered moderate support for technologies like heat pump HVAC systems. This may reflect lower awareness, limited current use, or perceived barriers (e.g., cost, technical complexity, or applicability to specific housing types). Respondents also demonstrated moderate interest in transportation electrification strategies as well as lighting efficiency upgrades, with only 50% of respondents in favor of each strategy type. Overall, the data reveals that the Tule River community strongly supports practical, familiar energy-saving solutions while showing a willingness, but not unanimous consensus, for more advanced or less familiar strategies.
In this section of the survey, the respondents were asked to identify what strategies they are currently following to reduce energy consumption in their homes. A few key themes were found in this section, including strong uptake of low-barrier, cost-effective solutions like switching to LED lighting, as well as moderate adoption of more involved home upgrades like weatherization. One respondent shared that the Tribe’s rental program does not allow for residents to individually upgrade their homes, which may present a barrier to undertaking energy efficiency improvements. Overall, the data reflect a community that is motivated to reduce greenhouse gas emissions; however, broader adoption of higher-impact solutions may be limited by housing policies, affordability, and structural barriers. This underscores the need for targeted support programs, incentives, and policy adjustments to ensure all residents, including renters, can participate in energy efficiency and climate action efforts.
As a part of CCAP development, the Blue Strike Team visited the Tule River Indian Reservation in January 2025. During this visit, the consultant team engaged with department leaders to discuss ongoing climate resilience initiatives and priorities. Conversations centered on funding opportunities, emergency preparedness, and sustainable development, highlighting the Tribe's commitment to enhancing infrastructure and preserving natural resources. The visit also included tours of key facilities such as the Public Works department, Tribal offices, and a tour of the overall territory. This visit provided valuable insights into the Tribe's proactive approach to addressing environmental challenges and fostering resilience for future generations.
Blue Strike assisted with content creation for flyers and website postings that provided information and progress reports on the project. The content engaged a variety of community members and provided educational opportunities regarding the importance of sustainability. This included press releases to announce the CCAP surveys and provide pertinent information about the project. This activity aimed to update the public on CCAP development and make information regarding CCAP as accessible and transparent as possible.
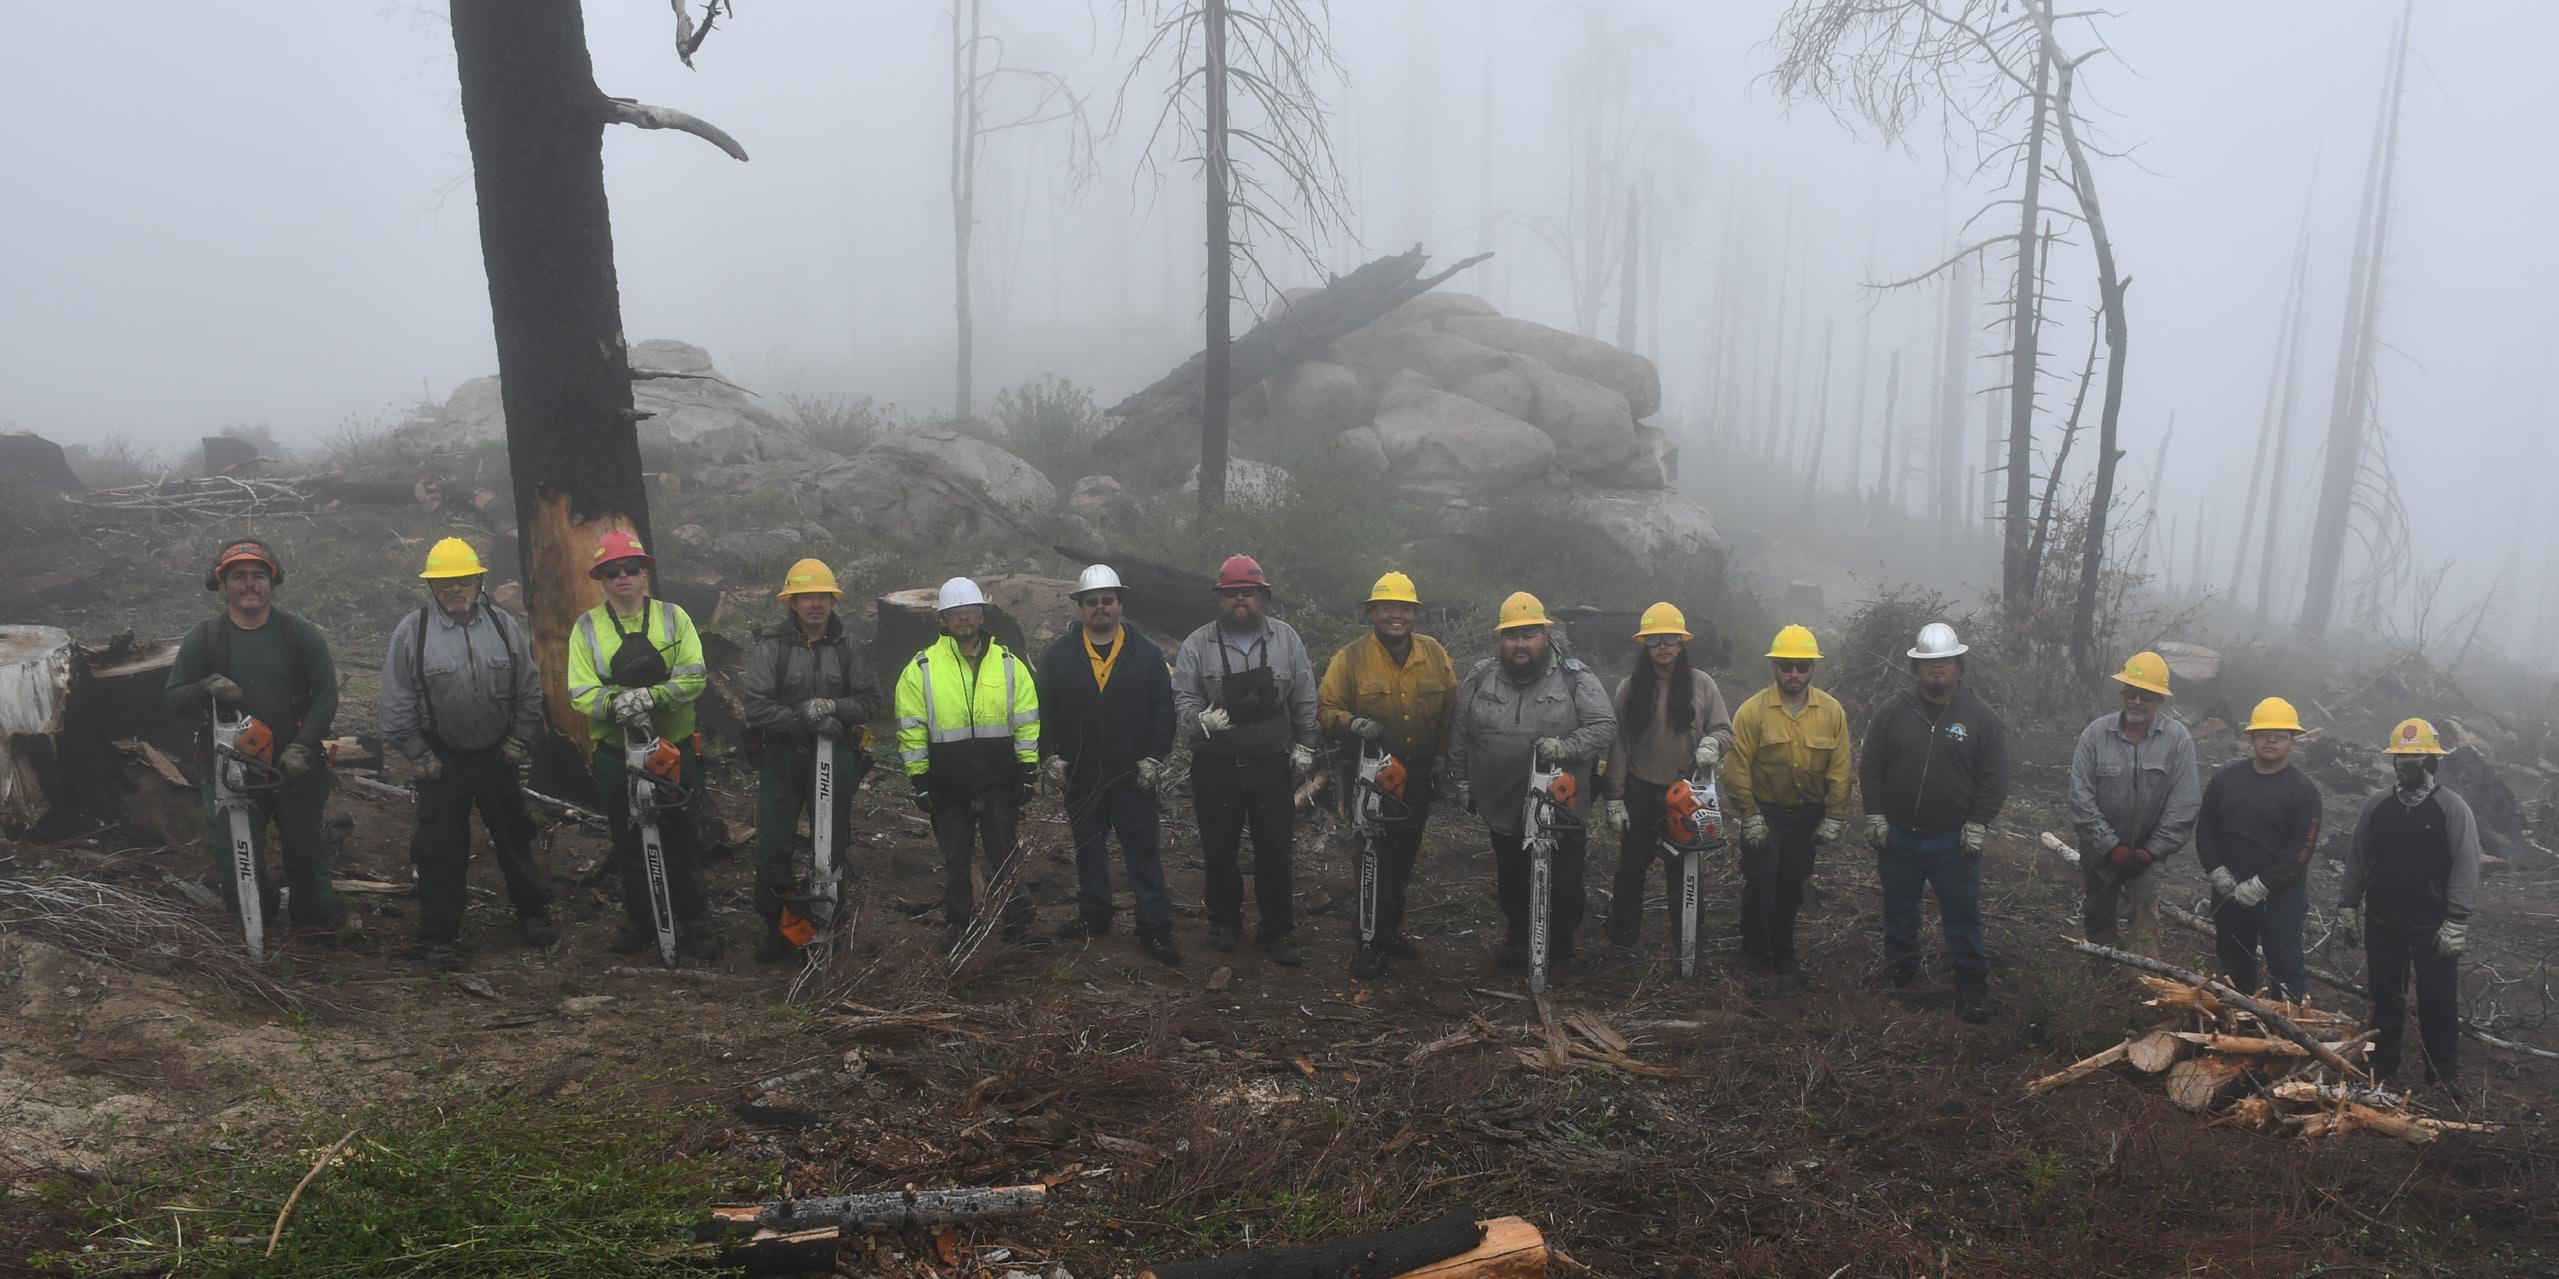
Summary
Forests and trees play a key role in mitigating climate change, yet they are often not included in local greenhouse gas (GHG) inventories or climate action plans. Data in this report helps users take the first step towards understanding how local changes in land use and tree canopy have contributed to the countyʼs net greenhouse gas profile and may suggest mitigation activities to explore in more depth. Unlike other sectors, land use (in this case, forests and trees) not only emit GHGs, but also remove CO2 from the atmosphere through photosynthesis, playing a critical role in regulating the planetʼs climate. The information contained in this summary report can be useful when designing climate actions that reduce GHG emissions and/or increase removals of GHGs from the atmosphere. For more information on LEARNʼs data and methods, please consult the technical note.
Key :ndingsb
- Over the period 2011 to 2021, emissions from forests and trees were 184,606 t CO2e per year.
- Over the period 2011 to 2021, the net GHG balance of forests and trees was -149,283 t CO2e per year.
- Roughly 35% of Custom uploaded polygon Countyʼs total land base of 22,326 hectares (55,169 acres) is forest. Many areas outside of forests are also covered by trees, including an average of nearly 13.8 percent tree canopy on lands outside of forest areas.
- Over the same period, annual CO2 removals from forests and trees were -35,323 t CO2e per year. (Carbon removals are represented by negative values.)
- Removals could be increased if additional forests/trees were added to its land base.
- Forest disturbances caused emissions of 186,913 t CO2e per year averaged over the inventory period.
- Total GHG emissions for Custom uploaded polygon County across all sectors could be reduced if the area affected by disturbance were lessened, and/or if losses of forests to other land uses or losses of trees outside forests were reduced.
Ta.le 1c Custom uploaded polygon 'ountyxs GHG –uDes from forests and trees for inventory period 2011 L 2021 All values reported in t CO2e per year
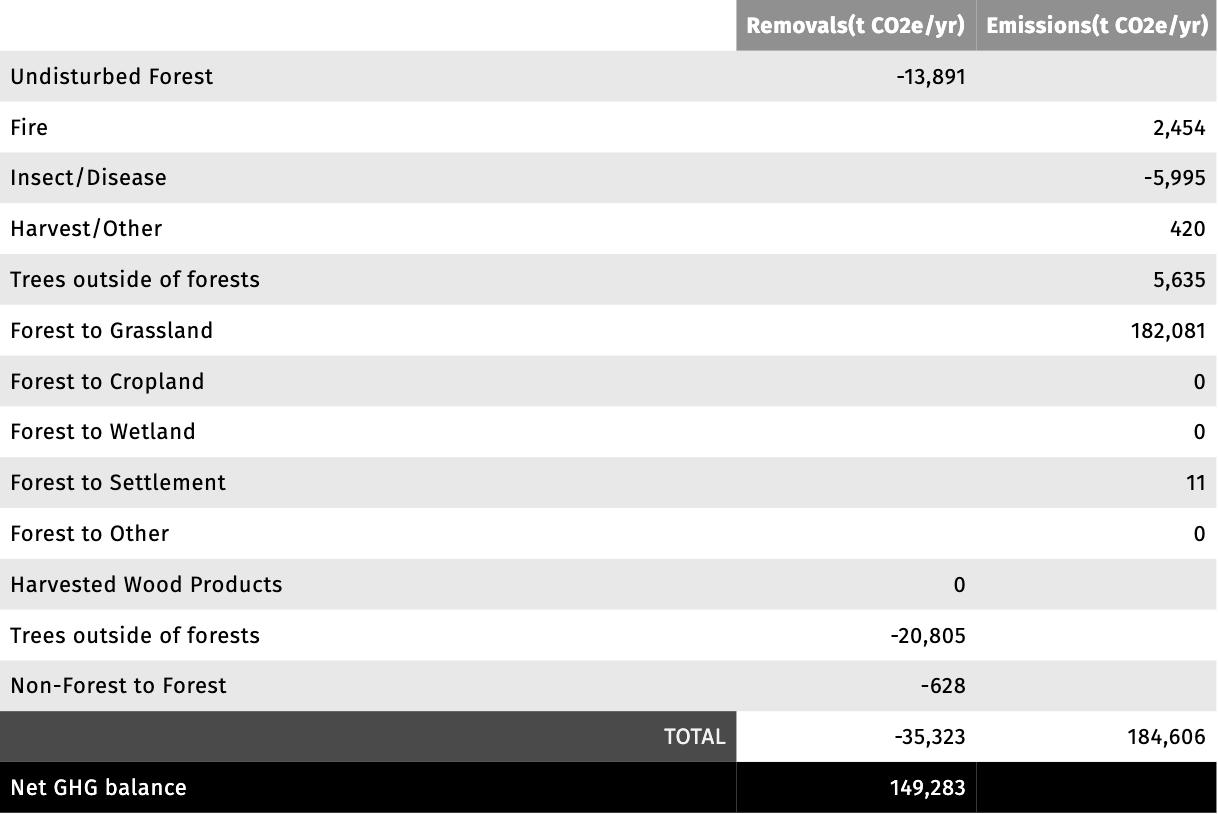
Data used as inputs into the GHG emission and removal calculations are described below.
Mand and Forest Cover
GHG inventories for lands are reported in six “land use” categories forest land, grassland, cropland, wetland, settlement and other land (barren, snow, ice). Custom uploaded polygon Countyʼs total land base is approximately 22,326 hectares (55,169 acres), with nearly 0.6% settlement (i.e. developed areas of varying intensity), around 35.2% forest, 64.3% grassland (which includes hay/pasture, shrub/scrub and other herbaceous cover), 0% cropland, 0% wetland and 0% other land.
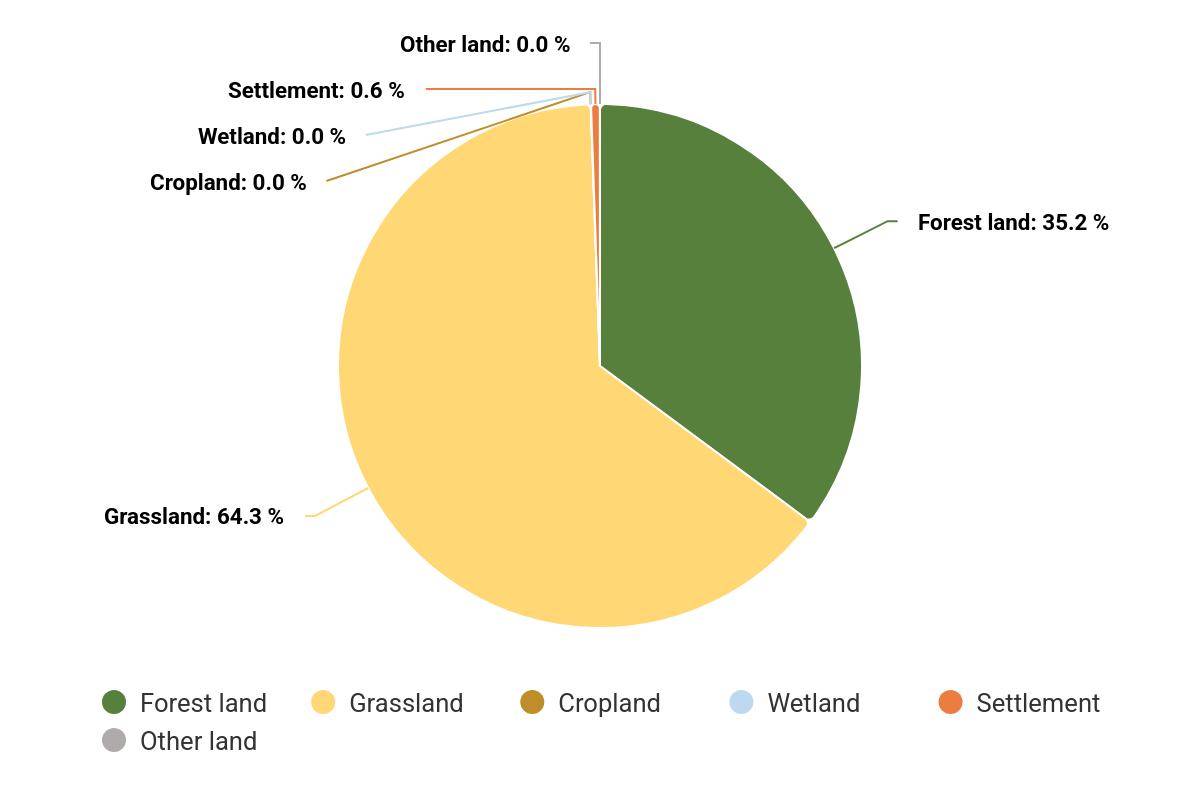
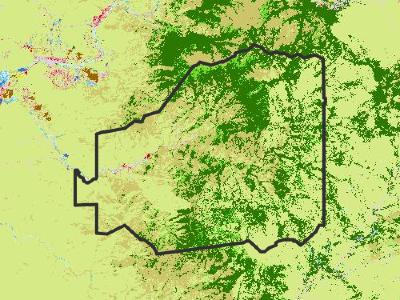
Open Water
Perennial Ice and Snow
Developed, Open Space
Developed, Low Intensity
Developed, Medium Intensity
Developed, High Intensity
Barren Land
Deciduous Forest
Evergreen Forest
Mixed Forest
Shrub/Scrub
Grassland/Herbaceous
Pasture/Hay
Cultivated Crops
Woody Wetlands
Emergent Herbaceous Wetlands
Forests were divided by age and protected status based on data from 2011 to 2021. Of the 1,331 hectares of forest in Custom uploaded polygon in 2021, 856 are old growth, 8,295 are mature, 5,305 are young, and 7,870 are of an indeterminate age. Of the same 1,331 hectares of forest, 104 are highly protected, 21,626 are under medium protections, 17 are under low protections, and 579 are unprotected.
Ta.le 2c Forest area .y maturity 'lass and GA4 prote'tion status
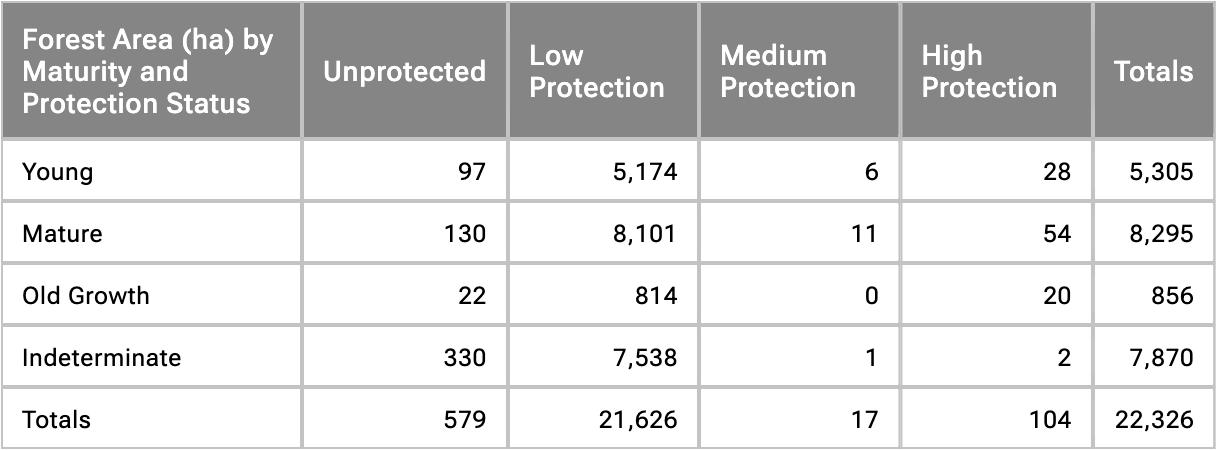
Figure 5c 4roportions of area 3it&in ea'& maturity and GA4 prote'tion status
Forest 4rote'tion Statuses
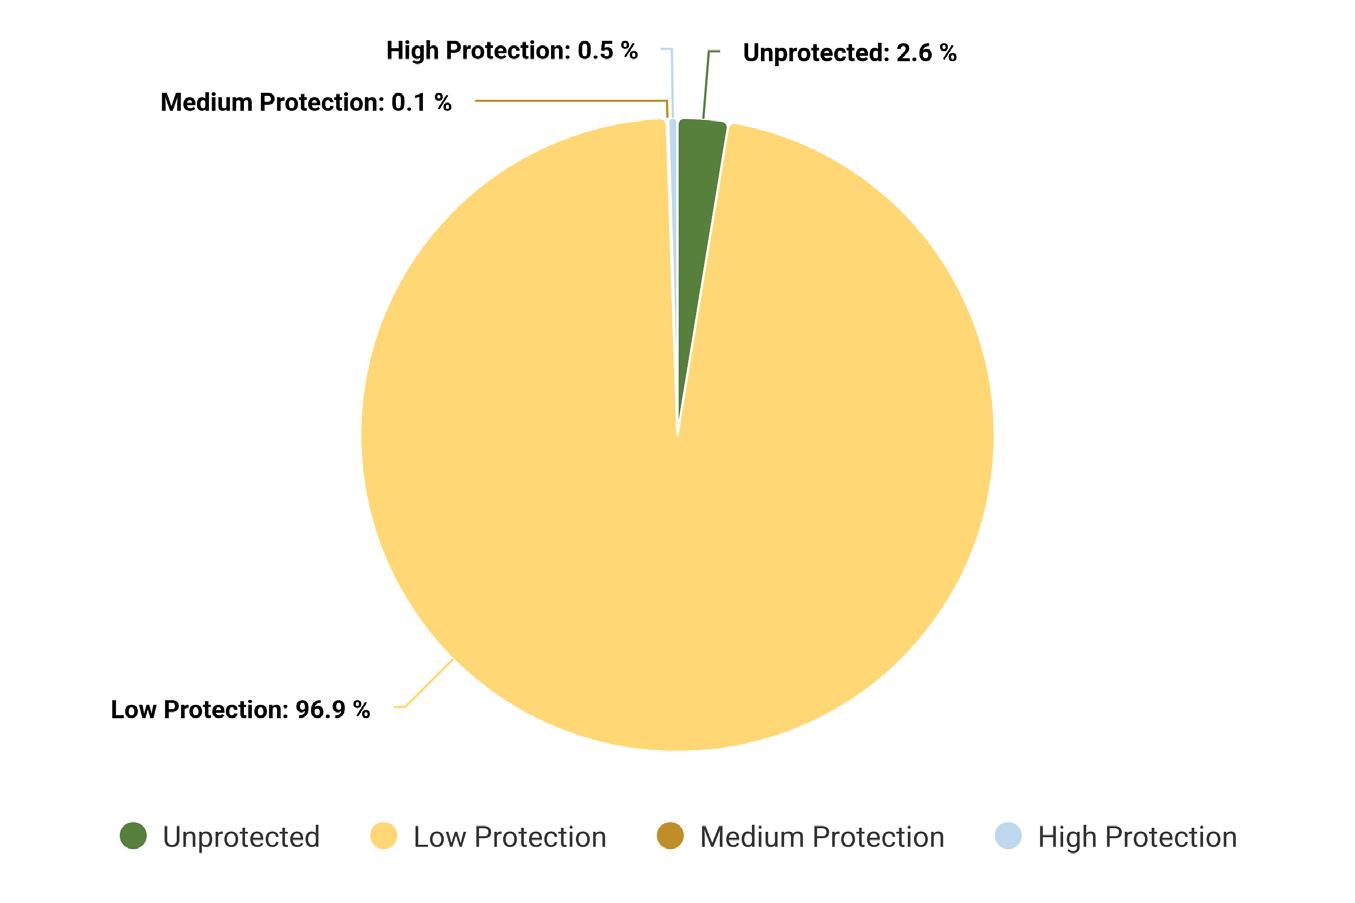
Forest 4rote'tion Statuses Forest Age
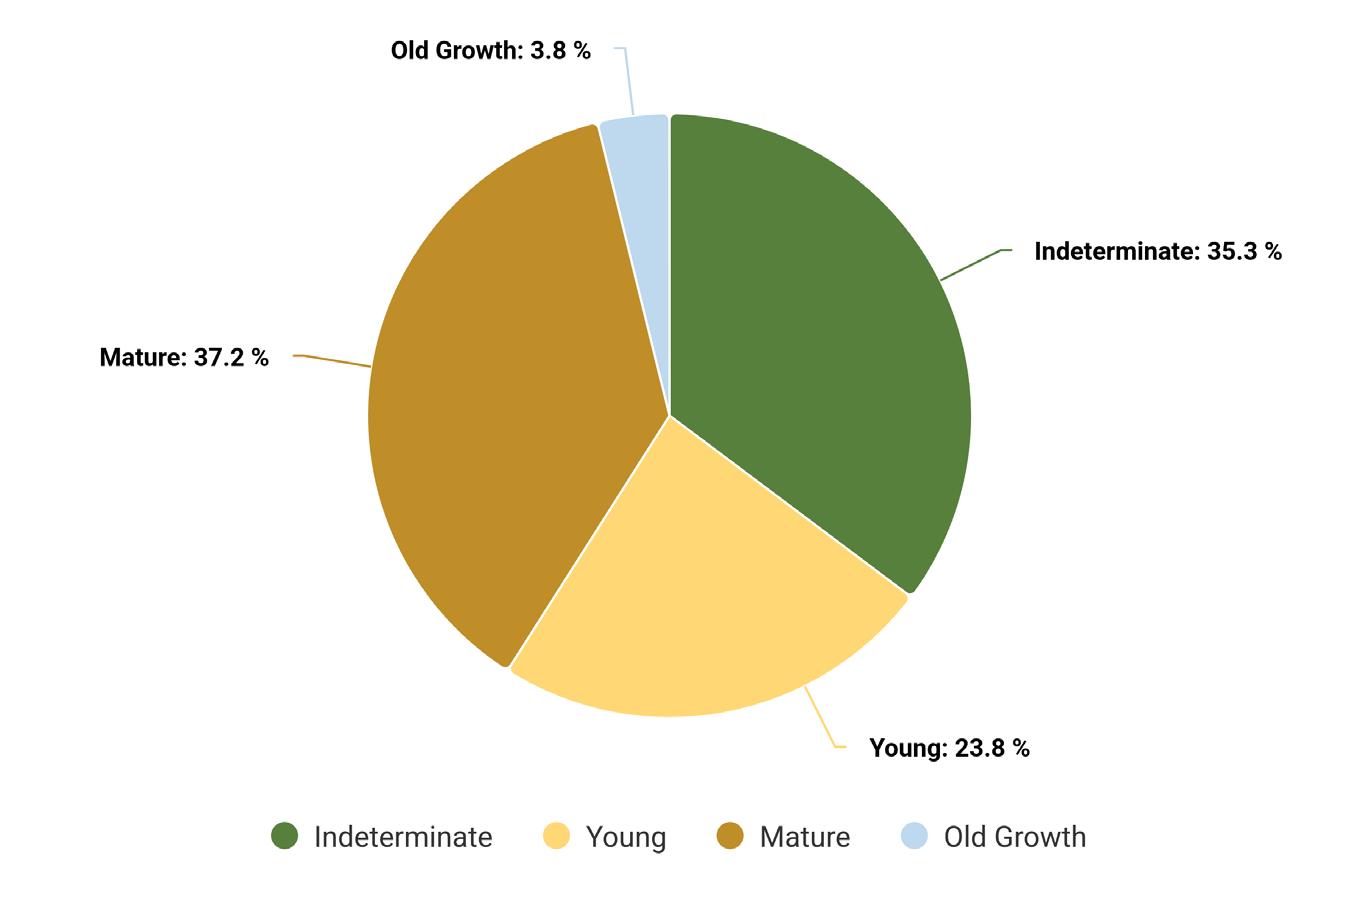
/ 9
Report generated on 2025-05-03
Generating GHG estimates requires data on land use areas and how they have changed over time. Between 2011 and 2021, the county lost around 4,822 hectares (11,915 acres) of forest land, largely conversion to grassland. Over the same period, the county gained around 105 hectares (260 acres) of forest land, largely from grassland. It is often the case that forest cover indicates changes from forest to grassland and grassland to forest, but that these changes are actually temporary loss of tree cover from forest remaining forest following disturbance or harvesting.
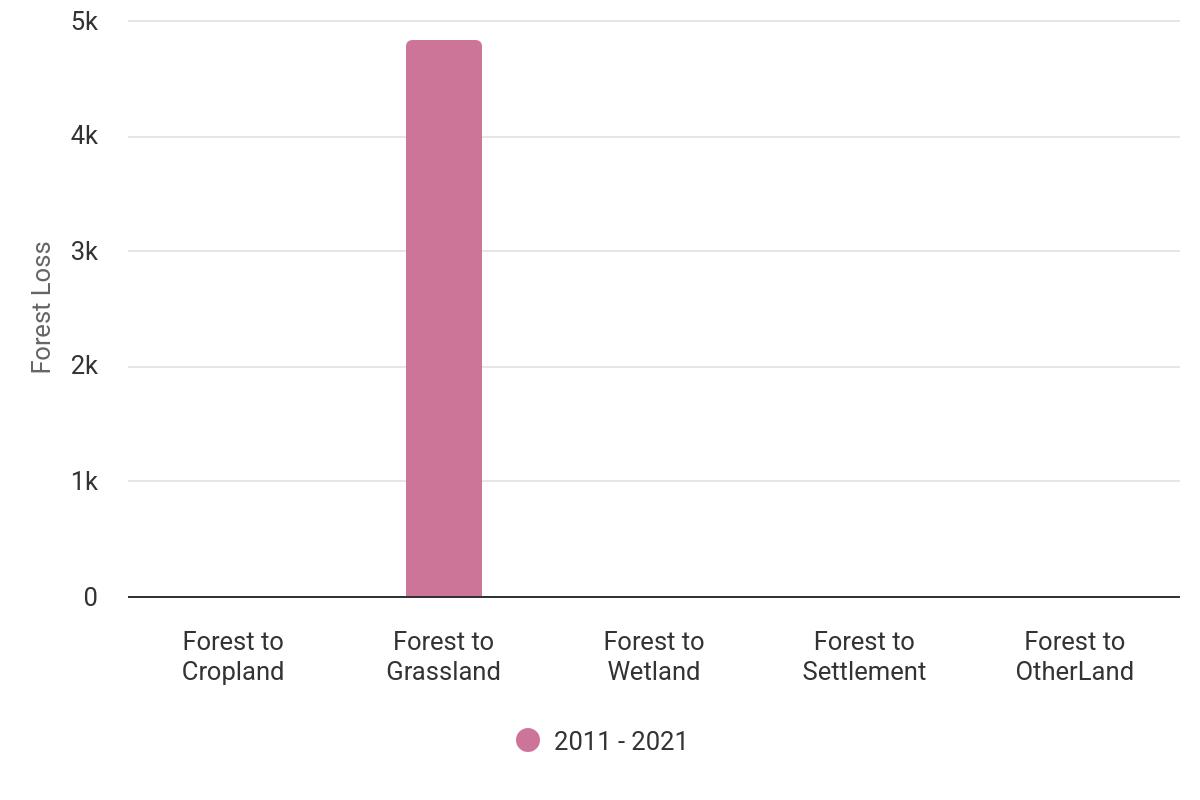
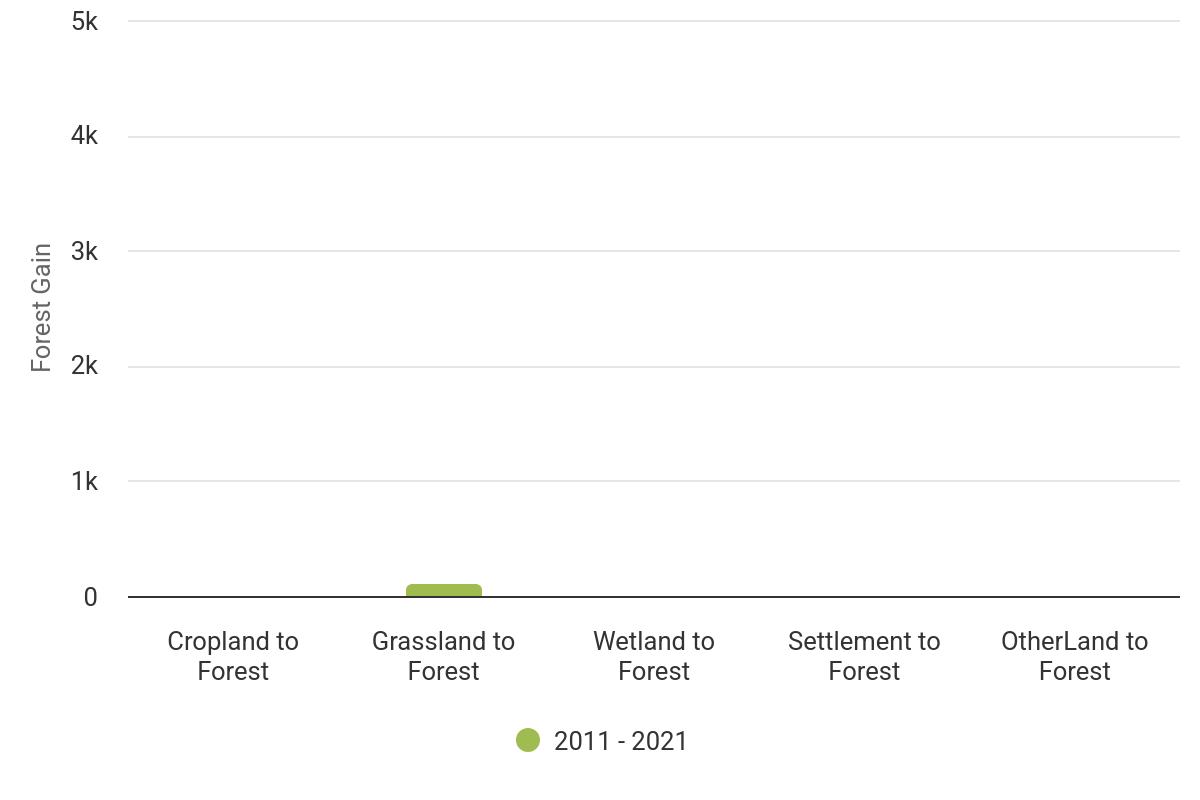
Over the inventory period 2011 to 2021, forest disturbance affected a total of 22,326 hectares (55,169 acres) of Custom uploaded polygon County. Forest disturbance from insects was the most significant disturbance in Custom uploaded polygon County, affecting 22,326 hectares (55,169 acres), followed by fires, which affected 130 hectares (320 acres) and harvests, which affected 10.2 hectares (25 acres).
4 / 9
Report generated on 2025-05-03
Figure 5 shows tree canopy captured by the NLCD tree canopy data. (Note that some areas with high tree canopy in Figure 5 overlap with the NLCD forest class shown in Figure 2.)
Over the time period 2011 and 2021, Custom uploaded polygon County had an average of 1,331 hectares (3,288 acres) of tree canopy outside forests. Between 2011 and 2021, 67 hectares per year of tree canopy were lost, for a total of 334 hectares (827 acres) of tree canopy loss over the year period. Most of this loss occurred within the Grassland class.
Figure %c Tree 'anopy 2021 (Sour'eb National Mand Cover hata.ase)
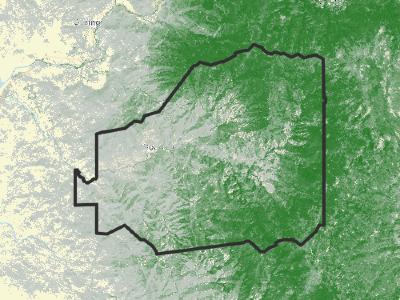

Figure “b Average tree 'anopy (in &e'tares) and ” tree 'anopy in di8erent non-forest land use 'ategories in Custom uploaded polygon County for t&e period 2011-2021
Noteb .ars relate to tree 'anopy area (left verti'al-aDis, &e'tares) and dots are t&e ” tree 'over per land use 'ategory (rig&t verti'al-aDis)c EOt&erW 'ategory not s&o3n due to very lo3 areac
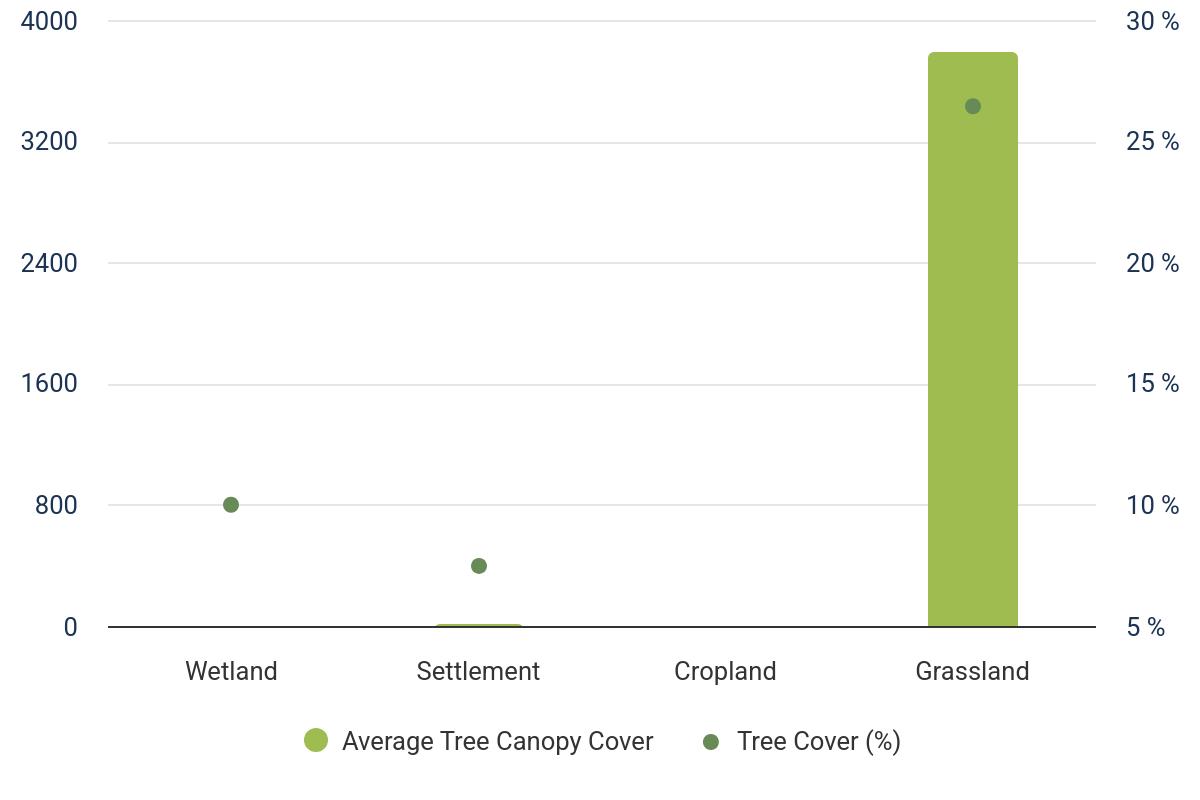
�igure �b �verage area o� tree 'anopy loss in di�erent non��orest land use 'ategories in Custom uploaded polygon County over t&e period 2011 to 2021 (&e'tares per year)c Noteb ot&er 'ategory not s&o3n due to very lo3 areac
Figure “b Average tree 'anopy (in &e'tares) and ” tree 'anopy in di8erent non-forest land use 'ategories in Custom uploaded polygon County for t&e period 2011-2021 Noteb .ars relate to tree 'anopy area (left verti'al-aDis, &e'tares) and dots are t&e ” tree 'over per land use 'ategory (rig&t verti'al-aDis)c EOt&erW 'ategory not s&o3n due to very lo3 areac 5 / 9
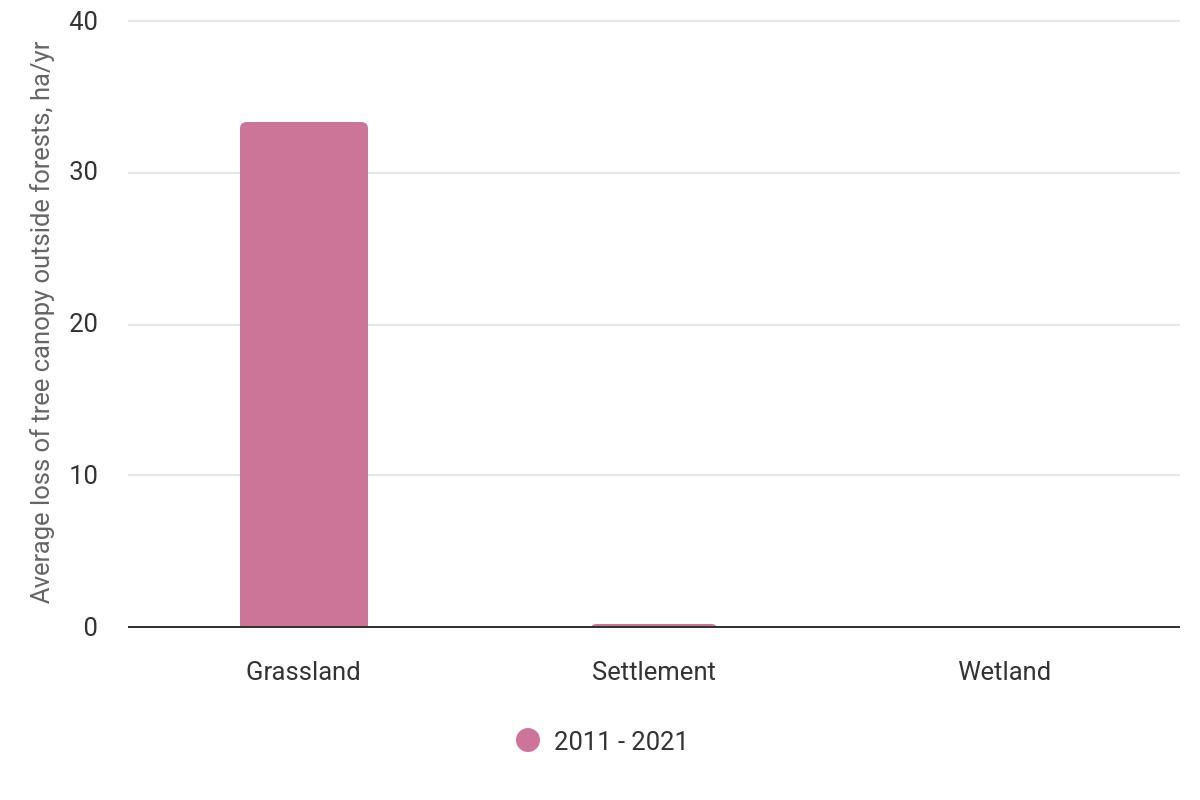
Report generated on 2025-05-03
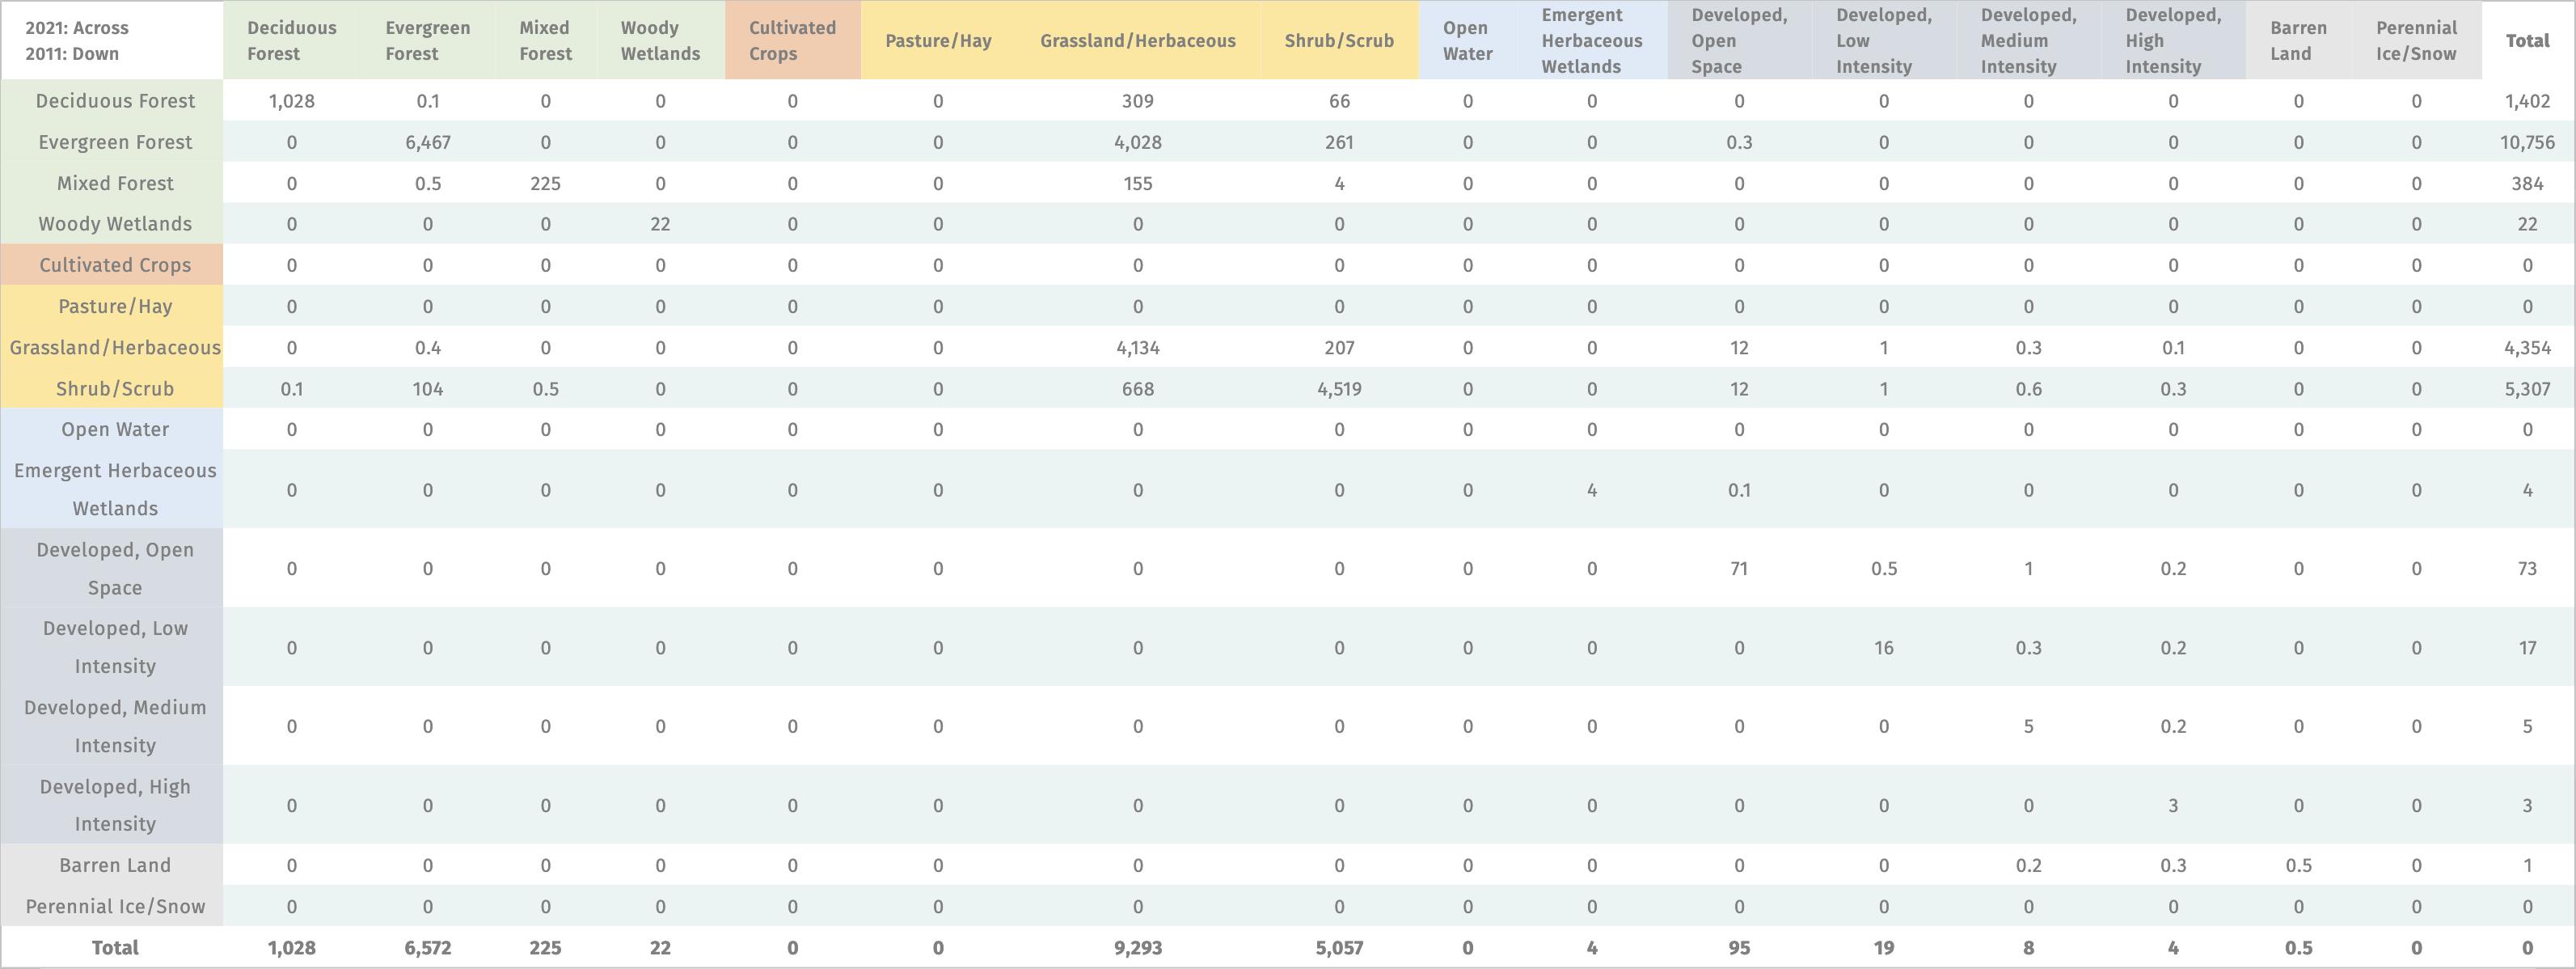
Ta.le 6c Simpli:ed land 'over '&ange matriD for 2011 to 2021cAll areas are in &e'taresc
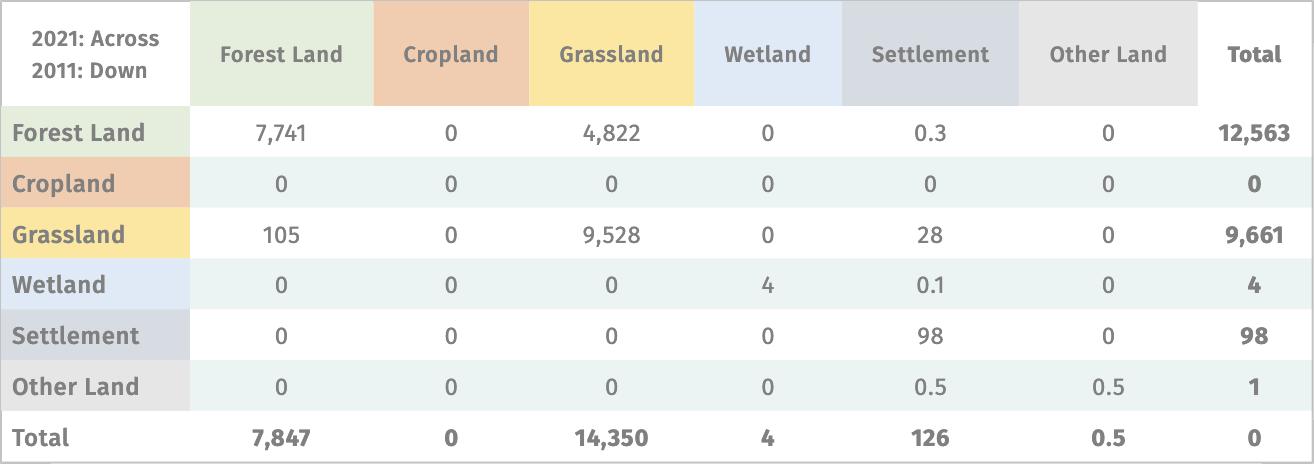
�mission and �emoval �a'tors
Table 5: Summary of the emission and removal factors.
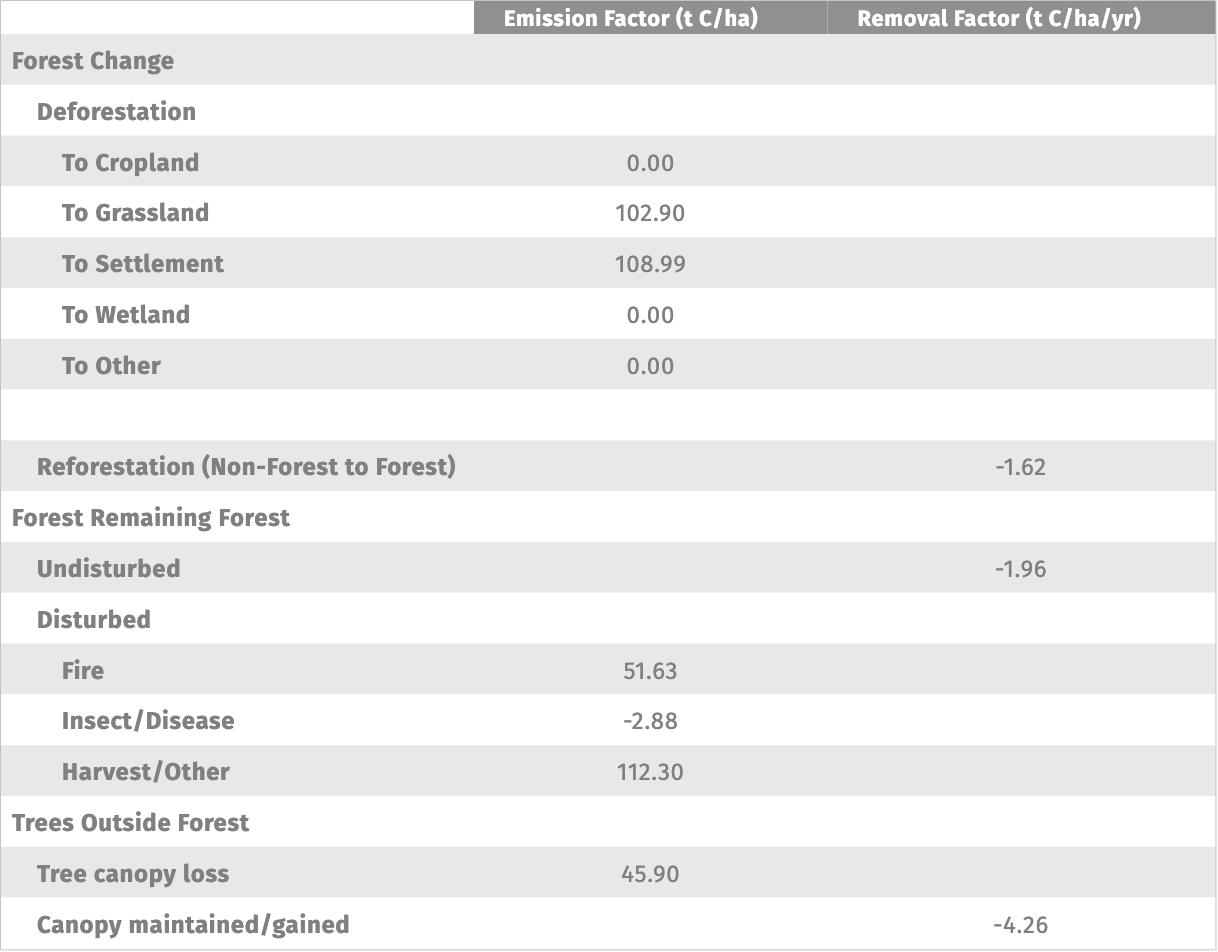
�arvested �ood �rod�'ts
Harvested wood products (HWP) temporarily store carbon from the forest ecosystem as the wood goes through a series of production processes and end-uses, with eventual disposal (and emission to the atmosphere). The delay represents a net benefit to the atmosphere in the short term. The period of storage varies from long-lived solid wood products that remain in use for long periods of time to products that are quickly disposed of in landfills.
In the web tool, the HWP Calculator tracks carbon in harvested wood through four different “fates,” from harvest to timber
Harvested wood products (HWP) temporarily store carbon from the forest ecosystem as the wood goes through a series of production processes and end-uses, with eventual disposal (and emission to the atmosphere). The delay represents a net benefit to the atmosphere in the short term. The period of storage varies from long-lived solid wood products that remain in use for long periods of time to products that are quickly disposed of in landfills.
In the web tool, the HWP Calculator tracks carbon in harvested wood through four different “fates,” from harvest to timber products to primary wood products to end-use to disposal, applying best estimates for product ratios and half-lives at each stage. Based on user inputs entered about annual harvest volumes in Custom uploaded polygon County, the change in the harvested wood pool over the inventory period 2011 to 2021 is estimated as 0 t CO2e per year.
8 / 9
Report generated on 2025-05-03
The LEARN tool is intended to provide communities and land managers with a quick and straightforward method to estimate and understand GHG fluxes from forests and trees and how they are changing over time. These estimates can help identify the role that existing forests and trees play in a communityʼs overall GHG inventory and where policies may be designed to reduce net GHG emissions from forests and trees. The LEARN tool is limited in scope to assessing land-use changes involving forests and TOFs and does not currently address other major land uses that can have significant GHG emissions, such as cropland and pasture.
The LEARN tool is designed to save users the significant time and effort of conducting their own GHG inventory for forests and trees. Additionally, the toolʼs standardized methodology facilitates regional and temporal consistency in GHG reporting and can be used to create data-oriented benchmarks for reducing net GHG emissions. However, there are some limitations to the scope and applicability of these estimates.
Information obtained from the LEARN tool should be understood and applied in the context of its intended uses and scope of analysis. There are potential sources of error and uncertainty in these estimates, given the modeled nature of many of the datasets used. At the time of publication, the LEARN tool cannot be used to generate or verify carbon credits. In general, we recommend that users conduct additional analysis and verification when seeking to use results in policy or land management decisions and take care to understand and communicate the limitations of LEARN estimates.
The LEARN tool uses the best available nationally consistent operational datasets. Nevertheless, varying degrees of accuracy and uncertainty are associated with each of these datasets. When multiple spatial datasets with distinct inaccuracies and imprecisions are combined in an analysis, errors may be compounded. Although individual uncertainties for data inputs may be estimated, there is no standardized method for reporting uncertainty in final calculations that can be applied automatically across all potential scales of analysis. While uncertainties can be high, the estimates can still provide useful information on the relative magnitude and importance of such GHGs; subsequent analyses can also provide information on the directionality of emissions and removals from land management.
Because the majority of LEARN data inputs are at a 30-meter or coarser resolution, applicability at smaller scales (areas less than one hectare) may be limited. For example, the resolution of land cover change analyzed in the LEARN tool may be too coarse to accurately characterize fluxes on individual parcels or groups of parcels under similar management. When using remote sensing products and geographic information systems, errors tend to normalize at larger scales of analysis. Smaller scales may be subject to larger uncertainties and are less suitable for analysis using the automated LEARN tool.
Estimates of emissions from forest disturbances may also be subject to further uncertainty. Because no national operational data product currently exists to track disturbances from harvest, areas of harvest are delineated based on key assumptions. The logic for defining areas of harvest assumes that any tree cover loss in forests remaining forests that are not characterized as fire or insect and disease are likely to represent harvest, though there will be occasions when the true disturbance is wind or weather. This logic compounds potential errors in the fire, insect and disease, and tree cover loss datasets. We suggest that communities seeing significant areas of harvest disturbance conduct additional analysis to investigate the cause of disturbances in these errors and make informed policy decisions.

GOVERNMENT PROGRAMS
Inflation Reduction Act (IRA) provides a variety of programs, including Clean Energy Tax Credits in the form of Investment Tax credits or Production Tax credits.
• "Investment Tax Credits—dollar-for-dollar credits to offset expenses—for investments in renewable energy projects and the build out of manufacturing facilities to produce parts and materials for clean energy projects and clean vehicles."
• "Production tax credits provide a rebate based on the amount of a relevant product made by an entity. One example is a rebate per kilowatt of electricity produced by a renewable source. These can also apply to manufacturing—a production tax credit would provide a certain amount for each blade or solar panel component produced."
• Projects that begin construction after 2021 and before 2025 can receive the full tax credit of 30%; for public institutions the credit may be available as a cash payment.
IRA includes funding for over 120 new and existing programs, including but are not limited to:
• Energy Investment Tax Credit (ITC) Extension (Sec. 13102)
Provides investment tax credits for clean energy projects, including wind, solar, geothermal, battery storage, and hydro.
• Clean Energy Production Tax Credit (PTC) Extension (Sec. 13101)
Offers production tax credits for clean energy generation, such as solar, wind, and geothermal, based on the amount of electricity produced.
• Commercial Clean Vehicle Tax Credit (Sec. 13403)
Provides tax credits for businesses purchasing clean vehicles, covering up to 30% of the cost for electric vehicles.
FEDERAL PROGRAMS
• Alternative Fueling Property Credit (Sec. 13404)
Offers tax credits for installing EV charging stations and other alternative fueling infrastructure, with a maximum of $100,000 per property.
• Clean Energy Production Tax Credit (PTC) Technology Neutral (Sec. 13701)
Provides tax credits for energy projects with net-zero carbon emissions, applicable to various clean energy technologies.
• Clean Energy ITC Technology Neutral (Sec. 13702)
Investment tax credit for any clean energy technology achieving net-zero carbon emissions, with eligibility extending into the 2030s.
• Title 17 Innovative Clean Energy Loan Guarantee Program (Sec. 50141)
Allocates $40 billion in loan guarantees for clean energy projects under the Energy Policy Act of 2005.
• Clean Heavy-Duty Vehicle Program (Sec. 60101)
Funds zero-emission replacements for heavy-duty vehicles, along with infrastructure, workforce training, and technical support.
• Greenhouse Gas Reduction Fund - Solar for All Program (Sec. 60103)
Grants for states, tribes, and municipalities to expand solar access in low-income and disadvantaged communities.
• Methane Emissions Reduction Program (Sec. 60113)
Provides funding and technical assistance to reduce methane emissions from petroleum and natural gas operations.
• Neighborhood Access and Equity Grant Program (Sec. 60501)
Grants to improve community walkability and connectivity through road and highway modifications.
Additional Federal Programs include, but are not limited to:
• DOT Surface Transportation Block Grant Program: Provides funding for public road infrastructure, pedestrian and bicycle pathways, and transit capital projects.
• DOT Transportation Alternatives Program: Supports projects such as pedestrian and bicycle facilities, safe routes to schools, and other related initiatives.
• DOT RAISE Grants: Allocates funding for surface transportation projects, including roads, rail, transit, and ports, that align with national objectives. For FY24, $1.5 billion is designated to support projects with significant local or regional impact.
• Charging and Fueling Infrastructure (CFI) Grant Program: Funds the deployment of publicly accessible electric vehicle charging stations and alternative fueling infrastructure.
• Safe Routes to Schools: A global initiative aimed at increasing the number of children who walk or bike to school by funding projects that eliminate barriers such as insufficient infrastructure, safety concerns, and limited walking and bicycling programs. In Ohio, $5 million is allocated annually to implement this program.
• Federal Transit Authority (FTA) Grants for Buses and Bus Facilities Program: Provides capital funding for bus replacement, rehabilitation, and the purchase of buses and related equipment.
• Diesel Emissions Reduction Act (DERA) Program: Offers grants and rebates to reduce harmful emissions from diesel engines.
FEDERAL PROGRAMS
• U.S. Department of Energy (DOE): Provides grants and financial incentives to local governments for renewable energy installations and alternative fuel vehicles and fueling infrastructure projects.
• WaterSense: A voluntary partnership program sponsored by the U.S. Environmental Protection Agency, serving as both a label for water-efficient products and a resource for businesses and residents seeking to conserve water.
• Energy Efficiency and Conservation Block Grant Program (EECBG): Provides funding to local governments for energy efficiency and conservation projects.
• Weatherization Assistance Program (WAP): Supports home energy efficiency improvements with funding, typically up to $6,500 per home.
• Low Income Home Energy Assistance Program (LIHEAP): A federal program administered by the U.S. Department of Health and Human Services that assists eligible low-income households in managing home heating and cooling expenses through bill payment aid and weatherization improvements.
• 179D Tax Deduction for Energy Efficiency: Section 179D of the U.S. tax code offers a tax deduction for commercial building owners or designers implementing energy-efficient upgrades. Eligible projects may receive up to $1.88 per square foot for lighting, HVAC systems, and building insulation improvements, including window enhancements.
• Solar Energy System Tax Credits: Provides tax credits for solar water heaters and photovoltaic (PV) systems for residential and commercial properties. Eligible participants can receive a federal tax credit covering 30% of the total system cost.
• FEMA Pre-Disaster Mitigation Program: Offers grants for long-term risk reduction projects aimed at minimizing the impact of hazards and climate-related events, thereby reducing future federal disaster recovery reliance. Eligible projects include generator installations at critical facilities and various mitigation construction efforts.
• North Carolina's Utility Savings Initiative (USI): Promotes energy savings in the state.
• Energy Star Plus State Rebate Program: Provides rebates to residential customers for installing certain energy-efficient appliances and equipment that are Energy Star certified. Rebates typically range from $50 - $500 per appliance.
• Energy Improvement Loan Program (EILP): Low-interest loans to fund energy efficiency, renewable energy, and water conservation projects for commercial, industrial, nonprofit, schools, and local government customers.
• North Carolina Energy Efficiency Rebates: Offers rebates for homes/businesses implementing energy-efficient solutions; amounts vary by project.
• North Carolina Department of Environmental Quality (DEQ) Volkswagen Settlement Mitigation Program: Funds for zero-emission vehicle infrastructure and transportation, $92 million through 2027.
• North Carolina Energy Office Appliance Rebate Program: Rebates for purchasing energyefficient appliances. Varies based on products.
• North Carolina GreenPower Production Incentive: Payments for renewable energy produced; varies based on system size and energy generated.
• North Carolina Green Business Fund: Offers grants and loans to small businesses and farms for implementing renewable energy, energy efficiency, and other sustainable practices.
• Clean Water State Revolving Fund: Provides low-interest loans to commercial, industrial, nonprofits, schools, and local governments for funding a wide range of water infrastructure projects.
• General Funds: Budgetary resources allocated within the City’s operating budgets for broad, non-specific purposes. These funds can be directed toward environmental projects and sustainability initiatives at the discretion of City governance.
• Capital Funds: Financial resources designated for acquiring or maintaining fixed assets such as land, buildings, and equipment. These funds can support investments in sustainable infrastructure and green technology.
• Green Revolving Fund: A self-sustaining financial mechanism that reinvests savings from energy efficiency projects into further sustainability initiatives. By creating a continuous cycle of investment and cost savings, this fund enhances the City’s commitment to environmental responsibility and carbon neutrality.
ENERGY PERFORMANCE CONTRACTS (EPC)
PUBLIC-PRIVATE PARTNERSHIPS (PPP)
INFRASTRUCTURE AS A SERVICE (IAAS)
• Energy Efficiency Agreements are contracts that finance energy upgrades, where repayment is made using a portion of the cost savings generated from improved efficiency.
• Private investors can offer funding to local governments for sustainability initiatives. For instance, energy service companies may cover the upfront costs of energy efficiency improvements, with local governments reimbursing them over a contractual period. Similarly, private companies can finance solar power installations and recover their investment by selling the generated electricity to the building owner.
• Local governments can adopt solar PV systems without upfront costs through a power purchase agreement (PPA) with a developer. The developer, using thirdparty financing, handles the system’s design, construction, and installation. The investor funding the project earns revenue through fixed-price payments from the government, functioning similarly to a utility bill. This model allows local governments to benefit from lower energy costs, reduced greenhouse gas emissions, and stable long-term pricing without requiring initial capital investment.
SPECIAL BENEFIT-BASED ASSESSMENTS
SPECIAL TAXES
PROPERTY TAX INCREMENT
UTILITY USER TAX
ENTERPRISE FUND
CONGESTION PRICING
• Special benefit-based assessments, such as the Community Improvement Fee, are levied on property owners to fund neighborhood enhancements, ensuring continuous improvements in local communities.
• Special taxes play a crucial role in funding environmental and infrastructural projects. The Open Space Preservation Tax is imposed on properties to support the preservation of county open spaces and green areas.
• One example of this mechanism, tax increment financing, directs incremental property tax revenue toward development projects.
• One such tax could be an Energy Consumption Tax, a county-imposed tax on utility service consumption, such as natural gas, to generate revenue
• Enterprise funds, such as the Waste Management Fund, are self-sustaining financial resources generated from county-owned enterprises, ensuring long-term sustainability in waste management initiatives.
• To manage urban congestion, Traffic Congestion Charges can be imposed as user fees aimed at reducing traffic congestion and raising funds for transportation projects
GREEN BOND
• Green financing mechanisms play a vital role in sustainability efforts. Environmental Impact Bonds (Green Bonds) are issued to fund capital improvements with an environmental focus.
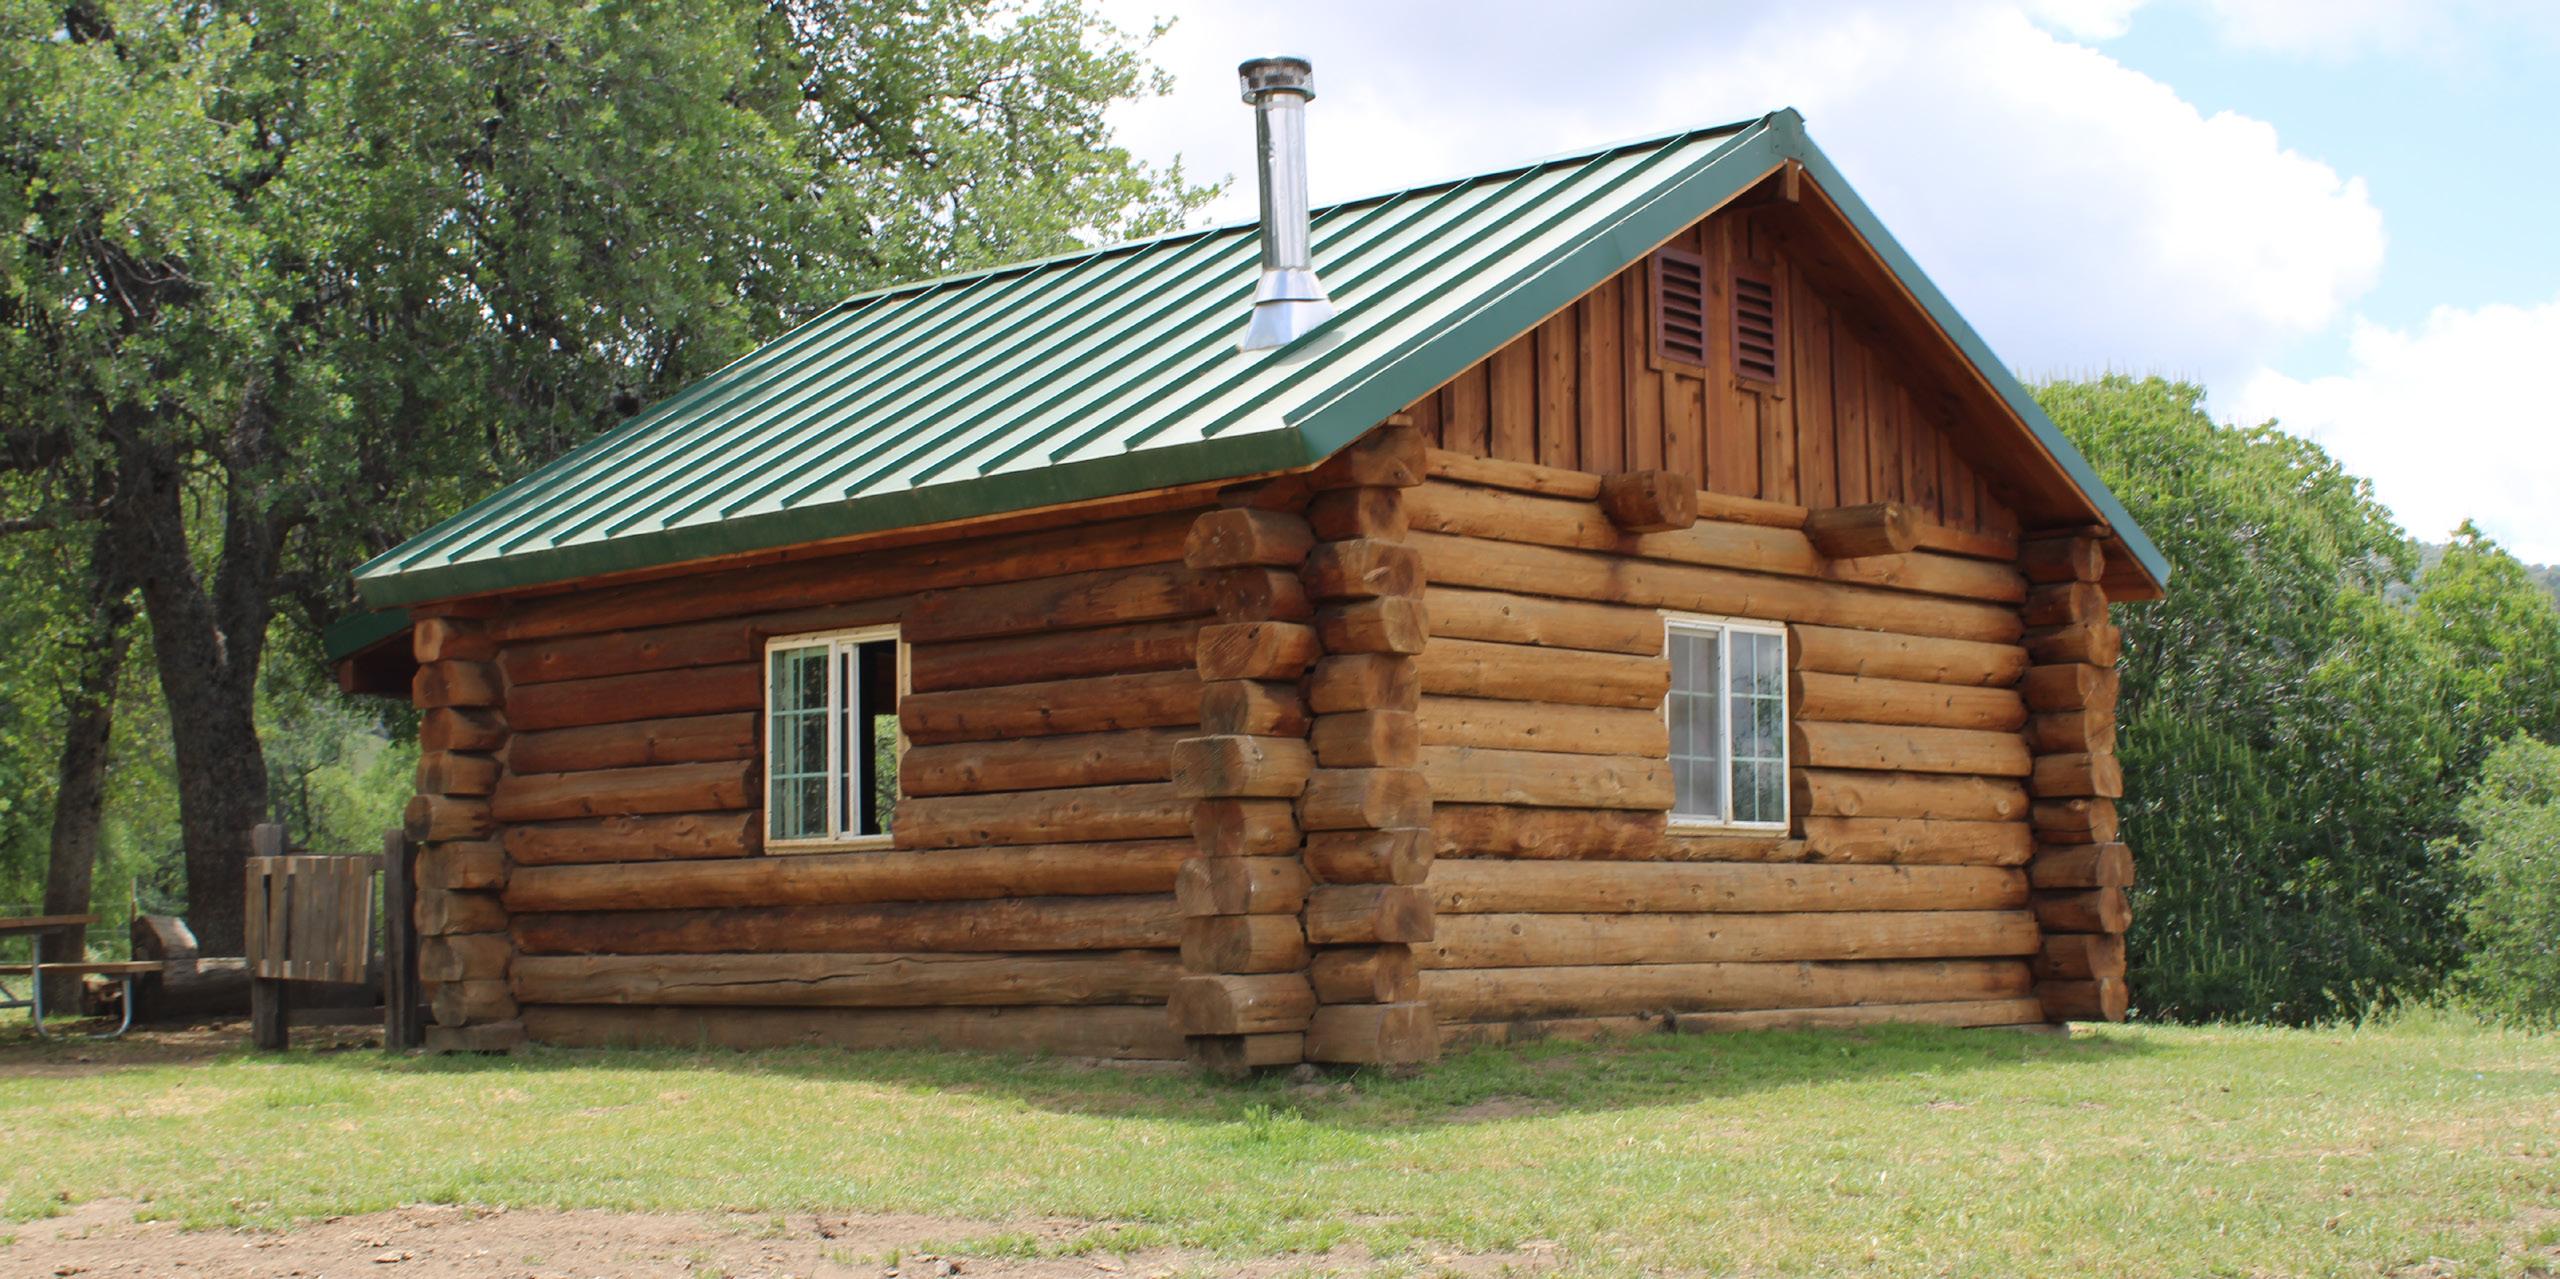
Complete a Feasibility Study and Implementation Plan to Develop a Tribal Utility Authority
Measure 1 outlines the Tule River Indian Tribe's initiative to evaluate the creation of a Tribal Utility Authority (TUA) to enhance energy sovereignty, improve grid reliability, and promote economic development. The Tribe currently relies on two Southern California Edisons (SCE) circuits prone to blackouts, which endanger essential services like healthcare. Establishing a TUA would allow for local control of electricity services, supporting tailored energy solutions, renewable energy integration, and job creation. The feasibility study encompasses five key tasks: evaluating utility operations, mapping existing infrastructure, designing an organizational framework, planning workforce needs, and delivering comprehensive findings. The project, launched in February 2025, is expected to run for 12 months with a total cost of approximately $255,592, partially funded by a Bureau of Indian Affairs (BIA) grant. The measure aligns with tribal governance structures and is expected to yield long-term benefits, including energy and cost savings, emissions reductions, and strengthened tribal self-determination. To quantify potential Greenhouse Gas (GHG) emission and cost reductions from this measure, a counterfactual scenario was envisioned that included the eventual establishment of the TUA, which enabled procurement of renewable electricity at terms that did not include SCE’s standard rate of return of 10.75%. The scenario involved gradually increasing the share of electricity that is directly purchased by the tribe, from wholesale vendors, by 10% each year, until 100% was purchased through direct contracts. This means that each year, the Tribe would realize 10% new emissions reductions from the baseline of utility grid-delivered emissions. These reductions would accumulate, so that in year two, 20% would be saved, and so on. Cost reductions were based on the share of power purchased from wholesale markets rather than from the utility. Each year, a lower cost would be achieved, because each year an additional 20% of electricity would be purchased that did not include the 10.75% margin.
The following are several assumptions that were used in the calculations:
Table E1: Foundational Assumptions Used to Model Potential GHG Emission Reductions From Outcomes Associated With Measure 1
Table E2: Electricity Consumption FY 2024
Table E3: Emission Factors (EF)
Table E4: Measure Impacts
Measure 2 proposes transitioning all government buildings on the Tule River Reservation from analog to smart electricity meters to modernize energy management and lay the groundwork for future grid control under a TUA. The adoption of smart meters will enable real-time monitoring of energy use, improve operational efficiency, identify savings opportunities, and support resilience during power disruptions. The plan includes auditing existing metering infrastructure, evaluating technology compatibility, planning procurement and installation, integrating smart meters with energy data platforms, and training facility managers. This foundational step in the Tribe’s broader climate strategy is contingent on the TUA’s establishment, expected in 2026, and is projected to be completed within three years. The estimated cost is $121,250, and funding may be secured from a range of federal and state programs. Ultimately, this measure aims to improve energy efficiency, reduce GHG emissions, and empower the Tribe with data-driven control over its energy infrastructure.
To quantify potential GHG emissions and cost reductions from this measure, a counterfactual scenario was envisioned that included meter replacement over 3 years for all government buildings. Energy savings from this intervention were assumed to be 1.8% from a baseline. The costs for the new “smart” meter installations were assumed to be $121,250 for 26 total meters. The following are the assumptions used in the model and several key results.
Table E6: Key Results From Measure 2
Measure 3 outlines the Tule River Indian Tribe’s plan to transform the former Eagle Mountain Casino into a high-performance Government Center through a deep energy retrofit. This comprehensive renovation aims to achieve Leadership in Energy and Environmental Design (LEED) Platinum standards and support the Tribe’s goals for energy independence, GHG emissions reduction, and climate resilience. The 30,000-square-foot building, formerly used for gaming, will undergo upgrades that include a high-efficiency building envelope, full electrification of HVAC and kitchen systems, on-site solar PV generation, battery energy storage, and smart energy management technologies. The project also integrates EV charging infrastructure and will serve as a community emergency shelter during extreme events. Implementation spans five phases, from audit and design to commissioning and public launch, over a two-year period starting in 2025. The project, managed by the Planning and Community Development Department, includes coordination with key partners and tribal oversight bodies. With a projected cost of $3.3 million, Measure 3 represents a flagship sustainability initiative, delivering emissions reductions, operational savings, and resilient infrastructure for tribal members.
To quantify potential GHG emissions and cost reductions from this measure, we first estimated the change in energy consumption that would occur with a change in the facility’s function as a casino to a more traditional building, including office hour operations (instead of 24/7 operations). That conversion formed the new baseline, which can be seen in Table E7 below.
Then, a counter factual scenario was envisioned that includes: 1) converting propane heat and other applications to electrical; 2) energy efficiency measures including LED lighting retrofits, smart thermostats and controls, envelope improvements (new windows, insulation, doors, etc.) and a “cool” roof with reflective coating; and, 3) installing 670kW of onsite solar.
The “electrification” of building systems from propane to electricity switches the total energy mix to electricity. Energy efficiency measures are assumed to reduce total energy use by up to 45% over the previous efficiency during the building’s operation as a casino. And, the onsite solar PV installation would supply approximately 1,173,003 kWh of electricity per year. The following tables provide key assumptions and results from these interventions.
Results show significant cost and emissions savings. Cost savings lead to a robust net present value and internal rate of return (two important financial decision making indicators), along with a relatively short payback period.1 These indicators are even better under a TUA as proposed above.
Table E11: Financial Metrics Without Electricity Price Discounts That Arise from a TUA
1 (NPV) is the total value of future cash flows from an investment, discounted back to today's dollars, minus the initial cost. Internal rate of return (IRR) is the discount rate at which the NPV equals zero, representing the expected annual return on the investment. The payback period is the amount of time it takes for the investment to generate enough cash flow to recover the initial cost.
Table E12: Financial Metrics With Electricity Price Discounts That Arise from a TUA
Table E13: Emission Factors
Table E14: GHG Reductions
Measure 4 supports the Tribe’s efforts to improve energy efficiency and reduce operating costs across selected Tribal government buildings. Some of these facilities rely on outdated HVAC systems, inefficient lighting, and substandard insulation. This measure proposes a phased, coordinated strategy to upgrade these systems, improve indoor comfort, and extend building life while achieving meaningful reductions in electricity use and greenhouse gas emissions.
The measure comprises five key components: (1) conducting comprehensive energy audits to identify the most impactful retrofit opportunities; (2) upgrading lighting systems to high-efficiency LEDs and replacing aging HVAC equipment with modern, energy-saving models; (3) improving building envelopes by sealing air leaks, upgrading roof and wall insulation, and installing energy-efficient windows where needed; (4) integrating smart thermostats and building controls for better performance and realtime energy management; and (5) training facilities staff to maintain and operate the new systems for optimal long-term efficiency.
Based on standard retrofit performance metrics, energy use across selected buildings is expected to decline by 35%, resulting in reduced utility costs and emissions. Building users will also benefit from improved air quality, temperature regulation, and system reliability, while the Tribe strengthens the sustainability and resilience of its infrastructure. The measure also proposes to replace propane-powered equipment with electric alternatives. The model for this measure accounts for the estimated added electricity to power propane equipment alternatives.
The project began in 2025 and is estimated to be implemented in phases over a 15year period to accommodate funding availability and minimize service disruptions. The estimated cost of the measure’s implementation is $3,100,000. To calculate the NPV and IRR for this measure, it was assumed that a TUA was established, reducing electricity costs by 10.75% and thereby improving NPV and IRR. Without the TUA, financial returns would be significantly less favorable—under a baseline electricity procurement scenario, the NPV would have been $(628,053) and the IRR only 4%.
Ensure All Water Distribution Meters Are SCADA-integrated, and Install SCADA Meters On Wastewater Treatment Infrastructure
Measure 5 supports the Tribe’s efforts to modernize its water and wastewater infrastructure by integrating high-efficiency electric pumps, energy metering, and a Supervisory Control and Data Acquisition (SCADA) system. SCADA integration will allow the Tribe to remotely monitor and control pump performance, flow rates, pressure levels, and electricity consumption in real time. When paired with highefficiency pumps and smart metering, these upgrades will enhance the Tribe’s ability to ensure water availability, reduce energy costs, and optimize system performance under growing demand and climate pressures.
The measure comprises five key components: (1) replacing outdated water and wastewater pumps with high-efficiency electric models; (2) integrating a SCADA system for real-time monitoring and control of tanks, pumps, flow rates, and energy use; (3) expanding electrical metering capabilities to track and manage energy consumption across the full system; (4) enhancing wastewater infrastructure by monitoring lift stations, graywater systems, and agricultural water use; and (5) training Tribal staff to operate, maintain, and optimize the new systems for longterm performance.
According to model-based estimates, these upgrades are expected to reduce electricity use by approximately 25%, leading to a projected annual reduction of over 89,392 kWh. In addition, improved visibility will significantly reduce water losses from leaks and outages and increase the reliability of supply during peak summer demand periods.
The project began in 2025 and is expected to last for 3 years, in coordination with ongoing Indian Health Service infrastructure improvements. The estimated cost of the measure’s implementation is $1,015,000. The NPV and IRR for this measure were calculated based on the assumption that a TUA was established, resulting in a 10.75% reduction in electricity costs and yielding stronger financial performance. In contrast, under a baseline scenario without the TUA, the measure would have produced a negative NPV of $(670,344) and a much lower IRR of -3%.
Table E19. Pump Energy Use Savings Estimates
Variable Frequency Drivers (VFD) retrofits alone
– 20% Typical for systems with moderately oversized pumps or some throttling.
Savings from better scheduling, tank level optimization, peak demand avoidance, reduced cycling.
Conservative estimate of compounded benefits, assuming both technologies are installed and actively used together.
Measure 6 focuses on reducing solid waste sent to landfills by unauthorized waste dumping and enhancing diversion practices, including recycling, organics composting, and Construction and Demolition (C&D) materials recovery. The Tribe currently manages waste through contracted services, with materials collected at a central community transfer station. While limited recycling is performed by part-time staff, the absence of structured diversion programs means most waste, including organics and C&D debris, is landfilled, generating methane emissions and increasing long-term disposal costs.
This measure proposes the development and implementation of a comprehensive waste diversion program that expands recycling infrastructure, introduces sourceseparated organics collection, establishes C&D waste recovery procedures, and improves enforcement against unauthorized dumping. In parallel, the Tribe will continue leveraging its Department of Environmental Protection’s strong education and outreach efforts to build awareness and participation across Tribal members and departments.
The measure comprises four key components: (1) expanding transfer station infrastructure to accommodate organics and C&D sorting; (2) providing education and resources to households and Tribal departments for source separation; (3) enhancing staff capacity and contracting specialized services for material recovery; and (4) enforcing unauthorized dumping deterrents and cleanup protocols. According to the Tribe’s estimate, these initiatives are expected to reduce unauthorized waste dumping by 30%. It’s also estimated that this measure will increase waste diversion to 35%. The project is estimated to start in 2026 and last for 3 years. The estimated cost of the measure implementation is $275,000.
Table E21. Foundational Assumptions Used to Model Potential GHG Emission Reductions From Outcomes Associated With Measure 6
Table E22: Emission Factors for Measure 6
Table E23. Key Results from Measure 6*
*These values were modeled based on the amount of waste provided for the evaluation year
This appendix presents the co-pollutant reductions associated with the six modeled decarbonization measures across electricity, propane, and waste sectors. In alignment with Environmental Protection Agency’s (EPA’s) Climate Pollution Reduction Grant (CPRG) guidance, this analysis quantifies reductions in criteria pollutants and other health-relevant emissions that are co-emitted alongside greenhouse gases.
This appendix presents the co-pollutant reductions associated with the six modeled decarbonization measures across electricity, propane, and waste sectors In alignment with Environmental Protection Agency’s (EPA’s) Climate Pollution Reduction Grant (CPRG) guidance, this analysis quantifies reductions in criteria pollutants and other health-relevant emissions that are co-emitted alongside greenhouse gases
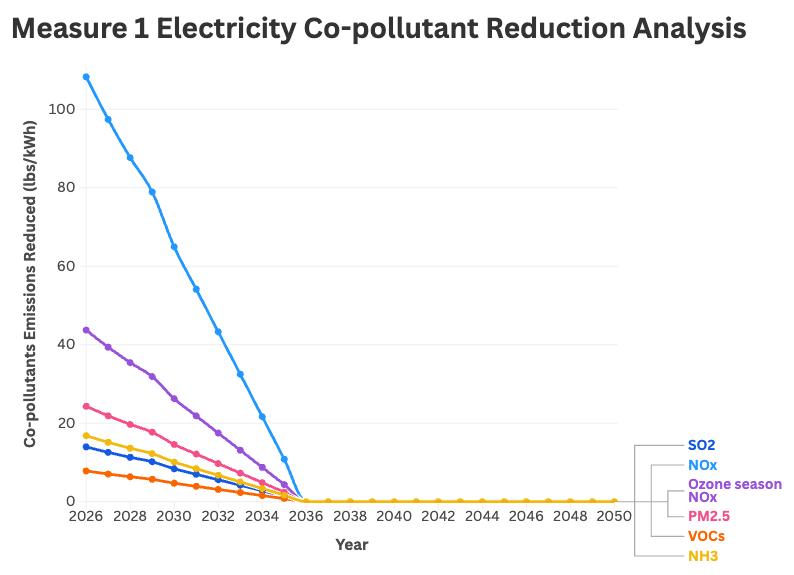
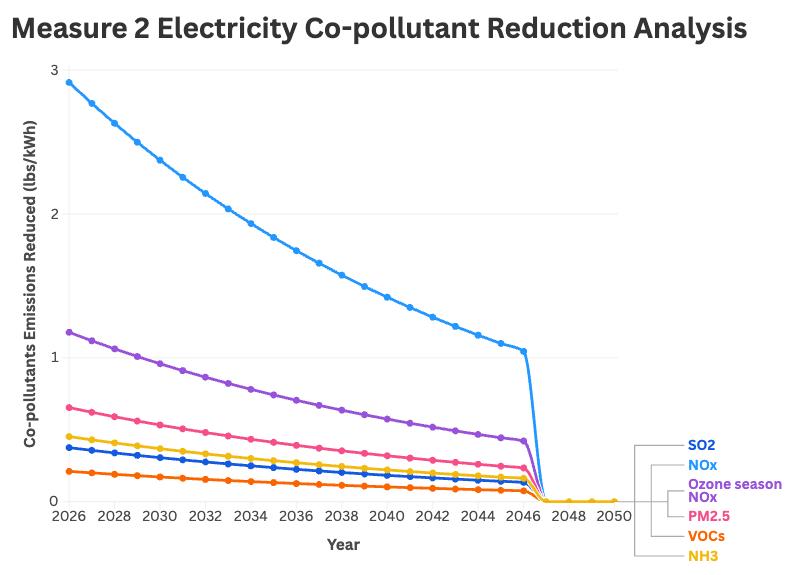
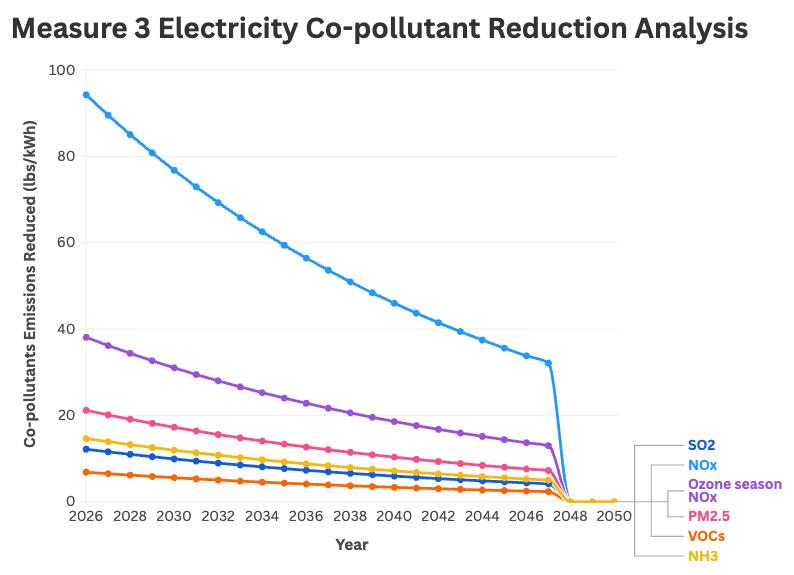
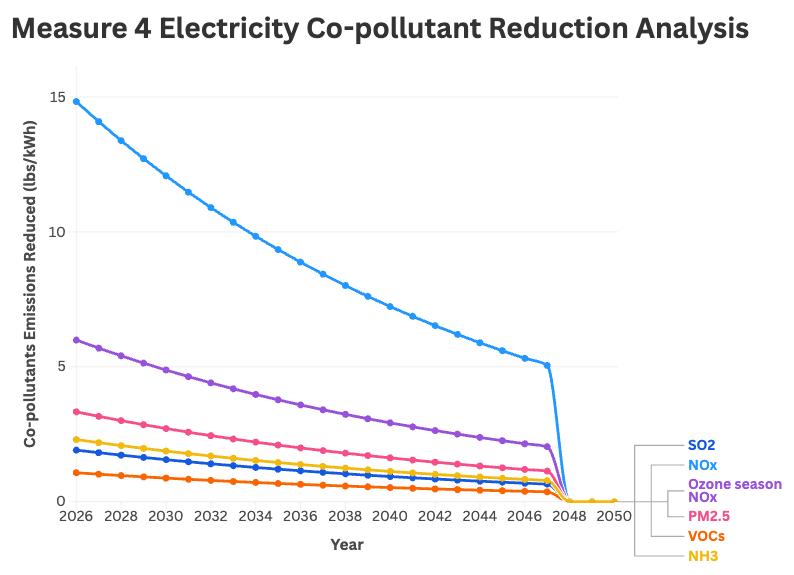
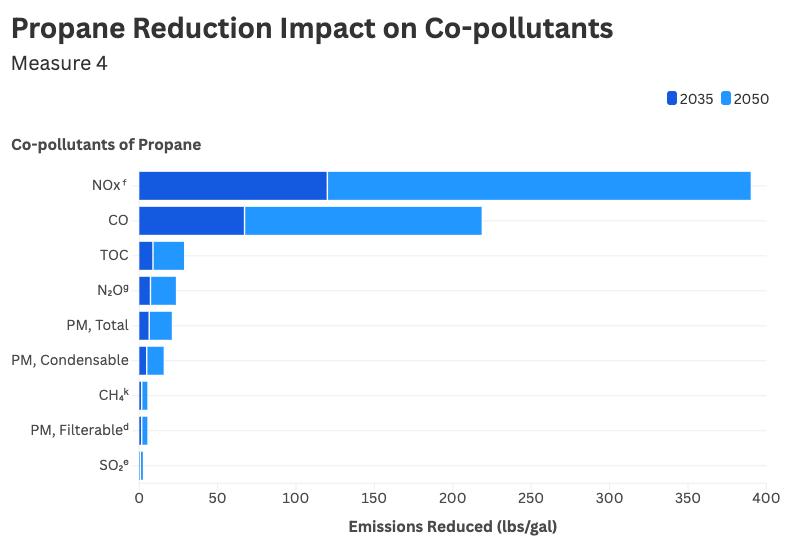
Figure 6E: Waste Reduction Impact on Co-Pollutants
Figure 6E: Waste Reduction Impact on Co-Pollutants
Waste Reduction Impact on Co-Pollutants
Table 1E: Summary of Co-Pollutant Emissions
Table 1E: Summary of Co-Pollutant Emissions
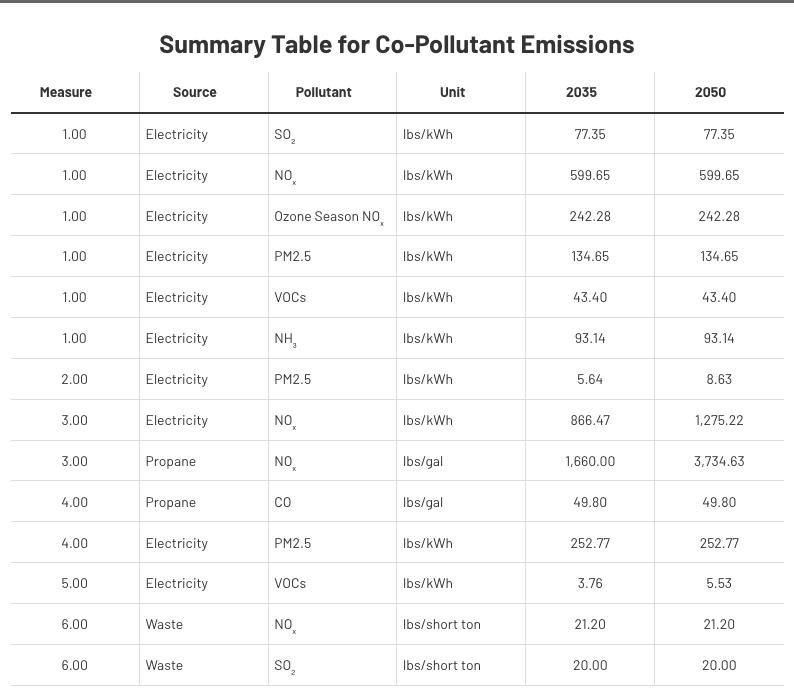
The table provides cumulative emissions reductions by year, pollutant, source, and measure It reflects modeling outputs standardized by emissions unit.
The pollutants evaluated include:
● Nitrogen Oxides (NOₓ)
● Sulfur Dioxide (SO₂)
● Ozone Season NOₓ
The table provides cumulative emissions reductions by year, pollutant, source, and measure. It reflects modeling outputs standardized by emissions unit.
The pollutants evaluated include:
• Nitrogen Oxides (NOX)
• Sulfur Dioxide (SO₂)
• Ozone Season NOX
• Particulate Matter (PM2.5 or PM)
• Volatile Organic Compounds (VOCs)
• Ammonia (NH₃)
• Carbon Monoxide (CO)
• Methane (CH₄)
• Nitrous Oxide (N₂O)
• Total Organic Compounds (TOC)
• Heavy Metals
The analysis includes reductions associated with three emitting sources:
• Electricity use (Measures 1–5)
• Propane use (Measures 3–4)
• Waste management (Measure 6)
Co-pollutant emission reductions were estimated in both 2035 and 2050 using standardized emissions factors per unit of energy or waste:
• lbs/kWh for electricity
• lbs/gal for propane
• lbs/short ton for waste
The methodology for calculating co-pollutant reductions from electricity savings is based on widely accepted emission factor data derived from the EPA Avoided Emissions and Reduction Tool (AVERT).
Here's a breakdown of the methodology employed:
The emission factors were sourced from the EPA's AVERT tool. AVERT is a publicly available, user-friendly spreadsheet model that estimates the avoided emissions of air pollutants (such as SO₂, NOx, CO₂, PM 2.5, etc.) that result from energy efficiency (EE) and renewable energy (RE) generation projects.
The calculations specifically utilized the emission rates for the California Region power sector, as indicated in the original data provided. This approach is appropriate because the project's focus is on Tulare County, California, an area where the Tule River is located, and this county is situated within the California regional electric grid, implying that reductions in electricity demand in Tulare County directly influence emissions from the power plants operating within this grid.
Emission Factor Type (Average Fossil-Derived): The specific emission factors used (e.g., 0.00002444093067 lb/kWh for SO₂) are derived from what AVERT categorizes as "Average Fossil" emission rates. These rates represent the average emissions intensity of fossil-fuel-fired electricity generation within the California region's power sector. These original MWh-based rates were accurately converted to kWhbased rates for the calculations.
The approach involved a straightforward, unit-consistent calculation to determine the amount of each co-pollutant saved:
The fundamental calculation for each pollutant adhered to the principle: Pollutant Saved=Electricity Reduced (kWh)×Emission Factor (Pollutant/kWh)
This methodology was applied to a specific reduction of 78,266 kWh of electricity. This value served as the direct multiplier for all emission factors.
Savings were calculated for a comprehensive set of key co-pollutants, including:
1. Sulfur Dioxide (SO2)
2. Nitrogen Oxides (NOX)
3. Ozone season Nitrogen Oxides (Ozone season NOX)
4. Carbon Dioxide (CO2)
5. Particulate Matter 2.5 (PM 2.5)
6. Volatile Organic Compounds (VOCs)
7. Ammonia (NH 3)
By utilizing emission factors in pounds per kWh (lb/kWh) or tons per kWh (tons/ kWh), the final calculated saved amounts for each pollutant were directly obtained in pounds (lb) or tons, respectively, yielding clear and actionable results.
The calculations were performed in a spreadsheet program (e.g., Excel), which allowed for clear organization, easy replication, and rapid adjustment if the electricity reduction amount changes.
In summary, the methodology leverages trusted EPA data to quantitatively estimate the environmental benefits (in terms of avoided air pollution) associated with energy savings achieved in Tulare County, California, by reducing electricity consumption from the regional power grid.
The methodology for calculating pollutant reductions from propane combustion relies on established emission factors provided by the U.S. Environmental Protection Agency (EPA).
The emission factors are drawn from the EPA's AP-42, Compilation of Air Pollutant Emission Factors, Section 1.5: Liquefied Petroleum Gas Combustion. This document provides standardized emission factors for various pollutants released during the combustion of LPG (which includes propane) in different applications. Specifically, the factors for Commercial Boilers were utilized, as indicated by the SCC (Source Classification Code) 10301002 associated with those factors.
The emission factors are expressed in pounds per 1,000 gallons (lb/10³ gal) of propane consumed. This means they represent the average amount of a specific pollutant emitted for every 1,000 gallons of propane combusted in commercial boiler applications. For Sulfur Dioxide (SO2), the factor used was based on an assumed sulfur content of 1 grain/100 ft³, which is a common default in the absence of specific fuel analysis. The pollutant reduction is calculated by multiplying the volume of propane reduced (in gallons) by its corresponding emission factor (adjusted for the 1,000-gallon basis). Pollutant Saved=Propane Reduced (gallons)×1000 gallonsEmission Factor (lb/1000 gal)
The calculations cover a range of air pollutants, including particulate matter (filterable, condensable, and total), sulfur dioxide (SO2), nitrogen oxides (NOX), nitrous oxide (N2 O), carbon dioxide (CO2), carbon monoxide (CO), total organic compounds (TOC), and methane (CH4). For CO2 , the calculated pounds are converted to tons (1 ton = 2000 lbs) for standard reporting.
This methodology provides a standardized and verifiable approach to quantify the environmental benefits associated with reducing propane consumption in commercial boiler applications.

Association of Energy Engineers. (n.d.). Certified energy manager. Retrieved from https://www.aeecenter.org/ certified-energy-manager/
Building Performance Institute. (n.d.). Certified professionals: Energy auditor. Retrieved from https://www. bpi.org/certified-professionals/energy-auditor/
California Air Resources Board (CARB), ICLEI, and The Climate Registry. Local Government Operations Protocol; The Climate Registry: General Reporting Protocol Version 3.0.
California Air Resources Board (CARB), ICLEI – Local Governments for Sustainability USA, & California Climate Action Registry. (2010). Local Government Operations Protocol for the quantification and reporting of greenhouse gas emissions inventories, Version 1.1. Retrieved from https://ww2.arb.ca.gov/sites/default/files/ classic/cc/protocols/lgo_protocol_v1_1_2010-05-03.pdf
California Department of Industrial Relations. (n.d.). University of California Davis training. Retrieved from https://www.dir.ca.gov/chswc/training/ucd.html
California Employment Development Department. (n.d.). Occupational projections. Retrieved from https://view.officeapps.live.com/op/view.aspx?src=https%3A%2F%2Flabormarketinfo.edd. ca.gov%2Ffile%2Foccproj%2Fvisa%24OccProj.xlsx&wdOrigin=BROWSELINK
CEQAnet. (n.d.). California Environmental Quality Act database. Retrieved from https://ceqanet.opr.ca.gov
Circular Innovation Council. (n.d.). Waste auditor training. Retrieved from https://circularinnovation.ca/ waste-auditor-training/
Depietro, A. (2025, May 7). California Propane Prices (May 2025). ConsultEnergy.org. Retrieved from https:// www.consultenergy.org/propane/ca/
Energy Management Association. (n.d.). Energy management professional certification. Retrieved from https://www.energymgmt.org/energy-management-professional-certification/
Everblue Training. (n.d.). BPI certification. Retrieved from https://everbluetraining.com/get/bpi-certification/
Forest Service, U.S. Department of Agriculture. (n.d.). Retrieved from https://www.fs.usda.gov
Green Business Certification Inc. (n.d.). Waste auditor certification. Retrieved from https://gbes.com/catalog/ certificate-programs/product-waste-auditor-certification/
ICLEI – Local Governments for Sustainability USA. (2023). U.S. Community Protocol for Accounting and Reporting of Greenhouse Gas Emissions, Version 1.2. Retrieved from https://icleiusa.org/us-community-protocol/
ICLEI – Local Governments for Sustainability USA. (n.d.). ClearPath: Online emissions management tool. Retrieved from https://icleiusa.org/clearpath/
ICLEI – Local Governments for Sustainability USA, California Air Resources Board, & California Climate Action Registry. (2010). Local Government Operations Protocol for the Quantification and Reporting of Greenhouse Gas Emissions Inventories, Version 1.1. Retrieved from https://icleiusa.org/resources/localgovernment-operations-lgo-protocol
Intergovernmental Panel on Climate Change. (2014). Climate Change 2014: Mitigation of Climate Change. Contribution of Working Group III to the Fifth Assessment Report of the Intergovernmental Panel on Climate Change. Cambridge University Press. Retrieved from https://www.ipcc.ch/report/ar5/wg3/
Local Governments for Sustainability USA. (n.d.). ClearPath: Online emissions management tool. Retrieved from https://icleiusa.org/clearpath
National Association of Fish and Wildlife Service. (n.d.). Retrieved from https://nafws.org
Proteus Inc. (n.d.). Page 15. Retrieved from https://proteusinc.org/index.php?option=com_ sppagebuilder&view=page&id=15
Save the Redwoods League. (n.d.). Retrieved from https://savetheredwoods.org
Sierra Nevada Alliance. (n.d.). Retrieved from https://sierranevadaalliance.org Sierra Nevada Conservancy. (n.d.). Retrieved from https://sierranevada.ca.gov
Solid Waste Association of North America. (n.d.). Training and certification. Retrieved from https://swana.org/ training-certification
Sustainability Education Academy. (n.d.). About energy auditor training. Retrieved from https:// sustainabilityeducationacademy.com/about-energy-auditor-training/
The White House. (n.d.). Inflation Reduction Act Guidebook. Retrieved from https://www.whitehouse.gov/ cleanenergy/inflation-reduction-act-guidebook/
Tule River Tribe Environmental Department. (n.d.). Environmental. Retrieved from https://tulerivertribe-nsn.gov/ enviromental/
U.S. Bureau of Labor Statistics. (n.d.). Administrative services managers. Retrieved from https://www.bls.gov/ooh/ management/administrative-services-managers.htm?utm_source=chatgpt.com#tab-6
U.S. Department of Energy. (2016). Proactive electricity usage alerts improve customer response (p. 34). Retrieved from https://www.energy.gov/sites/prod/files/2016/12/f34/AMI%20Summary%20Report_09-26-16.pdf
U.S. Environmental Protection Agency (EPA). (2004). Primer for municipal wastewater treatment systems (EPA 832-R-04-001). Retrieved from https://www.epa.gov/sites/default/files/2015-08/documents/wastewater-guide.pdf
United Nations. (1998). Kyoto Protocol to the United Nations Framework Convention on Climate Change. Retrieved from https://unfccc.int/resource/docs/convkp/kpeng.pdf
Walters, D. (2025, January 17). California electricity bills include bonuses for utility companies. CalMatters. Retrieved from https://calmatters.org/economy/2025/01/electricity-bills-include-bonuses-for-utility-companies/ World Resources Institute (WRI). (2022). LEARN Tool: Land Emissions and Removals Navigator – Technical Note. Retrieved from https://www.wri.org/research/learn-tool-land-emissions-and-removals-navigator-technical-note
Zippia. (n.d.). Grant manager jobs trends. Retrieved from https://www.zippia.com/grant-manager-jobs/ trends/?utm_source