

CLIMATE ACTION PLAN

EXECUTIVE SUMMARY
The Town of Davidson has already made significant strides toward becoming a more sustainable community. This Climate Action Plan (CAP/ Plan) builds upon, accelerates, and refines previous and ongoing efforts with a particular focused approach towards reducing greenhouse gas (GHG) emissions.
Embedded in the Town’s Comprehensive Plan is a vision that places sustainability at the heart of its community identity. This Climate Action Plan transforms that vision into action, by offering an actionable strategic roadmap for the Town to work toward carbon neutrality in both municipal operations and across the community as a whole.
This Plan is built on the combined contributions gathered through community engagement with Davidson’s community, stakeholders, staff, and leadership. It is a synthesis of community survey results, workshop ideation synthesis, and focus group refinement, along with key themes and policy commitments from existing planning documents and policies. This plan is grounded in a comprehensive data analysis of 2019 municipal operations and community-wide GHG inventories, local policies, best practices in sustainability solutions, and opportunities unique to the Town of Davidson. It prioritizes emissions reductions, while offering broad climate solutions to create a more resilient Davidson.
The plan uses the year 2019 as the baseline for the greenhouse gas emissions inventories to avoid any irregularities that might otherwise be associated with the pandemic. Targets contained herein will be compared against this baseline year (base year) to monitor and assess progress over time. Emissions are measured in metric tons of carbon dioxide equivalent (MT CO2e) to compare emissions from various sources against a common equivalency.
Municipal emissions are generated from internal activities and operations at the municipal scale related to the Town of Davidson’s various municipal departments, buildings, and facilities. In base year 2019, Davidson’s emissions from municipal operations totaled 1,036 MT CO2e resulting from three primary sources: transportation (52%); energy (44%); and solid waste (4%). Base year 2019 Community emissions totaled 99,170 MT CO2e, of which municipal emissions comprise just 1%. At the community scale Davidson’s emissions also result from three major emissions sources, but the composition is distinct: Energy (54%); Transportation (40%); and Solid Waste, Water, Wastewater, and Fugitive Emissions (6%).
EXECUTIVE SUMMARY
Two core greenhouse gas reduction targets guide this plan: (1) Carbon neutrality by 2037 in municipal operations; and (2) Community carbon neutrality by 2050, both from a 2019 baseline.
Goals, strategies, and actions in support of the targets are outlined herein and are presented in three categories: Foundational, Supportive, and Complementary.
Four high-impact focus areas make up the foundational strategies: (1) Municipal Operations, (2) Mobility & Transportation, (3) Buildings & Energy, and (4) Resource Conservation. These focus areas are most directly tied to Davidson’s greenhouse gas emissions reductions and offer the most critical actions the Town can take to mitigate the potential impacts of climate change.
Supportive strategies address broader community and governance actions and are presented in two additional, essential focus areas: (5) Green Community, and (6) Climate Resilience. These focus areas provide additional solutions to increase the Town of Davidson’s resilience in the face of potential impacts of climate change, while supporting a thriving natural environment and fostering a culture of sustainability within the broader community.
Complementary strategies will be activated through collaboration and partnerships both within and beyond the Town of Davidson to increase positive climate outcomes throughout the community.
Collectively, these components of the Climate Action Plan serve as a comprehensive roadmap to guide the Town of Davidson in achieving its climate targets and giving rise to a more sustainable, engaged and resilient community for generations to come.

LIST OF FIGURES & TABLES
FIGURES
Figure 2.1: Town of Davidson Community Inventory
Figure 2.2: Town of Davidson Municipal Inventory
Figure 2.3: Town of Davidson Community Business-As-Usual Forecast
Figure 2.4: Town of Davidson Community Adjusted Business-As-Usual Forecast
Figure 3.1: Town of Davidson Municipal Emissions Reductions Forecast With Measures Applied
Figure 3.2: Town of Davidson Community Emissions Reductions Forecast With Measures Applied
Figure A.1: Community Greenhouse Gas Emission (2019)
Figure A.2: Municipal Operations Greenhouse Gas Emissions (2019)
Figure C.1: Community-wide Business-As-Usual Forecast
Figure C.2: Municipal Business-As-Usual Forecast
Figure C.3: Community Adjusted Business-As-Usual Forecast
Figure C.4: Municipal Adjusted Business-As-Usual Forecast
Figure C.5: Community-wide Emissions Reduction Scenario
Figure C.6: Municipal Emissions Reduction Scenario
TABLES
Table 2.1: Overview of Community-wide Emissions
Table 2.2: Overview of Municipal Operations Emissions
Table 5.1: Implementation Framework for Foundational Strategies
Table 5.2: Funding Opportunities and Programs
Table A.1: Town of Davidson Community Inventory by Sector
Table A.2: Town of Davidson Municipal Inventory by Sector
Table A.1.1: Community Inventory Data Sources
Table A.1.2: Municipal Inventory Data Sources
Table A.2.1: Transportation & Mobile Source Emissions Factors
Table A.2.2: Municipal Inventory Data Element and Collection Sources by Sector
Table C.1: 2020 and 2035 Community wide GHG Emissions Targets
Table C.2: Municipal GHG Emissions Targets
Table C.3: Emission reductions Strategies from 2024 Climate Action Plan
Table C.4: Municipal Emission Reductions from Each Strategy

ABAU Adjusted Business-As-Usual
BAU Business-As-Usual (BAU)
CAP Climate Action Plan
CH4 Methane
CO2 Carbon dioxide
eGRID Emissions & Generation Resource Integrated Database
EPA Environmental Protection Agency
EO Executive Order
EV Electric Vehicle
GHG Greenhouse Gas
GWP Global Warming Potential
HFCs Hydrofluorocarbons
ICLEI International Council for Local Environmental Initiatives
Kg kilogram
kW kilowatt
kWh kilowatt hour
LEED Leadership in Energy & Environmental Design
MMBtu one million British thermal units
MT metric ton
MT CO2e Metric Ton of Carbon Dioxide equivalent
N nitrogen
N2O Nitrous oxide
NCDOT North Carolina Department of Transportation
NCUC North Carolina Utilities Commission
NREL National Renewable Energy Laboratory
PFCs Perfluorocarbons
REC Renewable Energy Credit
scf standard cubic foot
SERC State Emergency Response Commission
SF6 Sulfur hexafluoride
SLOPE State and Local Planning for Energy
SRVC SERC Virginia/Carolina
SSDN Southeast Sustainability Directors Network
VMT Vehicle Miles Traveled

ACKNOWLEDGEMENTS
TOWN OF DAVIDSON LEADERSHIP
Mayor Rusty Knox, Mayor BOARD OF COMMISSIONERS
Tracy Mattison Brandon, Commissioner
Jane Campbell, Commissioner (Previous term)
Matt Dellinger, Commissioner (Previous term)
Ryan Fay, Commissioner
Steve Justus, Commissioner
Autumn Rierson-Michael, Commissioner (Mayor Pro Tempore)
TOWN MANAGER:
James Justice
DAVIDSON SUSTAINABILITY
COMMITTEE
Nora Barger, Chair
Matt Walt, Chair
Tim Belitz
David Howard
Anne Marie Moehring
Letha Smith
Juliette Sponsel
Jenna Vujic
Andre Phillips (Student Liaison/Davidson College)
DAVIDSON CLIMATE TEAM
Austin Nantz, Assistant Town Manager
Leslie Willis, Parks and Recreation Director
Charlene Minor, Program Manager
Kayla Kovach, Sustainability Manager
Sebastian Provencio, Intern/Davidson College Student

DAVIDSON DEPARTMENT CONTRIBUTORS
Trey Akers, Principal Planner
Jason Burdette, Planning Director
Jesse Bouk, Public Works Director
Eugene Bradley, Housing & Equity Director
Rob Cannon, Firefighter
Kimber Davidson, Police Chief
Jessica Eggimann, Communications Director
Kim Fleming, Economic Development Director
Andrew Golden, Transportation Planner
Ryan Monteith, Fire Chief
Piet Swart, Finance Director
OTHER CONTRIBUTORS
Dave Cable, Davidson Lands Conservancy
Gordon Clark, Trees Davidson
Meg Fencil, Sustain Charlotte
Yancey Fouche, Davidson College, Sustainability
David Holthauser, Davidson College, Director of Facilities and Engineering
Steve Justus, Livability Board (Previous term)
Eric Kopco, PNGEA Technologies
Jeff Robins, CleanAIRE NC
Emily Vesling, Trane Technologies, Center of EE & Sustainability at Trane
Connie Wessner, Davidson Housing Coalition
Lib Wilson, Affordable Housing & Equity Board
GRATITUDE to all the individuals, staff, businesses, nonprofits, community groups, and partners in the Town of Davidson who participated in our focus groups and workshops. We also extend our deep appreciation to the larger community for completing our climate action plan survey, and to every individual who supplied data requests and offered their insights, expertise, and support in shaping this climate action plan –THANK YOU.

Like others, the Town of Davidson is feeling the impact of climate change in our community. Through the Board’s Strategic Plan, the Town is committed to proactively enhancing and protecting our environmental resources. One of the biggest threats to these resources is our rapidly changing climate.
The Town of Davidson set a goal to be carbon neutral within our municipal operations by 2037. We recognize that this goal is ambitious. This Climate Action Plan will serve as our strategic roadmap to achieving our sustainability goals. When the Board of Commissioners set forth in the strategic plan to address climate-based challenges, there was not a plan for how to address them, but we did know we needed a path to achieve them. This Climate Action Plan outlines a strategic approach for reducing greenhouse gas emissions and preparing the community for climate impacts.
Like others, the Town of Davidson is feeling the impact of climate change in our community. Through the Board’s Strategic Plan, the Town is committed to proactively enhancing and protecting our environmental resources. One of the biggest threats to these resources is our rapidly changing climate.
The Town of Davidson set a goal to be carbon neutral within our municipal operations by 2037. We recognize that this goal is ambitious. This Climate Action Plan will serve as our strategic roadmap to achieving our sustainability goals. When the Board of Commissioners set forth in the strategic plan to address climate-based challenges, there was not a plan for how to address them, but we did know we needed a path to achieve them. This Climate Action Plan outlines a strategic approach for reducing greenhouse gas emissions and preparing the community for climate impacts.
We are proud of all that our community and staff have accomplished to complete a plan that sets the Town of Davidson on a well-defined path to diversify transportation options and infrastructure, transition to clean energy sources, and reduce waste. We are hopeful that the Town’s Climate Action Plan encourages us as a community to become more conscious of our overall sustainability practices. We will continue to ensure our natural environment thrives as we work to create a resilient community for everyone.
We are proud of all that our community and staff have accomplished to complete a plan that sets the Town of Davidson on a well-defined path to diversify transportation options and infrastructure, transition to clean energy sources, and reduce waste. We are hopeful that the Town’s Climate Action Plan encourages us as a community to become more conscious of our overall sustainability practices. We will continue to ensure our natural environment thrives as we work to create a resilient community for everyone.
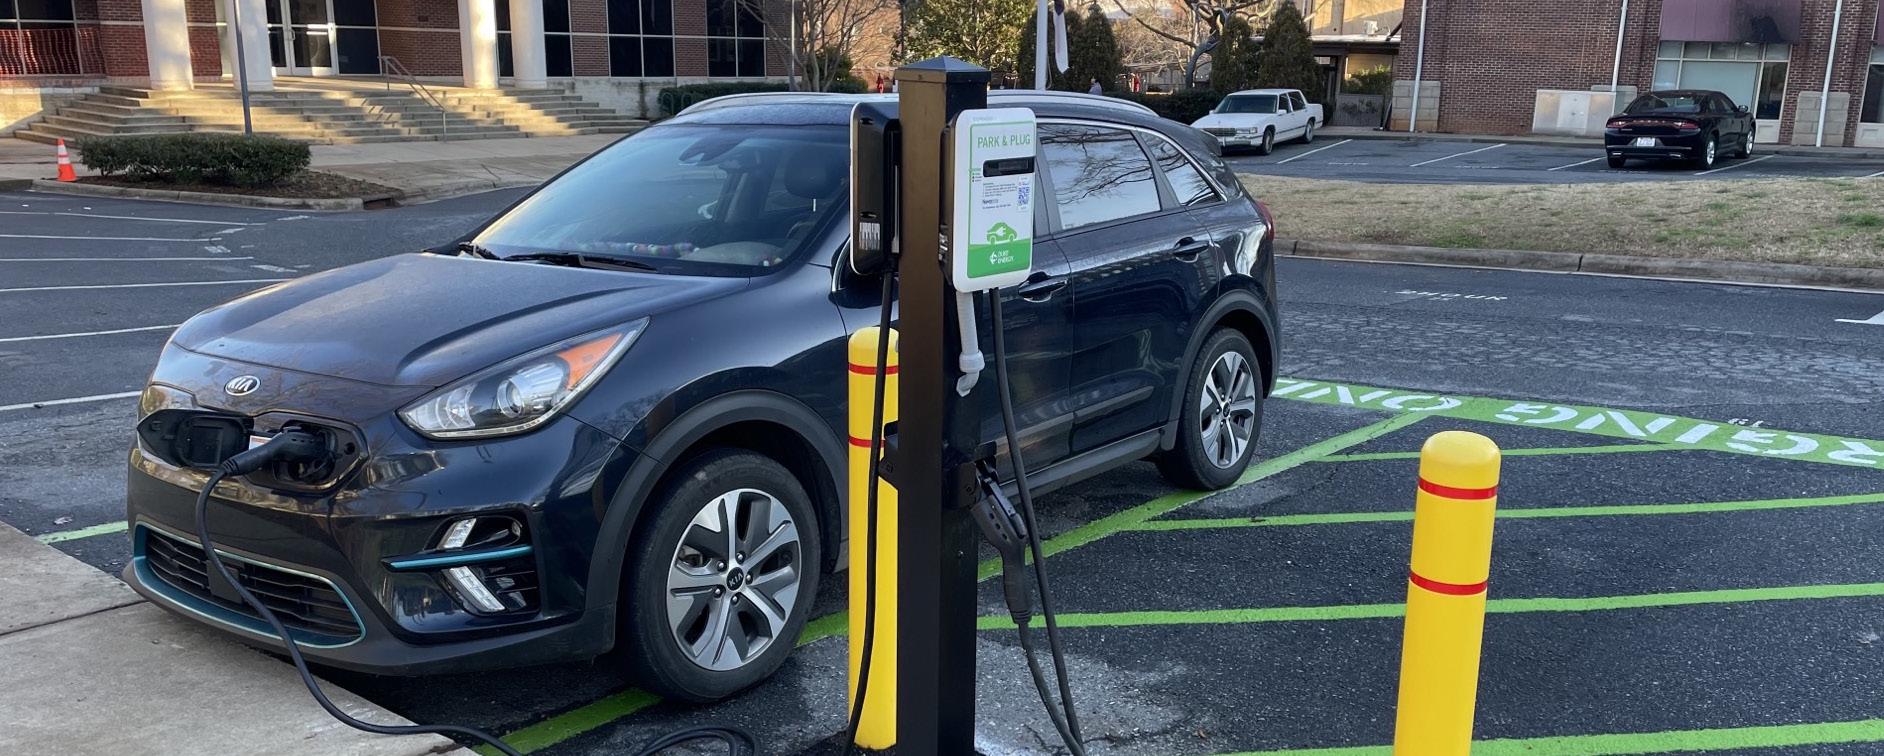
Our community is proud to be a leader in this space. In 2021, the Town formed a Sustainability Committee and adopted a Sustainability Framework to begin advancing work towards the Town’s carbon neutrality goal. With support from Davidson College, the Town conducted a greenhouse gas emissions inventory to set a baseline from which progress towards the goal could be tracked. Since then, the Town has launched several sustainability initiatives including participation in the Duke Energy Park & Plug Pilot Program which brought EV stations to two locations in Town, as well as the development of the Davidson Composts Program which continues to successfully divert over 525 pounds of food waste per week away from landfills. Additionally, the Town was accepted into the LEED for Cities Leadership Program and became a designated Bee City and Tree City community.
Our community is proud to be a leader in this space. In 2021, the Town formed a Sustainability Committee and adopted a Sustainability Framework to begin advancing work towards the Town’s carbon neutrality goal. With support from Davidson College, the Town conducted a greenhouse gas emissions inventory to set a baseline from which progress towards the goal could be tracked. Since then, the Town has launched several sustainability initiatives including participation in the Duke Energy Park & Plug Pilot Program which brought EV stations to two locations in Town, as well as the development of the Davidson Composts Program which continues to successfully divert over 525 pounds of food waste per week away from landfills. Additionally, the Town was accepted into the LEED for Cities Leadership Program and became a designated Bee City and Tree City community.
The Town of Davidson is committed to sustainability and strives to remain at the forefront of climate action. The success of the Town’s Climate Action Plan is dependent upon the members of our community coming together and supporting these initiatives. With this plan in place, the Town will continue to build on progress as a regional leader and role model for addressing issues related to climate change. I look forward to working together to bring this plan to life.
The Town of Davidson is committed to sustainability and strives to remain at the forefront of climate action. The success of the Town’s Climate Action Plan is dependent upon the members of our community coming together and supporting these initiatives. With this plan in place, the Town will continue to build on progress as a regional leader and role model for addressing issues related to climate change. I look forward to working together to bring this plan to life.
Sincerely,
Sincerely,

Rusty Knox, Mayor Town of Davidson
Mayor Rusty Knox, Mayor

BACKGROUND
THE PLAN
BEYOND STATE TARGETS
APPROACH
ENGAGEMENT ACTIVITIES
EQUITY & INCLUSION
COLLABORATION & PARTNERSHIPS
STATE PLANNING
LOCAL PLANNING
OUR PROGRESS
CHALLENGES & OPPORTUNITIES
BACKGROUND
The Town of Davidson, North Carolina is located approximately 20 miles north of Charlotte, one of the fastest growing metropolitan areas in the nation. The Town also boasts a long-standing commitment to sustainability and natural resource conservation with a total of 902 acres of conserved and park land. Davidson, proud home of Davidson College, is home to many dedicated non-profits, volunteers, and local groups actively contributing to the community. Davidson is a predominantly educated and affluent population. Originally established around Davidson College, the College continues to form a core aspect of the Town’s community.
The Town has experienced rapid population growth in recent years, nearly doubling in size from 8,890 in 2005. This growth brings increased population diversity, as well as new pathways for sustainable community planning and smart growth design that can increase the Town’s overall resilience in the face of a changing climate. Leveraging these attributes, Davidson faces unique opportunities and challenges as it takes steps to achieve its sustainability and climate action goals. The Town is well poised to address the causes and impacts of climate change through the goals, strategies, and actions outlined in this Climate Action Plan (CAP/Plan).

15,771 RESIDENTS PEDESTRIAN AND BICYCLE-FRIENDLY TOWN DESIGNATED BEE CITY


BACKGROUND
Davidson is a regional leader in sustainability and is actively building its resources to increase resilience. Actions to reduce emissions and sequester carbon within the Town— through such mechanisms as smart growth planning, bikeability and walkability enhancements, and tree canopy protection—are long-standing. The Town of Davidson recently achieved Leadership in Energy & Environmental Design (LEED) Silver certification for its sustainability efforts. LEED for Cities and Communities is a rating system that helps local leaders create responsible, sustainable and specific plans for natural systems, energy, water, waste, transportation, and many other factors that contribute to quality of life. This Climate Action Plan complements prior and concurrent sustainability efforts, including LEED, with a particular lens on reduction of greenhouse gas emissions. Through this Climate Action Plan, the Town of Davidson seeks to bolster, expand and enhance these efforts to support a more sustainable, engaged, and resilient community.
This Plan is a commitment from the Town of Davidson to its community members to adopt strategies that will move the municipality and the community toward carbon neutrality. The success of this Plan will ultimately depend on the continued leadership of the Town, its staff, consultants, and technical experts, but most importantly, it will depend on its citizens. Continued community engagement will be a vital driver for the Plan’s successful implementation. The Town seeks to empower its residents, businesses, and visitors to actively participate as facilitators, solutionaries, and beneficiaries of this Plan to give rise to a more sustainable Davidson.

" THIS CLIMATE ACTION PLAN COMPLEMENTS PRIOR AND CONCURRENT SUSTAINABILITY EFFORTS…"

THE VISION
Davidson remains committed to controlling our own destiny as a distinct, sustainable, and sovereign small town. Our sense of community is rooted in citizens who respect each other; in racial and socioeconomic diversity; and in pedestrian and bicycle orientation; all in the presence of a small liberal arts college. Our history and character guide our future.
– Comprehensive Plan, Adopted 2020
THE PLAN
This Climate Action Plan (CAP/Plan) is intended to serve as a guiding document to drive emissions reductions and sustainability action measures in the Town of Davidson in line with 2037 and 2050 goals. Actions will both mitigate climate impacts and increase community resilience in the face of potential climate changes. Aligning with the Town’s bicentennial milestone, Davidson’s Board of Commissioners adopted an ambitious municipal goal of achieving carbon neutrality for municipal operations emissions by 2037. A central focus of this CAP outlines specific municipal targets, strategies, and actions to support this bicentennial goal. This CAP further sets forth goals, strategies, and actions to achieve carbon neutrality for overall community emissions by 2050, aligned with and exceeding North Carolina’s statewide target articulated in Executive Order 246 (EO246).
Specific strategies and supportive actions are compiled into a detailed Strategic Roadmap, presented in Section 4 and further detailed in accompanying Appendices. Strategies align with key themes of the Davidson Comprehensive Plan, Mobility Plan, Parks & Recreation Master Plan, and other local and regional initiatives. Plan development was guided by Town staff, elected officials, Sustainability Committee representatives, local and regional leaders, community members, and proven climate solution best practices. Most importantly, strategy design was informed by specific input and feedback obtained directly from the broader Davidson community through inclusive stakeholder engagement activities throughout the CAP development process. Targets are informed by best practices, localized data analysis, and emissions forecasting to best achieve the goals of the community while aligning with or exceeding statewide targets.
1 Base year refers to the baseline inventory year used to compare emissions reductions against. The 2019 greenhouse gas inventory presented within this Plan serves as the base year for Davidson's emissions reductions targets.
ACHIEVE CARBON NEUTRALITY FOR MUNICIPAL OPERATIONS EMISSIONS
(using 2019 base year1)
ACHIEVE CARBON NEUTRALITY FOR COMMUNITY EMISSIONS
(using 2019 base year)
BEYOND STATE TARGETS
An integral component of this CAP includes Davidson’s 2019 Municipal and Community greenhouse gas emissions inventories to establish a representative current baseline year (base year) of emissions. Using 2019 greenhouse gas inventories as the Town’s base year for which targeted reductions will be compared, the 2037 Municipal and 2050 Community targets underscore Davidson’s strong leadership and commitment to addressing the causes and impacts of climate change. EO246 establishes statewide targets compared to 2005 baseline year, when per capita emissions were substantially higher due to the concentration of coal within the region’s prior energy sourcing portfolio. As such, Davidson’s 2050 Community target sets a more ambitious and accelerated long-term target than EO246. Measures within this CAP also support overall resilience and provide a host of additional community co-benefits to uplift the community, increase equity, improve livability, and enhance quality of life for Davidson’s residents, businesses, and visitors.
" MEASURES WITHIN THIS CAP ALSO SUPPORT OVERALL RESILIENCE."
APPROACH
Climate change represents one of the key challenges of our time. Across the nation and the globe communities are taking action to address the causes and impacts of climate change while also leveraging this moment as an opportunity to create more resilient and sustainable communities. The Town of Davidson has embraced this call for action by adopting bold municipal and community-wide targets for emissions reductions and increased resilience, exceeding statewide 2050 targets outlined in EO246. This Plan outlines the strategies and actions that will support the Town in achieving these ambitious targets.
To maximize effectiveness, the Town will continue to build on progress to date by maintaining ongoing robust and inclusive stakeholder engagement, leveraging regional, state, and local partnerships, embracing equity and inclusivity as a core principle to guide program design and implementation, as well as aligning and evaluating progress toward local, regional, state, and federal policy requirements, resources, and trends.

THIS PLAN IS ORGANIZED INTO THE FOLLOWING MAJOR ELEMENTS:
SECTION 1
✔ Plan Background and Introduction
✔ Related Policies and Key Principles Guiding the CAP
SECTION 2
✔ Current greenhouse gas inventories and projections for both municipal operations and community emissions
SECTION 3
✔ Town’s 2037 and 2050 emissions reduction targets
SECTION 4
✔ Measures to achieve the 2037 municipal goal
✔ Measures to support the 2050 community goal.
✔ These goals, strategies and actions are presented as a Strategic Roadmap in Section 4.
✔ Strategies are outlined in six main focus areas and each strategy is accompanied by one or more actions designed to support and accelerate strategy achievement:
Municipal Operations Resource Conservation
Mobility & Transportation
Green Community
Buildings & Energy Climate Resilience
SECTION 5
✔ Illustrates top emissions reduction strategies within the areas of Municipal Operations, Mobility & Transportation, Buildings & Energy, and Resource Conservation as an implementation plan to guide the Town in future years.
APPENDICES
✔ Additional support information and data detailing:
Greenhouse gas emissions inventory
Data sources
Analysis methodology
Stakeholder feedback
Provisional emissions forecasts and mitigation targets
KEY PRINCIPLES
A summary of key principles guiding the CAP is illustrated below.
ENGAGEMENT ACTIVITIES
EQUITY & INCLUSION
COLLABORATION & PARTNERSHIPS
STATE & LOCAL PLANNING
ENGAGEMENT ACTIVITIES
The Town of Davidson values community input and engagement, and recognizes the importance of a collaborative process to ensure the CAP reflects the diverse perspectives and needs of the community. Engaging the community in the planning process to gather meaningful input was an integral component of the CAP development to ensure that measures contained herein are practical, fair, locally attuned, and responsive to the community. The Town engaged with stakeholders throughout the planning process, interacting with local residents, businesses, internal operations, Sustainability Committee representatives, and the broader Davidson community (collectively referred to as "stakeholders").
Davidson’s engagement activities included a community survey, community leaders workshop, department staff workshop, and multiple stakeholder focus group discussions. Engagements were promoted in a multichannel communications approach led by the Town that included website and social media posts and updates, as well as promotion among the Town’s many local organizations, nonprofits, and community entities, and in-person tabling at the Town’s Juneteenth event as well as door to door survey promotion within historically disadvantaged neighborhoods in partnership with Davidson College student volunteers. Ideas, comments, and suggestions provided by community stakeholders are integrated into this CAP to the best of the project team’s abilities and in alignment with the data analysis results, Town guidance, and applicable policy requirements and considerations. Key themes obtained through each of the engagement activities - from survey results to focus group feedback - were synthesized and incorporated into appropriate focus areas within the Strategic Roadmap. Additional detail regarding key takeaways and feedback from stakeholder engagement activities is provided in Appendix B.
Ongoing collaboration with community stakeholders will continue to serve as a vital element of CAP implementation to strengthen community resilience and increase overall effectiveness of the measures contained herein. Continued coordination with the Sustainability Committee will also serve an important role throughout the implementation of this CAP.
ENGAGEMENT ACTIVITIES
THE FOLLOWING ENGAGEMENT OBJECTIVES GUIDED THE PROCESS:
1. Increase understanding of attitudes and priorities of stakeholders and the community towards the development of the CAP;
2. Provide opportunities for stakeholders and the community to review and provide feedback on draft strategies proposed in the CAP; and
3. Ensure that the final CAP reflects the diverse perspectives and needs of the community.
EQUITY & INCLUSION
An equity and inclusion framework is a crucial component of effective climate action, as it emphasizes the fair distribution of benefits and burdens associated with environmental policies and initiatives. Climate change impacts are not uniformly felt with vulnerable communities often bearing the brunt of the consequences despite contributing minimally to the problem. Incorporating equity into climate action acknowledges historical injustices and strives to rectify systemic disparities. By prioritizing the needs of marginalized groups and ensuring their participation in decision-making processes, an equity framework promotes inclusivity and social justice. This approach recognizes that addressing climate change is not only an environmental imperative but also a moral and ethical responsibility.
Achieving equity in climate action can enhance the resilience of communities disproportionately affected by climate change and foster a more sustainable and just society, where the benefits of mitigation and adaptation efforts are shared equitably. Some actions are designed to address historical inequities by providing specific resources, incentives or technical assistance to disadvantaged community members. Other actions are encouraged to develop specific services tailored to marginalized groups as programmatic design occurs in the implementation phase.
In line with these equity and justice objectives, this Plan calls on the Town’s implementers to mindfully incorporate equity and inclusion throughout design and implementation phases. Programmatic design elements such as incentives, resources, and services should be adopted in order to ensure appropriate distribution of support to frontline communities most impacted by, and the least responsible for, the impacts of climate change.
"…AN EQUITY FRAMEWORK PROMOTES INCLUSIVITY AND SOCIAL JUSTICE."
COLLABORATION & PARTNERSHIPS
The Town of Davidson recognizes that addressing climate challenges transcends individual efforts. It requires a shared vision and collective response, where different sectors and communities come together to share expertise, resources, responsibilities, and perspectives. This united approach not only enhances the scope and impact of the CAP but also fosters a sense of shared commitment and solidarity among different stakeholders in the region. The Town further acknowledges that some desired actions may be within the Town’s sphere of in fl uence but may not be in the Town’s direct regulatory authority. Additional entities, agencies or associations offer particular resources or expertise that may further complement strategies listed within this Plan, or may themselves have regulatory authority to enact such programs. For these reasons, this Plan calls out specific actions most directly requiring collaboration. The Town of Davidson is committed to cultivating partnership opportunities to enhance the effectiveness of measures outlined within the Strategic Roadmap.

COLLABORATION & PARTNERSHIPS
Below are specific partnership opportunities that can significantly advance the impact of Davidson’s CAP. These initiatives are considered integral complementary actions to the foundational and supportive strategies outlined in further detail in Section 4. Strategic Roadmap.
TRANSPORTATION & MOBILITY
❍ Collaborate with local businesses and schools to reduce car trips made, promoting sustainable commuting options such as biking, walking, or bus usage through educational campaigns, events, and incentives.
❍ Collaborate with Charlotte Area Transit System (CATS) to expand and enhance routes and scheduling, and/or adopt micro-transit and shared micro-mobility options to reduce barriers and increase ridership.
❍ Partner with CATS to conduct a comprehensive review of the current bus service to understand ridership levels, barriers to adoption, and efficiency opportunities.
❍ Partner with Clean Fuels Coalition and other organizations to provide electric vehicle and charging education.

BUILDINGS & ENERGY
❍ Partner with solar vendors to offer events for residents and business owners to understand the potential of solar energy installations and connect to solar assessment resources.
❍ Partner with energy service providers to host energy efficiency fairs, workshops, and demonstrations to educate businesses.
❍ Collaborate with entities like the North Carolina Clean Energy Fund to leverage existing financial mechanisms and amplify outreach.
❍ Explore partnerships with the North Carolina Sustainable Energy Association, Solar United Neighbors, and other organizations to amplify community engagement and investment in renewable energy.
❍ Partner with utility providers to promote equitable access to incentives for upgrading to energy-efficient household appliances and heating/ cooling systems.
❍ Explore collaboration with partners to participate in large scale community solar projects.
❍ Track progress toward utility emissions reductions goals.
❍ Support policy efforts to expand accessibility of renewable energy generation procurement options in North Carolina.

RESOURCE CONSERVATION
❍ Partner with Mecklenburg County to promote or enhance the "CheckMeck Waste Wizard" - a “What Goes Where” tool.
❍ Collaborate with Charlotte Mecklenburg Utilities to enhance water conservation efforts, promoting existing and encouraging new incentives/rebates, and innovative water management practices, such as rain gardens, bioswales, and greywater systems.
❍ Explore partnerships with Mecklenburg County to conduct a feasibility study focused on identifying the most effective methods for managing household and business waste, as well as enhanced recycling and waste diversion practices, including the disposal and recycling of construction and demolition waste.
❍ Partner with local food rescue networks to promote the donation of surplus edible food from businesses to disadvantaged groups, aiming for equitable hunger alleviation and food waste reduction.
❍ Explore the Circular Charlotte Plan and partner with Envision Charlotte and other groups involved in sustainable purchasing and zero waste initiatives.
CLIMATE RESILIENCE
❍ Explore partnerships and collaboration opportunities with Davidson College and other educational institutions as part of a broader local and regional resilience strategy.
❍ Collaborate with Mecklenburg County Emergency Management Services (EMS) and appropriate non-governmental organizations (NGOs) to establish emergency protocols specifically addressing climate events.
❍ Support efforts for increased access to community solar, battery storage, and microgrid development for resilient energy generation.
GREEN COMMUNITY
❍ Partner with private and public entities such as Davidson Lands Conservancy and Mecklenburg County to learn and implement successful conservation land strategies.
❍ Collaborate with community partners, including Davidson Lands Conservancy (DLC), Davidson Housing Coalition (DHC), Habitat for Humanity, etc., to increase tree planting and conservation in public housing areas and among private landowners.
❍ Collaborate with regional partners to highlight and promote recent stormwater improvements.
❍ Partner with regional organizations to expand climate action education and outreach in North Carolina.
STATE PLANNING
The following outlines key state planning policies guiding the climate solutions landscape in North Carolina. Such policies establish particular targets, requirements or resources at the state level to mandate, encourage or guide actions taken on the local municipal level. These North Carolina actions have informed Davidson’s approach to this Climate Action Plan.
Executive Order 246 (2022) proposes a comprehensive plan for the state's transition to a clean and equitable economy in response to the global climate crisis. The order sets ambitious targets, including a reduction of greenhouse gas emissions by at least 50% below 2005 levels by 2030 and achieving net-zero emissions by 2050. Recognizing the disproportionate impact of climate change on vulnerable communities, the directive emphasizes environmental justice and mandates the incorporation of equity considerations in its implementation. The executive order highlights the importance of public participation, workforce diversity, and the strategic allocation of state and federal funds to advance clean energy goals.
Executive Order 80 (2018), North Carolina's Commitment to Address Climate Change and Transition to a Clean Energy Economy, calls for the state to take several actions related to climate change to improve the health and well-being of North Carolina's residents, foster innovation and growth of a clean energy workforce, prepare more resilient communities, and reduce the impacts of climate change, such as more frequent and intense hurricanes, flooding, extreme temperature, drought, saltwater intrusion, and beach erosion. The EO calls for action to prepare for the impacts of climate change (adaptation and resilience) and for mitigation efforts. The EO No. 80 also calls for the Development of a Clean Energy Plan that evaluates and encourages the use of alternative energy sources.
The 2019 North Carolina Clean Energy Plan sets a net zero greenhouse gas emissions target by 2050 and has established goals to support this target by fostering long-term energy affordability and accelerating clean energy innovation, development, and deployment to better serve business and residential communities. To support these goals, the plan states a commitment to develop carbon reduction policies and the tools needed to support these policies as well as to modernize the grid to support clean energy resource adoption.
STATE & LOCAL PLANNING
House Bill 951 Energy Solutions for North Carolina (HB951) sets a clear mandate for the North Carolina Utilities Commission (NCUC) to significantly reduce carbon emissions in line with the state's Clean Energy Plan. Specifically, the bill requires the NCUC to implement "all reasonable steps" to achieve a 70 percent reduction in carbon emissions from 2005 levels by 2030, and to reach carbon neutrality by 2050. In response, the NCUC has developed the 2022 Carbon Plan , which provides a strategic roadmap to meet these ambitious targets.
The Cities Initiative , led by the Environmental Defense Fund, is a collaborative effort among North Carolina local governments to address greenhouse gas emission reductions to evaluate barriers, business needs, and partnership opportunities. During Phase 1, the Initiative identified 12 core goals around clean energy, transportation, and the built environment that the collaborative will focus on in the coming months. A large part of the analysis process is to uncover funding approaches to support these areas. Phase 2 will unfold in 2024. During this phase, specific strategies and actions will be determined to lay out a roadmap for implementation.
Southeast Sustainability Directors Network (SSDN) is a dynamic coalition of local government sustainability officials across the Southeast United States. Aiming to enhance community resilience and environmental stewardship in the region, this professional network is dedicated to fostering collaboration and sharing best practices in sustainability. SSDN plays a crucial role in supporting its members, influencing sustainable policies and programs at both local and state levels, and contributing to the broader national discourse on sustainability. By connecting professionals in the field, SSDN empowers communities to effectively respond to, and prepare for, the challenges of climate change through innovative and scalable sustainability initiatives. The network's efforts are geared towards creating healthier, cleaner, and more sustainable environments for present and future generations.
Centralina Clean Fuels Coalition leverages resources from the Department of Energy’s Vehicle Technology office to promote alternative fuels and electric vehicle adoption. The coalition provides collaboration, multi-jurisdiction grant opportunities, workshop education, and technical assistance to municipalities who are committed to finding sustainable transportation solut ions.
STATE & LOCAL PLANNING
LOCAL PLANNING
The following highlights primary local planning policies guiding the climate solutions landscape in the Town of Davidson:
The 2020 Davidson Comprehensive Plan, shaped by the community's intentional vision, serves as a strategic guide for the Town of Davidson's future, emphasizing the preservation of history, character, and a strong sense of community. The plan's commitment to sustainability is evident through specific actions addressing climate change, mobility, housing inclusivity, economic vibrancy, and community service. A key focus is on implementation, ensuring practical steps and ongoing monitoring to measure effectiveness. With an emphasis on diverse housing, green initiatives, and collaborative partnerships, the plan not only envisions a resilient future but also provides a dynamic framework for turning community aspirations into measurable outcomes.
The 2023 Historic Preservation Plan is a direct result of the communityinput driven Comprehensive Plan and the 2020-2021, 2022-2023 Strategic Plans. Completed by Heritage Strategies, LLC, the Plan begun in 2020 and was adopted by the Board of Commissioners in January 2023. It serves as the Town’s first ever historic preservation plan. The Plan’s goal is to provide a “roadmap” for historic preservation in the Town of Davidson for the next 10-15 years. Based on the Historic Preservation Plan, town staff seeks to involve as many as possible in the input process, increase historic designations, update design standards, and craft an overall strategy for signage and storytelling.

The 2022 Community Risk Assessment and Standards of Cover Analysis for the Davidson Fire Department includes recommendations with an emphasis on evidence-based, cost-effective, and sustainable options for a high-performance emergency response. Recommendations such as the development of a Fire & Life Safety/Community Risk Reduction Division, implementation of a Fire Code Enforcement Program, and consideration of a first responder fee for Emergency Management Services (EMS) responses demonstrate a commitment to enhancing community safety, aligning with broader efforts for climate resilience in emergency response planning. Recognizing the potential impact of climate change on emergency incidents, the project aims to ensure a robust and adaptable emergency response system.
The 2019 Davidson Mobility Plan is a comprehensive local transportation strategy envisioning the Town as a hub where residents can effortlessly walk, cycle, drive, and access transit, emphasizing a high quality of life. Guided by principles like prioritizing pedestrian-friendly streets and introducing new mobility technologies, the plan addresses growth pressures while preserving Davidson's character. Action steps cover pedestrian, bicycle, vehicular, parking, new mobility options, and transit mobility. Additionally, it identifies priority projects, aligning with factors such as safety, reduced travel time, and environmental quality, providing a strategic framework to enhance resilience and sustainability amid urban evolution.
The 2016 Rural Area Plan places a strong emphasis on sustainable development, climate resilience, and adaptation strategies across various action items. The plan advocates for open space preservation, highlighting action items such as the continuation of support for open space through the development process, the application of substantial stream buffers along critical water bodies, and prioritizing the preservation of upland areas. These actions not only contribute to the conservation of natural habitats and biodiversity but also serve as crucial climate adaptation measures, mitigating the impacts of extreme weather events and fostering ecological resilience. The plan also addresses sustainable mobility and infrastructure including the maintenance of street networks for new development, the construction of multi-use paths, and the implementation of alternative transportation plans for bicycles and pedestrians. These initiatives align with sustainability goals by promoting eco-friendly modes of transportation, reducing reliance on single-occupancy vehicles, and enhancing overall community resilience to the effects of climate change. Furthermore, the plan incorporates water and sewer infrastructure extensions, aiming to accommodate future growth sustainably and efficiently.
STATE & LOCAL PLANNING
The 2014 Parks and Recreation Master Plan outlines a strategic framework for the continual improvement and sustainability of its parks and recreational facilities. Rooted in the need to adapt to emerging trends and meet grant opportunities, the plan encompasses various policy recommendations, each with specific actions designed to enhance the community's overall well-being. Notably, the emphasis on adopting new Level of Service standards that prioritize health reflects a commitment to creating resilient and climate-responsive recreational spaces. Additionally, the plan encourages partnerships with neighboring municipalities, public/private collaborations for sustainable land acquisition, and the establishment of eco-friendly initiatives, such as composting and recycling programs. By integrating these recommendations, the Town of Davidson aims not only to meet the recreational needs of its residents but also to foster a sustainable and climate-resilient community that prioritizes health, environmental stewardship, and collaborative regional efforts.
The 2009 Davidson Energy Plan sets a blueprint for environmental stewardship and energy efficiency through a focused strategy on data collection, policy development, conservation efforts, solid waste reduction, and air quality improvement. Designed to guide Davidson towards a sustainable future, this plan combines clear objectives with actionable steps, emphasis on community education, the promotion of renewable energy, and the improvement of local infrastructure to reduce carbon footprint and foster a greener and more resilient community.
The Davidson College Climate Action Plan (2021-2026), an update of the original plan launched in 2010, outlines a strategic roadmap to halve campus emissions by 2026. The plan sets a target to achieve a 50 percent reduction in campus emissions over the next five years (relative to the FY2008 baseline) through five key areas: expanding electricity from renewable sources, continuous improvement in energy management, managing emissions from campus boiler plants, acknowledging and addressing emissions from education abroad, and developing a program for responsible institutional air travel. Known as Davidson College until 1891, the Town of Davidson has unique historical ties to the college. With this in mind, the Town is mindful of the concurrent climate commitments and actions outlined in the college's recently issued Climate Action Plan. Representatives from Davidson College participated in stakeholder focus groups and provided key learnings and insights from the college’s recent planning process for the Town's consideration.
STATE & LOCAL PLANNING
OUR PROGRESS
The Town of Davidson has already made significant efforts toward a more sustainable community. This Climate Action Plan will further, accelerate, and focus previous and concurrent efforts with a particular concentration on greenhouse gas reductions. This Plan provides a precise Strategic Roadmap for near, mid, and longterm implementation. Further, this Plan will help ensure actions and investments are deliberate, strategic, and support Specific, Measurable, Achievable, Relevant and Timebound (SMART) goals of the community.
The Town’s Comprehensive Plan includes a vision statement that puts Sustainability at the forefront of its community identity. In 2022, the Board of Commissioners made Sustainability a top priority in their Strategic Plan, emphasizing the creation and maintenance of a vibrant, equitable community and economy while safeguarding the natural environment for future generations. A significant milestone in this journey towards a more sustainable and equitable future was the adoption of the Town’s Sustainability Framework, which serves as a guiding document for sustainability initiatives. The Town's efforts are further enhanced by the formation of the Town’s Sustainability Committee, comprising volunteer residents who are deeply invested in sustainability. This committee plays a crucial role in driving the Town's sustainability agenda, guided by the priorities set out in the Framework. This committee will play a key role in CAP implementation.
In 2023, the Town further prioritized sustainability by making deliberate and necessary staff resource adjustments to facilitate the successful execution of this CAP. Appropriate internal staffing is widely recognized as among the most critical near term actions jurisdictions can take to ensure successful CAP implementation. To advance these sustainability efforts, the Town created a new staff position to oversee, manage, and direct implementation of sustainability programming, including the implementation of this CAP. Combined with the existing Natural Assets Program Manager, these two staff positions are overseen by the Director of Parks & Recreation, and will coordinate with the Town Arborist, as appropriate. In this way, the Town is building its internal staffing capacity to guide climate and sustainability efforts moving forward. Additional investment as well as internal or consultant resources will also be integral to Plan execution.
PROACTIVE EFFORTS BY THE TOWN TO SECURE ADEQUATE NEAR TERM RESOURCES WILL BE KEY TO LONG TERM SUCCESS TO:
1. Establish, launch, and monitor new initiatives outlined herein; and
2. Seek, secure, and manage new internal and external funding mechanisms to actualize and facilitate the adoption of these actions (see Section 5. Financing Opportunities).
These resource allocations, along with the specific actions and initiatives listed below, demonstrate the Town's dedicated approach in translating their sustainability vision into tangible results, as well as underscoring the leadership of the Town Manager and Leadership Team.
MUNICIPAL OPERATIONS
✔ Adopted Sustainability as Strategic Plan top priority
✔ Established Sustainability Committee and Sustainability Framework
✔ Adopted Municipal Operations carbon neutrality by 2037 goal
✔ Hired new Town Arborist
✔ Established and hired new Town Sustainability Manager to oversee sustainability and climate programming as of December 2023, supporting all CAP focus areas
TRANSPORTATION & MOBILITY
✔ Awarded participation in the Duke Energy Park & Plug Pilot Program / Electric Vehicle Charging Stations at Public Safety and Circles @ 30
✔ West Branch Greenway has completed over 20 miles of multi-use paths for pedestrians and bicyclists, including: 9.27 miles of greenways/ entrances, 2.56 miles of sidewalks, 4.96 miles of overland connector and 3.39 miles of unpaved trails
✔ Comprehensive plan seeks to develop an incentive program for employees that walk/bike to work or park in remote parking lots

BUILDINGS & ENERGY
✔ Davidson has the most Energy Star and LEED Certified buildings per capita in NC (Residential and College) for cities with populations between 10,000 and 20,000 people
✔ Solar feasibility study in process and funds set aside to add solar panels to Town Hall
✔ Incentivized development projects to incorporate sustainability features through the Utility Services & Annexation Criteria policy
RESOURCE CONSERVATION
✔ One of the first communities in the North Mecklenburg area to arrange for curbside recycling
✔ Launched Davidson Composts community residential organics drop-off program
✔ Parks & Recreation Master Plan seeks to establish composting and recycling programs in all Town P&R facilities
CLIMATE RESILIENCE
✔ Conducted the 2022 Community Risk Assessment and Standards of Cover
✔ Coordinated with Mecklenburg County, along with the City of Charlotte, the Towns of Cornelius, Huntersville, Matthews, Mint Hill, and Pineville, and other partners to complete 2020 Mecklenburg County Multi-Jurisdictional Hazard Mitigation Plan to increase community resilience against current and future hazards
GREEN COMMUNITY
✔ Seeking certification: LEED for Cities and Communities
✔ Continued Easements and Tree Canopy Enhancements
✔ Continued Tree City and Bee City designations
✔ Creating a multi-year plan to address the needs of Davidson's community forest in collaboration with Davidson’s Livability Board, Davidson Lands Conservancy, and local non-profits
✔ 2016 Rural Area Plan supports open space preservation throughout the development process

IMAGE BY: JOE SHEA
CHALLENGES & OPPORTUNITIES
Addressing the issue of climate change is a multifaceted challenge, involving a broad spectrum of challenges in the realms of economics, society, government, regulations, and technology. Overcoming these challenges is crucial for making real advancements. However, within these challenges, there are also substantial opportunities. The actions we take towards climate change in our community are likely to yield a range of benefits that go beyond just environmental improvements, such as better public health and stronger community resilience. In the table below, we have outlined some of the challenges and opportunities related to climate action that have arisen during the planning process.
CHALLENGES
Davidson’s rapid growth over the previous two decades increases overall community emissions even as per capita emissions have decreased with cleaner energy mix gains from local utilities.
Impacts of climate change are experienced disproportionately by disadvantaged communities, who are the least responsible for contributing to climate change and have the fewest resources to withstand its impacts.
While statewide climate targets (EO 246) utilize a baseline year of 2005, Davidson does not have an existing comparable inventory for 2005 base year.
OPPORTUNITIES
Growth provides an opportunity for smart growth, integrated town design, and economic development that can further reduce per capita vehicle miles traveled and provide community co-benefits through increased walkability, bikeability, and transit connectivity.
Engage with frontline communities to direct resources and co-create programmatic design solutions that promote equity, foster community resilience, and protect vulnerable members of the community.
This Plan includes the Town’s first official emissions inventories, establishing a baseline year as 2019. By using a 2019 baseline year rather than 2005, Davidson is adopting a 2050 goal that is a more aggressive target than statewide targets (EO246). Davidson’s 2037 and 2050 goals demonstrate the Town’s climate leadership and put the Town on track to exceed state 2050 goals.
CHALLENGES
Town's authority to act is limited by what the state government allows.
OPPORTUNITIES
The Town can adopt policies and programs consistent with local authority to further climate strategies.
Leverage and grow partnerships within the community, state, and region to support and amplify climate action efforts.
Coordinate with appropriate state or federal associations or networks to support policies can increase ease or speed of strategy adoption for the residents and businesses of Davidson.
The Town has limited direct control over community emissions and actions that contribute to climate change, especially related to two principal generation areas:
(1) vehicle miles traveled (VMT) and
(2) electricity generation sources.
Limited budget and resources currently allocated for implementing climate initiatives.
The Town can serve as a model, showcasing effective community climate actions in the areas of VMT reduction and renewable energy adoption.
Prioritize integrated climate solutions that provide multiple benefits, reduce greenhouse gas emissions, and increase overall resilience to climate impacts.
Develop incentives, education, and technical assistance designed to encourage increased participation and effectiveness by reducing barriers and accelerating adoption.
Track legislative developments relative to such initiatives as energy procurement and advocate for policies that increase local accessibility to programs that can increase emissions reductions.
Tap into new and growing federal and state funding sources like the Inflation Reduction Act to support climate initiatives.
Leverage regional partnerships to increase economies of scale, utilize best practices, and take advantage of mutually beneficial opportunities.
Awareness and education is a primary barrier to participation in many communities.
Prioritizing education, outreach and technical assistance programming across strategies can help remove barriers to participation and accelerate measure adoption.
Davidson benefits from an engaged and educated community. Provide additional training and resources to empower Town staff and community members to help champion and accelerate the implementation of climate initiatives and appropriate new technologies.
UNDERSTANDING DAVIDSON’S EMISSIONS

GREENHOUSE GAS INVENTORY
GREENHOUSE GAS COMMUNITY INVENTORY
GREENHOUSE GAS MUNICIPAL OPERATIONS INVENTORY
GREENHOUSE GAS PROJECTIONS
GREENHOUSE GAS INVENTORY
A Greenhouse Gas inventory is a comprehensive assessment that quantifies and categorizes the greenhouse gas emissions within a defined geographic area, typically a region or municipality. These inventories serve as a fundamental tool for understanding the sources and magnitudes of different greenhouse gas emissions, such as carbon dioxide, methane, and nitrous oxide. By systematically analyzing emissions from various sectors like energy, transportation, industry, and waste, a greenhouse gas inventory provides valuable insights into the carbon footprint of a community or organization. This information is crucial for developing effective climate action plans, setting emission reduction targets, and monitoring progress towards sustainable and low-carbon initiatives.
The CAP planning process included the completion of Davidson’s first Greenhouse Gas Emission Inventory to assess current environmental impacts and establish a baseline for future projections. The methodology utilized the US Community Protocol from the ICLEI ClearPath tool and EPA greenhouse gas emission factors as benchmarks. Best practices from these resources guided the emission estimates for 2019, chosen to represent a typical year against the pandemic-affected years of 2020-2022. The full inventory details can be found in Appendix A
The greenhouse gas inventory examines two tracks: Municipal Operations and Community.
The COMMUNITY inventory covers greenhouse house emissions from Davidson residents, including businesses, individuals, schools, and industrial sources, categorized into sectors: commercial, residential, industrial energy; transportation and mobile services; solid waste; and water and wastewater.
The MUNICIPAL inventory is a subset of these total community emissions, detailing local government-related usage from the community inventory including: buildings and facilities, vehicle fleet, employee commuting, streetlights and traffic signals, and waste from disposal. While greenhouse gas inventories often label emissions from municipal activities as Local Government Operations or LGO, we will use the term Municipal Operations in this CAP.
See the following pages for inventory detail on both tracks. Additional details regarding emissions inventory, analysis and methodology are presented in Appendices A, C.
GREENHOUSE GAS INVENTORY EXAMINES TWO TRACKS:
GREENHOUSE GAS COMMUNITY INVENTORY
In 2019, the Town of Davidson community generated a total of 99,170 metric tons of carbon dioxide equivalent emissions (MT CO2e). As depicted in the figure below, the majority of emissions were from energy, at a combined 54%. Energy sources were further classified into residential and commercial categories to facilitate the identification of reduction strategies.
The subsequent significant contributors were Residential energy, contributing 38% or 37,607 MT CO2e (including electricity, natural gas, LPG, and fuel oil no. 2), and Commercial energy, contributing 16% or 16,226 MT CO2e. The next largest category which accounted for 40%, or 39,691 MT CO2e, originated from transportation and mobile services. The remaining components of the community inventory encompass solid waste (3%), water and wastewater (1%), as well as process and fugitive emissions2 (2%). The following figure summarizes the community inventory.
2 Emissions generally released during transmission of natural gas. Fugitive emissions are emissions due to leaks or other intended irregular release. These inadvertent emissions can occur at various stages of production, processing, storage, transmission, and distribution.
FIGURE 2.1: TOWN OF DAVIDSON COMMUNITY INVENTORY
GREENHOUSE GAS MUNICIPAL OPERATIONS INVENTORY
In 2019, the Town of Davidson’s municipal operations generated a total of 1,036 metric tons of carbon dioxide equivalent emissions (MT CO2e). Employee commute represents a substantial portion, contributing 29% with 297 MT CO2e. Streetlights and traffic signals make up the next largest portion at 24% with 250 MT CO2e3. The Town’s vehicle fleet accounts for 23% of total emissions, emitting 236 MT CO2e. Buildings and facilities follow closely at 20%, contributing 208 MT CO2e. Other contributors include solid waste facilities at 4% (40 MT CO2e) and process & fugitive emissions at less than 1% (2 MT CO2e).
This comprehensive breakdown underscores areas for potential mitigation strategies and emphasizes the importance of addressing transportation and employee commuting for significant emissions reduction. The following figure summarizes the municipal emissions inventory for the Town of Davidson.
3 The emissions attributed to streetlights and traffic signals predominantly arise from streetlights. This is because Davidson currently owns and operates just a single traffic light.
FIGURE 2.2: TOWN OF DAVIDSON MUNICIPAL INVENTORY
GREENHOUSE GAS PROJECTIONS
BUSINESS-AS-USUAL FORECAST
A Business-As-Usual (BAU) forecast is indispensable for municipalities as it serves as a baseline projection, depicting the expected trajectory of the geographic area without specific intervention or changes to current practices.
This forecast acts as a reference point against which the impact of potential strategies and initiatives can be measured. Understanding the BAU scenario is vital for strategic planning, risk assessment, and decision-making. It allows planning processes to anticipate future trends, identify potential challenges, and assess the sustainability of existing practices.
By providing a benchmark for comparison, this BAU forecast enables the Town to make informed choices, optimize resource allocation, and proactively address emerging issues, thereby enhancing resilience and long-term viability in an everevolving landscape, without the influence of outside factors as discussed in the next section. See Appendix C for the methodology.
FIGURE 2.3: TOWN OF DAVIDSON COMMUNITY BUSINESS-AS-USUAL FORECAST
ADJUSTED BUSINESS-AS-USUAL
An Adjusted Business-As-Usual (ABAU) forecast is a strategic projection that goes beyond traditional baseline predictions by incorporating modifications to account for changing circumstances, emerging trends, or specific interventions. An ABAU forecast first assumes the Town continues current practices based on the 2019 baseline emissions inventory, and then adjusts this inventory based on other factors that are reasonably expected to change over the projection term without any direct action by the Town. Such factors may include regulatory requirements, market trends or policy commitments occurring outside of the Town’s direct control, such as fuel economy standards, public utility carbon reduction commitments, or similar initiatives by local transportation or waste management agencies serving the Town.
In the case of the Town of Davidson, the ABAU forecast is influenced by such factors as the Corporate Average Fuel Economy (CAFE) standards as well as commitments by two primary energy providers: Dominion’s goals for carbon reduction; and Duke Energy’s commitments to carbon neutrality. The results of these adjustments are included below within the ABAU forecast.
Unlike a standard BAU forecast, which assumes only a continuation of current practices, an ABAU forecast adapts to evolving factors such as technological advancements, shifts in market dynamics, or policy changes. This forward-looking tool provides a more nuanced and adaptable perspective for stakeholders, allowing them to proactively respond to challenges and seize opportunities in a dynamic environment. The ABAU forecast serves as a valuable guide for decision-makers, helping them make informed choices that align with current realities and enhance overall resilience and agility in the face of uncertainty. See Appendix C for the methodology.
FIGURE 2.4: TOWN OF DAVIDSON COMMUNITY ADJUSTED BUSINESS-AS-USUAL FORECAST
GREENHOUSE GAS COMPARISONS
The table below presents a high level look at the Town of Davidson's greenhouse gas emissions per capita, set against other municipalities in North Carolina and the national average. The information below attempts to contextualize Davidson's environmental footprint within a broader geographic perspective, based on publicly available data from other municipalities. It is important to recognize the provisional nature of this data. Methodologies used to calculate emissions may vary across different communities— stemming from differences in accounting practices, emissions included across Scope 1, 2, and 3, and the specific sources of emissions included—mean that these figures should be viewed as indicative rather than absolute. For Davidson, the per capita emission figure currently stands at 7.61 metric tons (MT) CO2 equivalent (CO2e), which compares favorably with the national average of 14.4 MT CO2e per capita. Nevertheless, we advise readers to interpret these results with the understanding that they are based on a preliminary analysis.
TABLE 2.1: OVERVIEW OF COMMUNITY-WIDE EMISSIONS
4 United States Census Bureau.
5 Town of Chapel Hill. (2017). Community and Municipal Greenhouse Gas Emissions Inventory and Forecast.
6 City of Asheville. (2019). Community Carbon Footprint.
7 Town of Boone. (2021). Community Climate Action Plan.
8 Our World in Data. (2024). United States: Per capita: how much CO2 does the average person emit?
9 City of Charlotte. (2019). Strategic Energy Plan Dashboard.
10 Ibid.
11 Sustainable Carolina. (2022, October 22). By the numbers: Reducing campus GHGs.
12 The University of North Carolina at Chapel Hill. (2024, March 28). By the numbers.
GREENHOUSE GAS COMPARISONS
The table provided below offers a summary of the total emissions attributable only to municipal operations within various municipalities, their share of the total community-wide GHG emissions, and the per capita emissions, quantified in MT CO2 equivalent (CO2e).
MUNICIPAL

TABLE 2.2: OVERVIEW OF MUNICIPAL OPERATIONS EMISSIONS
OUR GREENHOUSE GAS REDUCTION TARGETS

LOOKING OUT TO 2037
LOOKING OUT TO 2050
PRIORITIZING CARBON REDUCTION
LOOKING OUT TO 2037
The Town of Davidson is committed to achieving carbon neutrality within municipal operations by 2037. The Town has selected this aggressive milestone to align with the Town’s bicentennial anniversary and demonstrate its leadership on climate action. Municipal strategies that guide Davidson in accomplishing this goal are outlined in detail with the Municipal Operations portion of the Strategic Roadmap. In line with the greenhouse gas inventory presented above, each strategy area corresponds with major greenhouse gas emissions generation areas related to reducing mobile source emissions, operating sustainable buildings, increasing efficiency in public street lighting, reducing solid waste generation, and developing sustainable policies and procedures to accelerate these efforts.
MUNICIPAL
LOOKING OUT TO 2037
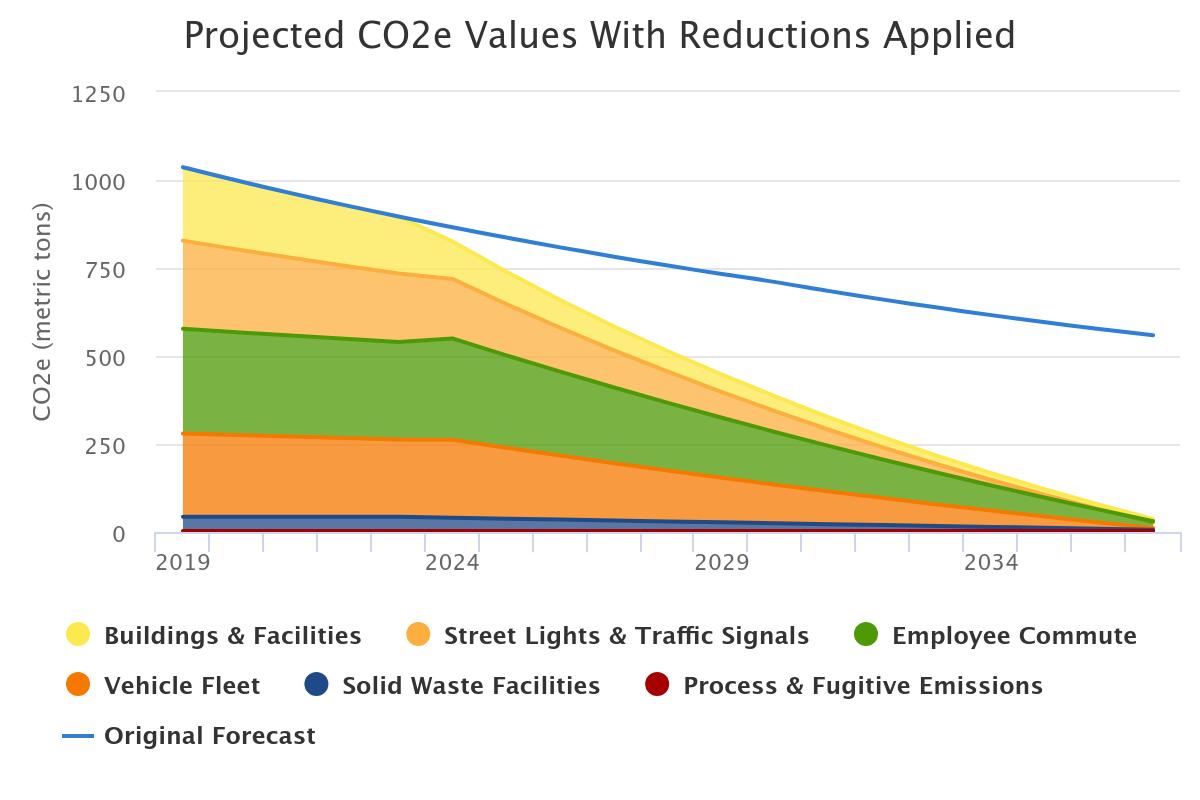
THE FOLLOWING FIGURE ILLUSTRATES THE PROJECTED MUNICIPAL OPERATIONS GREENHOUSE GAS EMISSIONS REDUCTIONS THROUGH 2037.
The blue line represents the Adjusted Business-As-Usual (ABAU) forecast as determined by the 2019 emissions inventory and accounting for anticipated adjustments as described in Section 2.
The yellow and light orange bands represent building energy use and street light/ traffic signal energy use, respectively. Reductions in this sector are anticipated to be primarily derived from energy efficiency and the development of localized renewable energy generation.
The blue band represents solid waste. Reductions here will be primarily driven by the development and implementation of source reduction, procurement, recycling, composting, construction & demolition or other conservation measures as outlined in a municipal Zero Waste Plan.
The green band represents employee commute-related transportation emissions. Reductions in this sector will be principally driven by the reductions in vehicle miles traveled through improved connectivity infrastructure, enhanced education, outreach and incentives programming, and increased multi-modal transport (biking, walking, transit use, etc.).
The dark orange band illustrates the municipal fleet. These reductions will be driven by the conversion of the municipal fleet to electric, hybrid, or clean emission vehicles.
e VALUES WITH REDUCTIONS APPLIED
ORIGINAL FORECAST
BUILDINGS & FACILITIES
STREET LIGHTS & TRAFFIC SIGNALS
EMPLOYEE COMMUTE
VEHICLE FLEET
SOLID WASTE FACILITIES
PROCESS & FUGITIVE EMISSIONS
FIGURE 3.1: TOWN OF DAVIDSON MUNICIPAL EMISSIONS REDUCTIONS FORECAST WITH MEASURES APPLIED
LOOKING OUT TO 2050
Looking towards 2050, the Town of Davidson has committed to a visionary goal of achieving community-wide carbon neutrality. This goal surpasses the statewide benchmarks set by EO246, which are based on the higher per capita emissions of 2005, largely due to the region's previous reliance on coal. Davidson's target is not only more ambitious but also seeks a quicker transition to sustainability. The Town is dedicated to methodically reducing its community-wide emissions through strategic initiatives, demonstrating a proactive and leadership-driven approach to environmental stewardship and setting a precedent for a sustainable future by 2050.
LOOKING OUT TO 2050
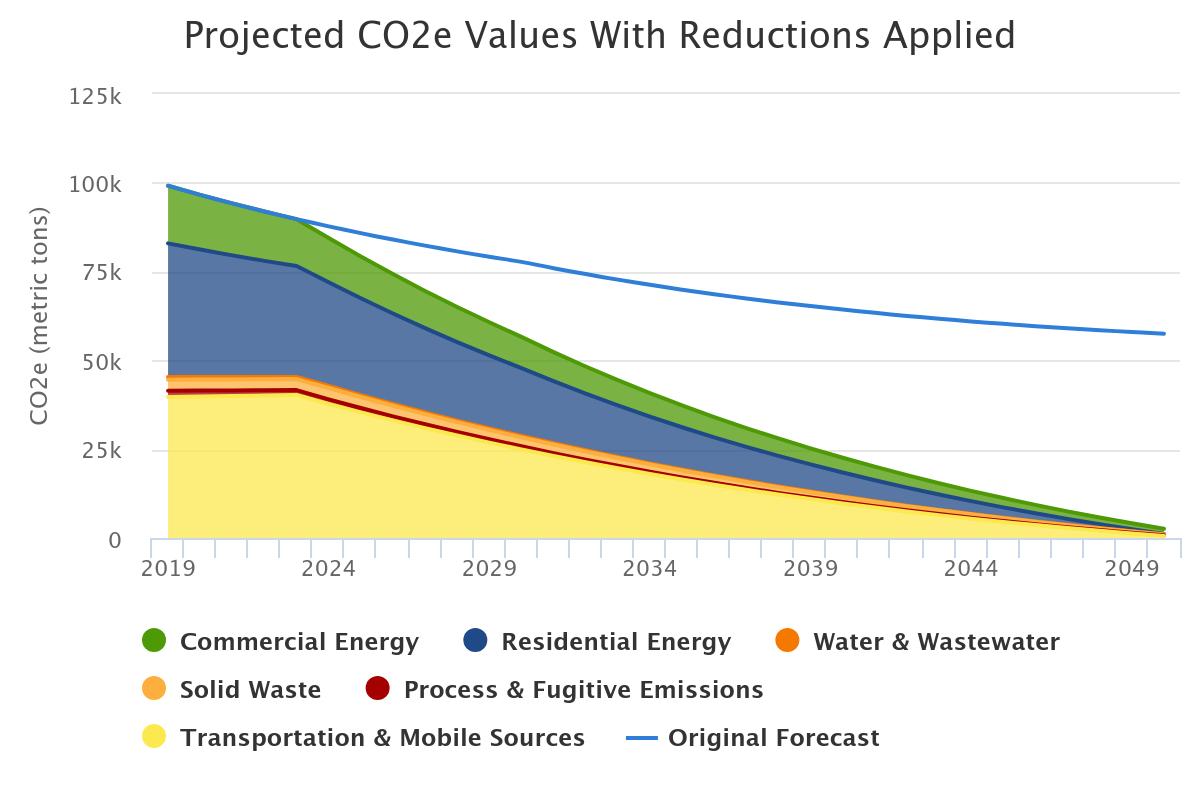
THE FOLLOWING FIGURE ILLUSTRATES THE PROJECTED COMMUNITY GREENHOUSE GAS EMISSIONS REDUCTIONS THROUGH 2050.
The blue line represents the Adjusted Business-As-Usual (ABAU) forecast as determined by the 2019 emissions inventory and accounting for anticipated adjustments as described in Section 2.
The green and blue bands represent commercial and residential energy, respectively. Reductions in this sector are anticipated to be primarily derived from energy efficiency and the development of localized renewable energy generation.
The orange bands represent water, wastewater, and solid waste. Reductions here will be primarily driven by the development and implementation of Municipal and Community Zero Waste Plan(s) as well as water conservation measures.
The yellow band represents transportation and mobile emissions. Reductions in this sector will be principally driven by the reduction in vehicle miles traveled through improved connectivity infrastructure, enhanced education, outreach and incentives programming, and increased multi-modal transport (biking, walking, transit use, etc.).
TRANSPORTATION
FIGURE 3.2: TOWN OF DAVIDSON
PRIORITIZING CARBON REDUCTION
Davidson is committed to maximizing direct emissions reductions within both municipal and community-wide emissions profiles in order to achieve the carbon neutrality goals set forth herein. Davidson is committed to taking action to adopt safeguards that set limits and parameters to ensure appropriately aggressive actions and investments in infrastructure and emissions reducing strategies to remain on track toward mid- and long-term goals.
There are important local benefits in the form of air quality improvements, energy cost savings, and community resilience that can be achieved through carbon reduction strategies requiring investments within the Town of Davidson. In this sense, investments in carbon reduction strategies within Davidson are direct investments in the Davidson community.
75%
EMISSIONS REDUCTION IN BUILDING & ENERGY USE BY 2037
50%
EMISSIONS REDUCTION FROM STREET LIGHTING BY 2037
80% OF ENERGY FROM RENEWABLE ENERGY SOURCES BY 2037
75%
REDUCTION IN WASTE TO LANDFILL BY 2037
4 STRATEGIC ROADMAP

ROADMAP STRATEGIES
ROADMAP TIERS
MUNICIPAL OPERATIONS
MOBILITY & TRANSPORTATION
BUILDINGS & ENERGY
RESOURCE CONSERVATION
GREEN COMMUNITY
CLIMATE RESILIENCE

ROADMAP STRATEGIES
This Strategic Roadmap summarizes the pathway to carbon neutrality for the Town of Davidson, outlining specific strategies and actions to achieve measurable results toward goals. Utilizing the combined contributions of community engagement efforts to gather input for community members, staff, and leadership throughout Davidson, this Plan leverages survey results, workshop ideation synthesis, and focus group refinement, along with key themes and policy commitments from existing planning documents and policies. Strategies were further refined through data analysis of 2019 Municipal and Community greenhouse gas inventories, best practices in climate solutions, and special consideration of local circumstances, constraints, and opportunities unique to the Town of Davidson. This iterative synthesis yields the following Strategic Roadmap to guide the Town toward near, mid, and long-term success. Three tiers of strategies comprise this roadmap: FOUNDATIONAL , SUPPORTIVE , and COMPLEMENTARY
ROADMAP TIERS
FOUNDATIONAL strategies are broken out into four high-impact focus areas: (1) Municipal Operations, (2) Mobility & Transportation, (3) Buildings & Energy, and (4) Resource Conservation. Foundational strategies will be critical to reducing the environmental impacts of climate change and are drawn out as immediate priorities. Davidson will need to make difficult decisions to ensure these strategies are prioritized.
SUPPORTIVE strategies address broader community and governance actions and are presented in two additional essential focus areas: (5) Green Community, and (6) Climate Resilience. Supportive strategies are ranked next in line and indicate strategies that may individually represent lower total emissions reduction potential, but are still critical elements in reducing the environmental impacts, supporting visibility of climate solutions within the community, and in fostering a culture of community support over the short, mid, and long-term.
COMPLEMENTARY actions are presented above within Section 1. Collaboration & Partnership. Complementary actions are those which may lie within the Town’s sphere of influence, but for which the Town may not have full or direct control or decision making authority. Complementary strategies require partnership and collaboration with other entities, such as but not limited to the County of Mecklenburg, Charlotte Area Transit System (CATS), North Carolina Sustainable Energy Association, Charlotte Mecklenburg Utilities, Davidson Lands Conservatory, Davidson Housing Coalition, and others. Although these strategies may have a less direct impact on precise emissions reductions, they are cornerstones to the CAP’s ability to succeed.

ROADMAP TIERS
Through the Strategic Roadmap, foundational and supportive strategies are presented alongside their associated co-benefits and assigned a priority score. Co-benefits are matched to the strategy with which they align. The priority score comes from a qualitative and internal analysis and is derived based on how well it aligns with the co-benefits (e.g., high/medium/low or yes/no). A score of 1 indicates high priority, while 3 signifies lower priority.
GHG REDUCTION
COST EFFECTIVENESS
CO-BENEFITS KEY
GHG REDUCTIONAssessing the potential for reducing greenhouse gas emissions.
COST-EFFECTIVENESSEvaluating the impact relative to the expenditure.
COMMUNITY BENEFITS
RESILIENCE TO STRESSORS
EQUITY & JUSTICE
COMMUNITY BENEFITSConsidering other benefits such as clean air, fostering a livable community, and economic advantages.
RESILIENCE TO STRESSORSContribution to, or neutral impact on, enhancing community resilience in the face of environmental changes.
EQUITY & JUSTICEcMitigating socioeconomic disparities based on race, ethnicity, religion, gender, or other identities.

MUNICIPAL OPERATIONS
This Municipal Operations category encompasses the internal practices and operations of the Town's various departments and facilities which may impact greenhouse gas emissions generation. In 2019, the Town's municipal activities generated a total of 1,033 MT CO2e, making up roughly 1% of the Town's total 99,170 MT CO2e Community emissions. While municipal emissions comprise only a small portion of total community emissions, these emissions represent those for which the Town has the most direct control, and are thus prioritized at the highest level for immediate action. These strategies also serve a complementary goal of demonstrating the Town’s leadership, providing foundational progress applicable to both municipal and community actions, and assisting residents and businesses in taking their own steps to reduce community emissions. Subsequent Strategic Roadmap sections (Mobility & Transportation, Buildings & Energy, Resource Conservation, Green Community, and Climate Resilience) focus on strategies for addressing the Community emissions.
Employee commute data was taken from an employee commute survey as well as data that listed the Towns that employees commuted from in 2019, and the number of full time and part time employees. Consumption from the Town’s fl eet comprising 60 vehicles is the primary source of mobile source emissions, with additional emissions contributed by offroad tools and equipment. The generation and consumption of electricity, along with the combustion of natural gas, are the primary sources of emissions in government-owned and operated buildings and facilities. A survey of employees and custodial staff was conducted to determine the volume of solid waste collected at each government building. A primary early strategy for solid waste reduction will include the completion of a municipal waste characterization study and zero waste plan to both better quantify and outline a specific plan for waste reduction from municipal operations.
13 Additional process and fugitive emissions total comprise <1% of municipal GHG emissions.
MUNICIPAL EMISSIONS ARE COMPRISED OF EMISSIONS FROM THE FOLLOWING THREE CATEGORIES13:
1
2
3
MUNICIPAL OPERATIONS
STRATEGIES AND ACTIONS LISTED WITHIN THE MUNICIPAL OPERATIONS FOCUS AREA INCLUDE INITIATIVES CENTERED WITHIN THE FOLLOWING FIVE CATEGORIES:
1. TRANSPORTATION
Mobile source emissions reduction through fleet electrification, employee commute conversion, and off-road tools and machinery electrification
2. BUILDING ENERGY USE
Load reduction through increased municipal buildings energy efficiency and smart controls, as well as power switching through adoption of renewable energy generation for the remaining energy load
3. STREETLIGHT & TRAFFIC SIGNAL EFFICIENCY
Reduced energy use through increased efficiency, smart controls and renewable energy mechanisms;
4. SOLID WASTE REDUCTION
Reduced waste to landfill through improved source reduction, reuse, recycling, composting and other diversion planning, programs and infrastructure; and
5. GOVERNMENT LEADERSHIP
Adoption of policies and procedures to encourage or require improved practices, and/or incentivize or reduce barriers to participation. Collectively, these actions support Davidson in achieving carbon neutrality in municipal operations by their bicentennial anniversary, 2037.
Strategies herein recognize each component of current municipal emissions and offer tangible climate solutions to reduce or eliminate emissions in each area. Targets are set with consideration of ABAU forecasting, such that anticipated changes in baseline conditions—such as utility provider commitments for increased renewable percentages, utility carbon neutrality goals, vehicle fuel efficiency improvements, etc.—are taken into account. For example, the Town of Davidson receives electricity from Duke Energy and Energy United, both of which have pledged to achieve carbon neutrality by 2050. As such, utility providers are expected to directly contribute to 52% of the anticipated municipal emissions reductions and 58% of the community emissions reductions, aligning with their progress towards individual and state mandates for 2030 and 2050. Actions are established to support aggressive and realistic progress toward targeted reductions. To the degree that strategies are fully realized, municipal emissions will fall to or near zero.
MUNICIPAL OPERATIONS
GOAL M1
REDUCE MOBILE SOURCE EMISSIONS IN TOWN OPERATIONS
STRATEGY ACTION
M1.1
Convert 100% of the Town fl eet to EVs, hybrids, or use clean fuels by 2037
PRIORITY SCORE: 2
CO-BENEFITS:
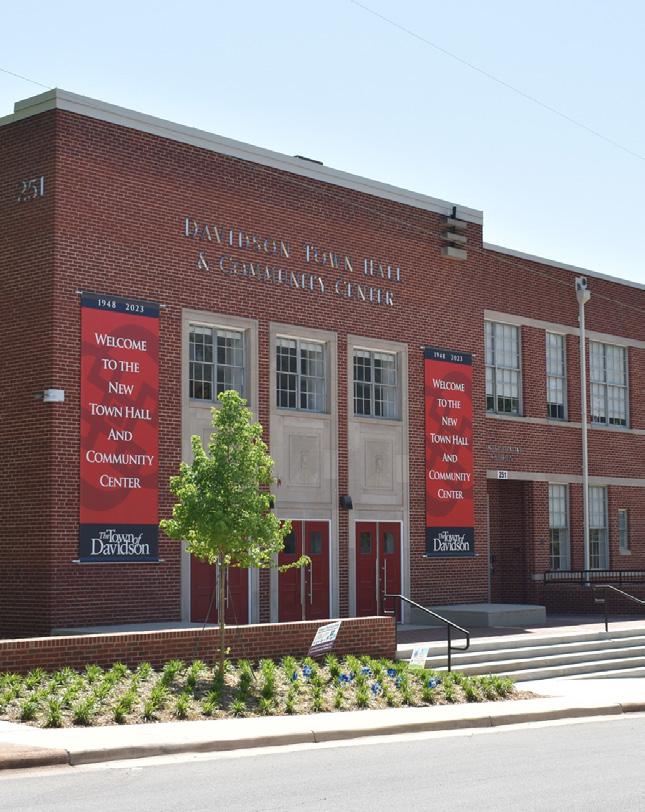
M1.1.1
Develop a Zero-Emission Vehicle (ZEV) Strategy for the Town fl eet that evaluates fl eet conversion to achieve 72.3% emissions reduction. Strategy may include the following: fl eet right-sizing, replacement and/or early retirement schedule, costs and funding opportunities, infrastructure needs, employee work vehicle miles traveled (VMT), idle reduction policy adoption, and opportunities for public-private partnerships.
M1.1.2
Ensure all newly acquired vehicles for town use are either EVs, hybrids, or use clean fuels in line with ZEV Strategy. Establish annual targets to transition fleet to achieve 100% EVs, hybrids, or clean fuels by 2037 target.
STRATEGY ACTION
M1.2
Reduce emissions from Employee Commuting by 30% by 2037
PRIORITY SCORE: 1
CO-BENEFITS:
M1.2.1
Evaluate and monitor emissions from employee commute VMT. Develop and implement telecommuting policies for eligible municipal employees to reduce daily commutes. Develop annual targets, education, and awareness campaign(s) to increase adoption of commute alternatives, idle reduction behaviors, car share, and clean fuel vehicles including, but not limited to, EVs and hybrids (T2.2).
M1.2.2
Offer incentives to municipal employees for commuting via walking, public transit, carpooling, or bicycling, promoting alternatives to solo driving.
M1.2.3
Develop incentives for employees to adopt electric vehicles or hybrids, potentially matching federal tax credits.
STRATEGY ACTION
M1.3
Reduce off-road emissions in Town Operations by 100% by 2037
PRIORITY SCORE: 3
CO-BENEFITS:
M1.3.1
Replace gasoline or diesel-powered Town tools and machinery with electric or battery-powered alternatives by 100% by 2037.
M1.3.2
Consider requiring the use of electric or battery-powered equipment by contractors for Town contracts.
MUNICIPAL OPERATIONS
GOAL M2 OPERATE SUSTAINABLE BUILDINGS
M2.1
Reduce Municipal Building Energy Use by 75% by 2037 STRATEGY ACTION
PRIORITY SCORE: 2
CO-BENEFITS:

M2.1.1
Conduct an energy audit on town buildings to identify savings opportunities and commit to implementing the highest-impact measures in the earliest feasible budget cycle. Formulate a detailed Energy Action Strategy outlining the steps, timeline, and methodology for implementation to ensure prompt action and accountability (May be combined with solar feasibility study (M2.2.1).
M2.1.2
Subscribe to and participate in a building performance-tracking platform for all municipal buildings to increase automation, smart controls, and real time adjustments (E2.2.3). Monitor through real-time, monthly/periodic data reports from the platform, and/or conducting annual assessments to ensure continuous data oversight to allow timely implementation of building improvements.
M2.1.3
Install energy measures as outlined in the Energy Action Strategy (M2.1.1).
M2.2
Obtain 80% of Municipal Energy from Renewable Energy Sources by 2037 STRATEGY ACTION
PRIORITY SCORE: 3
CO-BENEFITS:
M2.2.1
Conduct a Solar Feasibility Study to evaluate the potential and practicality of installing solar panels on town-owned buildings, facilities, and other suitable properties (may be combined with community study E1.1.4).
M2.2.2
Implement solar panel installations on town-owned buildings, facilities, and other suitable properties to generate renewable energy.
M2.2.3
Integrate battery storage solutions with energy installations to store excess energy generated into town operations.
MUNICIPAL OPERATIONS
GOAL M3
INCREASE EFFICIENCY IN PUBLIC STREET LIGHTING
STRATEGY
M3.1
Decrease Energy Usage in Street Lighting by 50% by 2037
PRIORITY SCORE: 3
CO-BENEFITS:

ACTION
M3.1.1
Upgrade all street lights and traffic signals to LED or other energyefficient technologies.
M3.1.2
Implement smart lighting systems in appropriate areas that adjust brightness based on traffic and pedestrian patterns to optimize energy use, consistent with LEED for Cities.
M3.1.3
Encourage the use of solar-powered lighting in appropriate areas to further reduce energy consumption.
MUNICIPAL OPERATIONS
M4 REDUCE SOLID WASTE IN TOWN OPERATIONS

M4.1
Reduce Waste to Landfill by 75% by 2037 in Municipal Operations STRATEGY ACTION
PRIORITY SCORE: 2
CO-BENEFITS:
M4.1.1
Conduct a Waste Characterization Study specifically for municipal operations, which will provide the necessary information to establish diversion rate targets. Following this, implement a tracking system to monitor and manage waste diversion effectively.
M4.1.2
Promote the phasing out of non-recyclables, non-biodegradable materials, and single-use plastics in all municipal activities and building operations. This initiative should also apply to any contractors and be included in new contractual agreements.
M4.1.3
Develop a comprehensive municipal Zero Waste Strategy for recycling, organics, and special wastes (C&D, Universal Waste, E-waste, Hazardous Materials, difficult to recycle materials, etc.). Include management strategies tailored for different municipal departments such as firefighting, public works, parks and recreation, and town hall administration, to increase diversion across all areas of municipal operations. Include management strategies tailored for different municipal departments such as firefighting, public works, parks and recreation, and town hall administration to increase diversion across all areas of municipal operations. This initiative should also apply to any contractors (including but not limited to janitorial agreements) and be included in new contractual agreements. (Combine with community plan R1.1.1)
MUNICIPAL OPERATIONS
GOAL M5 DEMONSTRATE LEADERSHIP IN SUSTAINABLE OPERATIONS
M5.1
Decrease Energy Usage in Street Lighting by 50% by 2037 STRATEGY ACTION
PRIORITY SCORE: 2
CO-BENEFITS:

M5.1.1
Establish a green building policy for all municipal constructions and renovations, setting a standard for sustainable development within the community.
M5.1.2
Develop and Implement an Environmentally Preferable Purchasing Policy (EPPP) for municipal operations to maximize source reduction, consider life-cycle impact, prioritize energy-efficient equipment in town facilities (consistent with Davidson's Energy Action Strategy M2.1), and reduce mobile source emissions from vehicles and off-road tools, machinery, and equipment (M1.1, M1.3).
M5.1.3
Develop sustainable special event and meeting protocols for all townsponsored or town-permitted events, or those held on town properties, facilities, or open spaces.
M5.1.4
Evaluate additional policy options including but not limited to: zoning adjustments to support smart growth, recycling/composting/waste equal space, etc.; permitting requirements, fee structures or incentives to increase EV readiness, renewables installation, energy efficiency adoption, historic building preservation, stormwater capture and management, etc.; establishment of dedicated annual climate capital fund allocations; etc.
MOBILITY & TRANSPORTATION
Transportation is the largest single source of emissions within Davidson, with 40% of all community emissions (39,691 MT CO2e) deriving from vehicle miles traveled (VMT) and 28% of Town operations emissions coming from employee commutes; therefore, reducing fossil fuel vehicle travel is imperative. By increasing active transit like walking and biking and helping create a walkable and bikeable Town, public health and social connectivity will be increased. The strategies and actions in this section are designed to make alternatives to single-occupant, fossil fuel trips easy, convenient, and attractive to residents and visitors. It is also critical to understand the impact of careful land use planning and its effect on sprawl and subsequent VMTs.
STRATEGIES WITHIN THE FOCUS AREA OF MOBILITY AND TRANSPORTATION INCLUDE INITIATIVES WITHIN THE FOLLOWING KEY AREAS:
1. TRANSPORTATION ELECTRIFICATION: increasing awareness and adoption of, as well as infrastructure and readiness for electric, hybrids and clean fueled vehicles;
2. COMMUNITY-WIDE VMT REDUCTION: making a more bikeable, walkable and transit-friendly town through improved infrastructure, programming, and education, as well as alternative commute promotional programs, incentives and awareness building.
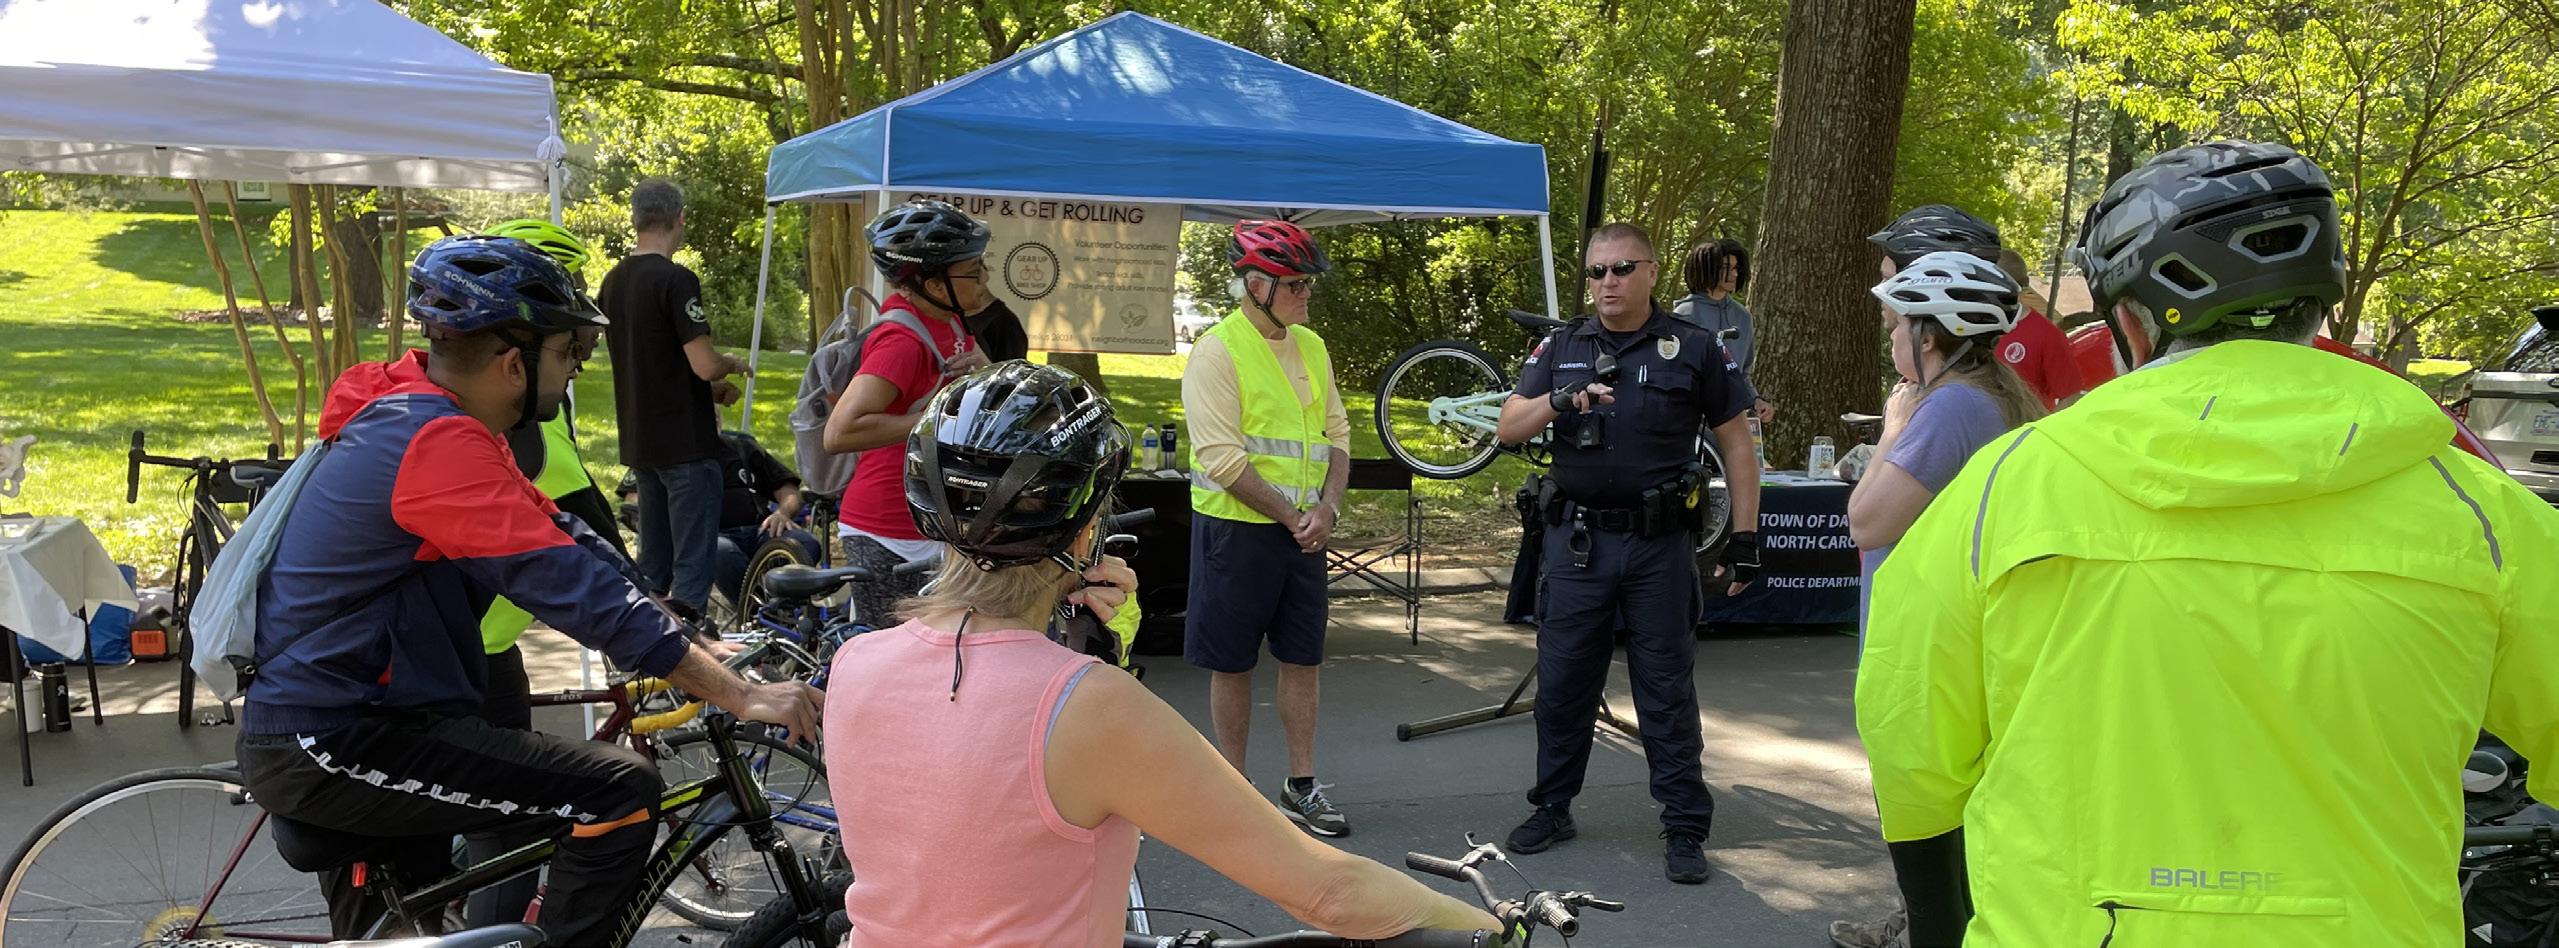
MOBILITY & TRANSPORTATION
GOAL T1 ELECTRIFY TRANSPORTATION
T1.1
Expand Electric Vehicle (EV) Community-wide Infrastructure STRATEGY ACTION
PRIORITY SCORE: 2
CO-BENEFITS:

T1.1.1
Install 4 new Level 2 (or higher) EV charging stations throughout the town, prioritizing areas that have faced disinvestment and ensuring equitable access, and actively pursue grant funding to support the installation and maintenance of these stations.
T1.1.2
Create a guide for local businesses and residents on setting up EV charging stations on their properties including information on various types of chargers, electrical requirements, and the installation procedure for EV chargers.
T1.1.3
Promote the integration of EV charging infrastructure in new developments by encouraging pre-wiring for both residential and governmental fleet EV charging, including provisions for at-home and in-building installations.
T1.2
Promote Community-wide Alternative Vehicle Awareness and Adoption STRATEGY ACTION
PRIORITY SCORE: 1
CO-BENEFITS:
T1.2.1
Facilitate collaborations with EV, hybrid, and other clean fuel owners and leverage testimonials from residents and government staff who use EVs to promote electric vehicle adoption and awareness. Engage with dealerships beyond municipal boundaries for demonstration events and to inform the community about available EV options and incentives.
T1.2.2
Develop and promote a comprehensive information hub that outlines available federal tax credits and local incentives to support potential EV purchasers, incorporating specific incentives designed for disadvantaged groups.
MOBILITY & TRANSPORTATION
GOAL T2 REDUCE CITY-WIDE VEHICLE MILES TRAVELED

T2.1
Create a Walkable, Bikeable, and Transit-Friendly Town STRATEGY ACTION
PRIORITY SCORE: 2
CO-BENEFITS:
T2.1.1
Fully implement the 2019 Mobility Plan by 2027 and make adjustments as needed using up-to-date data to identify and address barriers to active transportation.
T2.1.2
Develop regional education and outreach strategies and tools designed to increase demand for and utilization of public transit by increasing ease of public transit options.
T2.1.3
Develop and maintain a network of safe and well-lit pedestrian and bicycle pathways, focusing on tree-lined routes for climate resilience and comfort, in alignment with the 2019 Mobility Plan. Improve infrastructure, such as shade, shelters, restrooms, and seating areas along greenways and other transportation routes to enhance the comfort of pedestrians and cyclists.
T2.1.4
Review current parking policies to reduce car reliance, such as adjusting parking minimums and promoting shared parking, alongside exploring paid parking strategies in alignment with the mobility plan.
T2.1.5
Explore the feasibility of shared micro-mobility program such as e-bike, bicycles, or electric scooters, focusing on strategic station placement, user safety, ease of use and cost-effectiveness.
T2.1
Encourage Alternate Commuting Practices in the Community STRATEGY ACTION
PRIORITY SCORE: 2
CO-BENEFITS:
T2.2.1
Develop commuter incentive programs in partnership with businesses to create trip reduction outreach programs and offer alternative transportation incentives for business employees.
T2.2.2
Encourage carpooling by exploring partnerships with existing vanpool programs, providing preferential parking for carpoolers. Collaborate with large employers and commercial regions to incentivize participation in strategic locations where commute volume is highest.
T2.2.3
Initiate an idle reduction campaign focused on government buildings, schools and transit points to raise community awareness about the environmental and health consequences of vehicle idling.
BUILDINGS & ENERGY
The second largest emissions contribution source for the community is Energy and Buildings. Residential energy use is the largest source of these emissions at 38% (37,607 MT CO2e) of community emissions, while non-residential (commercial and industrial) energy use comprises an additional 16% (16,226). Combined, these emissions contribute a total of 54% of community emissions, over half of all emissions in the Town of Davidson, making this focus area particularly important for achieving the Town’s overall emissions reduction goals. These contributions are the result of emissions originating from onsite burning of natural gas and electricity procurement in residential, commercial, and industrial structures.
This focus area deals with the energy efficiency of buildings, both residential and commercial, building audits to reduce energy use, and the adoption of renewable energy sources. It includes building codes, retrofitting existing structures, and encouraging new energy-efficient constructions.
STRATEGIES IN THIS FOCUS AREA PUT AN EMPHASIS ON THE FOLLOWING INITIATIVES:
1. RENEWABLE ENERGY SOURCES - increasing adoption of community and private renewable energy systems for residents, businesses and disadvantaged populations; and
2. ENERGY EFFICIENCY - decreasing building energy use in residential, commercial and low-income communities through energy audits, education, efficiency, weatherization, code improvements, natural gas or other fuel system electrification, and smart control systems.
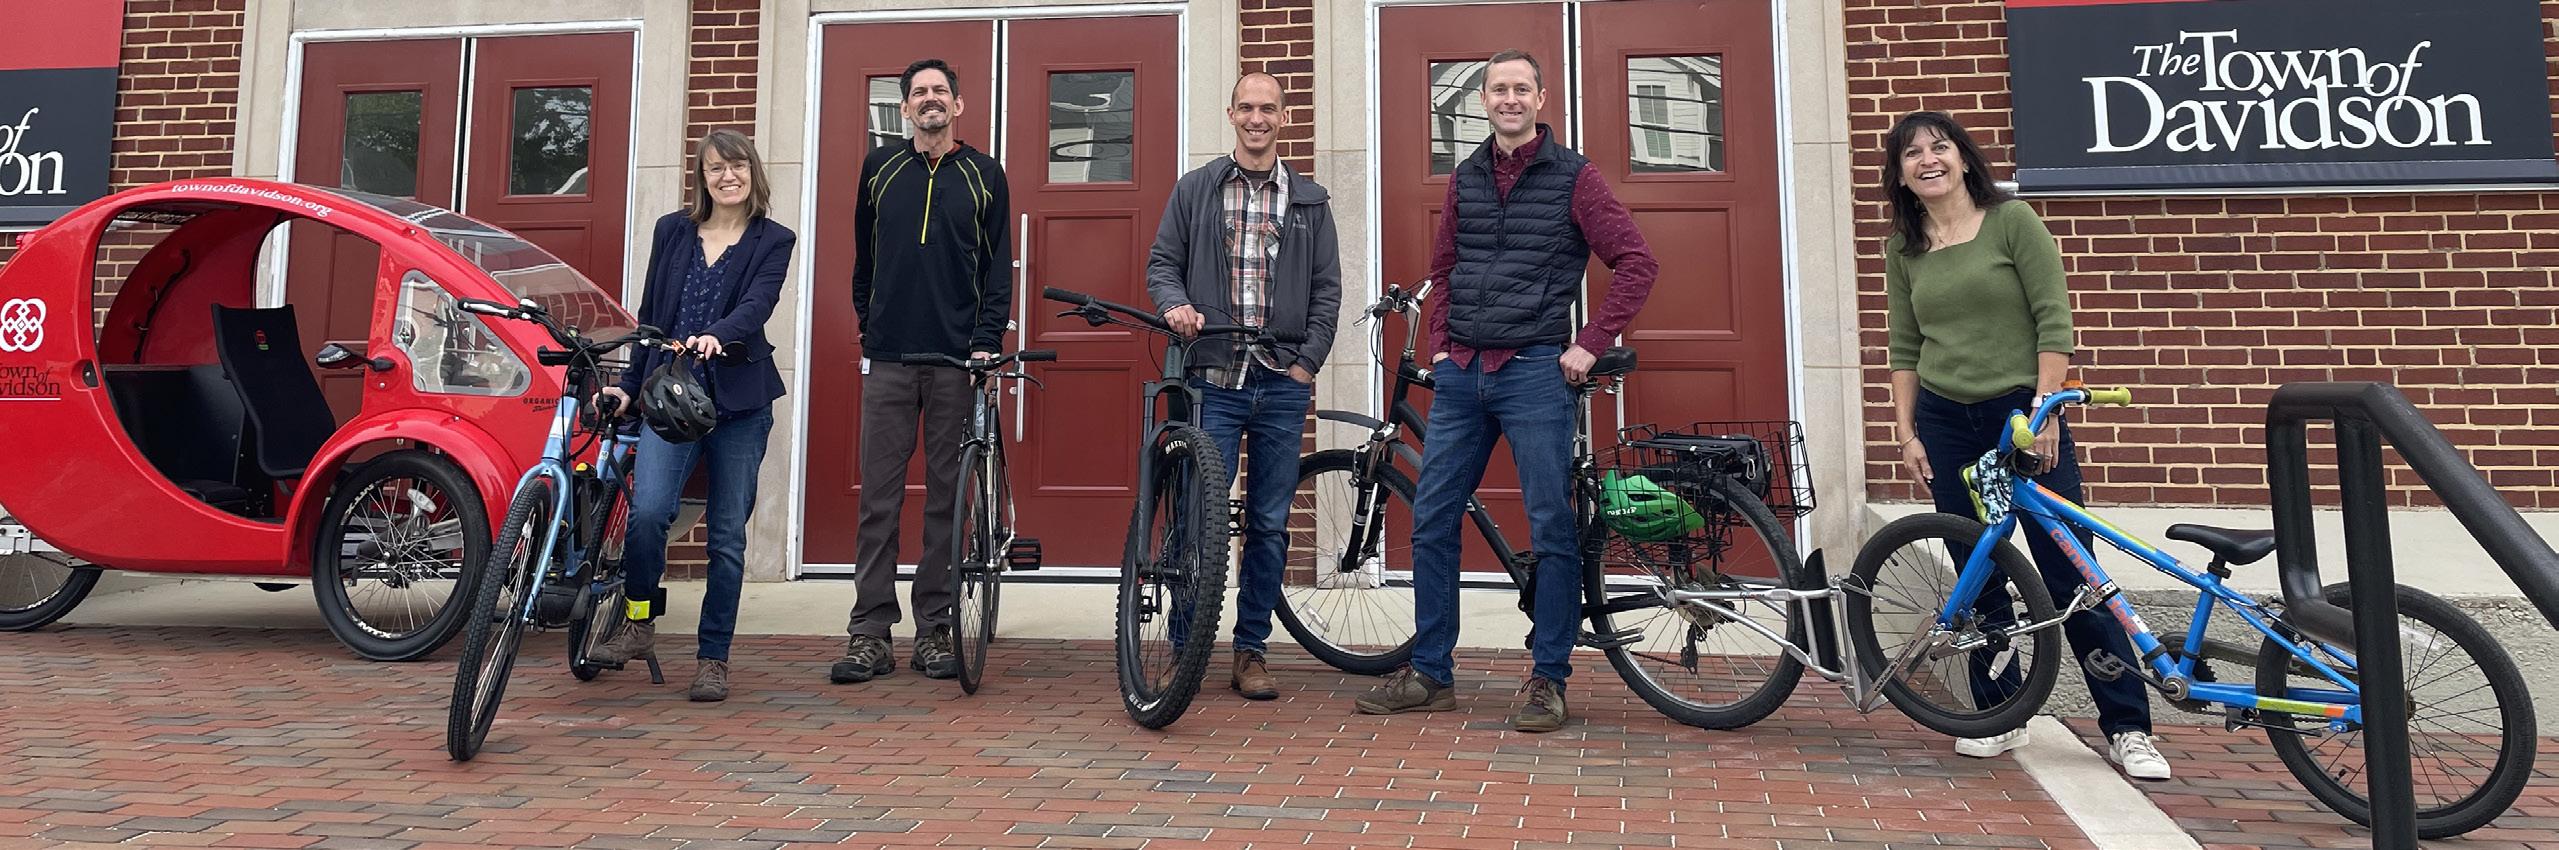
BUILDINGS & ENERGY
GOAL E1
INCREASE RENEWABLE ENERGY
USAGE
E1.1
Promote and Facilitate Commercial & Residential Renewable Energy Adoption
PRIORITY SCORE: 1
CO-BENEFITS:

E1.1.1
Advocate for utility policies and monitor utility programs to ensure accountability and fulfillment of their commitments.
E1.1.2
Identify and eliminate barriers to small-scale distributed renewable energy production by exploring programs such as the DOE SolSmart Funding program for streamlined permitting.
E1.1.3
Develop and promote initiatives that encourage renewable energy adoption among residents and businesses, such as group purchasing programs similar to Solarize The Triangle.
E1.1.4
Conduct Feasibility Studies for Community Solar to assess the viability, potential locations, and scale of community solar projects within the town.
E1.1.5
Develop targets for residential and/or commercial solar energy systems adoption (e.g., achieve 20% adoption in 5 years, achieve 80% renewable energy generation by 2050). Include specific targets, incentives, and resources for low-income communities, renters, and multifamily housing to address social equity and increase access especially for disadvantaged populations.
BUILDINGS & ENERGY
GOAL E2
IMPROVE EFFICIENCY OF NEW & EXISTING BUILDINGS
STRATEGY ACTION
E2.1
Encourage energy efficiency of residential homes
PRIORITY SCORE: 1
CO-BENEFITS:

E2.1.1
Promote incentives and programs specifically designed for homeowners and renters to improve the energy efficiency of residential properties, including historic buildings. Highlight initiatives like Duke Energy's On-bill financing and the Inflation Reduction Act (IRA) tax credits, which can significantly reduce the cost of energy-efficient upgrades in homes.
E2.1.2
Increase home energy audits by promoting training programs to enhance the local workforce of certified energy auditors and installers in addition to promoting utility-provided audit services.
STRATEGY ACTION
E2.2
Encourage energy efficiency in commercial buildings
PRIORITY SCORE: 2
CO-BENEFITS:
E2.2.1
Promote incentives for businesses, including but not limited to those in historic buildings, to adopt energy-efficient technologies and green building practices. Examples include tax rebates for retrofitting facilities with LED lighting or high-efficiency HVAC systems, and grants for achieving LEED certification. Highlight the long-term cost savings and environmental benefits to motivate business participation.
E2.2.2
Specifically target small and medium-sized businesses with energy retrofit and rebate opportunities, including those in historic buildings.
E2.2.3
Offer subsidies for local institutions (schools, churches, businesses, historic buildings, etc.) to join the building performance-tracking municipal buildings initiative to foster a collaborative effort towards a town-wide energy management program (M2.1.3).
BUILDINGS & ENERGY
GOAL E2 IMPROVE EFFICIENCY OF NEW & EXISTING BUILDINGS
E2.3
Ensure new developments meet high energy-efficiency standard STRATEGY ACTION
E2.3.1
Apply the Utility Service Annexation Criteria (USAC) to direct developers towards energy-efficient building, encouraging electrification, and providing 'make-ready' infrastructure for solar and EV charging capabilities.
E2.3.2
PRIORITY SCORE: 2
CO-BENEFITS:
Provide resources, tools, and checklists to builders and developers to achieve green certifications.
E2.4
Improve energy efficiency in low-income households STRATEGY ACTION
E2.4.1
Promote programs such as the Weatherization Assistance Program to promote access to energy audits and weatherization services for low-income households, with outreach and support services to guide them through the process of applying for and benefiting from these programs.
E2.4.2
PRIORITY SCORE: 1
CO-BENEFITS:
Advocate for and support the implementation of policies that protect lowincome tenants from the impacts of energy inefficiency, such as high utility bills and poor indoor environmental quality.
E2.4.3
Encourage all new housing units to comply with Enterprise Community Partners Green Communities criteria or other green building program to ensure sustainability practices are considered and incorporated in affordable housing developments.
RESOURCE CONSERVATION
The third major category of emissions within the Town of Davidson is emissions related to solid waste generation and energy use associated with water and wastewater processes that service the Town, totaling 4.3% (4,286 MT CO2). Emissions resulting from the waste sector are derived from estimated methane production due to decomposition of solid waste generated in the Town.
By better understanding the Town’s waste composition through the completion of a waste characterization study, and through the adoption of enhanced zero waste programming and services informed by this analysis, the Town can reduce total waste to landfill and associated emissions. Landfill emissions are of particular importance due to the contribution of methane, a more potent greenhouse gas with a shorter half-life as compared to carbon dioxide.
Waste reduction, reuse, recycling, composting and other targeted diversion programs can make significant progress toward reduction of landfill gas emissions. Water conservation, low- fl ow infrastructure, water capture and other behavior change education programs are key mechanisms for reducing water use and associated wastewater generation, and thereby reducing energy related emissions from water delivery and wastewater processing.

RESOURCE CONSERVATION
This category encompasses the sustainable management and conservation of natural resources, including water, land, and materials. It focuses on reducing waste, recycling, and promoting the sustainable use of resources through such mechanisms as reduced consumption (source reduction, reuse), waste diversion (recycling, composting), and responsible purchasing (environmentally preferable purchasing policies).
STRATEGIES IN THIS FOCUS AREA INCLUDE:
1. SUSTAINABLE WASTE MANAGEMENT - increasing source reduction, reuse, recycling, composting and other diversion programs toward zero waste goals;
2. WATER CONSERVATION- decreasing water use through efficiency, water capture, smart controls, landscaping and infrastructure; and
3. EDUCATION - increasing resource conservation adoption by removing barriers to participation through awareness, information, incentives and technical assistance.

RESOURCE CONSERVATION
GOAL RC1
ADVANCE SUSTAINABLE WASTE MANAGEMENT PRACTICES IN DAVIDSON
STRATEGY ACTION
RC1.1
Reduce Consumption & Solid Waste
PRIORITY SCORE: 3
CO-BENEFITS:

RC1.1.1
Adopt a Zero-Waste Goal and create a Solid Waste Management Plan or Waste Reduction Plan to achieve diversion targets for all waste streams (may be combined with RC1.1.2 Study). Expand or enhance service agreements to include minimum diversion targets for franchised waste haulers for residents, businesses and multifamily facilities within the Town.
RC1.1.2
Conduct Davidson specific or collaborate with County to conduct an updated regional Waste Characterization Study to guide diversion programming and focus areas (may be combined with RC1.1.1 Plan).
RC1.1.3
Continue, expand, and promote the Davidson Composts program with food waste hauler for residential participation (Pilot initiated 2023, continued for 2023/24), while also promoting backyard composting as an alternative practice, tracking participation through frequent community surveys.
RC1.1.4
Establish and promote commercial services for the Davidson Composts program with food waste hauler (currently unavailable as a free service; businesses, schools, and nonprofits organizations can contract directly with Crown Town Compost; promote these services in absence of Town program).
RC1.1.5
Assess and improve current yard waste management by promoting efficient and sustainable best practices like 'leave the leaves'.
RC1.1.6
Leverage grants, such as those from NCDEQ, to fund and incentivize programs like food waste collection, encouraging businesses and multifamily residences to implement new and sustainable waste management practices.
STRATEGY ACTION
RC1.2
Promote Reduction in Water Usage and Wastewater Management
PRIORITY SCORE: 3
CO-BENEFITS:
RC1.2.1
Develop and promote standard operating procedures for water-efficient fixtures and equipment in all building types and landscapes, in collaboration with Charlotte Water.
RC1.2.2
Explore the implementation of cistern systems for commercial buildings to utilize rainwater for irrigation and vehicle washing, in collaboration with Charlotte Water.
BUILDINGS & ENERGY
MANAGEMENT PRACTICES IN DAVIDSON
STRATEGY ACTION
RC1.3
Education and Community Engagement
PRIORITY SCORE: 2
CO-BENEFITS:
RC1.3.1
Launch a comprehensive education and outreach campaign with specific goal(s), such as achieving zero waste by 2037 (may be combined with RC1.1.1 Plan). This could encompass organizing informative visits to waste centers and introducing programs that elucidate the complexities of recycling.
RC1.3.2
Develop a waste audit (or waste assessment) education and outreach program targeting community sectors like commercial entities (businesses/ restaurants/grocery), schools, multifamily facilities, and residents. Set an annual target for completed assessments and distribution of incentives, tools, and/or support materials.
RC1.3.3
Continue providing community workshops on backyard composting and food management techniques (food purchasing, preservation, cooking, canning, storage, and edible food donation).
RC1.3.4
Develop a circular economy education program to promote opportunities for residents and businesses to increase source reduction through reuse, recycled content procurement, donation, and other programs. Develop recycled market development incentives for local businesses working to utilize recycled content in new product development or remanufacturing, or other mechanisms for utilization of traditional 'waste' as a resource.
GREEN COMMUNITY
This area focuses on fostering a community-wide culture of sustainability, encompassing education, community engagement, and green lifestyle choices. This category emphasizes preservation of the environment, ecology, and ecosystem health.
STRATEGIES WITHIN THIS FOCUS AREA INCLUDE:
1. LAND CONSERVATION to protect natural systems, sequester soil carbon, conserve agricultural lands, protect wildlife, and enhance community wellness, and improve air quality;
2. GREEN INFRASTRUCTURE - strengthen stormwater management programs and practices, porous surfaces, runoff management and rainwater capture and storage;
3. COMMUNITY ENGAGEMENT - increase awareness and participation in green initiatives through promotion, incentives and technical assistance; and
4. TREE CANOPY - increasing the presence and health of trees within the Davidson community.
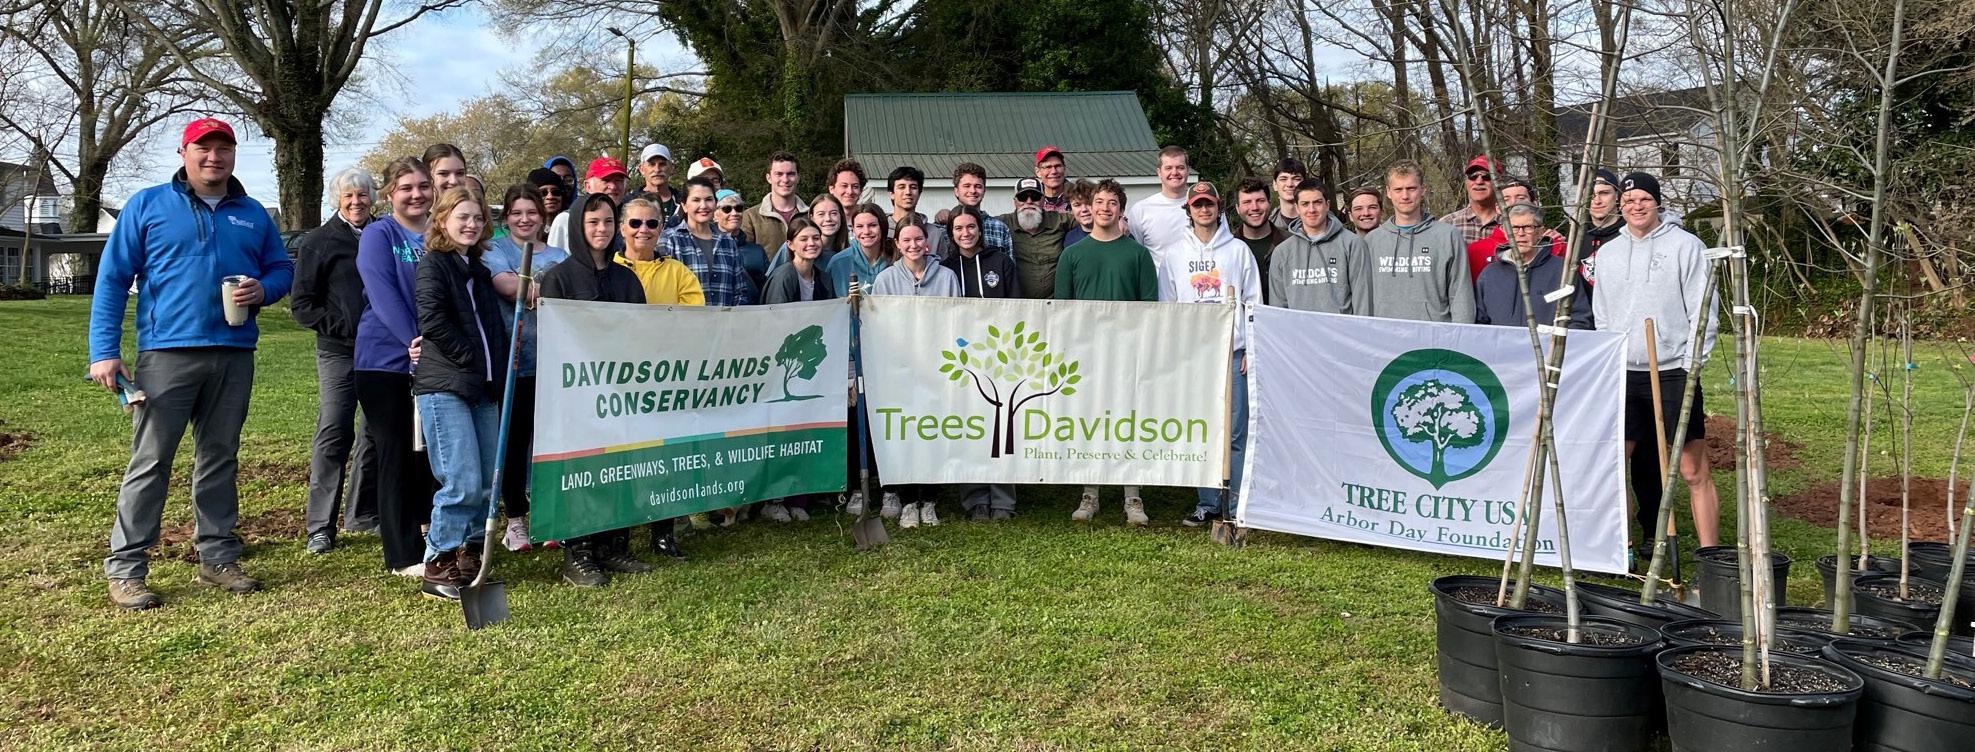
GREEN COMMUNITY
GOAL G1
PRESERVE AND STRATEGICALLY DEVELOP LANDSCAPES

G1.1
Prioritize Conservation and Sustainable Land Practices STRATEGY ACTION
PRIORITY SCORE: 3
CO-BENEFITS:
G1.1.1
Assess and prioritize areas for preservation by collaborating with experts such as The Green Infrastructure Center, ensuring land with significant conservation value is protected. Evaluate the 2008 Green Print Plan and update as appropriate.
G1.1.2
Explore funding opportunities to support land and wildlife conservation efforts, prioritizing land with high conservation value and areas with limited green space to improve livability and improve air quality. Coordinate with natural resources, fish and wildlife and other appropriate state and local agencies to leverage technical assistance, incentives and resources.
G1.1.3
Promote and connect agricultural and open space landowners to incentives and resources for land conservation, carbon sequestration, and soil health, which may include carbon capture and credits, University extension office, USDA, NRCS, Mecklenburg County Farmland Preservation Plan, and similar resources.
GREEN COMMUNITY
GOAL G2
STRENGTHEN GREEN INFRASTRUCTURE AND STORMWATER MANAGEMENT
STRATEGY ACTION
G2.1
Enhance Stormwater Management
PRIORITY SCORE: 3
CO-BENEFITS:

G2.1.1
Assess and modify the town's stormwater management infrastructure to integrate rainwater capture and distributed treatment best management practices, emphasizing low impact development measures and permaculture design principles at the municipal and community level. This approach would involve implementing numerous smaller-scale BMPs, such as rain gardens, green roofs, permeable pavements, and bioswales, rather than relying solely on larger retention ponds. Ensure that these modifications align with Mecklenburg County stormwater guidelines and comply with state regulations.
G2.1.2
Launch rainwater collection programs, such as rain barrel distribution, and explore collaboration possibilities with Mecklenburg County Soil & Water, Rain Water Solutions, or similar entities.
GOAL G3
ENGAGE THE COMMUNITY IN GREEN INITIATIVES

G3.1
Awareness on Green Benefits and Practices STRATEGY ACTION
PRIORITY SCORE: 3
CO-BENEFITS:
G3.1.1
Launch a comprehensive Green Business Program that includes creating and maintaining a green business database, providing a curated catalog of sustainability resources, to encourage and showcase measurable environmental improvements across all businesses, with special city promotion for actively participating companies.
G3.1.2
Explore initiatives to integrate affordable housing solutions within green benefits and practices awareness campaigns. Incorporate and promote equity and inclusion as a central theme throughout CAP program design and implementation.
G3.1.3
Continue BeeCity affiliate status established in 2017 and actively promote the BeeCity initiative within the community to raise awareness of pollinatorfriendly practices and their significance in environmental sustainability. Lead by example by expanding the presence of pollinator gardens throughout the Town wherever feasible.
G3.1.4
Promote the Davidson Farmers Market's role in promoting locally sourced food and highlight any sustainable practices used to help educate the community.
G3.1.5
Assess and modify the town's stormwater management infrastructure to integrate sustainable rainwater capture and management, distributed treatment best management practices, emphasizing low impact development measures at the municipal and community level. This approach would involve implementing numerous smaller-scale BMPs, such as rain gardens, green roofs, permeable pavements, and bioswales, rather than relying solely on larger retention ponds. Ensure that these modifications align with Mecklenburg County stormwater guidelines and comply with state regulations.
G3.1.6
Identify, prioritize, and designate park land as a demonstration site for sustainable practices and community engagement.
GREEN COMMUNITY
GOAL G4
STRENGTHEN ECOSYSTEM HEALTH AND GREEN SPACE CONSERVATION
G4.1
Reinforce Tree Canopy Management, Sustainable Landscaping, and Land Conservation STRATEGY ACTION
PRIORITY SCORE: 2
CO-BENEFITS:

G4.1.1
Investigate incentives for encouraging the planting of shade trees and native plants on private property, drawing inspiration from models like the Casey Trees (DC) program and the Cherry Blossom Festival sponsored tree initiative on private land.
G4.1.2
Develop a comprehensive Tree Canopy Master Plan incorporating findings from the second Tree Canopy inventory (approximately 3,000 trees total) and two canopy assessments to guide tree canopy management and conservation efforts.
G4.1.3
Continuously update the Tree Canopy inventory to ensure accurate and current data on Davidson's tree canopy coverage. Develop and promote incentives to maintain and increase tree canopy. Continue Tree City USA affiliate status.
G4.1.4
Utilize Town-owned or operated open spaces to demonstrate sustainable landscaping and low-impact design planting strategies, such as planting native trees and plants, community gardens, water management design, and educational natural areas.
CLIMATE RESILIENCE
This focus area is concerned with preparing for and adapting to the impacts of climate change. It includes assessing climate risks, fortifying infrastructure, and developing response strategies to climatic events.
STRATEGIES WITHIN THIS FOCUS AREA INCLUDE:
1. ADAPTING TO CHANGING CONDITIONS - increasing adaptation readiness and emergency preparedness;
2. VULNERABILITY UNDERSTANDING - increasing understanding of and responding to vulnerabilities to climate risk; and
3. AWARENESS - educating and preparing of residents, businesses and the broader Davidson community for environmental changes.
CLIMATE RESILIENCE
GOAL CR1
ENHANCE COMMUNITY RESILIENCE AGAINST EXTREME CLIMATE EVENTS
CR1.1
Integrate Adaptation into Emergency Preparedness and Response STRATEGY ACTION
PRIORITY SCORE: 3
CO-BENEFITS:

CR1.1.1
Establish and equip designated municipal facilities - like the police department, fire department, library, and town hall - as climate resilience hubs, providing safe spaces during extreme weather events.
CR1.1.2
Launch community awareness campaigns on the dangers of heat-related illnesses and the locations of cooling centers.
CR1.1.3
Conduct a comprehensive assessment and upgrade of essential infrastructure—including electrical grids, water supply systems, and communication networks—to prevent storm-related damage and ensure continuity during emergencies.
CR1.1.4
Strengthen early warning systems specifically for climate hazards and heat episodes.
CLIMATE RESILIENCE GOAL CR1 ENHANCE COMMUNITY RESILIENCE AGAINST EXTREME CLIMATE EVENTS
STRATEGY ACTION
CR1.2
Understand & Reduce Physical Risk
PRIORITY SCORE: 3
CO-BENEFITS:
CR1.2.1
Participate in regional vulnerability assessments, emphasizing comprehensive recovery actions to help offset associated costs.
CR1.2.2
Establish a town-level vulnerability assessment team, tasked with creating an energy assurance plan to evaluate energy infrastructure, emergency management protocols, and critical infrastructure resilience, ensuring the town's adaptability to emerging climate challenges, in coordination with regional partners.
CR1.2.3
Prioritize green infrastructure such as permeable surfaces and cool surfaces in new developments to reduce the heat island effect and manage stormwater.
CR1.2.4
Integrate resilience measures in future housing developments, especially in affordable housing projects, in alignment with the 2009 Energy Plan.
CR1.2.5
Explore the feasibility of community microgrids in collaboration with local colleges as part of a local and regional resilience strategy.
STRATEGY ACTION
CR1.3
Educate and Protect Residents
PRIORITY SCORE: 2
CO-BENEFITS:
CR1.3.1
Establish a centralized communication platform detailing climate-related risks, including wildfire smoke, heat, drought, and flooding.
CR1.3.2
Conduct regular community engagement sessions to gather feedback on climate communication effectiveness.
CR1.3.3
Implement targeted outreach programs to ensure vulnerable and underserved populations (e.g. isolated seniors, outdoor workers, long-term care residents) receive tailored information and resources. This could involve working with local community leaders and organizations to address language barriers, accessibility issues, and cultural sensitivities, ensuring equitable access to climate information and resources.
5 IMPLEMENTATION

IMPLEMENTATION FRAMEWORK
MONITORING & REPORTING FINANCING OPPORTUNITIES
WHAT THE COMMUNITY CAN DO TO HELP
IMPLEMENTATION FRAMEWORK
Implementation of Climate Action Plans require an integrated multidisciplinary approach, which unifies actions across Town departments and the broader community, while leveraging the embedded expertise of specific departments, Staff and Community resources appropriately. The Town’s leadership, elected officials, and staff members will all be responsible for and contribute to the success of this effort. To support this process, Town department(s) have been identified as lead implementers for each foundational strategy. The Lead Department will serve as the primary responsible party for implementation of actions and in support of higher-level goals. Overall implementation will be overseen by Davidson’s Sustainability Manager within the Parks & Recreation Department, while individual strategy or action responsibilities may vary across Town departments. The Sustainability Manager will coordinate across all departments and lead staff positions to ensure continuity across all efforts as well as uniform and centralized monitoring, progress, and reporting related to each action, strategy, goal, and target. Additionally, implementation may rely on contributions by Town leadership, various staff across departments, as well as participation by non-governmental organizations, businesses, residents, and other members of the public. Regular coordination with the Town’s Sustainability Committee will also help guide progress toward objectives.
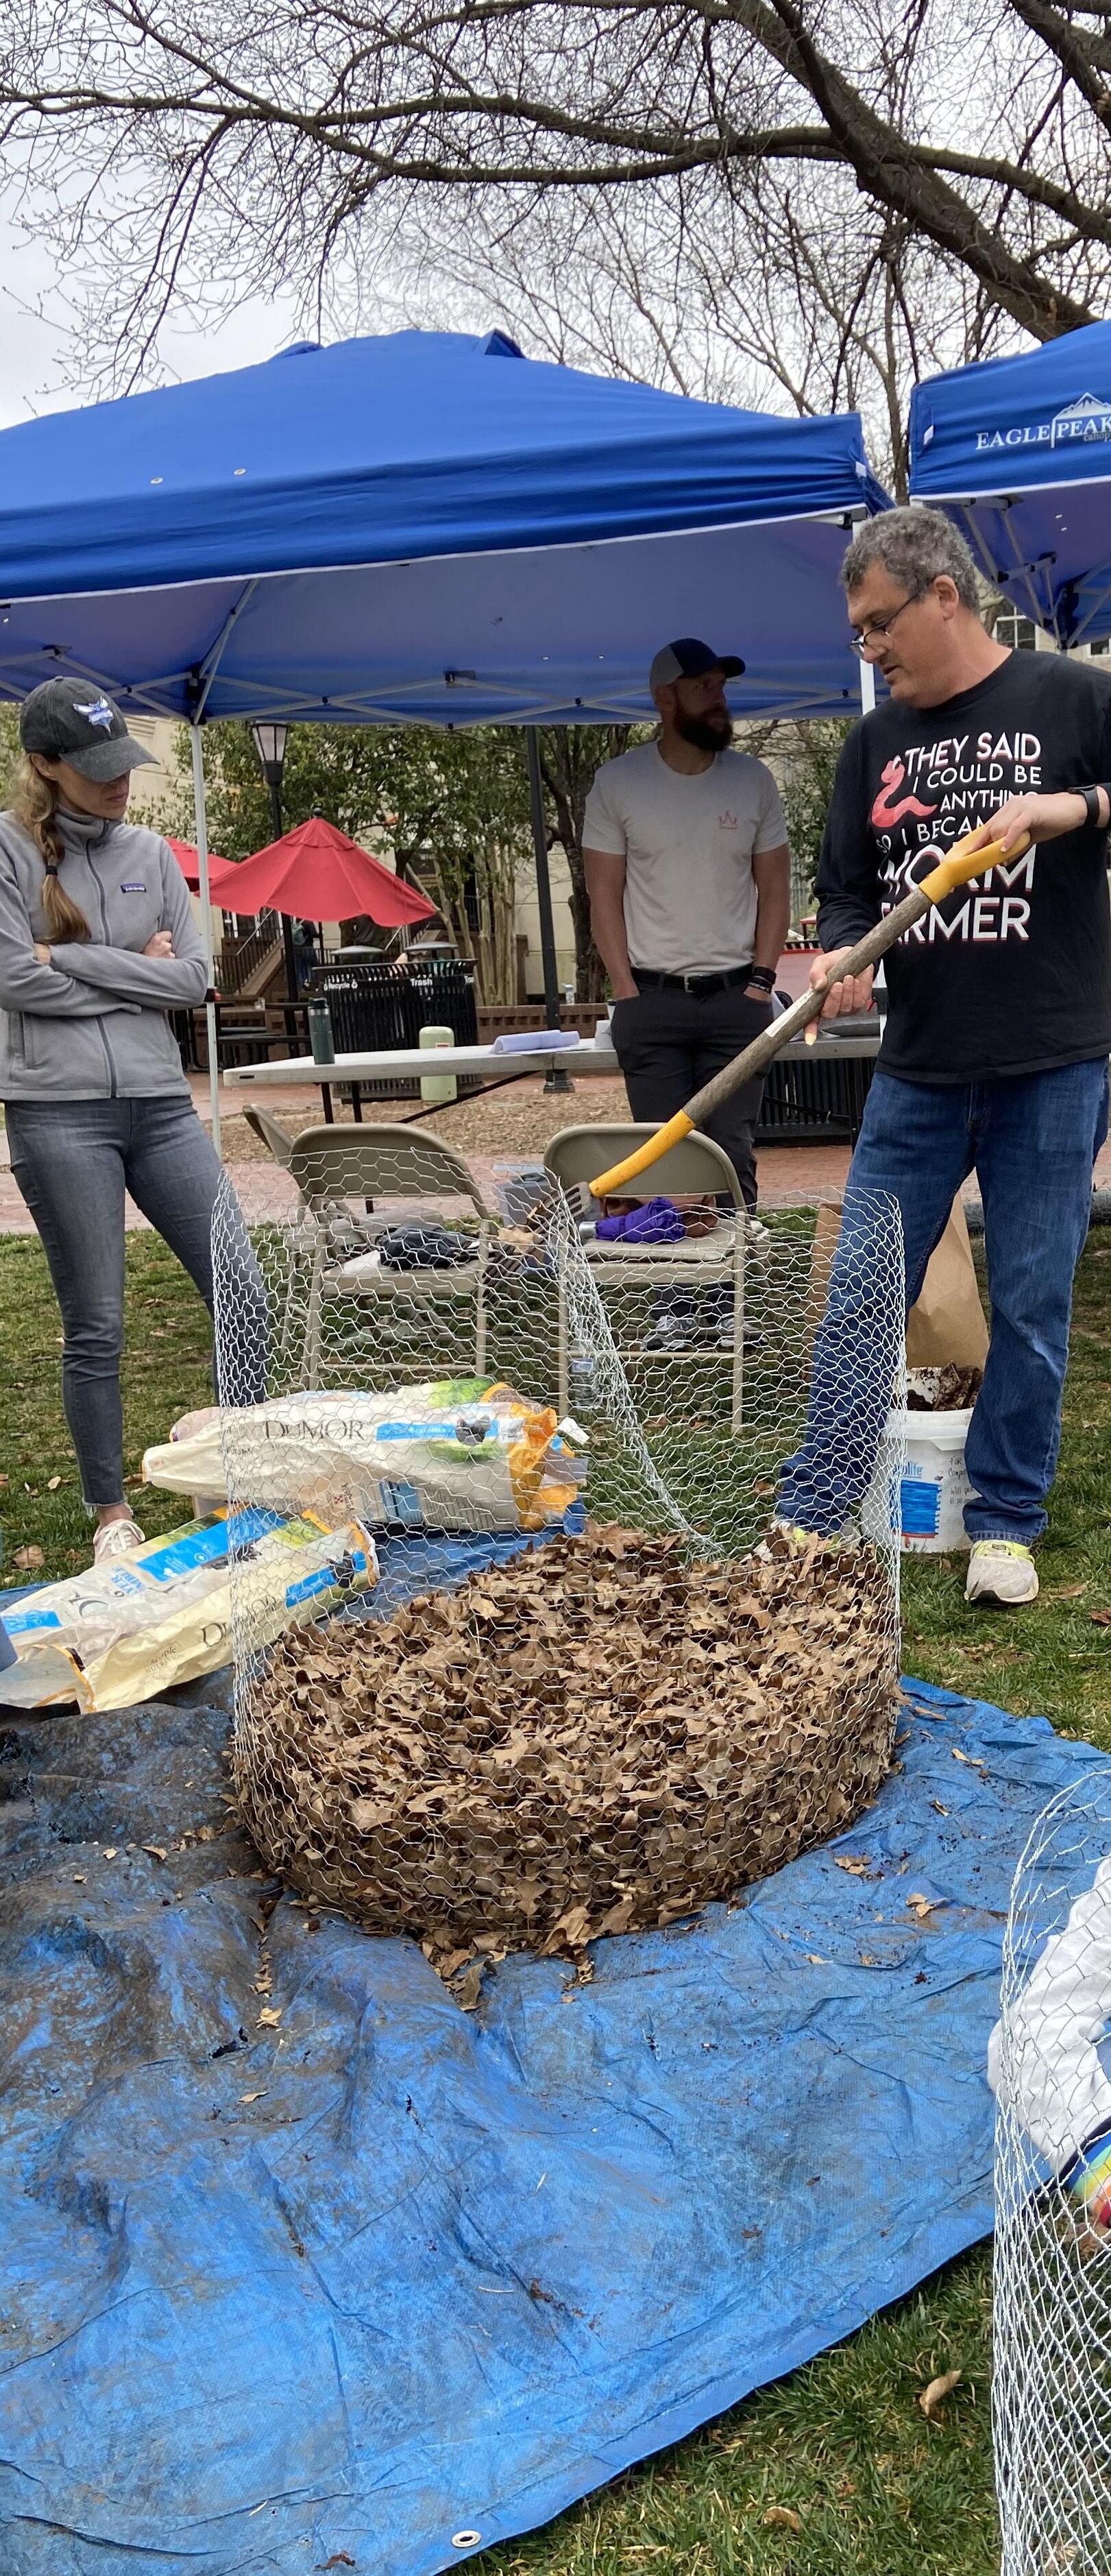
IMPLEMENTATION FRAMEWORK
Implementing the CAP’s strategies and actions will depend in part on the leadership of the Town government and the specifics of each action. Sustainability and adaptation are inherently wide ranging and not every action can be implemented at once. Actions geared toward municipal operations can be started immediately. Other actions like policies and regulations involve Town staff time “up front,” but in the long run instead rely on the activity of the private sector, residents, and businesses. Although actions may have different milestones to completion and benchmarks for success, they can all benefit from monitoring and reporting which allow implementation to be evaluated and tracked by Town departments, elected officials, and the public.
Table 5.1 summarizes the foundational strategies outlined in this plan. Each strategy is accompanied by a defined timeframe, performance metric, responsible Town department, and a cost estimate.
• Implementation Priority: This specifies when the action is expected to begin implementation. Categories include Near term, Mid term, and Long term. The actual timing of action completion may be influenced by funding availability.
• Performance Metric: This element outlines the specific criteria for measuring the success of each action. Performance metrics are tailored to the nature of each strategy, ensuring a precise and meaningful evaluation. For example, metrics may include quantitative targets such as the reduction in greenhouse gas emissions, percentage increase in renewable energy usage, or improvement in waste recycling rates. In other cases, a simple "ongoing" has been listed to signify activities that are continuous or iterative in nature, such as community engagement efforts, policy reviews, or long-term environmental monitoring.
• Lead Department(s): This section identifies the Town department(s) tasked with overseeing the implementation of the action. In certain cases, responsibilities may be shared across multiple departments.
• Cost: The cost estimates provided (categorized as low, medium, or high) are preliminary and are derived from initial assessments, comparisons with analogous programs, and expert consultations. They offer a basic financial overview.
STRATEGY PERFORMANCE
MUNICIPAL OPERATIONS
Strategy M1.1: Convert 100% of the Town fleet to EVs, hybrids or use clean fuels by 2037.
Strategy M1.2: Reduce emissions from Employee Commuting by 30% by 2037
Strategy M1.3: Reduce off-road emissions in Town Operations by 100% by 2037
Strategy M2.1: Reduce Municipal Building Energy Use by 75% by 2037.
Strategy M2.2: Obtain 80% of Municipal Energy from Renewable Energy Sources by 2037
Strategy M3.1: Decrease Energy Usage in Street Lighting by 50% by 2037
Strategy M4.1: Reduce Waste to Landfill by 75% by 2037 in Municipal Operations
# of Town fleet converted per year
# of employee participants
# qualifying vehicles/behaviors
# VMT reduced
# of tools and machines converted
# gallons of fuel reduced
kWh saved as tracked in future audits.
KW
Strategy M5.1: Adopt municipal policies and procedures by 2030 to encourage and accelerate strategy adoption
reduction in landfilled waste
# of sq ft or # buildings meeting standards
# EPPP products purchased; $ spent
# special events and meetings implemented
# of policies adopted; $ allocated
STRATEGY
TRANSPORTATION & MOBILITY
Strategy T1.1: Expand Electric Vehicle (EV) Community-wide Infrastructure
Strategy T1.2: Promote Community-wide Alternative Vehicle Awareness and Adoption
Strategy T1.3: Create a Walkable, Bikeable and Transit-Friendly Town
Strategy T1.4: Encourage Alternate Commuting Practices in the Community
BUILDINGS & ENERGY
Strategy E1.1: Promote and Facilitate Commercial & Residential Renewable Energy Adoption
Strategy E2.1: Encourage energy efficiency of residential homes
Strategy E2.2: Encourage energy efficiency in commercial buildings
Strategy E2.3: Ensure new developments meet high energy-efficiency standard
Strategy E2.4: Improve energy efficiency in lowincome households
of charging stations
of EV adoption EV and other clean fuel vehicle adoption
of VMT reduction
updated, buildings completed
TABLE 5.1: IMPLEMENTATION FRAMEWORK FOR FOUNDATIONAL STRATEGIES CONTINUED
STRATEGY PERFORMANCE
RESOURCE CONSERVATION
Strategy RC1.1: Reduce Consumption & Solid Waste
Waste audit completed, and % diverted on a year-by-year basis
Strategy RC1.2: Promote Reduction in Water Usage and Wastewater Management kWh saved, projected completed
Strategy RC1.2: Education and Community Engagement
Projects implemented and # of residents reached
MONITORING & REPORTING
The CAP is designed to be a dynamic document, adapting as community priorities shift, Town staff and partnering organizations evolve, new laws are enacted, and environmental conditions change. In response to these changes, the Town commits to engage in annual and regular tracking. The Town will also establish a schedule for reviews and updates of the plan. This will ensure that it continues to serve as a potent and effective guide towards achieving carbon neutrality and enhancing community resilience. Emphasis will be placed on prioritizing immediate actions that are critical for making short- and medium-term progress towards long-term goals, such as conducting a solar siting study, implementing a zero waste plan, and developing a fleet conversion policy, among others.
The Town's Sustainability Manager will have a crucial role in overseeing the comprehensive implementation of the CAP. This involves coordinating with various lead departments within the town and working with community partners, while also responding to new challenges and integrating fresh considerations. An essential component of the CAP, the greenhouse gas inventory, was crafted using the ICLEI ClearPath tool—a sophisticated, web-based tool for managing energy and emissions. ICLEI has been instrumental in advancing local environmental initiatives worldwide for over three decades. With its resources, including the ClearPath tool, ICLEI has supported over 600 municipal bodies in their efforts to scientifically assess greenhouse gas emissions, set ambitious targets, and implement effective sustainability strategies. The ClearPath tool features a Monitoring Module, which is key in enabling active monitoring and tracking of both government operations and community-scale implementation efforts as detailed in the Planning Module. More than just a tool for analyzing data, the module facilitates continual improvements in climate performance. The Town is committed to using ICLEI’s monitoring reports or similar tool to assess the effectiveness of the implementation measures, ensuring they meet the initial objectives set in the action plans.
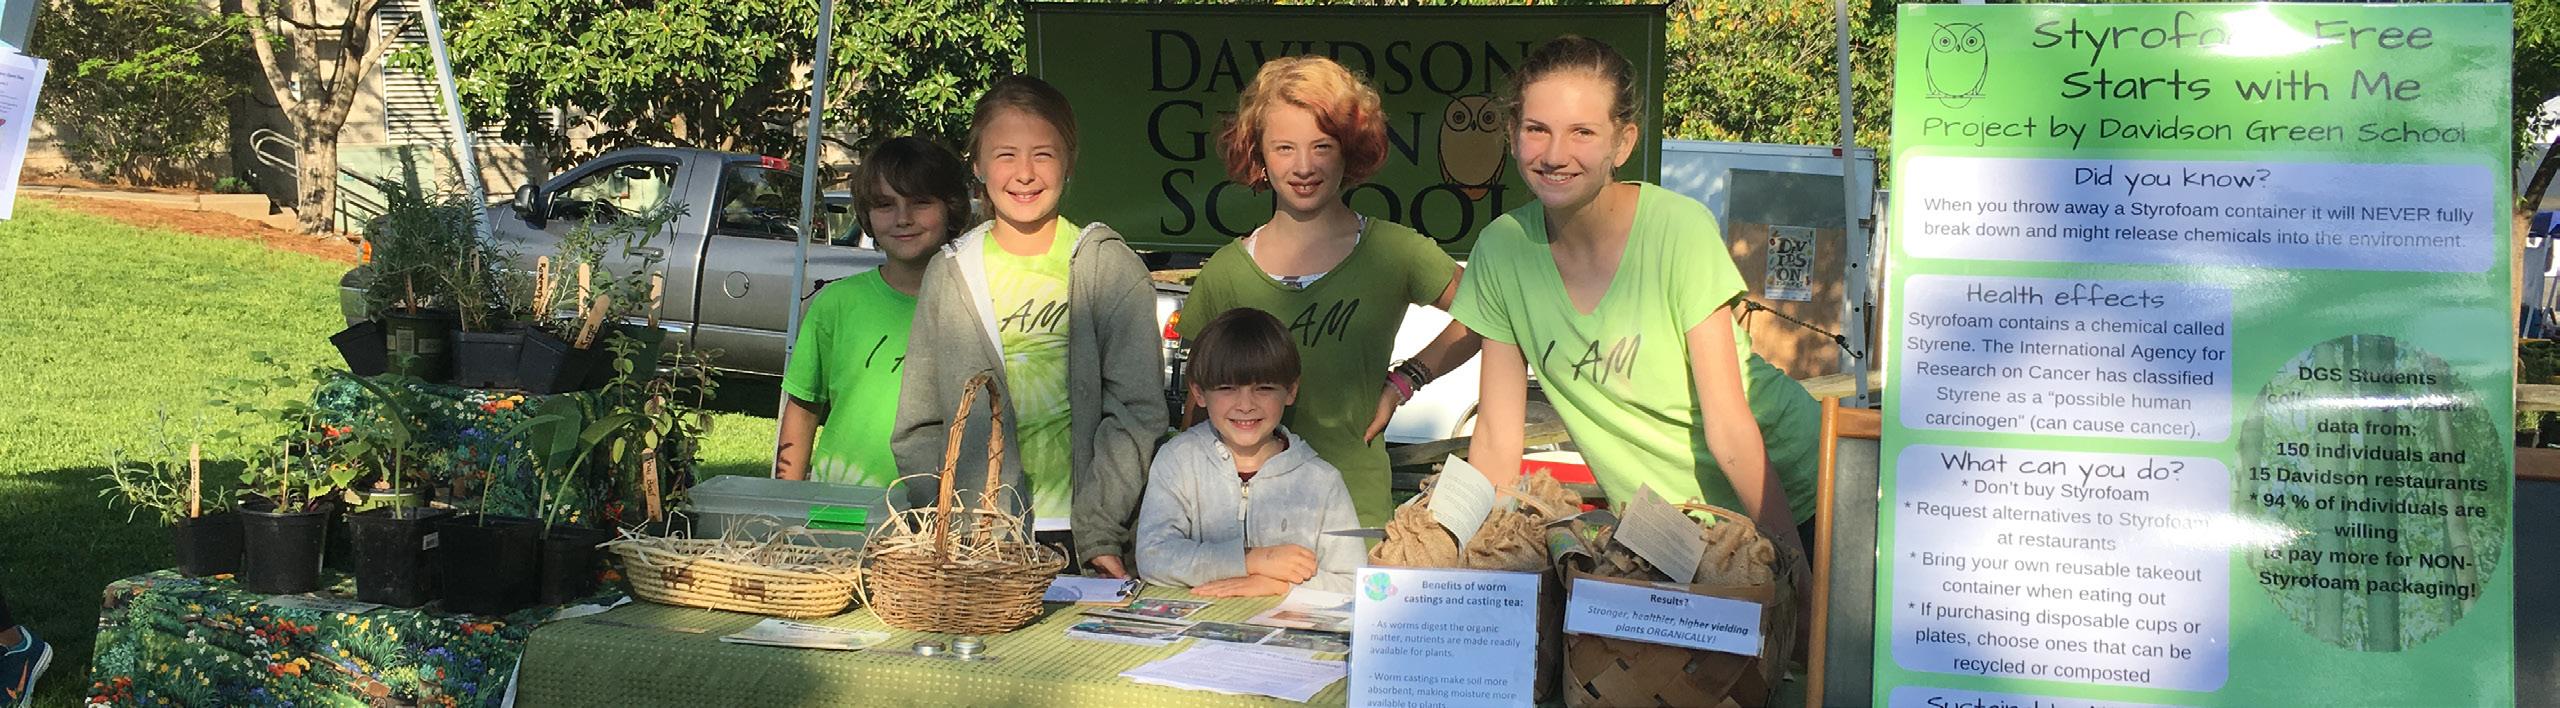
FINANCING OPPORTUNITIES
The table below offers a selection of funding opportunities and programs. It is not intended to be exhaustive, but rather highlights some potential avenues for the Town to finance the implementation of the CAP. Various federal, state, and regional bodies offer grants, loans, and planning support for climate-focused projects. Increasingly, such funding is available to support local jurisdictions in meeting climate objectives. These funds can assist with initial program development, testing, and staffing, setting up a sustainable financial model for post-grant operations. Additionally, utilities and organizations provide rebates, financing options, and discounts to support energy-efficient upgrades and other projects in residential and commercial spaces.

TYPE EXAMPLES/DESCRIPTION GOVERNMENT PROGRAMS
Department of Transportation (DOT) Surface Transportation Block Grant Program: Funding for public road, pedestrian, bicycle infrastructure, and transit capital projects.
DOT Transportation Alternatives Program: Funding for pedestrian/bicycle facilities, safe routes to schools, and other related projects / $20 million annually for NC.
DOT RAISE grants: Funding available for surface transportation projects like roads, rail, transit, and ports that align with national goals. For FY24, $1.5 billion is allocated to support projects with substantial local or regional effects.
Charging and Fueling Infrastructure (CFI) Grant Program: Funding for deployment of publicly accessible electric vehicle charging infrastructure and other alternative fueling infrastructure.
FEDERAL PROGRAMS
Safe Routes to Schools: Safe Routes to Schools is an international movement focused on increasing the number of children who walk or bike to school by funding projects that remove barriers to doing so. These barriers include a lack of infrastructure and non-infrastructure projects, safety, and limited programs that promote walking and bicycling. In North Carolina, two separate Safe Routes to School programs are available at both the state and federal level, and both programs fund qualifying infrastructure projects.
Federal Transit Authority (FTA) Grants for Buses and Bus Facilities Program: Capital funding to replace, rehabilitate, and purchase buses and bus-related equipment.
Diesel Emissions Reduction Act (DERA) Program: Grants and rebates to reduce harmful emissions from diesel engines ($115 million for FY 22-23).
U.S. Department of Energy (DOE): DOE provides grants and other financial incentives to local governments for renewable energy installations and alternative fuel vehicle and fueling infrastructure. Information regarding programs is available at grants.gov.
WaterSense: Voluntary partnership program sponsored by the U.S. Environmental Protection Agency, is both a label for water-efficient products and a resource for helping residents and businesses save water.
Energy Efficiency and Conservation Block Grant Program: Funding for local governments for energy efficiency and conservation projects.
Energy Improvements in Rural or Remote Areas (ERA): Funding for clean energy projects in rural or remote areas aiming to improve energy systems, reduce emissions, modernize infrastructure, develop microgrids, and enhance energy efficiency. Funding varies based on project specifics.
Energizing Rural Communities Prize (American-Made Challenges): A $15 million prize challenging individuals and organizations to create plans or financing strategies for rural communities to enhance their energy systems and further clean energy projects.
TABLE 5.2: FUNDING OPPORTUNITIES AND PROGRAMS CONTINUED
TYPE EXAMPLES/DESCRIPTION
GOVERNMENT PROGRAMS
Weatherization Assistance Program (WAP): Provides funding to increase the energy efficiency of homes. Typically, up to $6,500 per home.
Low Income Home Energy Assistance Program (LIHEAP): Federal program administered by the U.S. Department of Health and Human Services that provides assistance to eligible low-income households to manage and meet their immediate home heating and/or cooling needs. Provides assistance to low-income households to help pay for energy bills and weatherization improvements.
Inflation Reduction Act (IRA) various programs, include but are not limited to:
FEDERAL PROGRAMS
• Clean Heavy-Duty Vehicle Program
• The Empowering Rural America (New ERA) Clean
• Energy Investment Tax Credit (ITC)
• Clean Energy ITC Technology Neutral
• Clean Energy Production Tax Credit (PTC)
• Clean Energy Production Tax Credit (PTC) Technology Neutral
• Commercial Clean Vehicle Tax Credit
179D Tax Deduction for Energy Efficiency: Section 179D of the U.S. tax code offers a deduction to owners or designers of commercial buildings for implementing energy-efficient upgrades. Eligible entities can claim up to $1.88 per square foot for improvements in lighting, HVAC systems, and building insulation, including windows.
Property Assessed Clean Energy (PACE) Financing: Provides clean energy financing. Funding varies by program.
Solar Energy System Tax credits: Tax credits for solar water heaters and PV systems for residents or businesses. Receive 30% of the total solar system costs as a federal tax credit.
FEMA Pre-Disaster Mitigation Program: Offers grants for long-term hazard and climate event risk reduction projects, aimed at decreasing future federal disaster recovery reliance. Eligible projects include generator installation at vital facilities and various mitigation construction efforts.
TYPE EXAMPLES/DESCRIPTION
North Carolina's Utility Savings Initiative (USI): Promotes energy savings in the state.
Energy Star Plus State Rebate Program: Provides rebates to residential customers for installing certain energy efficient appliances and equipment that are Energy Star certified. Rebates typically range from $50 - $500 per appliance.
Energy Improvement Loan Program (EILP): Low-interest loans to fund energy efficiency, renewable energy, and water conservation projects for commercial, industrial, nonprofit, schools, and local government customers.
North Carolina Energy Efficiency Rebates: Offers rebates for homes/businesses implementing energy-efficient solutions; amounts vary by project.
North Carolina Department of Environmental Quality (DEQ): Volkswagen Settlement Mitigation Program. Funds for zero emission vehicle infrastructure and transportation, $92 million through 2027.
STATE
North Carolina Energy Office Appliance Rebate Program: Rebates for purchasing energy efficient appliances. Varies based on products.
North Carolina GreenPower Production Incentive: Payments for renewable energy produced; varies based on system size and energy generated.
North Carolina Green Business Fund: Offers grants and loans to small businesses and farms for implementing renewable energy, energy efficiency, and other sustainable practices.
Clean Water State Revolving Fund: Provides low-interest loans to commercial, industrial, nonprofits, schools, and local governments for funding a wide range of water infrastructure projects.
TYPE EXAMPLES/DESCRIPTION
INTERNAL MECHANISMS
Utility User Tax: A tax levied on the consumption of utility services, such as electricity, gas, water, and telecommunications. This tax can be structured to incentivize energy efficiency and the use of renewable energy sources by residents and businesses.
Carbon Development Impact Fee: A fee imposed on new developments based on their projected carbon emissions.
Congestion Pricing: A dynamic user fee designed to reduce traffic congestion during peak hours, improving air quality and encouraging the use of public transportation.
Parking Fee: A user fee for access to town-owned parking facilities. This fee can be varied according to demand to manage parking availability and reduce congestion, with proceeds supporting public transit and other sustainable transportation solutions.
Green Bond: Financial instruments issued by the Town to fund capital projects with environmental benefits, such as renewable energy installations, energy efficiency upgrades, and green infrastructure.
General Funds: Resources allocated within the Town's budget for various nonspecific purposes, which can be directed towards environmental projects and sustainability initiatives as decided by Town governance.
Capital funds: Funds designated for the acquisition or maintenance of fixed assets such as land, buildings, and equipment, which could include investments in sustainable infrastructure and green technology.
Green Revolving Fund: A sustainable finance mechanism that reinvests savings generated from energy efficiency projects back into more green initiatives. This fund creates a positive feedback loop, where the initial investment in sustainability leads to cost savings, which are then used to fund additional environmental projects, further enhancing the town's commitment to sustainability and carbon neutrality.
TABLE 5.2: FUNDING OPPORTUNITIES AND PROGRAMS CONTINUED
TYPE EXAMPLES/DESCRIPTION
THIRD PARTY MECHANISMS
ENERGY PERFORMANCE CONTRACTS (EPC)
Energy Efficiency Agreement: Contracts for energy upgrades in exchange for cash flows from a portion of savings.
PUBLIC-PRIVATE PARTNERSHIPS (PPP)
INFRASTRUCTURE AS A SERVICE (IAAS)
Private investors may provide funding to local governments. For example, energy service companies can finance the upfront investments in energy efficiency, reimbursed by the local government over a contract period. Private companies may finance solar power installations, and then recoup their investment by selling the resulting power to the building owner.
Independent Energy Purchase/Solar Services Model: Local governments can install solar PV systems with no initial cost through a power purchase agreement with a developer, who covers the system's design, construction, and installation using third-party financing. The investor funding the project profits from fixed-price payments made by the hosting government, similar to a utility bill. This arrangement offers the local government reduced energy costs, lower greenhouse gas emissions, and fixed-income benefits without upfront expenses.
Home Energy Improvement Program: Offers rebates for qualified energy efficiency improvements; up to $600 per home for various improvements.
DUKE ENERGY
ENERGY UNITED
Smart $aver Incentive Program: On-bill financing program for certain energy efficiency improvements for homeowners and businesses.
High Energy Usage Assistance: Free energy improvements and upgrades for households that use at least 17,800 kWh of electricity per year, are income qualified (200% below poverty level), and reside in Mecklenburg County.
Heat Pumps and LED Lighting Rebates Programs: Offer bill credits and per-unit rebates for adopting energy-saving solutions, with detailed guidelines and potential for federal tax credits.
WHAT THE COMMUNITY CAN DO TO HELP
Individuals have the power to impact climate change through their daily choices. These small actions create a ripple effect, influencing communities and sparking conversations that can lead to widespread behavioral change. Residents, workers, and business owners in Davidson all have a role to play in helping the Town attain its greenhouse gas reduction and climate goals. Below is a list of actions that community members can take to help reduce greenhouse gas emissions in their own homes, businesses, and everyday actions, helping the Town to achieve its greenhouse gas reduction targets. Davidson invites you to be a part of this journey, as we collectively steer towards a more sustainable future.
ENERGY
PLEDGE TO:
Obtain an energy audit for your home or business
Install weatherization and insulation to reduce energy loss
Upgrade appliances, HVAC, and other equipment to EnergyStar or low-energy models
Request a solar assessment for your home or business; install renewable power
Install occupancy sensors, auto settings, and reminders for light and temperature controls
Turn off the lights when you leave a room, home, or office without occupancy sensors
Take the stairs for exercise and energy savings
Unplug or use a power strip (leaving items plugged in still uses power)
Take advantage of your energy provider’s incentives for reducing your energy consumption

WHAT THE COMMUNITY CAN DO TO HELP
TRANSPORTATION
PLEDGE TO:
Ride your bike, walk, or carpool to destinations
Take public transportation as often as possible
Telecommute when possible
Consider carshare, bikeshare, and scootershare programs rather than your own vehicle
Reduce airline miles traveled, utilize trains or other public transportation where feasible
Convert to electric vehicle, hybrid, or clean fuel vehicles when vehicle travel is necessary
WASTE
PLEDGE TO:
Reduce, Refuse, Reuse, Recycle, Rot, Repair, Rebuy
Refuse single use plastics (bags, cutlery, straws, cups, bottles, to-go boxes, etc.)
Bring your own reusable bags to the grocery store and reusable mugs to coffee shops
Bring your own reusable to-go containers, cutlery, straws, napkins, mugs, and bottles to work, events, play, and for restaurant leftovers
Reduce food waste through careful purchasing, food preservation, donation, and composting
Start a compost or worm bin
Purchase and donate second-hand clothing, equipment, and materials whenever possible
Repair broken items before buying new
Buy products with high recycled content and easily recyclable packaging
WATER
PLEDGE TO:
Bring a reusable water bottle to work each day
Reduce meat consumption (biggest water user)
Install rainwater catchment barrel at home or work
Reduce water use at home and work
Plant native plants that require less water than non-natives
Adopt low-impact design practices to decrease irrigation water use
Replace high volume toilet with low-flow or dual flush models
Take advantage of your water provider’s low-flow incentives and rebates
FOOD
PLEDGE TO:
Store or preserve leftover food in fridges, freezers, vacuum packaging, canning, pickling and other means
Eat a more plant-based diet
Donate excess unopened or unserved edible food to local food rescue organizations
Compost food scraps in a backyard composter or worm bin
Attend a backyard gardening, composting, canning, food preservation, or similar workshop
Support your local farmers market or grow your own fruit and veggies
Purchase USDA certified organic label and local food
Subscribe to the free Davidson Composts dropoff service
WHAT THE COMMUNITY CAN DO TO HELP
GREEN SPACES
PLEDGE TO:
Be a good steward to the earth by planting a native tree
Convert some or all of your lawn space to native plants
Plant edible food, herbs, and pollinator-friendly gardens
Use rechargeable electric garden tools including mowers, edgers, leaf blowers, etc.
PURCHASING
PLEDGE TO:
Prioritize local and minority owned businesses and support those with a climate mission
Purchase products with reduced packaging
Buy reused materials whenever possible
Buy products made with post consumer recycled content
Buy locally grown, locally produced goods
Support farmers markets, local businesses, and businesses that have sustainable operations
ENGAGE
PLEDGE TO:
Talk and share ideas with others about climate change
Stay informed and involved with what the Davidson and other communities are doing to tackle climate change
Participate in community engagement efforts around climate change


APPENDIX A: GREENHOUSE GAS INVENTORY
EXECUTIVE SUMMARY
Introduction
The goal of this report is to provide an inventory of greenhouse gas emissions (GHG) in the Town of Davidson, North Carolina. This report acts as a foundational document for the 2024 Climate Action Plan, which provides a roadmap for reducing carbon emissions while preserving the living standards of Town residents. A GHG inventory describes the primary sources of emissions within the Town, including those originating from residents, commercial enterprises, and governmental operations. The emissions studied can be either direct or indirect. Direct emissions are those emitted at the location of use such as natural gas combustion in heating buildings, whereas indirect emissions are purchased and used at one location but generated elsewhere, such as those originating from the electrical grid14. A GHG inventory is crucial for creating strategies and programs that reduce future emissions and providing insight into the environmental condition of the Town during the study year. The inventory was reviewed by the International Council for Local Environmental Initiatives (ICLEI) for completeness and accuracy to ensure its reliability as a foundation for informed decision-making and action.
This GHG inventory analyzes emissions across two different tracks. First, the community track covers emissions from residents of the Town of Davidson not directly related to local government operations. This includes emissions from individuals, businesses, nonprofit institutions, and industrial emissions sources. Community emissions were divided into the following categories: residential and non-residential energy, transportation and mobile services, solid waste, and water and wastewater. The second, the government track, focuses on emissions related to the Town of Davidson government activities. This includes government buildings, streetlights, vehicle fleets, and employee commuting. To ensure the most accurate representation of the community and town operations emissions, this report relies on the best available data. When specific usage data could not be collected, best estimates were employed. Emission factors for each sector were compiled from reliable sources, such as the Environmental Protection Agency (EPA) and the U.S. Community Protocol, which regularly updates its data. This GHG inventory offers a reliable reflection of realworld emissions in the Town of Davidson. All calculations were made using the US Community Protocols for Greenhouse Gas Accounting studies, as published by ICLEI15 Two appendices are included in this report. Appendix A lists raw usage data collected from utilities and other sources, while Appendix A.2 provides a detailed methodology of all calculations used in determining emission totals.
14 The US EPA has more information for direct and indirect emissions.
15 US Community Protocol is the model for all US GHG inventories for municipalities and government operations.
APPENDIX A: GREENHOUSE GAS INVENTORY
Community Inventory Results
In 2019, the Town of Davidson community produced a total of 99,170 metric tons of carbon dioxide equivalent emissions (MT CO2e). As illustrated in the fi gure below, the greatest percentage of emissions was from the combustion of fuel from transportation and mobile services at 40%, or 39,691 MT CO2e. Energy sources are categorized into residential and non-residential to assist in determining reduction strategies. These are the subsequent largest emission sources at 38%, and 16% respectively. Residential energy resulted in 37,607 MT CO2, and nonresidential energy contributed 16,226 MT CO2e (which includes on-site burning of natural gas and emissions linked to electricity procurement). The remainder of the community inventory includes solid waste, water and wastewater, and process and fugitive emissions.
TOWN OF DAVIDSON COMMUNITY INVENTORY
FIGURE A.1: COMMUNITY GREENHOUSE GAS EMISSION (2019)
APPENDIX A: GREENHOUSE GAS INVENTORY
Municipal Inventory Results
Municipal GHG emissions were also analyzed. Town of Davidson government operations were responsible for 1,033 MT CO2e. The largest emission sources were Employee Commute at 29% (297 MT CO2e) and Streetlight at 24% (250 MT CO2e). The vehicle fleet sector was next at 23%, with 236 MT CO2e, followed by buildings and facilities at 20% with 208 MT CO2e.
TOWN OF DAVIDSON MUNICIPAL INVENTORY
FIGURE A.2: MUNICIPAL OPERATIONS GREENHOUSE GAS EMISSIONS (2019)
APPENDIX A: GREENHOUSE GAS INVENTORY
INTRODUCTORY SUMMARY
This inventory was performed using the U.S. Community Protocol Version 1.2 developed by ICLEI for this specific GHG accounting exercise in July 2019. Inventory emissions were calculated using best practices and were based on 2019 data gathered from the Town. These “usage” data were assessed to determine an appropriate emission factor to arrive at a figure for emissions emitted. The calculations took place within the ICLEI ClearPath tool. ClearPath assists in GHG accounting and management at the community and municipal levels. Emission factors were compiled from 2019 data and information from the federal Environmental Protection Agency GHG Emission Factors Hub16 and modeled in the ICLEI ClearPath tool.
As a result, this report compiles data from the Town and models GHG to provide an accurate depiction of the Town’s real-world emissions. It also identifies key areas to focus on for strategy development and program creation to reduce emissions in the Town.
Community and Municipal Operations Inventories
The inventory considers two distinct greenhouse gas accounting tracks: community and municipal sectors. The community inventory includes emissions from residents within the Town of Davidson's jurisdiction. Required sectors for community GHG inventories are 1) community building energy use from kilowatt hours and natural gas therms usage, 2) transportation emissions from vehicle miles traveled in the Town, 3) solid waste disposed, 4) wastewater and water electricity used and gallons consumed. In contrast, the municipal inventory encompasses emissions resulting from Town of Davidson government operations and facilities.
Although municipal emissions represent a small fraction of the emissions inventory, they are significant, given the government’s ability to influence and lead by example to combat climate change. The municipal inventory includes emissions from municipal buildings, municipal vehicle fleet, employee commutes, streetlights and traffic signals, solid waste, and fugitive emissions.
16 https://www.epa.gov/climateleadership/ghg-emission-factors-hub
APPENDIX A: GREENHOUSE GAS INVENTORY
CALCULATING EMISSIONS
Greenhouse Gasses
Local governments are expected to evaluate emissions of the six internationally recognized greenhouse gasses (GHG) under the Kyoto Protocol17, namely Carbon dioxide (CO2), Methane (CH4), Nitrous oxide (N2O), Hydrofluorocarbons (HFCs), Perfluorocarbons (PFCs), and Sulfur hexafluoride (SF6). Each of these greenhouse gasses is reported and converted into metric tons (MT), differentiated by their respective Global Warming Potential (GWP). The GWP is benchmarked on Carbon dioxide's potential, which is set at 1, as it serves as the reference point for the other gasses. Methane, with a GWP of 28, is largely emitted from landfills, wastewater, and natural gas leakage. Nitrous Oxide, with a higher GWP of 265, is primarily associated with energy production and wastewater treatment. Hydrofluorocarbons, having a wide GWP range of 12-11,700, are mainly tied to refrigerant usage. Perfluorocarbons, with a GWP between 6,500-9,200, typically result from manufacturing and production processes. Sulfur Hexafluoride, possessing the highest GWP of 23,900, is principally connected with power transmission and distribution. This inventory primarily uses Carbon, Methane, and Nitrous Oxide to establish the carbon dioxide emission equivalents (CO2e) for all sectors analyzed.18
Sector Activity Data & Emissions Factors
The process of calculating Carbon dioxide equivalents (CO2e) utilizes both activity data and emission factors. When activity data is multiplied by corresponding emission factors, the result is an amount of carbon dioxide equivalent emissions. By converting each sector's activity data into carbon dioxide equivalents, a comparative ratio for each sector can be established. Enabling further analysis and facilitating decisionmaking about potential reduction strategies.
Emissions Reporting
Emissions are quantified using the measure of Carbon dioxide equivalent (CO2e) and compared across sectors. Each sector is individually reported and assessed in relation to others, offering a comprehensive picture of emissions across the Town. The community inventory covers building energy use, transportation, solid waste, wastewater, and water. Building energy is further divided into residential and non-residential use and consists of electricity, natural gas, and other sources. The municipal inventory includes building energy use, employee commute, streetlights and traffic signals, vehicle fleet, solid waste, and fugitive emissions.
17 https://unfccc.int/resource/docs/convkp/kpeng.pdf
18 https://icleiusa.org/ghg-protocols/
APPENDIX A: GREENHOUSE GAS INVENTORY
Methodology
The methodology for this inventory was based upon best practices from the US Community Protocol provided by the ICLEI ClearPath tool, coupled with the United States Environmental Protection Agency GHG Emission Factors, which serve as the benchmark for greenhouse gas inventory analysis nationwide. Emissions estimated incorporate real-world usage data (listed in Appendix A), which were subsequently processed through ICLEI ClearPath functions.19
Inventory Year
The year 2019 was selected for this inventory because it offers a more typical representation of GHG emissions since the COVID-19 pandemic significantly reduced travel emissions and markedly impacted emissions from other sectors as well. Notably, the years 2020, 2021, and 2022 recorded significantly lower emissions compared to current levels. Additionally, the Science Based Targets Initiative recommends using 2019 as a baseline year for future emission reduction targets.20
Results
The following sections detail the findings from the community and municipal operations greenhouse gas inventories, with results organized by sectors. Calculation methodologies for all results are provided in Appendix A.2.
COMMUNITY INVENTORY
In the Town of Davidson, total community carbon emissions were 99,170 MT CO2e. This result included emissions originating from the combustion of fuel for transportation and mobile services, onsite burning of natural gas and electricity procurement in residential, commercial, and industrial structures, emissions connected to water and wastewater processes that services the Town, as well as solid waste emissions emanating from the Town.
19 https://icleiusa.org/clearpath/
20 https://sciencebasedtargetsnetwork.org/wp-content/uploads/2020/11/SBTs-for-cities-guide-nov-2020.pdf
TABLE A.1: TOWN OF DAVIDSON COMMUNITY INVENTORY BY SECTOR
APPENDIX A: GREENHOUSE GAS INVENTORY
Residential Energy
Residential energy consumption was the second largest source of energy emissions and incorporated emissions from natural gas combustion and electricity production all specific to residential communities within Town of Davidson. Data regarding Town of Davidson's residential electricity usage were supplied by Energy United and Duke Energy, while the NREL SLOPE Platform provided the data for natural gas usage.
Overall residential energy use contributed 37,607MT CO2e of emissions attributed to electricity and natural gas. Therefore, residential energy constituted 38% of the total emissions as per the community inventory.
Non-Residential Energy
Non-residential energy was the third individual largest source of energy emissions in Town, producing 16,226 MT CO2e. Data on commercial electricity energy consumption were provided by Energy United and from Duke Energy. Data for natural gas usage were sourced from the National Renewable Energy Laboratory State and Local Planning for Energy Platform (NREL SLOPE data).
Of the non-residential total, electricity accounted for 16,226 MMBtu and natural gas contributed 63000 MMBtu. Thus, commercial energy constituted 16 % of the total community emissions in the Town of Davidson.
Transportation & Mobile Service
Transportation and Mobile services were the primary individual contributor of emissions in the Town of Davidson, which produced 39,691 MT CO2e, and accounted for 40% of the Town’s total emissions. Town of Davidson includes some rural areas in the community and commuter traffic (to and from Town), where reliance on cars is leading to a considerable amount of Vehicle Miles Traveled (VMT) within the Town. North Carolina Department of Transportation (NCDOT) vehicle miles traveled (VMT) data was available for 2018.
Solid Waste
Emissions resulting from the waste sector were derived from estimated methane production due to decomposition of solid waste generated in the Town. These calculations incorporate data gathered from Waste Pro for the collection of residential solid waste, and from Benfield Sanitary Services for multifamily, Davidson College, and business waste. Solid waste disposal contributed to 3% of the total emissions in the Town of Davidson, accounting for 3,509 MT CO2e.
APPENDIX A: GREENHOUSE GAS INVENTORY
Water & Wastewater
Charlotte Water manages the Town’s potable water supply and wastewater disposal and supplied all related data. Total emissions from water and wastewater amounted to 777 MT CO2e, accounting for 1% of total emissions across the Town. Electricity consumption due to Water and Wastewater treatment operations was captured in the Non-residential Energy sector. These emissions are mainly due to the electricity consumption in water and wastewater treatment processes. Digester gas generated at 4 of 5 the Charlotte Water wastewater treatment plants, where approximately 59% was beneficially used for process heating and any excess, and approximately 41% was flared.
Processes & Fugitive Emissions
Fugitive emissions, which are defined as unintended leaks or releases of gasses during the transportation or handling of substances like natural gas, contributed less than one percent to the total emissions of the Town, amounting to an equivalent of 2 MT CO2e. These inadvertent emissions occurred at various stages of production, processing, storage, transmission, and distribution.
MUNICIPAL INVENTORY
The following sections provide detailed insights into the municipal GHG emissions within the Town of Davidson. The local government's emitting sectors include vehicle fleet, buildings and facilities, streetlights and traffic signals, employee commuting, solid waste facilities, and fugitive emissions. In 2019, the Town's municipal activities generated a total of 1,033 MT CO2e, producing roughly 1% of the Town's total emissions.
TABLE A.2: TOWN OF DAVIDSON MUNICIPAL INVENTORY BY SECTOR
APPENDIX A: GREENHOUSE GAS INVENTORY
Building & Facilities
Town of Davidson's government-owned and operated buildings and facilities contribute 20% of the total emissions in the Municipal Inventory and a total of 208 MT CO2e. The generation and consumption of electricity, along with the combustion of natural gas, were the primary sources of these emissions. Electricity usage for the government consumed 115240 MMBtu, where the natural gas combustion consumed is 1681.9 MMBtu.
Streetlights & Traffic Signals
Emissions associated with streetlights and traffic signals energy use contribute to municipal emissions. Energy use data collected accounted for 24% of the total municipal emissions, producing 250 MT CO2e.
Vehicle & Transit Fleet
The Town's vehicle fleet represents 23% of total emissions, producing 236 MT CO2e. Consumption of fossil fuel in the 60 fleet vehicles was the primary source of these emissions. Landscape equipment was not considered in this calculation. One electric bicycle with zero direct emissions, is also owned and operated by the Town.
Employee Commute
Employee commute emissions were calculated from average commuting mileage for employees in the Town of Davidson. This data was taken from a 2019 commuting survey distributed to Town employees. After analysis of data collected, employee commuting was estimated to be approximately 29% of total emissions generated by the municipal operations, producing 297 MT CO2e.
Solid Waste
Emissions associated with solid waste contribute to municipal emissions. A survey of employees and custodial staff was conducted to determine the volume of solid waste collected at each government building. Solid waste sent to landfill accounted for 4% of the total municipal emissions in the Town of Davidson. For government operations the total emission for solid waste is 40 MT CO2e.
Processes and Fugitive Emissions
Fugitive emissions, which are generally released during the transportation of natural gas, account for less than 1% of the total emissions in the municipal inventory of Town of Davidson. These emissions are approximately .29% and 2 MT CO2e.
APPENDIX A: GREENHOUSE GAS INVENTORY
CONCLUSION
In 2019, the Town of Davidson, North Carolina, generated a total of 99,170 MT C02e. The most significant contributors to this total were transportation sources, accounting for 40% of the total. Residential energy came in second, constituting 38% of the emissions. Non-residential energy at 16% was the next substantial contributor, with all other sources relatively minor in comparison.
As for the emissions attributable to Town of Davidson's Municipal Operations, four primary areas were prominent: Streetlights, Vehicle Fleet, Buildings, and Employee Commute, responsible for 24%, 23%, 20% and 29% of the total emissions, respectively. Moving forward, the Town of Davidson is committed to taking a leadership role in North Carolina's efforts to reduce greenhouse gas emissions.
APPENDIX A.1: ATTACHED USE DATA
COMMUNITY INVENTORY
using ICLEI ClearPath’s industry standard percentage.
APPENDIX A.1: ATTACHED USE DATA
A.1.2: MUNICIPAL INVENTORY DATA SOURCES
COMMUNITY INVENTORY
Electricity
Residential and non-residential sector electricity usage data for 2019 were furnished by Duke Energy and Energy United. The process of determining emissions involved multiplying electricity usage by the emissions factor relevant to the jurisdiction where the electricity was generated. ICLEI: Local Governments for Sustainability 21 provided emission factors for local jurisdictions, which is based on data from the EPA Emissions Hub for SERC Virginia/Carolina (SRVC) eGRID 2019. The speci fi c emission factors are as follows: the CO2 emission factor is 0.089765 MT/MMBtu, the CH4 emission factor is 7.7084 x 10⁻⁶ MT/MMBtu, and the N2O emission factor is 1.0632 x 10⁻⁶ MT/MMBtu.
Natural Gas
Data on residential and non-residential natural gas was provided by the National Renewable Energy Laboratory State and Local Planning for Energy Platform (NREL SLOPE), a source recommended by ICLEI. The SLOPE Platform is a collaboration between nine U.S. Department of Energy (DOE) offices and NREL designed to support state and local governments and other key energy planning stakeholders in building a clean energy economy. Emission data is provided by the US Community Protocol BE.1.1.22 The respective emission factors are 53.02 kg/MMBtu CO2, 0.005 kg/MMBtu for CH4, and 1 xE-4 for N2O. The full methodology is detailed in the U.S. Community Protocol for Accounting and Reporting of Greenhouse Gas Emissions Appendix C: Built Environment Emission Activities and Sources.
21 U.S. Community Protocol for Accounting and Reporting of Greenhouse Gas Emissions Appendix C: Built Environment Emission Activities and Source (NOT significant enough to count) LPG and Distillate Fuel Oil NO.2
22 U.S. Community Protocol for Accounting and Reporting of Greenhouse Gas Emissions Appendix C: Built Environment Emission Activities and Sources.
Transportation & Mobile Services
Transportation emissions in the Town of Davidson were computed using North Carolina Department of transportation (NCDOT) vehicle miles traveled (VMT) data that was available for 2018. The emissions factors are sourced from the US Community Protocol23 as follows:
TABLE A.2.1: TRANSPORTATION & MOBILE SERVICES EMISSIONS FACTORS
23 U.S. Community Protocol for Accounting and Reporting of Greenhouse Gas Emissions Appendix D: Transportation and Other Mobile Emission Activities and Sources.
APPENDIX A.2: DETAILED METHODOLOGY
Solid Waste
Solid waste estimates for the Town of Davidson are derived from Waste Pro from the Annual Residential Tonnage Report and Benfield Sanitation Service data for multifamily and also for businesses located in the downtown corridor. Both of these data sources are submitted to the State of North Carolina annually. Tracking the amount of solid waste for some commercial and nonprofit sectors in the Town of Davidson proved challenging. The following are the specific emission factors: Mixed MSW Emission Factor (MT CH4/wet short ton) 0.0648, Newspaper Emission Factor (MT CH4/wet short ton) 0.042, Office Paper Emission Factor (MT CH4/wet short ton) 0.1556, Corrugated Cardboard Emission Factor (MT CH4/wet short ton) 0.1048, Magazines/Third Class Mail Emission Factor (MT CH4/wet short ton) 0.0476, Food Scraps Emission Factor (MT CH4/wet short ton) 0.0648, Grass Emission Factor (MT CH4/wet short ton) 0.0228, Leaves Emission Factor (MT CH4/wet short ton) 0.026, Branches Emission Factor (MT CH4/wet short ton) 0.058. The calculation methodology was adopted from the US Community Protocol.24
Water and Wastewater
Both potable water and wastewater systems consume electricity, and the emissions from this are calculated as previously outlined. Additionally, wastewater treatment processes utilize natural gas, the emissions from which are calculated using the aforementioned methods. The process of digester gas combustion is estimated using site-specific data obtained from Charlotte Water. This information is converted into emissions data by applying emission factors from the US Community Protocols. Specifically, the Biogenic CO2 Emissions Factor is 52.07 kg/MMBtu, the CH4 Emissions Factor is 0.0032 kg/MMBtu, and the N2O Emissions Factor is 6.3 x 10⁻⁴ kg/MMBtu. Further details on digester combustion calculations can be found in US Community Protocols WW.1.A, WW2.A, and WW.3. Emissions resulting from the flaring of digester gas are also considered in this inventory. This is determined using site-specific data sourced from Charlotte Water and adhering to the best calculation practices provided by the US Community Protocol. The CH4 Emissions Factor in this case is 1.2177 x10⁻⁷ MT CH4/scf. Daily nitrogen discharge is another factor incorporated in this inventory. Using the daily nitrogen load provided by Charlotte Water, emissions data is calculated in line with the US Community Protocol. Here, the N2O Emissions Factor stands at 0.005 kg N2O/kg N in effluent. Additional details concerning effluent discharge can be referenced in the US Community Protocol, specifically WW.12. The final aspect of the water and wastewater analysis pertains to emissions from septic systems.
24 U.S. Community Protocol for Accounting and Reporting of Greenhouse Gas Emissions Appendix E: Solid Waste Emission Activities and Sources.
APPENDIX A.2: DETAILED METHODOLOGY
MUNICIPAL INVENTORY
A summary of data elements measured and collection sources by sector is presented in the following table.
TABLE A.2.2: MUNICIPAL INVENTORY DATA ELEMENT AND COLLECTION SOURCES BY SECTOR
SECTOR
Buildings & Facilities
Employee Commute
WHAT IS MEASURED?
Total amount of electricity (kWh) used for all Government Buildings
Amount of CO2 released in a year from employee commute
HOW DATA IS COLLECTED
Vehicle Fleet
Streetlights & Traffic Signals
VMT, total gas used, or amount spent on gas
2019 Utility bills from Duke Energy and Energy United
Solid Waste Facilities
Process & Fugitive Emissions
Total electricity (kWh) used by all streetlights and traffic lights
Amount of CO2 and methane released by landfill waste
Employee Commute Survey and Vehicle Miles Traveled (VMT) for employee commute distance (gasoline or diesel, and approximate mpg of car)
Data was provided by each department that manages a vehicle fleet, including the Police, Fire, and Public Work Departments
Amount of natural gas released during transport (2.5%)
2019 Utility bills from Duke Energy and Energy United
Average amount of trash collected each week
2019 Utility bills from Dominion Energy
APPENDIX A.2: DETAILED METHODOLOGY
Building & Facilities
Davidson's buildings and facilities were calculated using usage data obtained from the government's tracking documents and utility data.
Streetlights and Traffic Signals
Davidson's streetlights and traffic signals were calculated using usage data obtained from the government's tracking documents and utility data. Utility bills from Duke Energy and Energy United for 2019 were collected and analyzed specifically for streetlights and traffic signals.
Vehicle Fleet
Fuel usage for the Town of Davidson’s vehicle fleet was supplied by the Town and calculated using the US Community Protocol.25 The annual miles traveled and annual fuel usage are tracked and multiplied by emission factors from ICLEI. These include a CO2 Emissions Factor of 0.070268 MT/MMBtu, a Biogenic CO2 Emissions Factor of 0 MT/MMBtu, a CH4 Emissions Factor of 2.153 x10⁻⁸ MT/vehicle mile, a Biofuel CH4 Emissions Factor of 0 MT/vehicle mile, a N2O Emissions Factor of 1.248 x10⁻⁸ MT/ vehicle mile, and a Biofuel N2O Emissions Factor of 0 MT/vehicle mile.
Employee Commute
Data on employee commutes was provided by the 2019 commuting survey of Town of Davidson employees as well as employee residence and commute estimates. The survey asked employees about their commuting habits. Total mileage was calculated by multiplying the average miles per commute by the average workdays per week and then calculating the yearly VMT using the average number of working weeks in a year, which is 49.26 This yields the total annual commuting VMT for the Town of Davidson. The emissions were then calculated using the US Community Protocol emission factors of CO2 Emissions Factor 0.07024 MT/MMBtu, CH4 Emissions Factor 1.8300 x10⁻⁸ MT/Mile, and a N2O Emissions Factor 8.3 x10⁻⁹ MT/Mile.
25 U.S. Community Protocol for Accounting and Reporting of Greenhouse Gas Emissions Appendix D: Transportation and Other Mobile Emission Activities and Sources.
26 https://www.bls.gov/news.release/pdf/atus.pdf
Solid Waste
Emissions for the Town of Davidson’s solid waste was gathered from the average amount of trash collected each week from government buildings. The following are the specific emission factors: Mixed MSW Emission Factor (MT CH4/wet short ton) 0.0648, Newspaper Emission Factor (MT CH4/wet short ton) 0.042, Office Paper Emission Factor (MT CH4/wet short ton) 0.1556, Corrugated Cardboard Emission Factor (MT CH4/wet short ton) 0.1048, Magazines/Third Class Mail Emission Factor (MT CH4/wet short ton) 0.0476, Food Scraps Emission Factor (MT CH4/wet short ton) 0.0648, Grass Emission Factor (MT CH4/wet short ton) 0.0228, Leaves Emission Factor (MT CH4/ wet short ton) 0.026, Branches Emission Factor (MT CH4/wet short ton) 0.058. The calculation methodology was adopted from the US Government Operations Protocol.
Emissions Not Included
Life-cycle emissions (extraction, processing, packaging, transport, and disposal) of supplies, equipment, and other goods purchased for municipal activities (data unavailable and outside the intended scope of the inventory). Refrigerant and hydrofluorocarbon emissions (data unavailable and outside scope of the inventory). Water and wastewater emissions and emissions from long-distance rail, air, or other vehicle travel associated with government operations (outside scope of inventory and expected to be minimal).
APPENDIX B: STAKEHOLDER REPORT
BACKGROUND
Prior to the CAP development, the project team formulated a stakeholder engagement strategy. This strategy aimed to assess the Town's current environmental initiatives, understand the reasons for any shortcomings in these actions, and gain insights into the community's aspirations and objectives for environmental sustainability in the short, medium, and long term. The project team facilitated two interactive workshops via an online platform. Additionally, a community-wide survey was conducted to gather broader input. This report summarizes the key feedback and insights gathered from these engagement activities.
WORKSHOP #1 - DAVIDSON STAFF PERSPECTIVES & FEEDBACK
DATE: July 19, 2023 | 11am to 12:30 pm EST
LOCATION: Online via Zoom
ATTENDEES:
• Austin Nantz, Assistant Town Manager; Andrew Golden, Planner (transportation aspects); Jason Burdette, Planning Director; Jessica Eggimann, Communications; Kim Fleming, Economic Development Director; Betsy Shores, Town Clerk; Jamie Justice, Town Manager; Piet Swart, Finance Director; Eugene Bradley, Housing and Equity Director; Jesse Bouk, Public Works Director; Amber Levi, Human Resources Director; Leslie Willis, Parks and Recreation Director; Charlene Minor, Sustainability; Sebastian Provencio, Intern (Town of Davidson)
• Yancey Fouché, Sustainability Director; David Holthouser, Director of Facilities (Davidson College)
KEY TAKEAWAYS:
RESOURCE CONSERVATION
• The Town staff appreciates the existing compost program and believes it should be continued and further expanded. There is a consensus that educating citizens about composting and recycling is essential to encourage greater participation.
• The staff acknowledges that recycling can be more effective if citizens are better informed about contamination issues and how to recycle properly.
• Some members suggest exploring partnerships with the county for handling specialty waste streams, similar to the successful composting collaboration.
• There is an interest in reducing waste sent to landfills and diverting construction and demolition waste. However, it's noted that the Town is currently reliant on the county's waste plan, limiting its autonomy in waste management.
APPENDIX B: STAKEHOLDER REPORT
• The Town staff shows a willingness to adopt behavior changes at the Town facilities Some of the proposed ideas include going paperless, using reusable plates and utensils, opting for water dispensers instead of bottled water, and procuring more environmentally friendly materials.
• The staff recognizes the importance of modeling sustainable behavior to set an example for citizens and suggests focusing on smaller practices that can collectively make a significant impact.
• The staff shows interest in continuing and improving recycling and organics collection programs, including the addition of more containers, especially in parks and facilities.
MOBILITY & TRANSPORTATION
• There is community backing for multi-modal transportation, with a positive response to pedestrian and bike infrastructure. Improvement in EV charging stations is suggested to encourage the adoption of electric vehicles.
• Participants express interest in enhancing public transportation, including improving the bus network, exploring the feasibility of mass transit options, and implementing a micro-transit initiative.
• Consideration is given to providing incentives for employees to adopt electric vehicles or hybrids, possibly matching federal tax credits.
• Providing amenities such as shade, shelter, and restrooms along greenways is seen as important. It is noted that as temperatures rise due to climate change, ensuring comfort for pedestrians and cyclists becomes crucial to encourage non-car travel.
• Some members suggest assessing the viability of right-sized buses to match demand and overcome the stigma associated with riding the bus when it is mostly empty.
• Participants are excited about the potential of a micro-transit initiative, which involves smaller-scale and user-friendly public transportation options.
• Emphasizing workforce housing efforts and planning for locations closer to work can help reduce the need for longer commutes and encourage more sustainable transportation choices.
BUILDINGS & ENERGY
• The Town has recently adopted Utility Service Access Criteria (USAC) to score projects based on their alignment with sustainability goals, including energy efficiency, renewable energy, and on-site charging infrastructure. This process aims to guide developers towards sustainable practices.
• Participants suggest exploring opportunities to lower overall costs in existing homes through weatherization and energy efficiency programs, especially during rehab projects.
APPENDIX B: STAKEHOLDER
• Advocating for increased energy efficiency standards in buildings at the state level is considered an opportunity for the Town to influence policy and contribute to sustainability efforts.
• Creating a green building policy for municipal buildings to guide future construction decisions and set sustainability standards is proposed.
• Enhancing communication to homeowners about rebates, tax credits, and funding opportunities for energy-efficient upgrades, such as heat pumps, is recommended.
• Participants express interest in partnering with other municipalities and forming a hub to share knowledge and resources related to sustainable building practices and funding opportunities.
• Emphasizing knowledge sharing among the community, including the college and local corporations with expertise in sustainable building, is seen as valuable for helping homeowners and businesses implement best practices.
GREEN COMMUNITY
• The Town has implemented a regulatory framework, including credits for land preservation and agrarian uses in rural areas. Efforts have been made to balance quality development with conservation in these areas.
• Davidson has conducted tree canopy inventories to document and monitor tree cover changes over time, contributing to green community efforts.
• The Parks team has focused on incorporating more natural assets in parks, aligning with Davidson's cultural values.
• The main challenge to green community initiatives is strong development pressures in the area.
• Participants suggested considering visual elements such as recycled or gray water catchment systems, green roofs, and promoting native plants and water-efficient landscaping.
• Recent stormwater improvements in the area have contributed to enhancing stormwater management.
• Exploring rainwater collection programs and initiatives, like rain barrel distribution, could be beneficial for sustainability efforts.
• The Davis Farmers Market represents an opportunity for residents and visitors to access locally sourced food.
APPENDIX B: STAKEHOLDER REPORT
CLIMATE RESILIENCE
• Clear and effective communication to the community, especially regarding climaterelated risks like wildfire smoke or flooding, is essential for building climate resilience.
• A local green business program could incentivize and celebrate businesses' sustainable practices and actions.
• Incorporating climate resilience into infrastructure development, such as reducing impervious surfaces and integrating renewable energy with battery backup systems, can enhance resilience.
• Considering climate impacts like hotter temperatures when planning and designing public spaces, ensuring sufficient shading for residents' comfort.
• One staff member emphasized the need to address the diverse income levels in the community and ensure that strategies take into account the different needs and preferences of the population.
WORKSHOP #2 - DAVIDSON LEADERS PERSPECTIVES & FEEDBACK
DATE: September 13, 2023 | 1:30pm to 3:00 pm EST
LOCATION: Online via Zoom
ATTENDEES:
• Charlene Minor; Leslie Willis; Austin Nantz (Town of Davidson)
• Gordon Clark, TreesDavidson
• Cameron Clark, Davidson College Sustainability Office
• Nora Barger, Co-chair of the Davidson Sustainability Committee
• Meg Fencil, Director of Engagement and Impact, Sustain Charlotte
• Steve Justus, Davidson Sustainability Committee
• Dave Cable, Davidson Lands Conservancy
• Connie Wessner, Executive Director, Davidson Housing Coalition
• Matt Walt, Co-chair of the Davidson Sustainability Committee
• Jeff Robbins, Executive Director, CleanAIRE NC
• Letha Smith, Sustainability Committee and Letha's One Stop Shop
• Emily Vestling, Leader of Strategic Sustainability Initiatives, Trane Technologies
• Eric Kopco, Better Tomorrow Solar (PNGEA Technologies)
APPENDIX B: STAKEHOLDER REPORT
KEY TAKEAWAYS:
MOBILITY & TRANSPORTATION
• The Town in partnership with Duke Energy Park has successfully installed electric vehicle charging stations at Town Hall and circles at 30. However, there is a recommendation from participants to expand these facilities in other parts of the Town, especially in areas that may have faced disinvestment in the past, emphasizing on equitable distribution and accessibility for all.
• There's appreciation for the concept of a 15-minute city. Drawing inspiration from the City of Charlotte's adoption of a 10-minute neighborhood goal in 2021. An integral part of this concept emphasizes ensuring routes for walking or biking are tree-lined, providing shade and promoting climate resilience. This aligns with the idea that such routes need to be safe and comfortable for individuals choosing modes of transport other than cars.
• While the Town has made efforts to promote biking, it is observed that it remains largely car-centric. A suggestion is made to position biking not just as an alternative but a viable choice for daily commuting. Given the Town's size, it is noted that it essentially qualifies as a 15-minute city for most residents, but the dominance of cars remains.
• The Town's efforts in promoting biking and walking, especially among students, have been acknowledged. For instance, the promotion of 'bike and walk to school days' is commendable. However, a suggestion is made to explore more consistent strategies to reduce school traffic and encourage more students to bike or walk to school on a regular basis.
• The significant car use for work commute was noted, indicating a lack of job opportunities within Davidson.
• Concerns about public transportation efficiency, especially the village rider’s timings and routes, were raised.
• Idling behaviors, like in grocery pickup lanes and delivery trucks, were highlighted as contributors to greenhouse gas emissions.
BUILDINGS & ENERGY
• The Town has achieved notable success with the most Energy Star and LEED certified buildings per capita in North Carolina. An ongoing solar feasibility study is looking at possibilities for solar panels at Town hall.
• Emphasizing energy efficiency, especially in the context of the “nega watt” concept, was highlighted as important. The Town could support energy efficiency through promoting and expanding programs like the critical home repair pilot, especially for affordable housing.
APPENDIX B: STAKEHOLDER
• Advancing renewable energy projects, particularly solar, was advocated for. Enhancing community outreach and education on available incentives and benefits of renewable energy could expedite its adoption.
• There are available funds for weatherization programs, especially benefiting EJ communities. Utilizing funds from the Justice 40 program could help extend the reach of energy efficiency to those communities.
• The importance of outreach to and engagement with historically marginalized communities was highlighted. Emphasizing the necessity of ensuring that new initiatives and benefits reach everyone equitably.
• Embracing newer technologies, such as electrification and thermal storage, could reduce emissions. Adopting passive cooling techniques and promoting technologies with a focus on a renewable grid were also suggested.
• Cost is seen as a major barrier to the adoption of clean energy technologies, especially solar installations, even though prices have decreased recently.
• Promoting local tax credits and incentives for clean energy solutions could aid adoption. There's also a need to increase awareness of available incentives.
• Facilitating access to funds and navigating available resources was recognized as essential. Bridging the gap between available opportunities and the community can provide significant returns.
RESOURCE CONSERVATION
• The Town provides opportunities for conservation, but more active outreach is needed to convert these into shared civic values.
• The Town can act as a role model by demonstrating conservation behaviors, encouraging the community to adopt them.
• Reducing parking on waste collection days can expedite the waste collection process, making it efficient and reducing the time waste trucks spend idling.
• There's a need for increased education around recycling – what can be recycled, how, and why. This could be accomplished through trips to waste centers or educational programs.
• Advocate for the elimination of plastic bags in retail outlets. As a majority of plastics aren't recycled, eliminating them at the source could prove effective.
• Through community challenges or other incentives, the Town could encourage citizens to reduce their overall consumption, particularly of plastic products.
• Consider the creation of a waste reduction or zero-waste plan to provide a structured approach to waste management in Davidson.
APPENDIX B: STAKEHOLDER
GREEN COMMUNITY
• There's a need for strategic land conservation to protect key landscapes. With increasing land prices and urbanization pressures, private land conservation models are inadequate. A more effective approach would involve the community acquiring development rights using public capital. Waiting too long could make conservation irreversible due to development.
• Exploring potential opportunities around carbon capture and credits could incentivize private landowners to adopt environmentally friendly practices. Such incentives could provide value for the community by reducing carbon footprints and supporting environmental sustainability.
• Promoting strategies like green roofs, rain gardens, and private property tree planting can help manage stormwater more effectively. The community would benefit from reduced lawn areas and increased rainwater filtration into the groundwater.
• Efforts should be made to reintroduce edible landscapes, especially on available vacant lands. Current policies pose challenges to initiating such projects, especially around planting on private properties. Effective communication channels are essential for informing the community about available resources and initiatives.
• While maintaining the historic feel of Davidson is vital, there's a need to recognize the benefits of dense development. Addressing concerns around development can strike a balance between the small-town feel and the advantages of urban development.
• There's a need to shift the perspective on public versus private trees. Trees, regardless of their location, provide community benefits such as filtering particulates, managing stormwater, and enhancing neighborhoods. Policies should be revised to allow public capital to support trees on private land, considering the broader benefits they offer to the community.
• The Town should seek collaborative public-private resources for green initiatives. Hiring a dedicated person within the Town could help tap into varied resources, such as USDA funds, to drive these green community initiatives forward.
• The community feels the urgency to adopt green community initiatives, recognizing the broader benefits these offer. There's a need for policy revision, strategic land conservation, and better resource utilization to effectively implement these green initiatives.
APPENDIX B: STAKEHOLDER
CLIMATE RESILIENCE
• Emphasizing the need for resiliency hubs, especially in Town facility redevelopment projects. These hubs can provide refuge during heatwaves and other climatic challenges. The community should proactively prepare for future changes, despite the uncertainty surrounding them. Ensuring access to resources after natural disasters and improving infrastructure are crucial.
• Heat-related illnesses, which result in the highest number of deaths due to climate events, are a significant concern. As the Town renovates facilities such as the police and fire department, there's an opportunity to integrate cooling centers. These centers can provide relief during extreme heat events, enhancing the Town's resilience. The emergency response team should consider climate event risks and community responses in their protocols.
• Capitalizing on current and future redevelopment projects to integrate resilience measures can address multiple challenges at once. For instance, incorporating cooling centers in new housing developments, especially affordable ones, can offer residents protection during heat events.
• Other Town facilities, such as the library and the new Town hall, are also potential sites to integrate resilience strategies, serving as additional locations for cooling centers or other relief resources.
CLIMATE ACTION PLAN COMMUNITY SURVEY
During the planning process, a Climate Action Plan Community Survey was created, disseminated, and analyzed. Its aim was to involve the community at large, giving every resident the chance to express their views on climate change issues. The survey provided valuable insights into the community's awareness, attitudes towards climate change, their priorities, and main interests. Efforts were made to ensure the survey reached as many people as possible through distribution and promotion. Distribution methods included updates on the Town's website, email blasts, the Town-wide newsletter, posters displaying the survey's QR code at important community spots, and at events like community gatherings, farmers markets, and weekend concerts. A total of 280 responses were gathered. The following are some of the responses received by the Town.
APPENDIX B: STAKEHOLDER REPORT
through distribution and promotion. Distribution methods included updates on the Town's website, email blasts, the Town-wide newsletter, posters displaying the survey's QR code at important community spots, and at events like community gatherings, farmers markets, and weekend concerts A total of 280 responses were gathered The following are some of the responses received by the Town.
the chance to express their views on climate change issues. The survey provided valuable insights into the community's awareness, attitudes towards climate change, their priorities, and main interests Efforts were made to ensure the survey reached as many people as possible through distribution and promotion. Distribution methods included updates on the Town's website, email blasts, the Town-wide newsletter, posters displaying the survey's QR code at important community spots, and at events like community gatherings, farmers markets, and weekend concerts A total of 280 responses were gathered The following are some of the responses received by the Town.
Q1: How concerned are you about climate change? (1 = not at all concerned; 5 = extremely concerned )
Q1: How concerned are you about climate change? (1 = not at all concerned; 5 = extremely concerned )
Q1: How concerned are you about climate change? (1 = not at all concerned; 5 = extremely concerned )
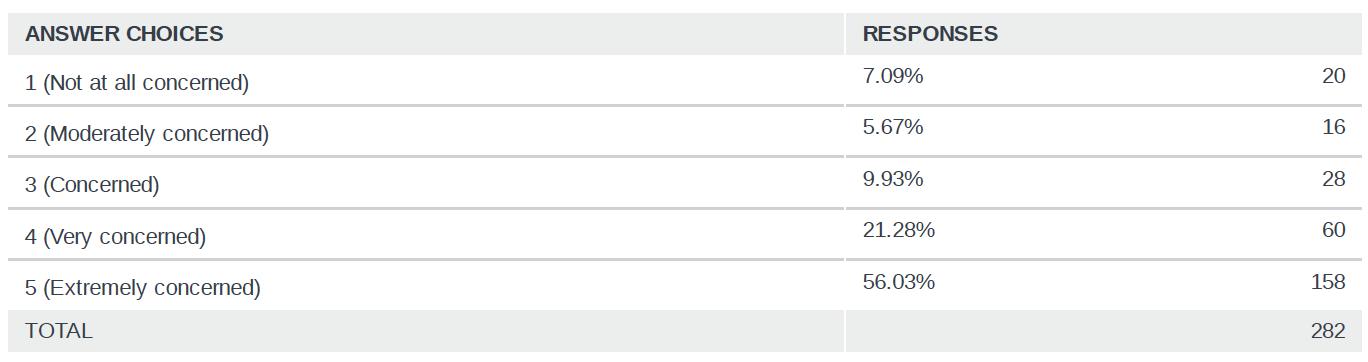
Q2: How important is it to you that the Town do something about climate change? (1 = NOT AT ALL important; 5 = EXTREMELY important)
Q2: How important is it to you that the Town do something about climate change? (1 = NOT AT ALL important; 5 = EXTREMELY important)
Q2: How important is it to you that the Town do something about climate change? (1 = NOT AT ALL important; 5 = EXTREMELY important)
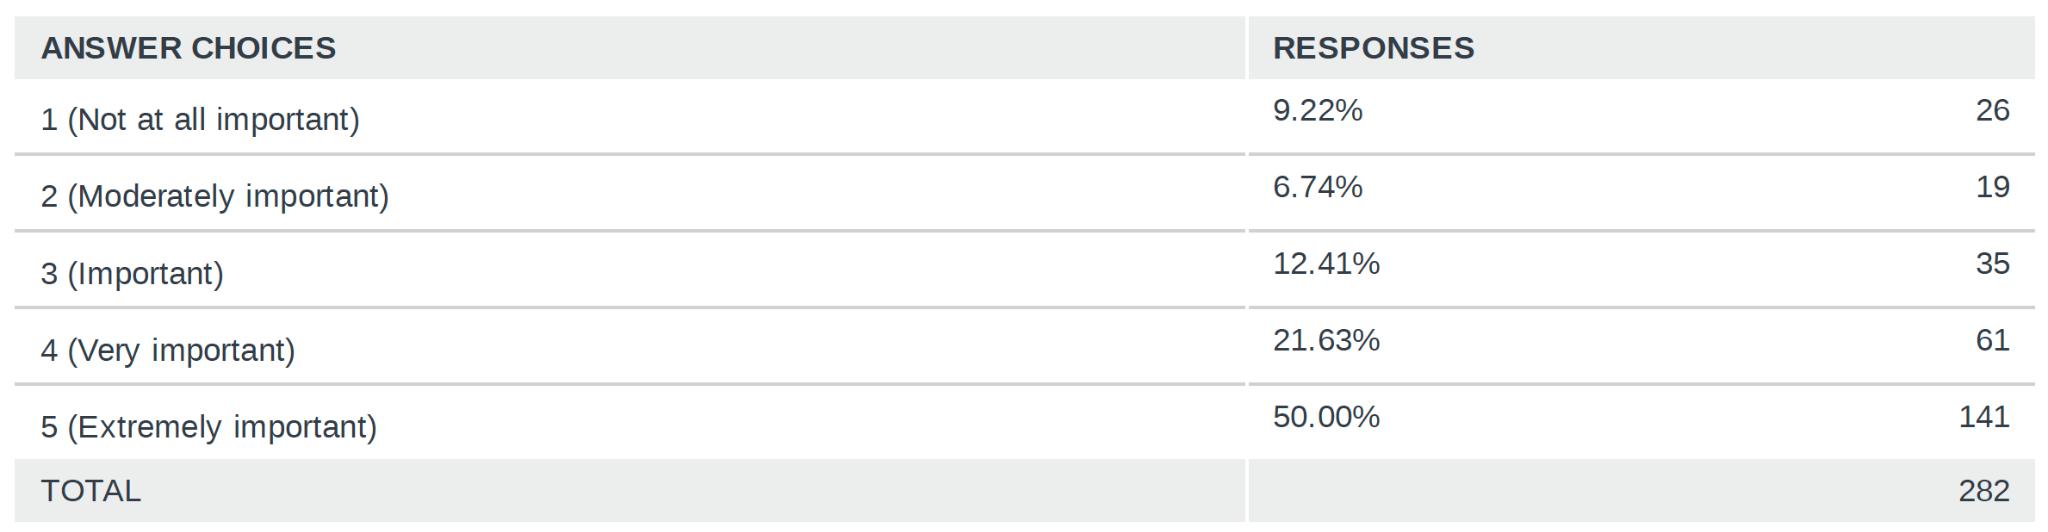
Q3: How do you feel about climate change?
Q3: How do you feel about climate change?
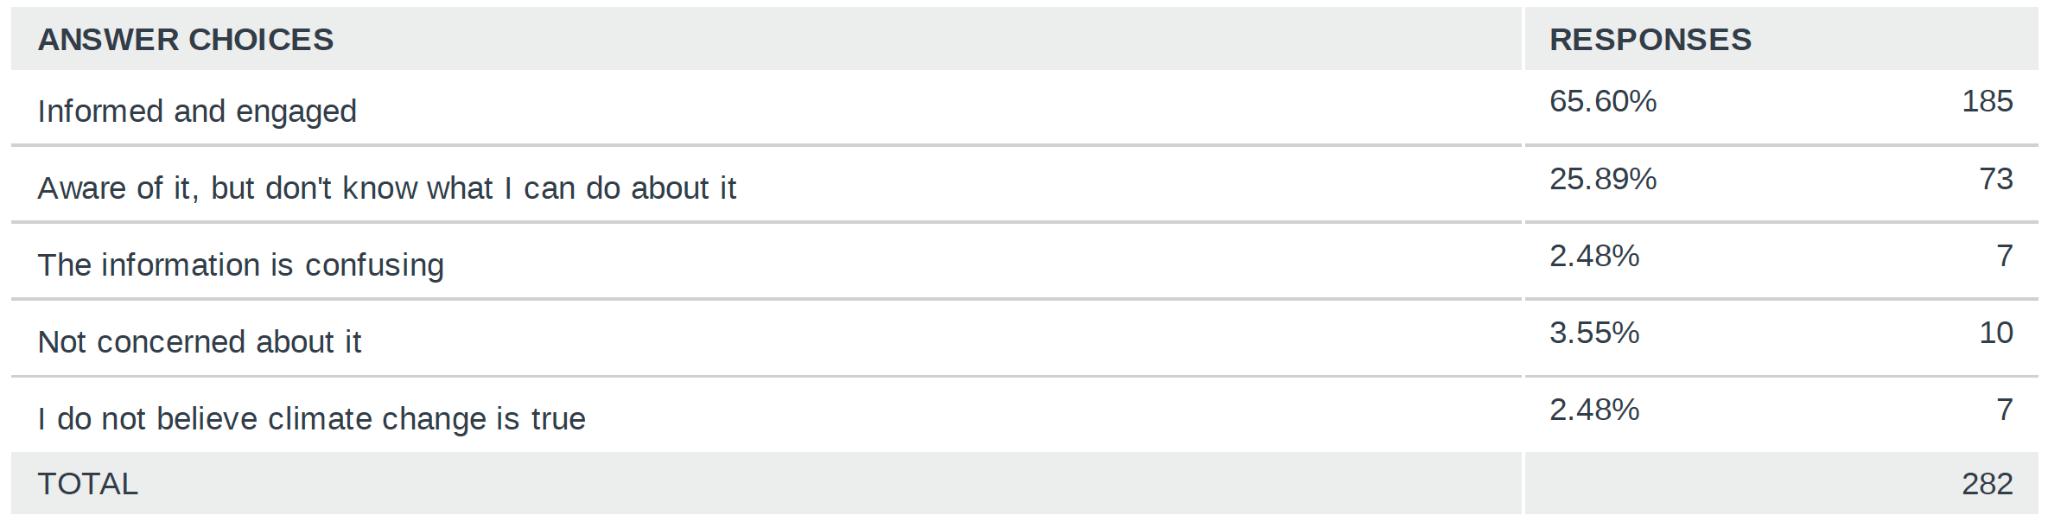
Q4: Are you aware of what the Town is doing about climate change (for example changing all street lights to LED and installing Electric Vehicle Stations when grants/funding is available)?
Q5: Which climate risks are you the most concerned about? (Please rank
APPENDIX B: STAKEHOLDER REPORT
Q4: Are you aware of what the Town is doing about climate change (for example changing all street lights to LED and installing Electric Vehicle Stations when grants/funding is available)?
Q4: Are you aware of what the Town is doing about climate change (for example changing all street lights to LED and installing Electric Vehicle Stations when grants/funding is available)?
Q4: Are you aware of what the Town is doing about climate change (for example changing all street lights to LED and installing Electric Vehicle Stations when grants/funding is available)?

Q5: Which climate risks are you the most concerned about? (Please rank from 1 -7, 1 being LEAST concerned and 7 being MOST concerned )
Q5: Which climate risks are you the most concerned about? (Please rank from 1 -7, 1 being LEAST concerned and 7 being MOST concerned )
Q5: Which climate risks are you the most concerned about? (Please rank from 1 -7, 1 being LEAST concerned and 7 being MOST concerned )
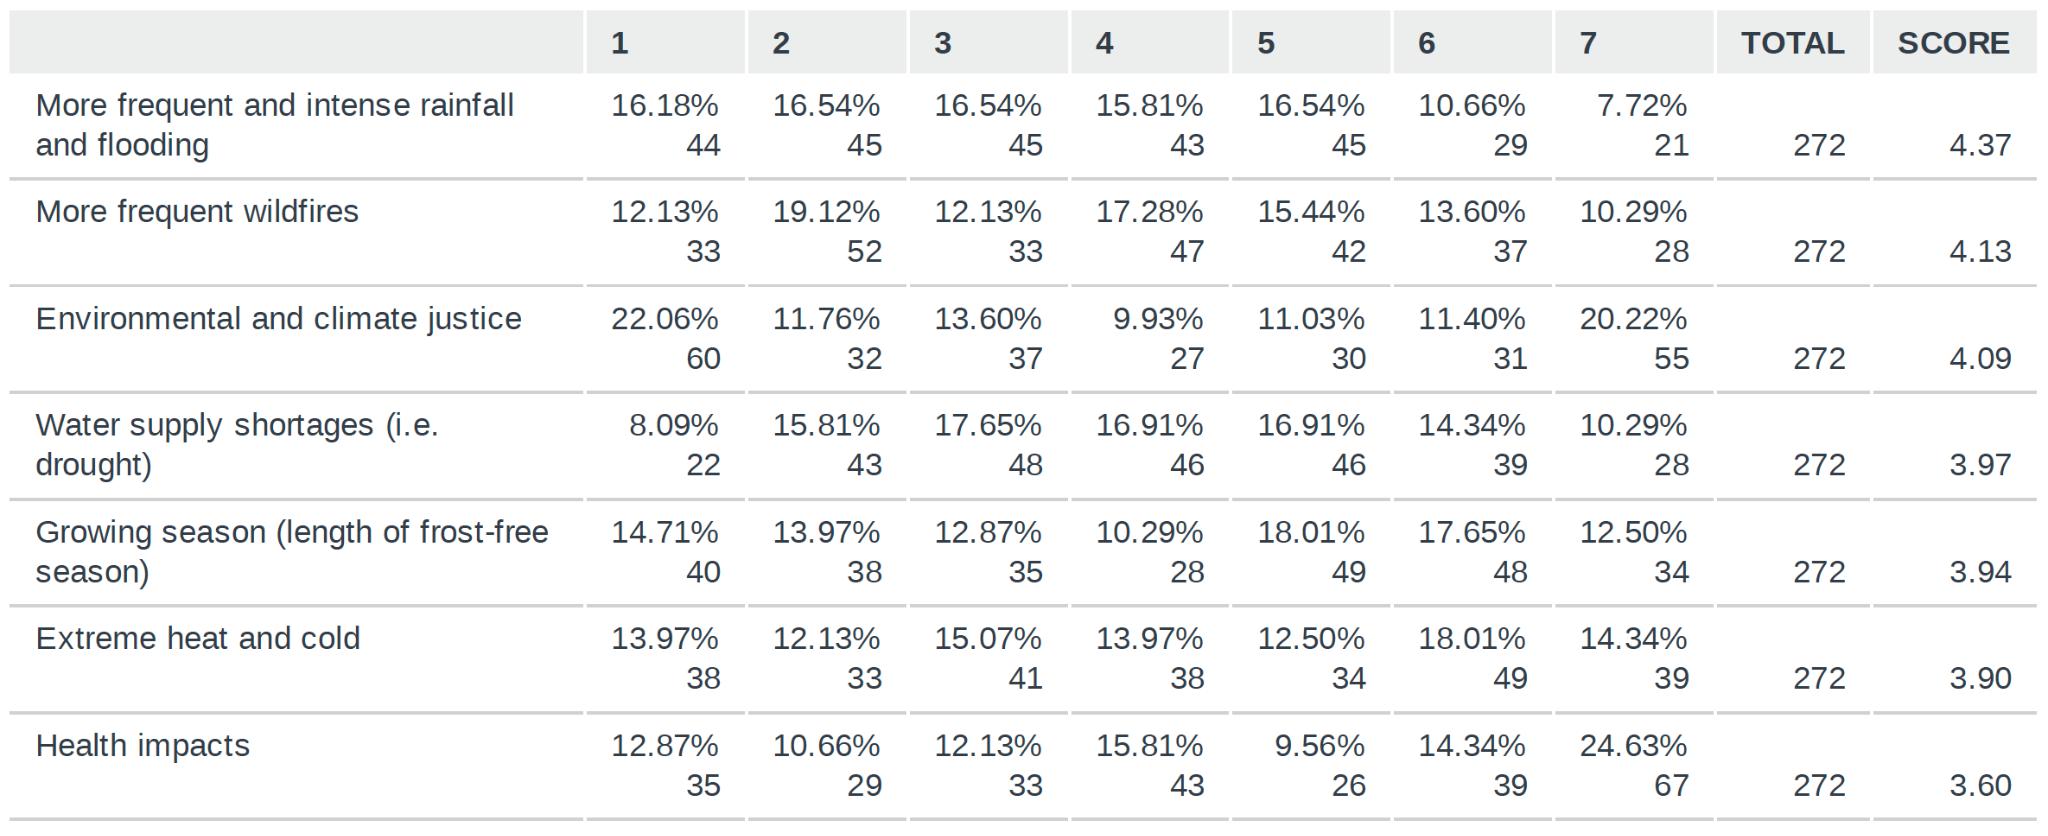
Q6: What do you see as the three biggest challenges to addressing climate change in Davidson? (select only three)
Q6: What do you see as the three biggest challenges to addressing climate change in Davidson? (select only three)
Q6: What do you see as the three biggest challenges to addressing climate change in Davidson? (select only three)
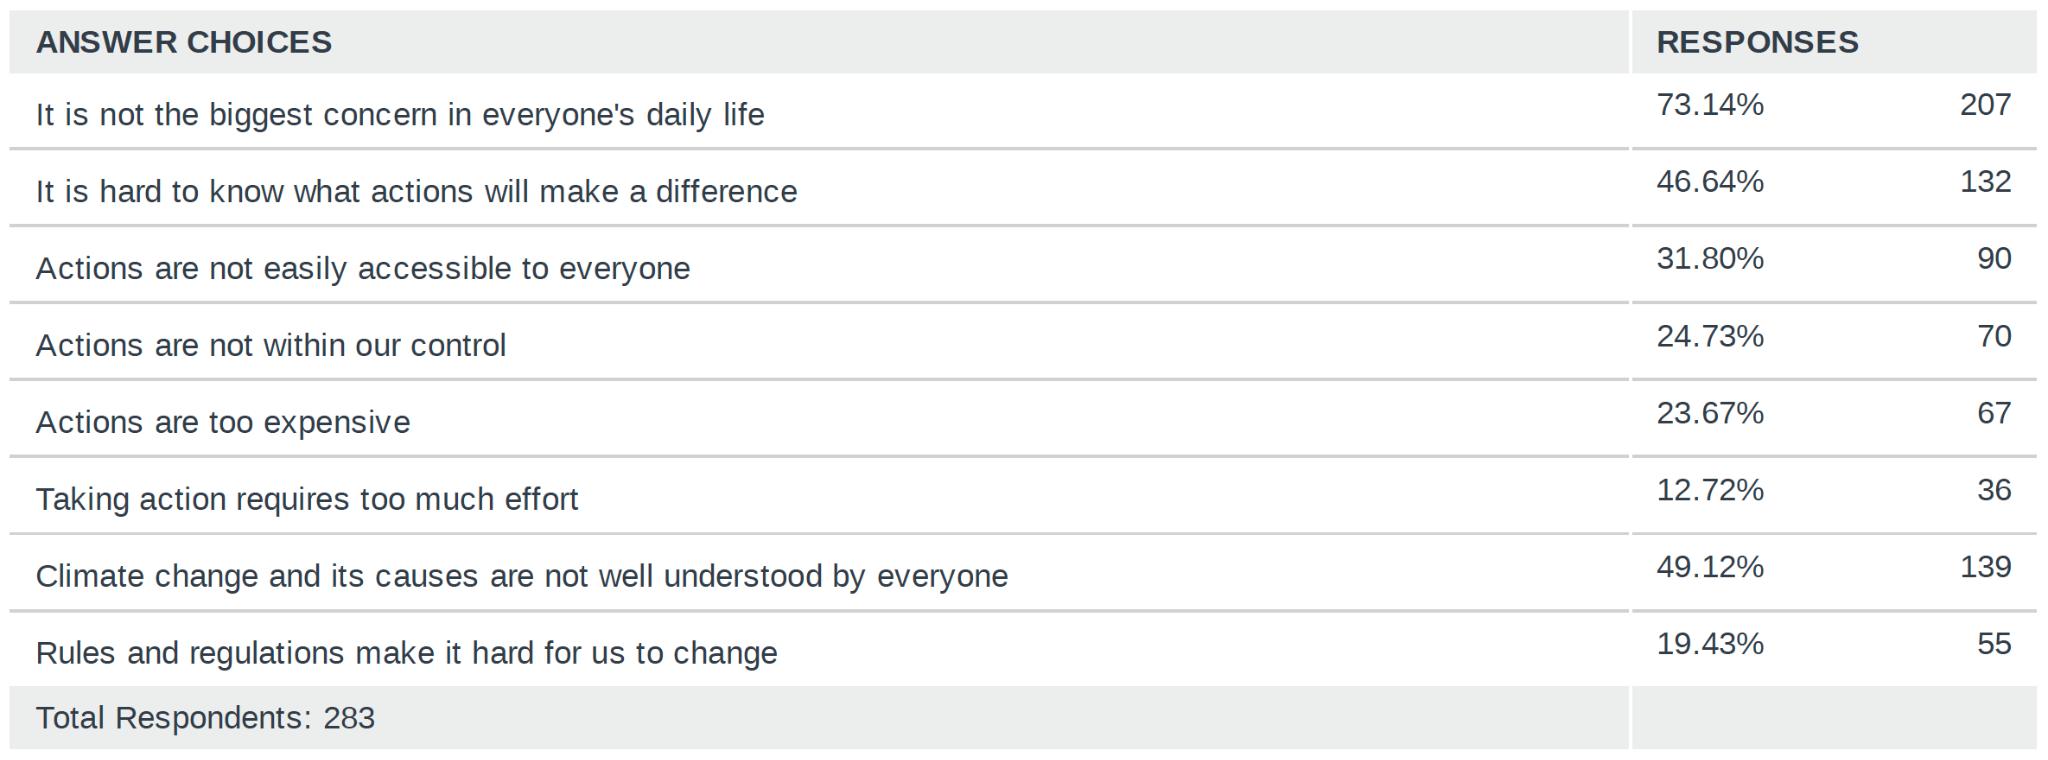
Q7: Do you think climate change has already had a negative impact on:(Choose all that apply)
APPENDIX B: STAKEHOLDER REPORT
Q7: Do you think climate change has already had a negative impact on: (Choose all that apply)
Q7: Do you think climate change has already had a negative impact on:(Choose all that apply)
Q7: Do you think climate change has already had a negative impact on:(Choose all that apply)
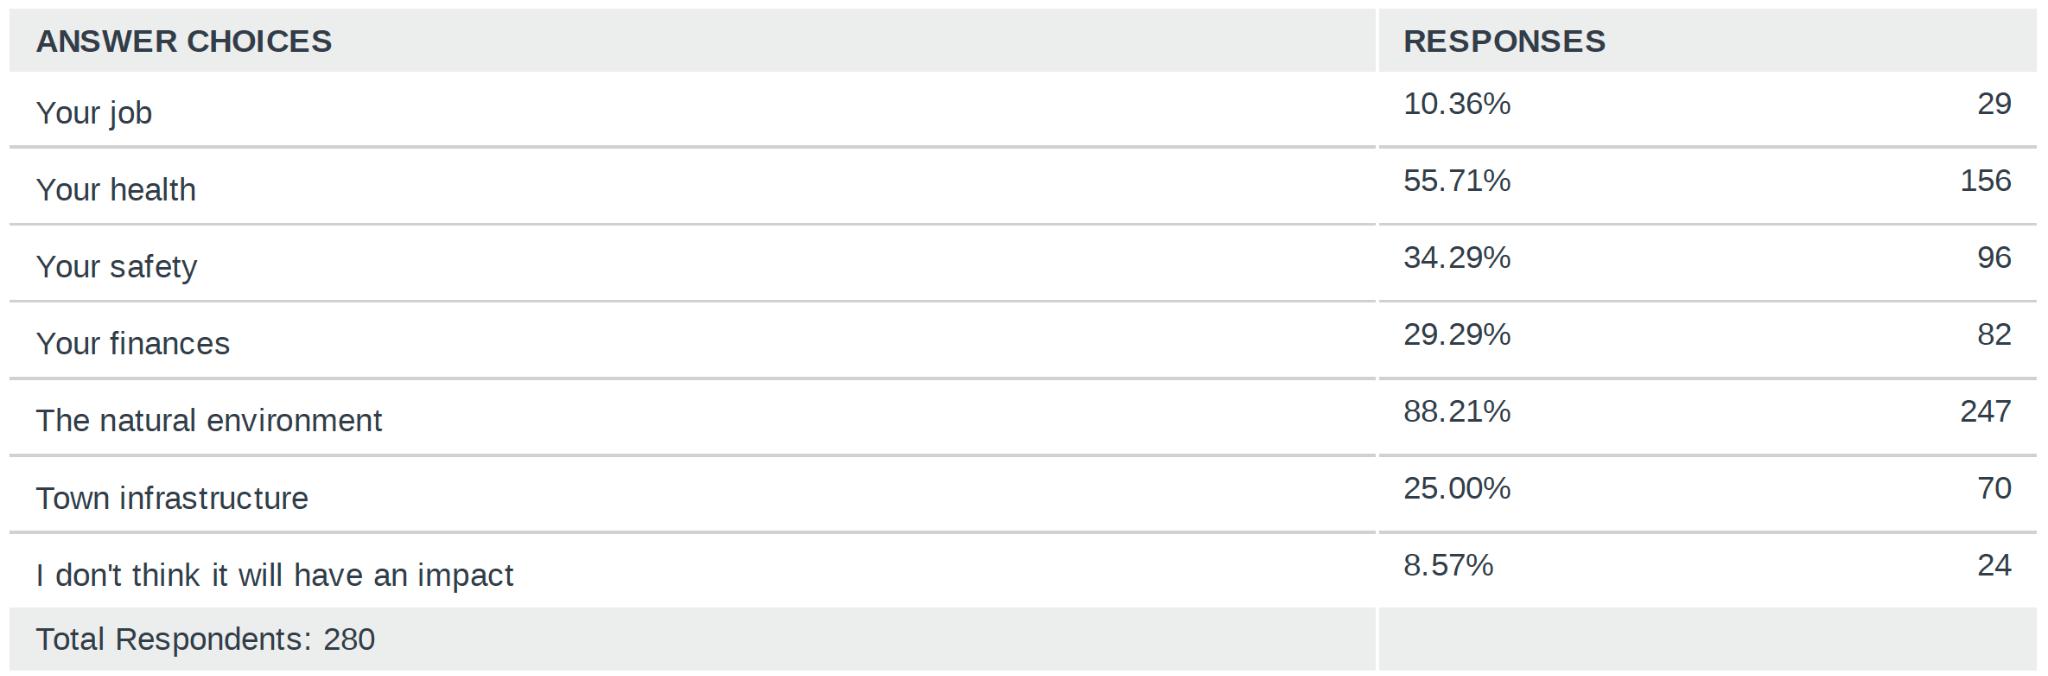
Q8 Please rank these categories in order of importance (From 1-6, 1 being the LOWEST importance, 6 being the HIGHEST importance).
Q8: Please rank these categories in order of importance (From 1-6, 1 being the LOWEST importance, 6 being the HIGHEST importance).
Q8 Please rank these categories in order of importance (From 1-6, 1 being the LOWEST importance, 6 being the HIGHEST importance).
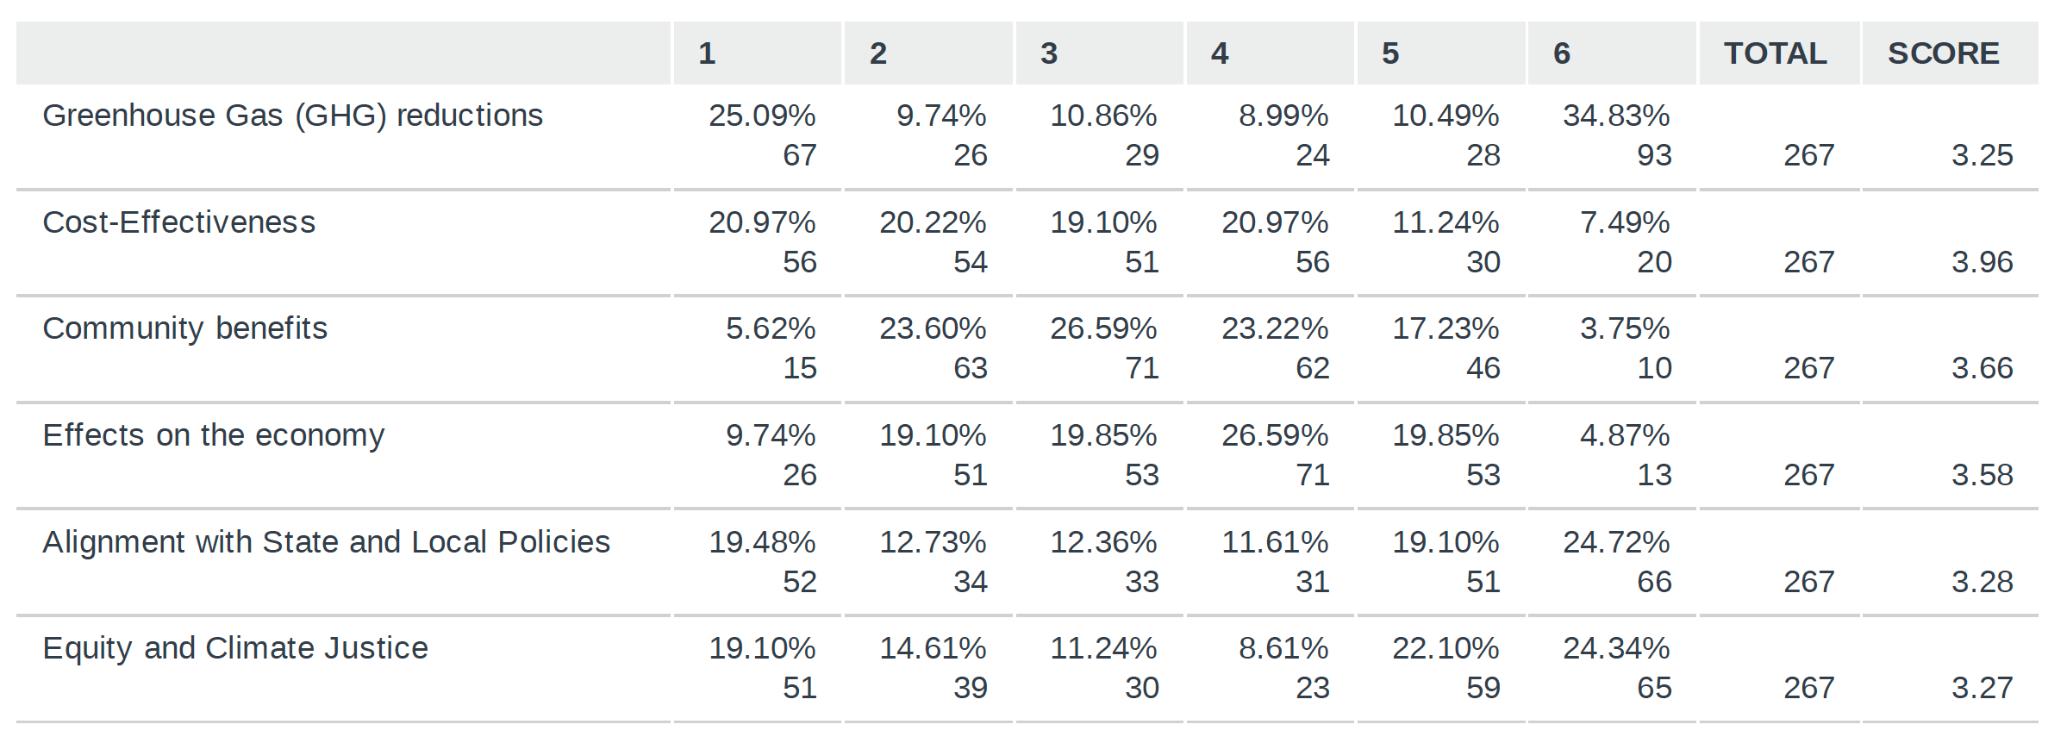
APPENDIX B: STAKEHOLDER REPORT
Q9: Which types of Mobility & Transportation strategies do you think the Town should focus on? (Please choose up to 5)
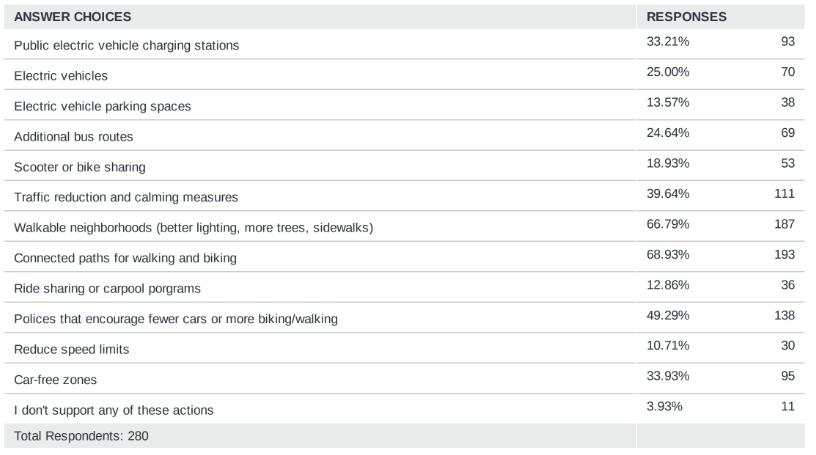
Q10: Do you own an electric vehicle?
Q10: Do you own an electric vehicle? Q10: Do you own an electric vehicle?
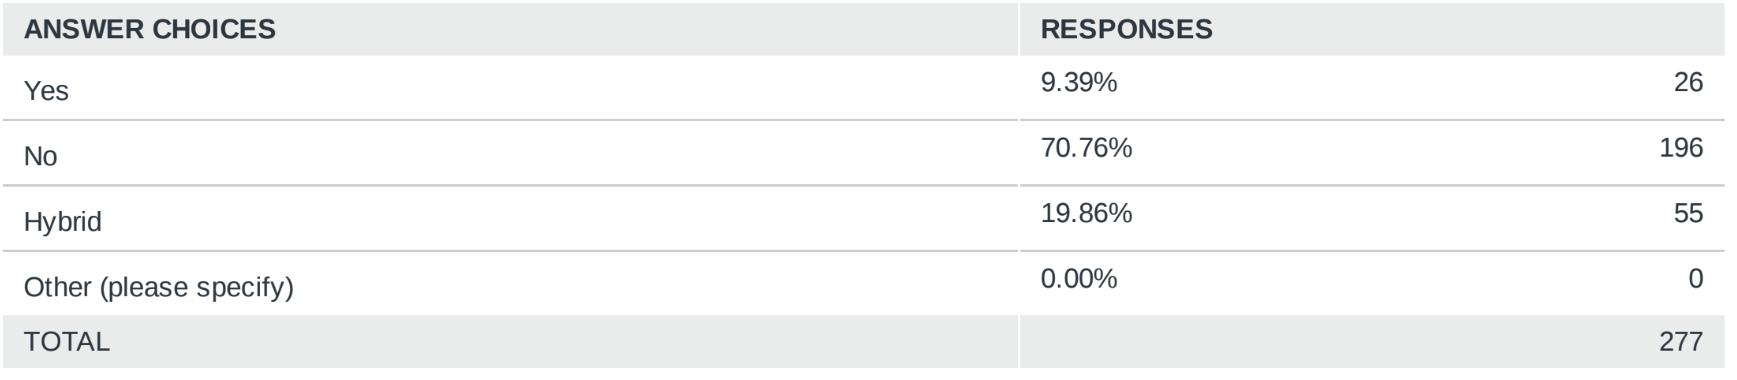
Q11: If you don't own an electric vehicle, why not? (Select all that apply)
Q11: If you don't own an electric vehicle, why not? (Select all that apply)
Q12: Which types of Buildings & Energy strategies do you think the Town should focus on?
Q12: Which types of Buildings & Energy strategies do you think the Town should focus on?
APPENDIX B: STAKEHOLDER REPORT
Q11: If you don't own an electric vehicle, why not? (Select all that apply)
Q11: If you don't own an electric vehicle, why not? (Select all that apply)
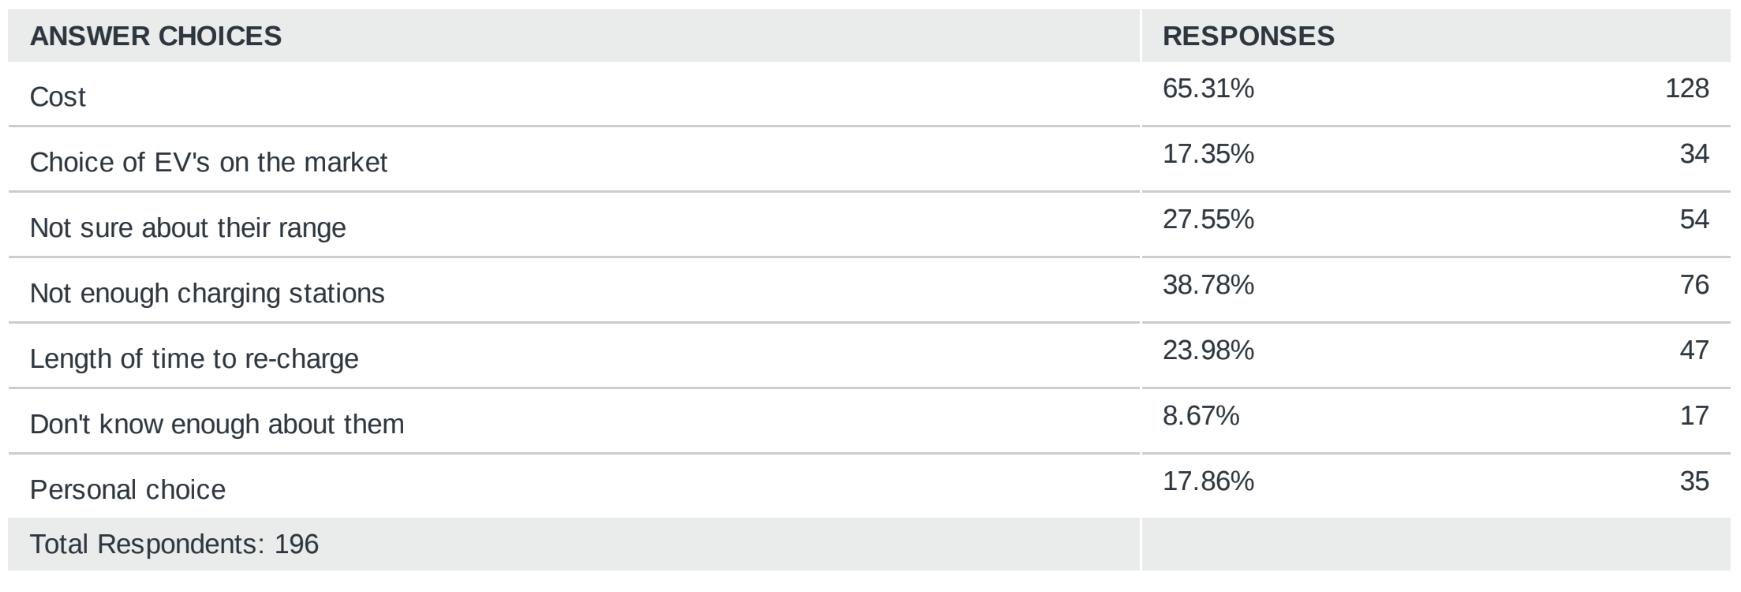
Q12: Which types of Buildings & Energy strategies do you think the Town should focus on?
Q12: Which types of Buildings & Energy strategies do you think the Town should focus on? (Please choose up to 5) (Please choose up to 5)
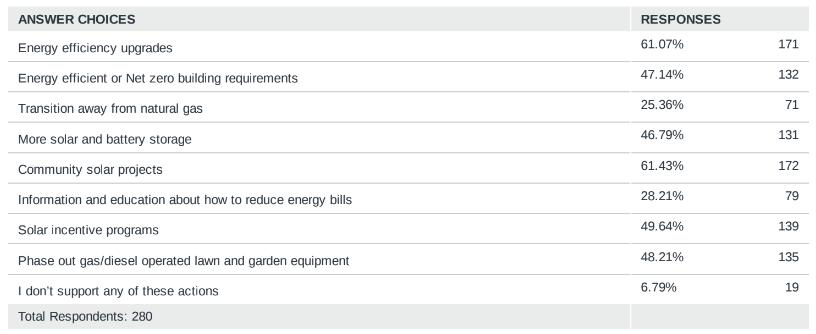
Q13: Which types of Buildings & Energy strategies do you think the Town should focus on? (Please choose up to 5)
APPENDIX B: STAKEHOLDER
Q13: Which types of Buildings & Energy strategies do you think the Town should focus on? (Please choose up to 5)
Q13: Which types of Buildings & Energy strategies do you think the Town should focus on? (Please choose up to 5)
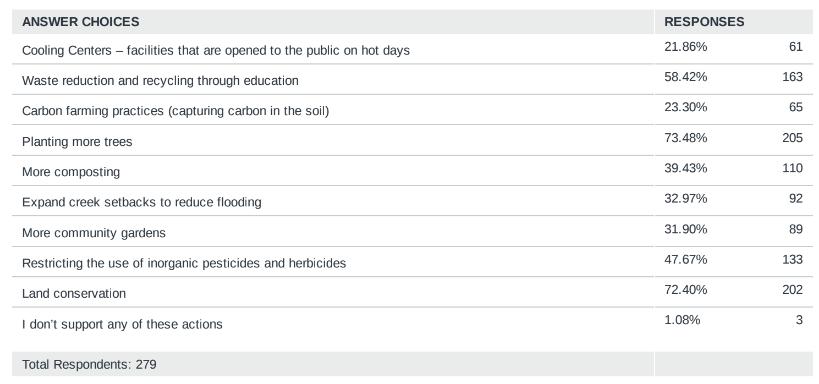
Q14: Which types of Resource Conservation strategies do you think the Town should focus on? (Please choose up to 5)
Q14: Which types of Resource Conservation strategies do you think the Town should focus on? (Please choose up to 5)
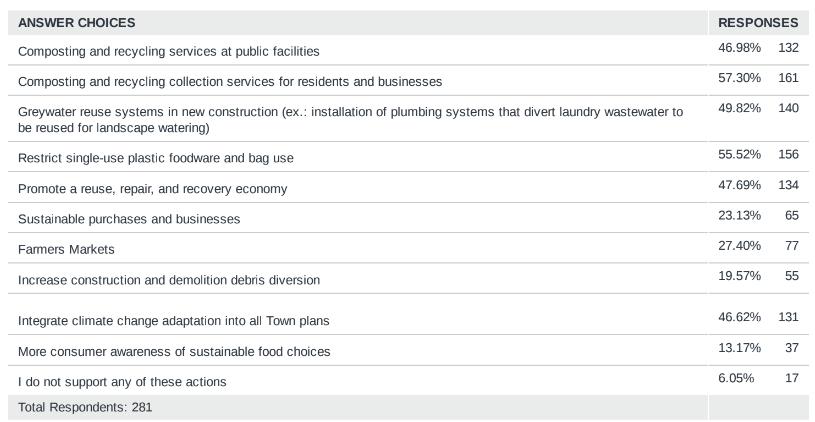
APPENDIX C: PROVISIONAL FORECASTS
INTRODUCTION
This appendix describes current greenhouse gas (GHG) emissions reduction targets and forecasts identified in Town of Davidson’s 2024 Climate Action Plan for the near and long-term future and explains the mitigation targeting plan to the year 2050. The report also quantifies the reduction impact that local and federal laws, utility grid mix changes, and transportation trends will have on Town of Davidson’s BusinessAs-Usual forecast, resulting in an “Adjusted Business-As-Usual forecast.” Finally, the implications of Town of Davidson’s top emission reduction strategies from the 2024 Climate Action Plan are visualized in the findings of this report. Importantly, achieving the GHG mitigation targets described below, will be dependent on the strategies within the 2024 Climate Action Plan. Provisional targets for Town of Davidson GHG mitigation as identified in the climate action plan are for the Town of Davidson to reach municipal carbon neutrality by 2037 and community carbon neutrality by 2050.
The most recent greenhouse gas inventory was performed for the year 2019 in association with the 2024 Climate Action Plan. Community-wide emissions in 2019 equaled 99,170 MT CO2e. Several forecasts were also developed. A Business-As-Usual27 forecast— projecting emissions based on Town growth and an absence of interventions—shows emissions growing to 190,711 MT CO2e by 2050. The adjusted Business-As-Usual forecast—which includes the effect of existing state and local policies—shows emissions will reduce to 57,526 MT CO2e in 2050. A 100% reduction in emissions would require significant investment in strategies listed in the plan, as well as the achievement of all policy targets reflected in the Adjusted Business-As-Usual. If strategies from the emission reduction strategies in the 2024 Climate Action Plan are successful, the Town’s emissions will reduce to potentially 2,581 MT CO2e by 205028. The Town is prioritizing emissions reductions to meet targets set in the 2024 CAP. To the degree that the Town is unable to fully achieve its 2037 and 2050 targets through emissions reductions alone, the Town will need to consider additional strategies to achieve their goals.
This report also includes forecasts for the municipal operations, including a BusinessAs-Usual, Adjusted Business-As-Usual, and Climate Action Plan forecast. Under the Business-As-Usual scenario, emissions are expected to rise from 1,033 MT CO2e in 2019 to 1,703 MT CO2e by 2037. In contrast, the Adjusted Business-As-Usual scenario predicts a reduction in emissions to 729 MT CO2e by 2037, starting from the same baseline in 2019. The Climate Action Plan projection forecasts that the Town would be emitting 190 MT CO2e annually by 2037.
27 The business-as-usual forecast was estimated starting in the year 2019 using projected growth in population, households, employment, and vehicle miles traveled between 2010 and 2020. Projections were obtained from the United States Census Data. Data for the years 2020 and 2050 were estimated using straight-line interpolation from the USA Census between the years 2010 and 2020.
28 Considering a best-case scenario.
APPENDIX C: PROVISIONAL FORECASTS AND
BACKGROUND
The Town of Davidson has set its goals in reference to a strong commitment for environmental mitigation from state and regional partners. There are many nearby organizations who influenced the strategic target of Town of Davidson’s carbon reduction goals.
STATE GUIDANCE
Some regulations apply at the state level, but others are state imposed mandates applicable at the municipal level and required of local agencies and jurisdictions. Executive Order 246 directs the state to reduce statewide GHG emissions to at least 50% below 2005 levels by 2030 and achieve net-zero emissions by 2050. House Bill 951 Energy Solutions for North Carolina (HB951) became law in October 2021, and requires the utilities commission to reduce emissions by 70% from electric public utilities by 2030 and Carbon Neutrality by 2050. North Carolina Clean Energy Plan sets a net zero GHG emissions target by 2050. The Cities Initiative, led by the Environmental Defense Fund, is a collaborative effort among North Carolina local governments to address GHG emission reductions. Centralina Clean Fuels Coalition leverages resources from the Department of Energy’s Vehicle Technology office to promote alternative fuels and electric vehicle adoption.
LOCAL GUIDANCE
The Town of Davidson's 2014 Parks and Recreation Master Plan outlines a strategic framework for the continual improvement and sustainability of its parks and recreational facilities. Rooted in the need to adapt to emerging trends and meet grant opportunities, the plan encompasses various policy recommendations, each with specific actions designed to enhance the community's overall well-being. The Town of Davidson's 2016 Rural Area Plan places a strong emphasis on sustainable development, climate resilience, and adaptation strategies across various action items. Under the theme of "Curating our Lands," the plan advocates for open space preservation, highlighting action items such as the continuation of support for open space through the development process, the application of substantial stream buffers along critical water bodies, and prioritizing the preservation of upland areas.
Recognizing the need for urgent and ambitious climate action based on public concern and scientific evidence, Davidson, NC saw the imperative to systemize and accelerate efforts. Therefore, this 2024 CAP represents the next step, unifying existing climate work under one strategic umbrella to transition the Town to a low-carbon, climateresilient community.
APPENDIX C: PROVISIONAL FORECASTS AND MITIGATION TARGETS
PROVISIONAL GHG REDUCTION TARGETS
Blue Strike Environmental recommends a GHG mitigation target, which are like those of nearby cities, as well as the state of North Carolina. These goals are outlined in the 2024 Town of Davidson Climate Action Plan. Davidson will reduce municipal emissions to net zero by 2037 and meet community carbon neutrality by 2050.
TABLE C.1: 2020 AND 2035 COMMUNITY WIDE GHG EMISSIONS TARGETS
TABLE C.2: MUNICIPAL GHG EMISSIONS TARGETS
GHG EMISSIONS FORECASTS
As annual emissions change over time because of external factors such as population and job growth, the reference of an emissions forecast that includes projected growth is needed to estimate the level of GHG reductions needed in a future year. Calculating the change between forecasted GHG emissions and the reduction target shows the gap to be closed through Town of Davidson Climate Action Plan goals.
APPENDIX C: PROVISIONAL FORECASTS AND
BUSINESS-AS-USUAL FORECAST
The Town of Davidson Community-wide Business-As-Usual forecast scenario shows an estimate of how GHG emissions would change between the years 2019 and 2050 if population trends, vehicle efficiencies, and energy usage continue as in 2019, without any new regulations that would reduce local emissions. As shown in Figure 2, under the 2019 Business-As-Usual forecast Town of Davidson’s GHG emissions were estimated to grow approximately 92.3 % from a baseline of 2019 GHG emissions levels by the year 2050 (from 99,170 MT CO2e to 190,711 MT CO2e). This forecast uses baseline annual population growth which is calculated to be approximately 3.7% per year according to the US Census Bureau between 2010 and 2020 and shows that the population almost doubled during that time frame. Discussion with the local planning department resulted in using a similar growth rate between 2024 and 2050.
FIGURE C.1: COMMUNITY-WIDE BUSINESS-AS-USUAL FORECAST
The Town of Davidson Municipal Operations Business-As-Usual forecast scenario adopts the same assumptions as the Community-wide Business-As-Usual forecasts. However, instead of relying on a population growth figure, it calculates a household growth rate of 2.8% per year using the 2020 and 2010 Census data. This approach is preferred because household growth more accurately mirrors government expansion, as recommended by the US Government Operations Protocol. Under the Business-As-Usual scenario, emissions are projected to increase from 1,033 MT CO2e in 2019 to 1,703 MT CO2e by 2037.
APPENDIX C: PROVISIONAL FORECASTS AND MITIGATION TARGETS
Operations Protocol Under the Business-As-Usual scenario, emissions are projected to increase from 1,033 MT CO2e in 2019 to 1,703 MT CO2e by 2037
FIGURE C.2: MUNICIPAL BUSINESS-AS-USUAL FORECAST
Figure C 2: Municipal Business-As-UsualForecast
MUNICIPAL BAU PROJECTED CO2e VALUES
ADJUSTED BUSINESS-AS-USUAL FORECAST
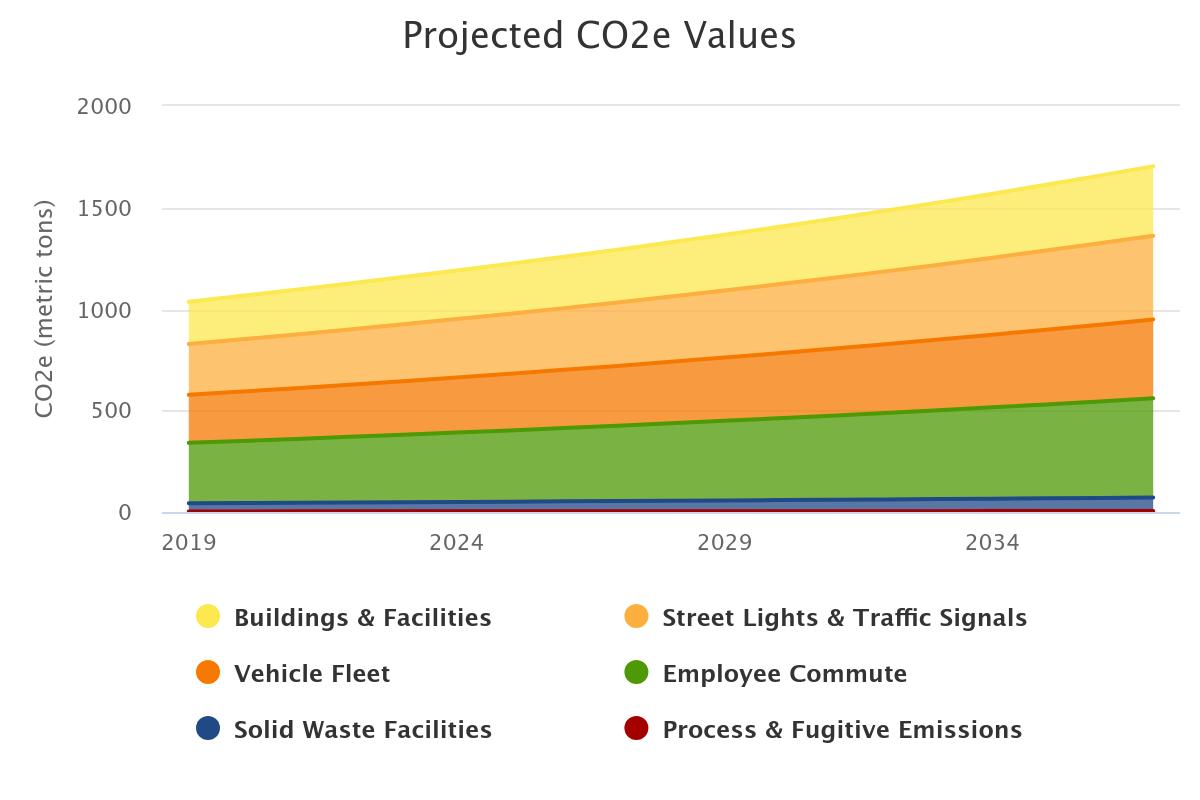
Adjusted Business-As-Usual Forecast
BUILDINGS & FACILITIES
STREET LIGHTS & TRAFFIC SIGNALS
VEHICLE FLEET
EMPLOYEE COMMUTE
SOLID WASTE FACILITIES
PROCESS & FUGITIVE EMISSIONS
There are several federal, state regulations and organizational commitments have been enacted that would reduce Town of Davidson’s GHG emissions by 2050. The influence of these regulations and commitments was quantified and included into the Adjusted Business-As-Usual forecast to provide an accurate picture of future emissions growth to 2050 as well as the response that the Town will need to have to reduce GHG emissions. As shown in the figure below, these state regulations will reduce Town of Davidson’s Business-As-Usual GHG emissions by approximately to 57,526 MT CO2e by 2050, a reduction of 41%.
There are several federal, state regulations and organizational commitments have been enacted that would reduce Town of Davidson’s GHG emissions by 2050 The influence of these regulations and commitments was quantified and included into the Adjusted Business-As-Usual forecast to provide an accurate picture of future emissions growth to 2050 as well as the response that the Town will need to have to reduce GHG emissions. As shown in the figure below, these state regulations will reduce Town of Davidson’s Business-As-Usual GHG emissions by approximately to 57,526 MT CO2e by 2050, a reduction of 41%
The Corporate Average Fuel Economy (CAFE) standards also impact Town of Davidson emissions which reduce the amount of carbon emitted by transportation and vehicle miles traveled. According to U.S. Community Protocol and ICLEI ClearPath29 the increasing CAFE standards will reduce emissions by 1.8% per year, although even with the evolving standards, the population growth will increase transportation emissions by 11% MT CO2e by 2050 in the adjusted Business-As-Usual scenario.
The Corporate Average Fuel Economy (CAFE) standards also impact Town of Davidson emissions which reduce the amount of carbon emitted by transportation and vehicle miles traveled Town of Davidson DRAFT 2 Climate Action Plan (ver 03/XX/24) 99
The Town of Davidson has electricity serviced by Duke Energy and Energy United. These companies have pledged to become carbon neutral by the year 2050 as meeting statewide mandates. Dominion Energy is the Town’s natural gas provider and has also pledged to follow state mandates of decarbonization by 205030. This forecast also includes the assumed growth factors from the Business-As-Usual scenario.
29 More information can be found at https://icleiusa.org
30 Dominion Energy, INC. Dominion Energy’s Net Zero Commitment.
APPENDIX C: PROVISIONAL FORECASTS AND MITIGATION TARGETS
FIGURE C.3: COMMUNITY ADJUSTED BUSINESS-AS-USUAL FORECAST
COMMUNITY ABAU PROJECTED CO2e VALUES CO2 e (METRIC TONS)
TRANSPORTATION & MOBILE SOURCES
PROCESS & FUGITIVE EMISSIONS
SOLID WASTE
WATER & WASTEWATER
RESIDENTIAL ENERGY
COMMERCIAL ENERGY
An Adjusted Business-As-Usual scenario was also developed for municipal operations. This scenario incorporates all assumptions from the community's Adjusted BusinessAs-Usual scenario concerning VMT standards and utility-wide grid shifts, along with growth rates from the Business-As-Usual scenario. According to this forecast, emissions are expected to decrease from 1,033 MT CO2e in 2019 to 729 MT CO2e by 2037.
FIGURE C.4: MUNICIPAL ADJUSTED BUSINESS-AS-USUAL FORECAST
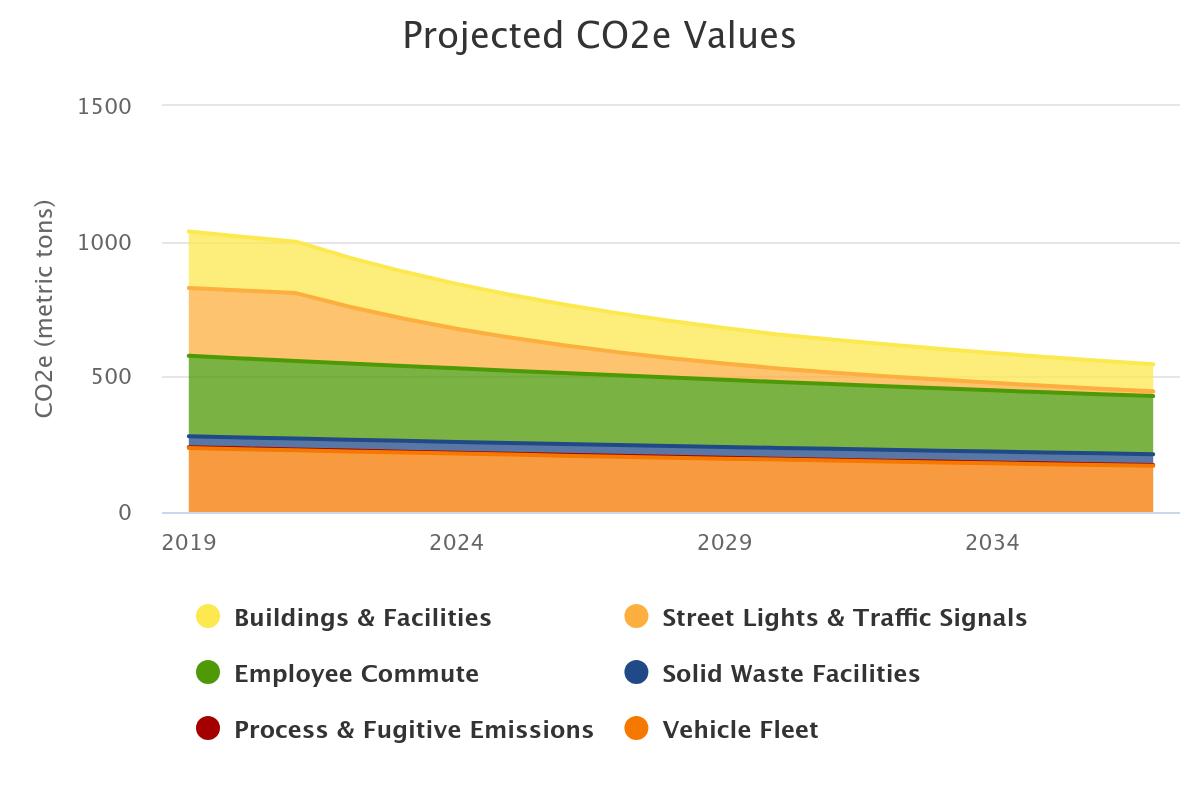
BUILDINGS & FACILITIES
STREET LIGHTS & TRAFFIC SIGNALS
EMPLOYEE COMMUTE
SOLID WASTE FACILITIES
PROCESS & FUGITIVE EMISSIONS
VEHICLE FLEET
Figure C 4: Municipal Adjusted Business-As-Usual Forecast
APPENDIX C: PROVISIONAL FORECASTS AND MITIGATION TARGETS
CAP EMISSION REDUCTION STRATEGIES
To meet the targets set in the 2024 Climate Action Plan, Blue Strike modeled the top emission reduction targets. The table below shows the annual emission reductions for each individual strategy, as calculated, and modeled in ICLEI ClearPath using the U.S Community Protocol.
TABLE C.3: EMISSION REDUCTIONS STRATEGIES FROM 2024 CLIMATE ACTION PLAN
Transition to 100% renewable energy by 2050 1,116 MT CO2e
Promote Community-wide Alternative Vehicle Awareness and Adoption 46,372 MT CO2e31
Create a Walkable, Bikeable and Transit-Friendly Town 4,860 MT CO2e32
Encourage Alternate Commuting Practices in the Community 8,351 MT CO2e33
Promote and Facilitate Commercial & Residential Renewable Energy Adoption 3,932 MT CO234
Encourage energy efficiency of residential homes 8,505 MT CO2e35
Improve energy efficiency in low-income households 1,323 MT CO2e36
Reduce Consumption & Solid Waste 5,829 MT CO2e37
Promote Reduction in Water Usage and Wastewater Management 778 MT CO2e38
The emission reductions leading to 2050 are shown in Figure C.5. According to projections, the Town should be able to achieve its community-wide goals, if the 2024 Climate Action Plan strategies (listed in table 2) are enacted, and policies from the Adjusted Business-As-Usual scenario are achieved. By 2050 the Town would be emitting 2,581 MT CO2 per year; these remaining emissions are due to water and wastewater treatment as well as solid waste emissions.
31 This number was drawn from using U.S. Community protocol Appendix D: Transportation and Other Mobile Emission Activities and Sources and https://evadoption.com/ev-sales/ev-sales-forecasts to reduce transportation emissions
32 Assuming 10% of household renovated by 2030
33 Best case scenario
34 Average size of a system is 4kWh, with a goal of getting 10% of housing solarized by 2030. Cumulative reductions until 2030 using US Community protocol for reduction of mmbtu per kwh solar added.
35 Promote energy efficiency by having a 100% electrified community by 2050
36 100 homes weatherized per year
37 175 tons reduced per year
38 100% renewable energy by 2050
C.5: COMMUNITY-WIDE EMISSIONS REDUCTION SCENARIO
COMMUNITY PROJECTED CO2e VALUES WITH REDUCTIONS APPLIED
Prioritizing Carbon Reduction
ORIGINAL FORECAST
COMMERCIAL ENERGY
RESIDENTIAL ENERGY
WATER & WASTEWATER
SOLID WASTE
PROCESS & FUGITIVE EMISSIONS
TRANSPORTATION & MOBILE SOURCES
In an effort to align with the targets outlined in the 2024 Climate Action Plan, Blue Strike conducted modeling of the top emission reduction strategies for the municipal operations. Table C.4 presents the yearly emission reductions for each strategy, as determined and modeled through ICLEI ClearPath, in accordance with the U.S. Government Operations Protocol.
Davidson is committed to maximizing direct emissions reductions within both municipal and community-wide emissions profiles in order to achieve the carbon neutrality goals set forth herein. However, especially over the near to mid-term the Town acknowledges that while investment in some emissions reductions may begin right away, full implementation of some elements may occur over several years, delaying realized emissions reductions to future years Despite efforts to minimize use, some energy-intensive applications may still require non-renewable energy sources, at least in the near term. To the degree that the Town is unable to fully achieve its 2037 and 2050 targets through emissions reductions alone, the remaining portion of emissions may need to be offset through the purchase of carbon offsets or Renewable Energy Credits (REC) Davidson is committed to prioritizing emissions reductions and will take action to adopt safeguards that set limits and parameters on the use of offsets and REC utilization to ensure appropriately aggressive actions and investments in infrastructure and emissions reducing strategies to remain on track toward mid and long term goals
TABLE C.4: MUNICIPAL EMISSION REDUCTIONS FROM EACH STRATEGY
Strategy M1.1: Convert 100% of the Town fleet to EVs, hybrids or use clean fuels by 2037 894 MT CO2e
Reduce emissions from Employee Commuting by 30% by 2037
Reduce Municipal Building Energy Use by 75% by 2037
Obtain 80% of Municipal Energy from Renewable Energy Sources by 2037
Decrease Energy Usage in Street Lighting by 50% by 2037
Reduce Waste to Landfill by 75% by 2037 in Municipal Operations
MT CO2e
MT CO2e
This CAP prioritizes solutions that result in carbon reduction rather than carbon offsets. This decision was made for three reasons First, the spirit in which the commitment was made sought to challenge the community to develop its own solutions, rather than simply pay for offsets produced by others. Second, there is significant difficulty in determining the additionality of carbon offsets. Additionality is the concept of whether purchased carbon offsets actually resulted in carbon emissions reductions that would not have happened without the investment used to purchase the offsets Third, there are important local benefits in the form of air quality
FIGURE
scenario are achieved By 2050 the Town’s municipal operations would be emitting 190 MT CO2e per year; these remaining emissions are due to emissions from employee commuting, and minimal elsewhere
The emission reductions leading to 2037 are shown in Figure C.6. According to these projections and accounting for assumptions presented in the Adjusted BusinessAs-Usual scenario, The Town of Davidson will achieve 81.7% of targeted emissions reductions necessary to reach carbon neutrality by 2037 by enacting the 2024 Climate Action Plan strategies (listed in Table C.4). By 2037 the Town’s municipal operations would be emitting a remaining 190 MT CO2e per year; these remaining emissions are due to emissions from employee commuting, and minimal elsewhere. To the degree that the Town is unable to fully achieve its 2037 and 2050 targets through emissions reductions alone, the Town will need to consider additional strategies to achieve their goals.
C.6: MUNICIPAL EMISSIONS REDUCTION SCENARIO
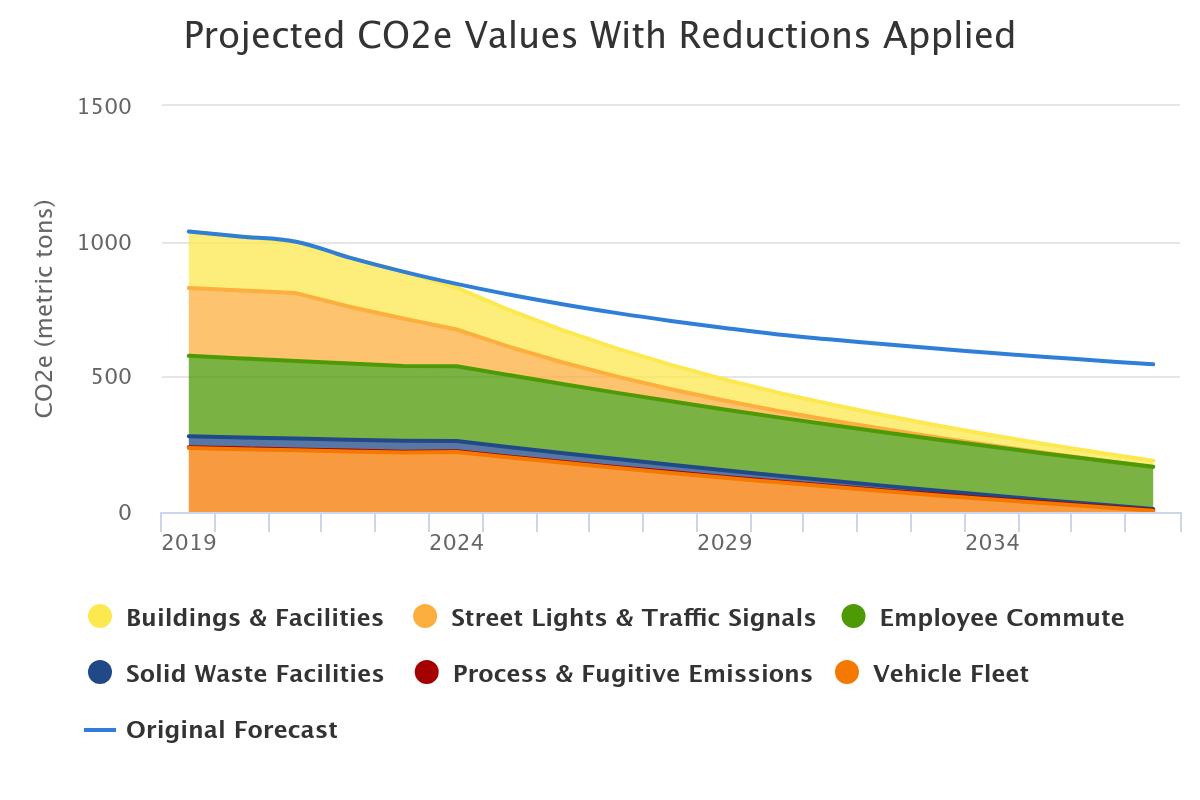
Meeting the Targets
e VALUES WITH REDUCTIONS APPLIED
ORIGINAL FORECAST
BUILDINGS & FACILITIES
STREET LIGHTS & TRAFFIC SIGNALS
EMPLOYEE COMMUTE
SOLID WASTE FACILITIES
PROCESS & FUGITIVE EMISSIONS
VEHICLE FLEET
Achieving emission reductions as substantial as those outlined in the 2024 Climate Action Plan may not be easy, but carbon neutrality is a worthwhile endeavor for the community. Enacting the measures from the 2024 Plan will be essential to success, though it is acknowledged that adjustments may need to be made. Currently listed strategies can be periodically revisited by the Town and community for any necessary changes in the Plan. Further, the Plan leaves a small number of community-wide emissions in 2050 from water, wastewater, and solid waste. These emissions: a total of 2,581 MT CO2e (representing 2.6% of total emissions) will need to be offset to reach carbon neutrality in 2050 unless there are changes in policy, utility goals, or technology that drive emissions reductions further than projected. Current projections show the Town will need to consider additional strategies to reach carbon neutrality as the year 2050 approaches. Continual review of the Climate Action Plan, monitoring progress, and periodic updates of projections will be crucial for the Town to understand where it stands in relation to its goals.
Achieving emission reductions as substantial as those outlined in the 2024 Climate Action Plan may not be easy, but carbon neutrality is a worthwhile endeavor for the community. Enacting the measures from the 2024 Plan will be essential to success, though it is acknowledged that adjustments may need to be made. Currently listed strategies can be periodically revisited by the Town and community for any necessary changes in the Plan. Further, the Plan leaves a small number of community-wide emissions in 2050 from water, wastewater, and solid waste. These emissions: a total of 2,581 MT CO2e need to be offset to reach carbon neutrality in 2050. As stated in the 2024 CAP the Town is willing to temporarily use Renewable Energy Credits (REC’s) and Offsets to meet their goals By combining credits with the strategies contained in the Plan the Town looks forward to achieving its goals, in pursuit of net zero emissions by 2050
FIGURE
Figure C.6: Municipal Emissions Reduction Scenario