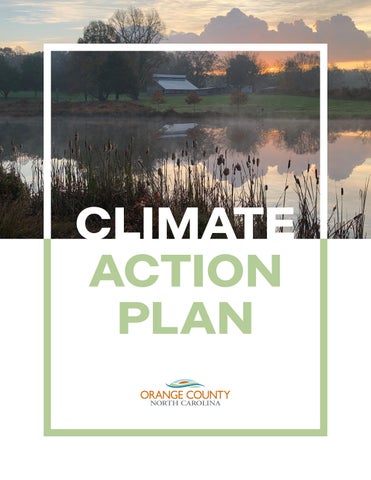

CLIMATE ACTION PLAN


VISION
Together, with our community, we commit to taking urgent action on the climate emergency by creating and implementing an innovative, equitable, and just transition to carbon neutrality and climate resiliency.

MISSION
Our battle against climate change is a moral imperative, an environmental emergency, and an economic opportunity. Orange County is determined to rise to the occasion with a Climate Action Plan that will lead the way toward a low carbon, green-energy, and equitable future that improves community health and well-being, protects our precious natural resources, and creates sustainable economic growth for all Orange County residents.
ACKNOWLEDGEMENTS
ORANGE COUNTY LEADERSHIP:
Board of County Commissioners:
Jamezetta Bedford, Chair
Earl McKee, Vice-Chair
Amy Fowler
Sally Greene
Jean Hamilton
Phyllis Portie-Ascott
Anna Richards
County Manager:
Bonnie Hammersley
County Deputy Manager: Travis Myren
ORANGE COUNTY CLIMATE ACTION TEAM:
Amy Eckberg
Robert Williams
Nancy Coston
Libbie Hough
Quintana Stewart
Cy Stober
Gary Donaldson
Kirk Vaughn
Kelly Guadalupe
Kirby Saunders
Sarah Pickhardt
Hannah Tuckman
Steve Brantley
David Stancil
Jonathon Smith
Mike Ortosky
Steven Arndt
Travis Myren
Patrick Florence
Courtney McLaughlin
Kristin Prelipp
Nishith Trivedi
MANY THANKS to all of the Orange County business, farm, nonprofit, social justice, and educational community groups and partners who attended our focus group sessions, to the community at large for filling out our climate action plan survey, and to all those individuals who provided data requests and took the time for phone calls to lend us your insights, expertise, and support for the development of the climate action plan.

ACKNOWLEDGEMENTS
COMMISSION FOR THE ENVIRONMENT ADVISORY BOARD:
Veronica Penn Beattie, Chair
Jessie Birckhead, Vice-Chair
Ian Morse
Kristie Mather
Regina Baratta
Andrea Zimmerman
Kim Pirraci
Kim Livingston
Jane Harris
Reade Oakley
Mark Randall
Wilson Greene
COMMISSION FOR THE ENVIRONMENT STAFF
REPRESENTATIVES:
Christian Hirni
Wesley Poole
Kalani Allen
Amy Eckberg
UNC CHAPEL HILL ECOSTUDIO INTERNS:
Max Feldman
Bladen Currier
Angie Delgado
Chloe Sherer
ORGANIZATIONS:
Duke Energy
Dominion Energy
North Carolina Piedmont
Electric Cooperative
OWASA
Town of Chapel Hill
Town of Carrboro
Town of Hillsborough
UNC-Chapel Hill
UNC Institute for the Environment
The Sierra Club
El Centro Hispano
Rogers Road Community Center
Efland Cheeks Community Center
Cedar Grove Community Center
Duke Nicholas School for the Environment
Eno River Association
EVS for Orange
Triangle Land Conservancy
Red Eye
Garland Truffles
Orange Community Housing and Land Trust
Audubon Society
Orange County Staff
Soil & Water Conservation District
NC Cooperative Extension
Duke University
Climate Action Coalition of Orange Co.
Orange County Business Owner Advisory Team
Clarion Associates
Yep Roc Records
Chapel Hill-Carrboro Chamber of Commerce
Hillsborough/Orange County Chamber of Commerce
CONSULTANT TEAM
PHOTO CREDITS
Images provided by Orange County, NC, and stock image sites.
Cover Image:
Sunrise at Blackwood Farm Park by Jennifer Gallina.
November 2, 2023


Orange County Board of Commissioners
Post Office Box 8181
300 West Tryon Street
Hillsborough, North Carolina 27278
November 2, 2023
It is our honor to present the Orange County Climate Action Plan (CAP). This plan was built in partnership with the community and serves as a roadmap for our County operations and community to reduce greenhouse gas emissions and build resilience to the impacts of climate change. As the Board of County Commissioners of Orange County, we are committed to protecting our community. We recognize that climate change poses a real and urgent threat to our public health, safety, local economy, natural environments and overall quality of life which is why we must build upon the actions we have already taken to address climate change with new strategies and urgency.
Orange County has made remarkable progress in addressing climate change and promoting sustainability. Through our active participation in regional resilience assessments, our innovative Community Climate Action Grant Program, our Lands Legacy program, EV vehicle and charger implementation, and participation in the multi-jurisdictional Solarize the Triangle campaigns, we have demonstrated our commitment to reducing emissions, promoting resilience, and fostering environmental stewardship. These accomplishments highlight our intent to work together through regional collaborations, alongside our local jurisdictions, and through community based publicprivate partnerships to create a sustainable future.
Jamezetta Bedford Chair
Throughout the planning process of the CAP, we actively engaged with members of the community from various sectors, seeking their expertise and incorporating their valuable input into our strategies. The Orange County community has come together to shape its vision for the future. While the county government can take the lead on certain initiatives, the success of many endeavors relies on the actions taken by individual residents. It is only through the collaborative efforts of both government and residents that we can accomplish the objectives outlined in this CAP. Orange County has shown its capacity to achieve the collective aspirations of our community. Each of us has a role to play in building a vibrant, environmentally sustainable community that promotes well-being for all.
It is our honor to present the Orange County Climate Action Plan (CAP). This plan was built in partnership with the community and serves as a roadmap for our County operations and community to reduce greenhouse gas emissions and build resilience to the impacts of climate change. As the Board of County Commissioners of Orange County, we are committed to protecting our community. We recognize that climate change poses a real and urgent threat to our public health, safety, local economy, natural environments and overall quality of life which is why we must build upon the actions we have already taken to address climate change with new strategies and urgency.
Orange County Board of Commissioners Post Office Box 8181
300 West Tryon Street Hillsborough, North Carolina 27278
November 2, 2023
We extend our gratitude to all those who have contributed to the development of this plan and express our unwavering commitment to its implementation. Together, let us create a brighter future - one that prioritizes the well-being, prosperity of our community, and the preservation of the beautiful natural resources that all help make Orange County a great place to live.
LETTER
Orange County has made remarkable progress in addressing climate change and promoting sustainability. Through our active participation in regional resilience assessments, our innovative Community Climate Action Grant Program, our Lands Legacy program, EV vehicle and charger implementation, and participation in the multi-jurisdictional Solarize the Triangle campaigns, we have demonstrated our commitment to reducing emissions, promoting resilience, and fostering environmental stewardship. These accomplishments highlight our intent to work together through regional collaborations, alongside our local jurisdictions, and through community based public private partnerships to create a sustainable future.
It is our honor to present the Orange County Climate Action Plan (CAP). This plan was built partnership with the community and serves as a roadmap for our County operations community to reduce greenhouse gas emissions and build resilience to the impa cts of climate change. As the Board of County Commissioners of Orange County, we are committed protecting our community. We recognize that climate change poses a real and urgent threat public health, safety, local economy, natural environments and overall quality of life which why we must build upon the actions we have already taken to address climate change with strategies and urgency.
Orange County has made remarkable progress in addressing climate change and promoting sustainability. Through our active participation in regional resilience assessments, our innovative Community Climate Action Grant Program, our Lands Legacy program, EV vehicle and charger implementation, and participation in the multi-jurisdictional Solarize the Triangle campaigns, have demonstrated our commitment to reducing emissions, promoting resilience, and fostering environmental stewardship. These accomplishments highlight our intent to work together through regional collaborations, alongside our local jurisdictions, and through community based public private partnerships to create a sustainable future.
Throughout the planning process of the CAP, we actively engaged with members of the community from various sectors, seeking their expertise and incorporating their valuable input into our strategies. The Orange County community has come together to shape its vision for the future. While the county government can take the lead on certain initiatives, the success of many endeavors relies on the actions taken by individual residents. It is only through the collaborative efforts of both government and residents that we can accomplish the objectives outlined in this CAP. Orange County has shown its capacity to achieve the collective aspirations of our community. Each of us has a role to play in building a vibrant, environmentally sustainable community that promotes well-being for all.
Throughout the planning process of the CAP, we actively engaged with members community from various sectors, seeking their expertise and incorporating their valuable into our strategies. The Orange County community has come together to shape its vision for future. While the county government can take the lead on certain initiatives, the success of endeavors relies on the actions taken by individual residents. It is only through the collaborative efforts of both government and residents that we can accomplish the objectives outlined CAP. Orange County has shown its capacity to achieve the collective aspirations of community. Each of us has a role to play in building a vibrant, environmentally sustainable community that promotes well-being for all.
We extend our gratitude to all those who have contributed to the development of this plan express our unwavering commitment to its implementation. Together, let us create a brighter future - one that prioritizes the well-being, prosperity of our community, and the preservation the beautiful natural resources that all help make Orange County a great place to live.
We extend our gratitude to all those who have contributed to the development of this plan and express our unwavering commitment to its implementation. Together, let us create a brighter future - one that prioritizes the well-being, prosperity of our community, and the preservation of the beautiful natural resources that all help make Orange County a great place to live.

Jamezetta Bedford, Chair Board of Orange County Commissioners
Jamezetta Bedford, Chair, Board of Orange County Commissioners
Jamezetta Bedford, Chair Board of Orange County Commissioners
EXECUTIVE SUMMARY
CALL TO ACTION
Climate change is a pressing global challenge that requires collective action and sustainable solutions to safeguard our planet's future. Greenhouse gases (GHG) emitted from the cars we drive, the energy we consume, the way we develop the built environment, and the products we buy are having a harmful effect on our environment and are increasing temperatures to dangerous levels which will threaten our way of life, our food systems, and our safety.
The next few years are critical in limiting global temperature to a 1.5°C increase and mitigating the most severe impacts of climate change. To do so, global emissions need to be halved by 2030, and net zero emissions must be achieved before 2050. According to the most recent report from the Intergovernmental Panel on Climate Change (IPCC), the Earth has warmed 1.09°C since 1850 and many changes such as sea-level rise and glacier and arctic ice melt are now irreversible. Without substantial action at all levels, global temperature rise is likely to reach 1.5°C by the mid-2040s which will further stress our environmental systems and, at a local level, will result in more frequent and intense heat waves, floods, drought, wildfire, and air pollution. As a member of the global community, we are rushing to find ways to mitigate the worst of what is to come while seeking ways to thrive despite the disruptions to our lives and well-being.
EXECUTIVE SUMMARY
Orange County is already facing periods of severe drought, intense storms, heat waves, and poor air quality with increasing frequency. While some responses will need to be coordinated regionally, it is important for Orange County to take swift and effective action locally to maintain our quality of life.
In 2022, North Carolina’s Governor, Roy Cooper, issued Executive Order (EO) No. 246 committing North Carolina to a clean energy economy and directing next steps in the state’s plan to achieve net-zero GHG emissions and create new economic opportunities for North Carolinians across the state. The EO strengthens North Carolina’s commitment to reducing GHG emissions, increasing the statewide goal to a 50% reduction from 2005 levels by 2030 and achieving net-zero GHG emissions no later than 2050. Because the transportation industry makes up a majority of the state’s emissions, EO 246 specifies a target of 1.25 million zero-emission vehicles registered at the state level and 50% of all new cars sold as electric by 2030. In line with a climate focus, the state is creating a diverse workforce to help build out climate change infrastructure and ensure underserved communities are engaged in the process. This follows a historical trend of previous commitments which have positioned North Carolina as a leader in climate.
Orange County will comply with the state and adopt similar climate goals. On June 6, 2017, the Board of Orange County Commissioners passed a resolution to proportionally uphold the Paris Climate Agreement to reduce GHG emissions between 26 and 28 percent by 2025 from 2005 levels. By 2019, the County had reduced 40% of its emissions. On September 5, 2017, the Board of Orange County Commissioners adopted a resolution to transition to a 100% renewable energy based economy by 2050. By 2019, the County had achieved a 13% renewable energy portfolio. The County also signed the Global Covenant of Mayors in 2018 which is the largest global alliance for city climate leadership. These three commitments have played a foundational role in propelling Orange County to write this inaugural Climate Action Plan (CAP).
The CAP is more than a testament to Orange County's commitment to climate action. It signifies an intentional move to align with wider regional planning processes. In this vein, the CAP echoes the goals and strategies of regional initiatives. This harmonized approach intends not only to create synergies with neighboring localities but also to contribute to a unified regional response to climate change. Details on specific partnerships can be found in the Introduction Section.
EXECUTIVE
EQUITY
Orange County Comprehensive Parks and Recreation Master Plan
Recommendation 6 – Build More Trails and Connect Open Spaces:
The impacts of climate change cannot be separated from the broader social, economic, and political systems that shape our world. Equity refers to fairness and justice in the distribution of resources, opportunities, and benefits. Orange County is committed to integrating an equity lens into all aspects of our climate action efforts, from decision-making to community engagement to the allocation of resources.
CHAPTER 1 - Summary of the Plan
Master Plan Park Inventory / Assessment / Existing Park
Efland
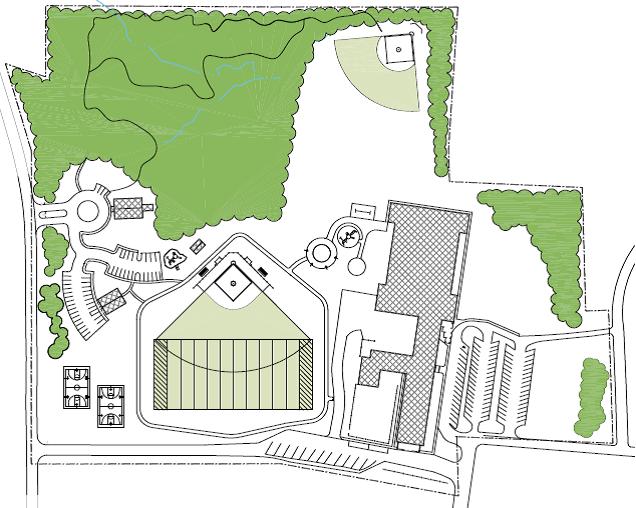
One of the clear messages of the Community Needs Assessment surveys is that county residents want to get out into nature and walk, hike and bike more. There are several mechanisms in place that will help with this, by virtue of building the planned future parks (see Recommendation 2). Determining a solution to the MST segment in Orange County, and providing trails at nature preserves are additional measures that are planned/proposed. Additionally, there may be ways to connect trail systems that exist in Duke Forest and Eno River State Park to town and county parks and trails. The local governments that would mutually benefit from a connected trail system should look at joint funding mechanisms.
Recommendation 8 – Look to Add Programs in Areas Where Residents Have Identified needs, Consider Partnerships:
On September 2, 2010, the Board of Orange County Commissioners unanimously adopted the social justice goals outlined in the Orange County Social Justice Goals resolution. Climate change impacts individuals differently based on their socio-economic status, race, geographic location, and a host of other factors. Therefore, it is with intention that all the strategies within this CAP have been developed using the equitable lens found in the following resolution.
& Recreation Master Plan
SOCIAL JUSTICE GOALS RESOLUTION
Recommendation 7 Improve Access to Parks and Trails, and incorporate Healthy Lifestyles Design:


GOAL: FOSTER A COMMUNITY CULTURE THAT REJECTS OPPRESSION AND INEQUITY


Flexibility and responsiveness is critical to providing public recreation programs. Needs and interests change over time, and systems must be prepared to change with the times. While it is not practical to provide every program that is desired by members of the community, the Community Needs Assessments provide a look at current needs and desires. Follow-up surveys could be conducted to determine the depth of interest in new program areas, and at the same time, existing programs should be evaluated to see if resource allocation should be altered. The County has partnered in recent years with private non-profit recreation providers for certain programs. A “partnership template” being developed will help determine whether a partnership is desirable or warranted, and opportunities with the school systems in this area may be fruitful.
Orange County, North Carolina
B. Current Municipal Parks and Recreation Master Plans
Carrboro Recreation and Parks Comprehensive Master Plan (2006)
Financing and Capital Investments
The fair treatment and meaningful involvement of all people regardless of race or color; religious or philosophical beliefs; sex, gender or sexual orientation; national origin or ethnic background; age; military service; disability; and familial, residential or economic status.
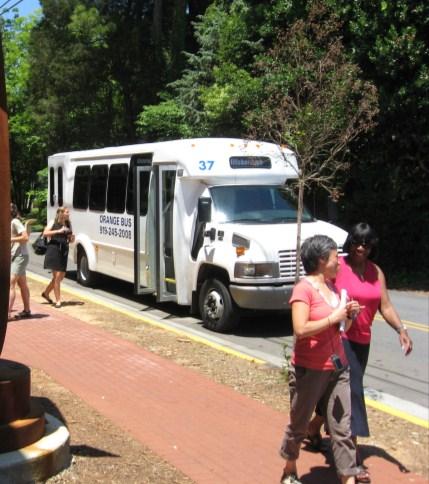
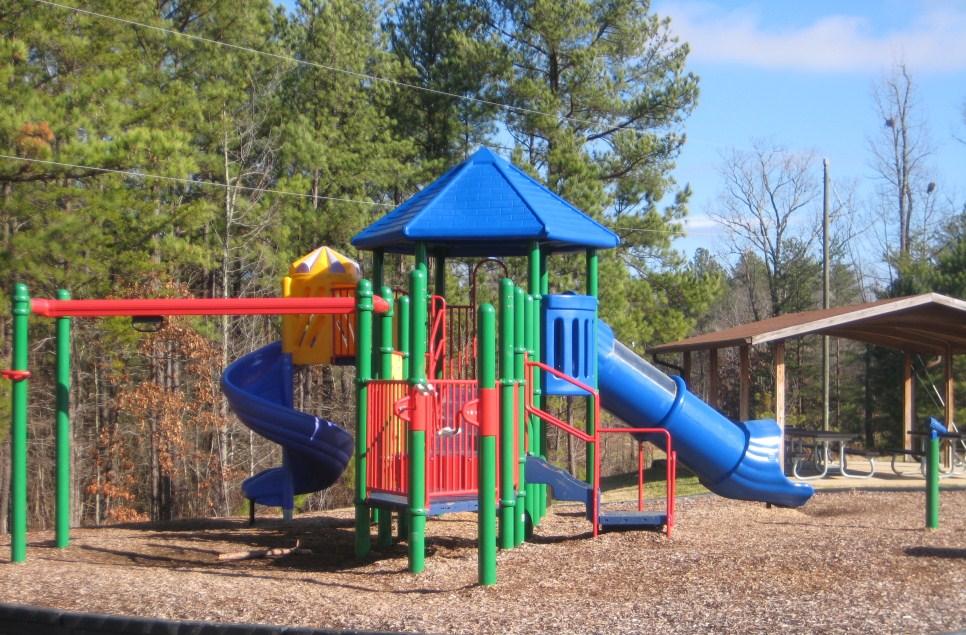
Over the last 15 years, most parks have been constructed with an eye to providing access to the public, and activities for individuals to develop and maintain healthy lifestyles. However, an emerging issue in the fields of public health and parks planning is the integration of these concepts at the design level – parks designed with an eye to maximize opportunities for enhancing public health. Likewise, the potential for public transportation access to County parks is a consideration, but in a rural county with a need to provide service to different portions of the county, this type of access is problematic. Working park-and-ride lots into future parks, and looking at parks as possible transit stops are two mechanisms that warrant closer examination and should be part of future planning for new parks.

GOAL: ENSURE ECONOMIC SELF-SUFFICIENCY
The creation and preservation of infrastructure, policies, programs and funding necessary for residents to provide shelter, food, clothing, and medical care for themselves and their dependents.
GOAL: CREATE A SAFE COMMUNITY
The reduction of risks from vehicle/ traffic accidents, childhood and senior injuries, gang activity, substance abuse and domestic violence.
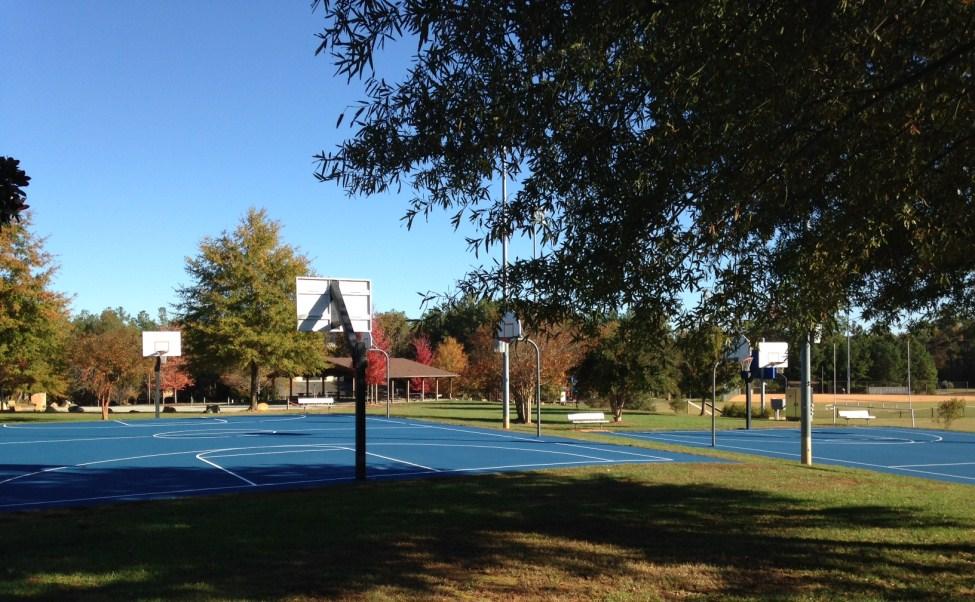

Carrboro’s Recreation and Parks Comprehensive Master Plan emphasizes partnering with Chapel Hill and Orange County to help meet the needs of its residents. Homestead Pool, Southern Community Park, and the planned Twin Creek Park are examples of facilities Carrboro residents are likely to use.
Carrboro plans to acquire land to construct additional greenway trail and bikeway facilities, focusing on the Bolin Creek and Morgan Creek corridors for connecting with existing greenway segments in Chapel Hill. Carrboro also aims to link its planned trail system to a broader network of greenway trails in the Triangle region. The Town of Carrboro (in 2014) has approximately 112 acres of parks and recreation facilities and approximately three miles of bike paths and greenways.

As shown in Table 10- Orange County has positioned itself through careful and proactive planning to know what park and recreation facilities are needed, and through its Capital Investment Plan (CIP), a possible sequence of construction to fulfill the master plan outlined within these pages may be glimpsed. The funding needed for parks and recreation opportunities includes: new construction of planned parks, future phases of existing parks, replacement and repair of aging facilities, and operating and maintenance funding. Approximately $10 million in park and public open space funding is identified in the current CIP through 2018, and an additional $36 million is expected to be needed beyond 2018 to complete the vision of the park system outlined in this plan. An additional $467,000 within two years, and $923,000 in two to five years, is projected to be needed for renovations and improvements or repairs. As future financial planning is undertaken, the manner in which these needs may be funded will become more clear, as will the potential sources (including several potential grant projects).
GOAL: ESTABLISH SUSTAINABLE AND EQUITABLE LAND-USE AND ENVIRONMENTAL POLICIES

The fair treatment and meaningful involvement of people of all races, cultures, incomes and educational levels with respect to the development and enforcement of environmental laws, regulations, policies, and decisions. Fair treatment means that no group of people should bear a disproportionate share of the negative environmental consequences resulting from industrial, governmental and commercial operations or policies.

Hillsborough’s Parks and Recreation Board updated the town’s Parks and Recreation Master Plan in 2006. The plan included a revised inventory of existing and proposed resources, an updated needs assessment, and recommendations for the planning of recreation facilities and resources. The master plan was updated again in 2009, taking into account additional recreational resources created since 2007, revised park districts, updated demographic information, and progress made with local and regional partnerships. The Parks and Recreation Board strives to revisit the master plan annually to make updates and recommendations to the staff and board of commissioners.
GOAL: ENABLE FULL CIVIC PARTICIPATION
The Town of Hillsborough owns over 65 acres of community and neighborhood parks, (including 20 acre Gold Park), and has over 15 additional acres of parks proposed. Another four miles of greenway trails are planned. The volunteer Parks and Recreation Board makes decisions concerning its townowned parks. Hillsborough does not have a parks and recreation department; the Planning and Public Works departments work together to maintain the town’s parks and recreation facilities.
Ensure that Orange County residents are able to engage government through voting and volunteering by eliminating disparities in participation and barriers to participation.
EXECUTIVE SUMMARY
PURPOSE
Orange County’s 2023 CAP is meant to serve as a guiding document towards GHG reductions, both in County operations and community-wide. It is designed as a comprehensive strategy to reduce emissions in a manner consistent with state guidelines and regulations, and to identify costeffective opportunities to existing and future residents, businesses, and development projects for a more sustainable community. At the same time, the CAP provides a framework for environmental leadership and serves as an educational resource to the community.
The CAP is intentionally a living document that can be revised as needed with clear and transparent metrics by which progress can be both assessed and measured. Although the County will be flexible, it will remain steadfast to the objectives ahead. There are 70 strategies with 187 associated actions outlined within the CAP. Certain commitments within the CAP have risen to the top as the most impactful climate action targets for both community and County operations that should be prioritized above the rest. They are listed as the “Top 10 Things the County Should Do''.
TOP 10 THINGS THE COUNTY SHOULD DO
1.
Expand County funding to include climate expenditures and additional full time sustainability and grant administrator staff
2. Integrate sustainability as a framework within the overall County's planning process
3.
Identify and prioritize actions targeted to vulnerable populations within the County
4. Be prepared for climate emergencies
Strategies 1-4 are not specific to GHG emission reduction. Instead, these strategies serve as a qualitative framework that will become the guiding principles of the County’s planning process.
The #1 priority for the County is to expand funding to support this CAP. Funding will not only emerge from internal department budgets, but the expansion of funding will rely heavily on current and future grant opportunities. #2 All planning decisions will weigh environmental impacts along with the social and economic impacts. This consideration will become a formal way to conduct business. #3 The County will maintain course to provide equitable solutions for underserved communities within the County and #4 Ensure that the County is prepared for climate emergencies. It should also be mentioned that ensuring future development is concentrated near existing services and other buildings is critical to reducing GHG emissions. This will lessen the amount of VMT and create greater conservation of connected forest and green space.
EXECUTIVE SUMMARY
TOP 10 THINGS THE COUNTY SHOULD DO: FOUNDATIONAL REDUCTION STRATEGIES
TA R G ET
5.
Decrease vehicle miles traveled (VMT) 30% from a 2019 baseline by 2050 (T1, T2, T3)
BASELINE
Establish annual reduction of 1.3 million miles using US Community Protocol1
TA R G ET TA R G ET
6.
Increase community EV adoption to 50% by 2035 and 100% by 2050 (T4)
BASELINE
Currently 9% of all vehicles in Orange County are electric
TA R G ET
9.
Increase community-wide solar capacity to 33.66 MW by 2035: 25% above the 2023 baseline (BE 2.4, BE 2.5, BE 2.6)
BASELINE
Current solar capacity within Orange County is 26.93 MW4
7.
Achieve 50% emission reduction target of all Scope 1 and 2 emissions2 by 2030 and 100% by 2050 using a 2005 baseline (BE 1)
BASELINE
Scope 1 and 2 emissions have dropped by 40.7% between 2005 and 2019
TA R G ET
10.
Complete an electrification study and establish a long-term implementation plan (Phase 1 and Phase 2) by 2025 (BE 3)
TA R G ET
8.
Achieve 100% renewable electricity by 2050 in municipal operation and community-wide (BE 2.1, BE 2.2, BE 2.3)
BASELINE
Currently ~13% of all electricity is coming from renewable sources3
BASELINE
Natural gas usage is currently at 156,670 MT CO2e
1 Calculations were done using ICLEI ClearPath and US Community Protocol Appendix D: Transportation and other Mobile Other Mobile Emission Activities and Sources.
2 Scope 1: Carbon emissions resulting directly from fuel use; Scope 2: Carbon emissions associated with energy purchased by Orange County and generated elsewhere
3 https://www.duke-energy.com/Home/Products/Renewable-Advantage/Product-Content-Label?jur=NC01#:~:text=For%20 comparison%2C%20the%20current%20average,%5BDuke%20Energy%202021%20data%5D.
4 https://energync.org/maps/
PURPOSE CONTINUED
EXECUTIVE SUMMARY
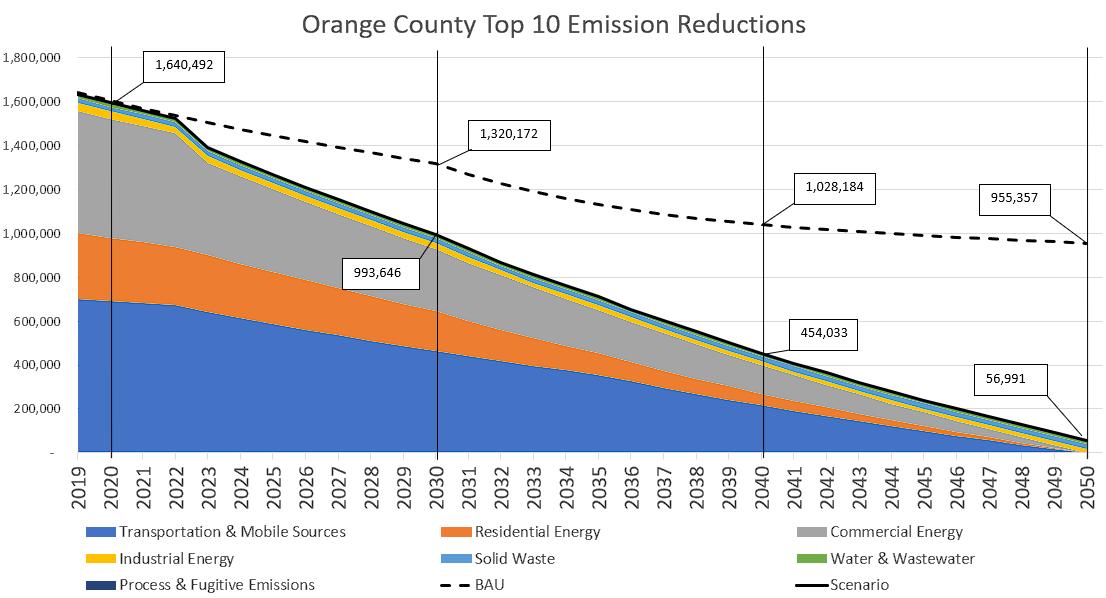
The project team analyzed the long term GHG emissions reduction potential of strategies 5-10 (foundational six) and adjusted the percentages (i.e. 50% reduction in GHG emissions by 2030) to ensure that the County could reach net zero by 2050 if they achieve these six targets. The subsequent coding in parenthesis refers to the goals and strategies identified which will help the County reach these targets. The County will consider carbon sequestration if any residual emissions remain in 2050. Please refer to Figure A.
The methodology starts from the amount of GHG produced annually if business is continued as usual and then adjusts for expected changes from other entities. Note that GHG emissions will decrease over time because of utility commitments and expected state level regulation, but not at a fast enough rate to reach net-zero by 2050, which is required to keep global warming to 1.5° C and prevent the worst effects of a warming planet. Our methodology involved running the County’s 2019 GHG emissions inventory through the Local Governments for Sustainability’s model, ICLEI ClearPath 5 , and then forecast those emissions out to 2050 using escalation factors for projected population growth, national transportation emission requirements, and the utility commitments towards net zero carbon emissions. The ICLEI Clearpath model bases the emission reductions on the unique usage data and emission factors specific to Orange County. The model has the capability of running different emission reduction scenarios based on the percentage of expected emissions reduced.
5 ClearPath is an online GHG inventory analysis tool developed and recommended by ICLEI– Local Governments for Sustainability. ClearPath provides community and government operations GHG inventory development and strategy forecasting, which was used for this project. More information can be found at https://icleiusa.org/clearpath/
EXECUTIVE SUMMARY
PURPOSE CONTINUED
Figure A depicts emissions reduced as a result of the foundational 6 strategies. Please see Appendix B for more information on the methodology.
vate stakeholders in and around Orange County.
continue to collaborate) with existing universities,
ORANGE COUNTY FOUNDATIONAL 6 EMISSION REDUCTIONS
CAP, Orange County worked (and will continue to collaborate) with existing universities,
s, small businesses, and public and private stakeholders in and around Orange County. creating the CAP, Orange County worked (and will continue to collaborate) with existing universities, organizations, small businesses, and public and private stakeholders in and around Orange County.
rs clearly map a qua of Orange County ’s CAP planning process Community of its plan, projects and policies In the process of
e the ones that experience the effects of its plan, projects and policies. In the process of
e solutions that the der Engageme engagement was a c
tors: Transportation and Resilient Comm
o the Top 10, goals,
taining course to pr
Finally, all planning lutions and to be pr ons are further dev nt and Energy, Reso
s of environmental
200,000 1,000,000
hould be allocated t staffing needs that m
duction. Instead, th
10 are not specific t for consideration E ttention should be isions should contin pacts that these pr
st of top 10 for 100
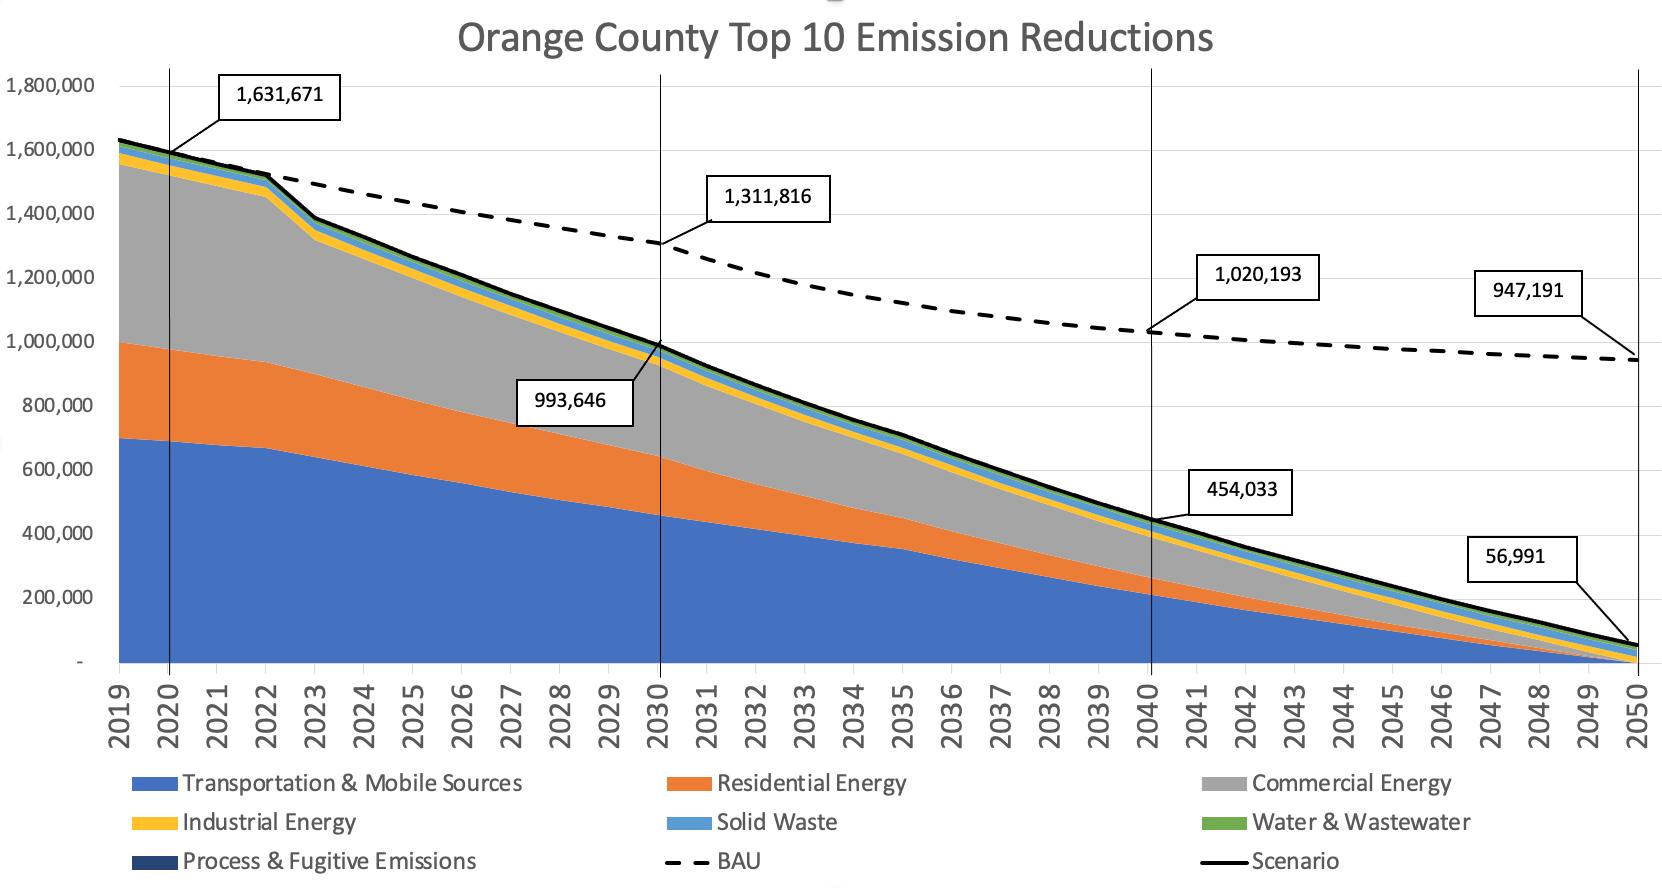
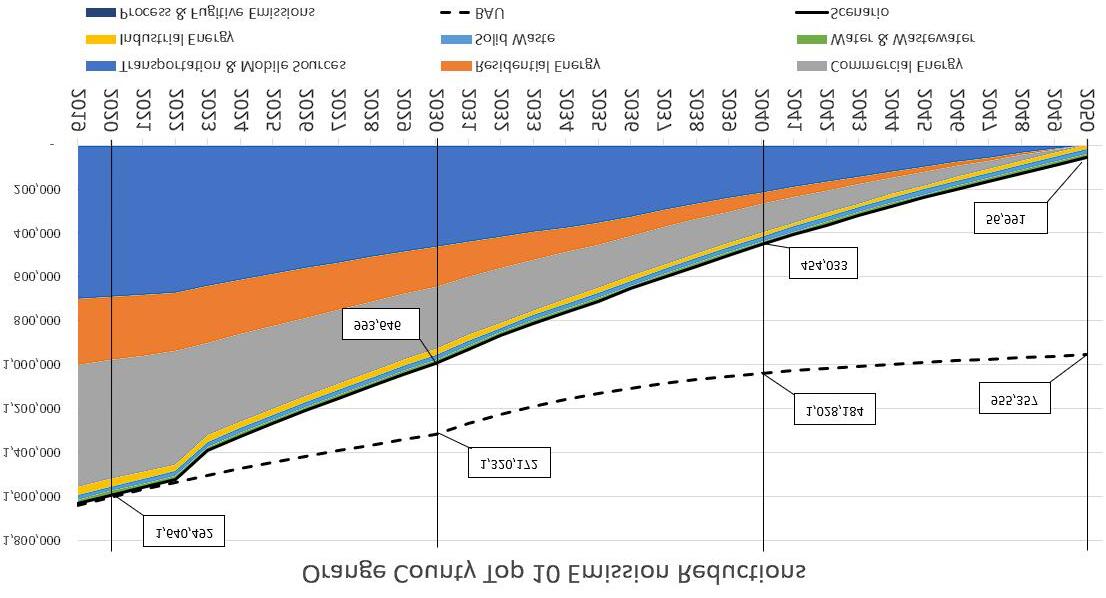
Insert forecast of top 10 for 100% Figure XX
Strategies 7-10 are not specific to GHG emission reduction. Instead, these strategies serve as guiding frameworks for consideration. Expanded funding should be allocated to projects identified in the CAP and special attention should be paid to additional staffing needs that might be necessary. In addition, all planning decisions should continue to weigh factors of environmental impacts against the social and economic impacts that these projects will present Finally, all planning processes should adhere to the County maintaining course to provide equitable solutions and to be prepared for climate change
In addition to the Top 10, goals, strategies, and actions are further developed throughout the CAP in the following sectors: Transportation, Built Environment and Energy, Resource Conservation, Green Community and Resilient Community These sectors clearly map a qualitative and quantitative approach to actionable solutions that the County can take.
Stakeholder Engagement
vate stakeholders in of Orange County ’s CAP planning process. Community of its plan, projects and policies. In the process of continue to collaborate) with existing universities, vate stakeholders in and around Orange County. der Engagem
Community engagement was a critical component of Orange County ’s CAP planning process Community members are the ones that experience the effects of its plan, projects and policies In the process of creating the CAP, Orange County worked (and will continue to collaborate) with existing universities, organizations, small businesses, and public and private stakeholders in and around Orange County
engagement was a critical component of Orange County ’s CAP planning process. Community e the ones that experience the effects of its plan, projects and policies. In the process of CAP, Orange County worked (and will continue to collaborate) with existing universities, s, small businesses, and public and private stakeholders in and around Orange County Stakeholder Engagement
Community engagement was a critical component of Orange County ’s CAP planning process Community members are the ones that experience the effects of its plan, projects and policies In the process of creating the CAP, Orange County worked (and will continue to collaborate) with existing universities,
EXECUTIVE SUMMARY
STAKEHOLDER ENGAGEMENT
Community engagement was a critical component of Orange County’s CAP planning process. Community members are the ones that experience the effects of its plan, projects and policies. In the process of creating the CAP, Orange County worked (and will continue to collaborate) with universities, organizations, small businesses, and public and private stakeholders in and around Orange County. Orange County’s stakeholder engagement events have included survey reports, focus group discussions, workshops, and participation in the annual Orange County Agricultural Summit. Participants' comments and suggestions have been integrated into the CAP to the best of the project team’s abilities. As this CAP is implemented, collaboration between the County and these stakeholders will remain essential because they are, as members of the community, best equipped to inform the CAP team of challenges the community faces.
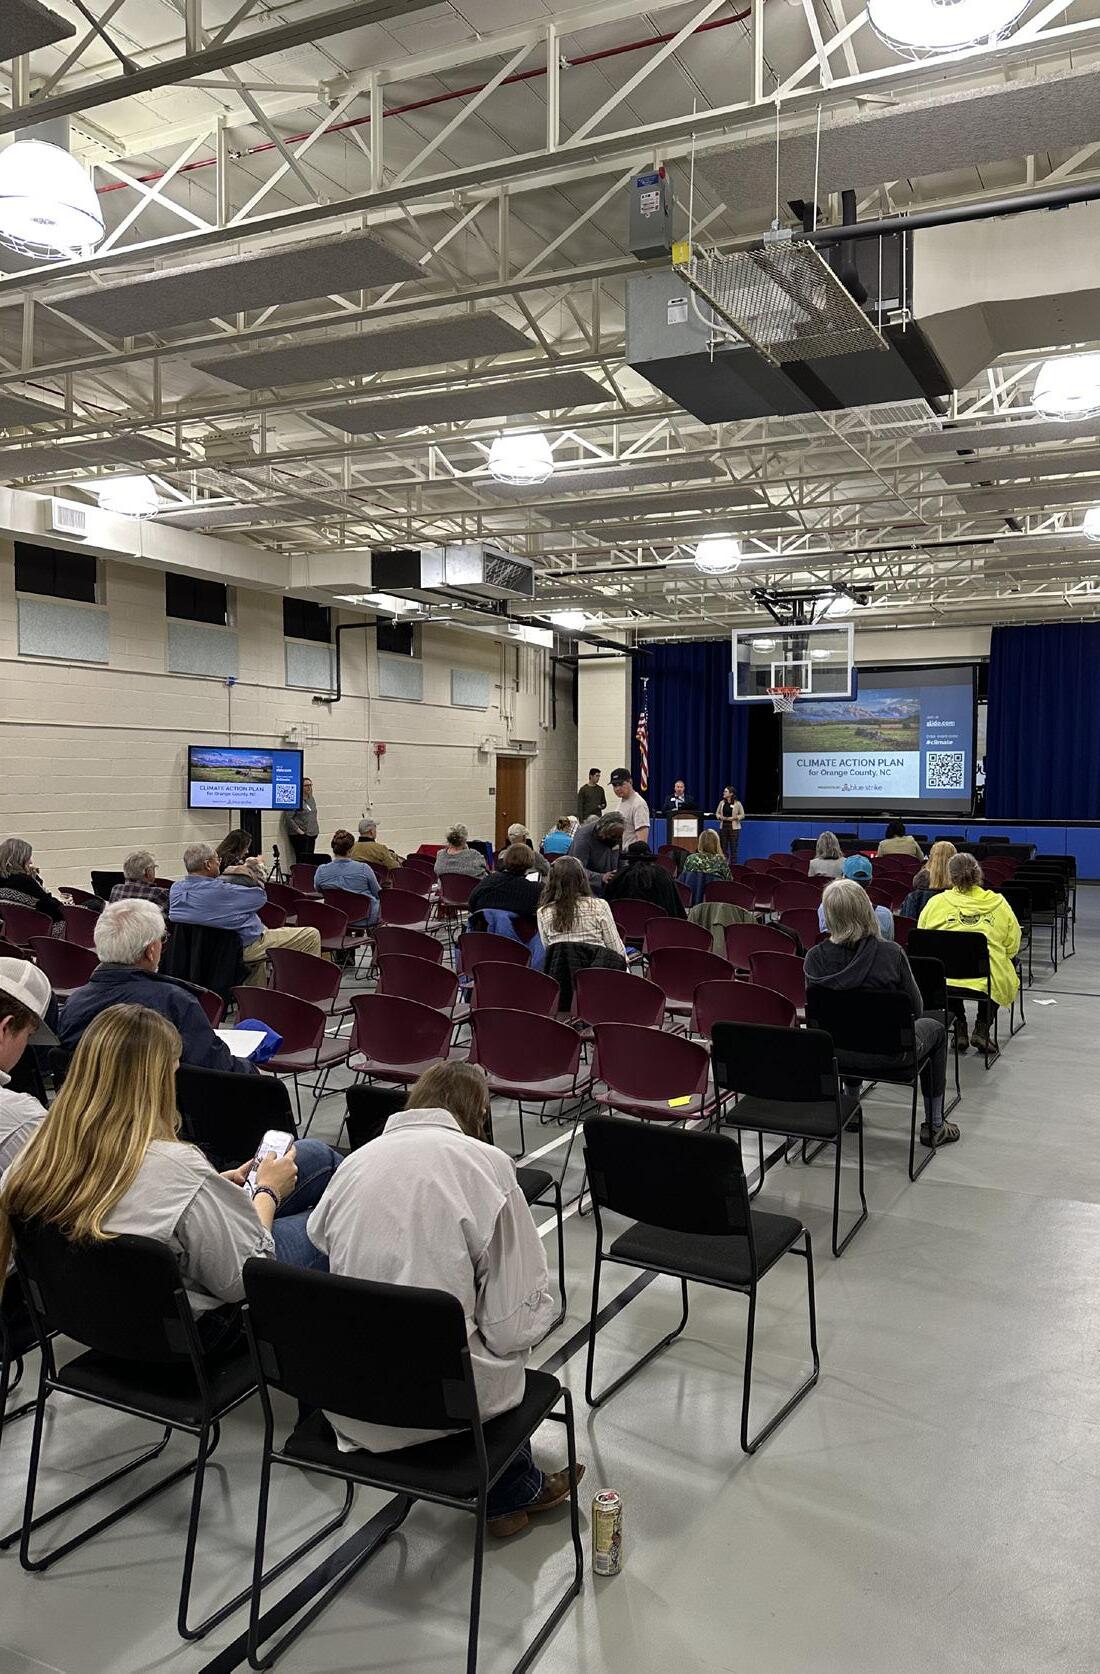
Ag Summit Community Engagement Session February 2023
IMAGE
EXECUTIVE SUMMARY
COST & IMPLEMENTATION TIMELINE
Efficiently allocating resources and funds is a cornerstone of the CAP for Orange County. Structured by year and specific focus area, the budget section presents a clear trajectory of expenditures and investments to facilitate the County's vision of a sustainable future. An overview of the funding plan is provided in the core body of the CAP, providing a breakdown of the estimated costs associated with each core goal. The implementation year for each strategy was selected based on its priority score and alignment with the top 10 things the County should do. Strategies set for immediate rollout have a higher priority score, whereas those with a later implementation year indicate a lower priority score. To further clarify our financial commitments and implementation timeline, the appendices serve as a detailed resource. Appendix D presents a table delineating possible internal funding mechanisms. Appendix E presents a table detailing potential funding sources from federal, state, regional, and local levels. Appendix F presents a comprehensive funding plan that itemizes each strategy's estimated cost, the proposed implementation year, possible funding source(s), primary implementation lead(s) and potential partners.
The implementation of this CAP will not rely solely on internal budgets but will be supported by current and future grant funding opportunities. Therefore, it is imperative that the County commit to hiring a grant administrator to oversee grant submissions. As grants are received, the County will prioritize where internal funding should be spent.
CONCLUSION
While the proposed CAP actions can be daunting, the cost of inaction is much higher. Investments now will substantially reduce long-term operation costs, reduce recovery costs from climate-related disasters, and promote growth in local jobs and the economy. The goals are ambitious, but ones that we believe we can achieve. There will undoubtedly be twists and turns on this path, and we will need to stay flexible and adapt along the way. These goals are designed to ensure that our community becomes more connected and continues to be healthy and vibrant. We encourage everyone to embrace and fully participate in implementing this CAP.


INTRODUCTION
BACKGROUND
Nestled in the hills of the North Carolina Piedmont, Orange County is located between the Research Triangle Park and the Triad cities of Greensboro, Winston-Salem and High Point. There are an estimated 153,166 residents with a growth rate of 0.9% in the past year according to the most recent United States census data. Orange County includes historic Hillsborough, the county seat; Chapel Hill, home of the University of North Carolina; and Carrboro and Mebane, former railroad and mill towns. The County encompasses 400 square miles of rolling farms and forest, vital urban centers and small towns. Orange County combines the best of cosmopolitan and rural values with an abundance of historical, social and cultural resources.
Recognizing the need for urgent and ambitious climate action based on scientific evidence and public concern, Orange County saw the imperative to systematize and accelerate efforts. This 2023 CAP represents the next step, unifying existing climate work under one strategic umbrella to equitably transition Orange County to a low-carbon, climate-resilient community.
In response to the need for a formal CAP, a Climate Action Team sub committee assembled to lead the planning process. This sub committee has representatives from 17 county-wide departments including Asset Management Services, the Budget office, Emergency Services and the Health Department to name a few. The group is led by a full time Sustainability Manager who keeps the County’s Board of Commissioners updated on progress.
APPROACH
Climate actions are not isolated events. They require collaboration and crosscutting strategies across multiple-jurisdictions, public agencies, nonprofits, commercial businesses and residential communities. This CAP emerged as a result of an extensive review of both environmental state mandates, the commitments of local and regional jurisdictions, and existing public private partnership structures. The County leveraged existing planning commitments where feasible and integrated new strategy elements to tailor this plan uniquely to the County.
The County has committed to working with state, regional and local partners to maximize our impact through collective planning and implementation of climate initiatives. Some of the ways Orange County engages are:
• STATE PLANNING
• REGIONAL PLANNING
• LOCAL PLANNING
INTRODUCTION
STATE PLANNING
North Carolina Clean Energy Plan6 sets a net zero GHG emissions target by 2050 and has established goals to support this target by fostering long-term energy affordability and accelerating clean energy innovation, development, and deployment to better serve business and residential communities. To support these goals, the plan states a commitment to develop carbon reduction policies and the tools needed to support these policies as well as to modernize the grid to support clean energy resource adoption.
The Cities Initiative, 7 led by the Environmental Defense Fund, is a collaborative effort among North Carolina local governments to address GHG emission reductions to evaluate barriers, business needs, and partnership opportunities.
During Phase 1, the Initiative identified 12 core goals around clean energy, transportation, and the built environment that the collaborative will focus on in the coming months. A large part of the analysis process is to uncover funding approaches to support these areas. Phase 2 will unfold in 2024. During this phase, specific strategies and actions will be determined to lay out a roadmap for implementation.
Triangle Clean Cities Coalition 8 leverages resources from the Department of Energy’s Vehicle Technology office to promote alternative fuels and electric vehicle adoption. The coalition provides collaboration, multi-jurisdiction grant opportunities, workshop education and technical assistance to municipalities who are committed to finding sustainable transportation solutions.
6 https://files.nc.gov/ncdeq/climate-change/clean-energy-plan/NC_Clean_Energy_Plan_OCT_2019_.pdf
7 https://www.deq.nc.gov/energy-climate/climate-change/mitigation/cities-initiative#:~:text=The%20Cities%20Initiative%20 is%20a,to%20reduce%20their%20GHG%20emissions
8 https://cleancities.energy.gov/coalitions/triangle
INTRODUCTION
REGIONAL PLANNING
Orange County , 9 the University of North Carolina (UNC) at Chapel Hill, 10 and the towns of Carrboro , 11 Chapel Hill , 12 and Hillsborough 13 are collaborating on a climate action initiative to identify areas within the County that are well suited for new public electric vehicle charging stations.
The Triangle Regional Resilience Partnership 14 is a cooperative partnership among the Town of Cary, the Town of Chapel Hill, the City of Durham, the City of Raleigh, Durham County, and Orange County. The Steering Committee is composed of the partners’ Sustainability Managers, Sustainability Directors, and Resilience Officers. This partnership—along with UNC Asheville’s National Environmental Modeling and Analysis Center and the Central Pines Regional Council—performed a quantified assessment to help regional decision makers understand which assets are most vulnerable to specific threats and provide guidance on potential solutions.
Triangle Sustainability Partnership15 has successfully initiated the “Solarize the Triangle” program which, in the first year of the partnership (2022), hit its top goal of reaching Tier 8 pricing, lowering the cost of solar for all participants by thirty-seven cents per kilowatt (kW), achieving $300,500 in annual utility bill savings, generating $5.98 million in new clean energy development, creating 1,731 kW of new clean energy capacity, and avoiding 3.5 million pounds of carbon dioxide annually. Year 2 of the partnership (2023) hit Tier 8 pricing as well demonstrating the strong demand for solar in our community. This is a crowd source funding campaign that bundles solar projects together to attract wholesale pricing from developers. This program will be expanded in 2024 to focus on electrification with a new program entitled “Electrify the Triangle.”
9 https://www.orangecountync.gov/
10 https://www.unc.edu/
11 https://townofcarrboro.org/
12 https://www.townofchapelhill.org/
13 https://cleancities.energy.gov/coalitions/triangle
14 https://www.centralpinesnc.gov/environment-resilience/climate-and-energy/triangle-regional-resiliencepartnership#:~:text=The%20Triangle%20Regional%20Resilience%20Partnership,recommendations%20for%20the%20 geographic%20area.
15 https://www.orangecountync.gov/CivicAlerts.aspx?AID=918&ARC=1587
INTRODUCTION
Central Pines Regional Council (was Triangle J Council of Governments) 16 is a resource and support hub for local governments, community members, and partners across Chatham, Durham, Johnston, Lee, Moore, Orange, and Wake counties. This public private partnership focuses on building networks to address gaps, barriers, and funding opportunities in five key areas, including two relevant to the CAP: Environment & Resilience and Mobility & Transportation.
The Southeast Sustainability Directors Network17 is another consortium that Orange County is involved with to help facilitate and advocate for regional climate initiatives. This network offers peer learning opportunities, equity resources, and information on regional funding.
16 https://www.centralpinesnc.gov/
17 https://www.southeastsdn.org/
INTRODUCTION
LOCAL PLANNING
A number of agencies work together to provide public transportation in Orange County and are all partners in planning transit and developing the Orange County Transit Plan 18 In November 2012, Orange County voters approved a transit-dedicated half-cent sales tax investment to expand and better connect the public transit network in Orange County and throughout the Triangle region.
The Orange County 2030 Comprehensive Plan19 serves as a “blueprint” document to guide future policy decisions for the County through the year 2030. Chapter One indicates a formal commitment to sustainability which laid the foundation for this CAP planning process. The County is currently updating the 2030 Comprehensive Plan and will take into consideration the goals and strategies outlined in this document and integrate the two planning documents as much as possible.
Orange County Solid Waste Management Plan 20 implements recommendations to set the vision for an integrated solid waste management program leading to Zero Waste by 2045. This Plan was developed, in collaboration with the Solid Waste Management Department, SWAG members, and feedback from County residents.
The 2023 Orange County Five-Year Strategic Plan21 is underway which will lay out priorities to guide policies and budget decisions from 2024 through 2028. The plan will have underpinning themes of sustainability and equity and will prioritize actions that support and defend vulnerable populations.
The Parks and Recreation Master Plan22 offers a robust overview of park facilities and services. The plan’s intent is to examine the lessons and experiences of the past, identify current issues and challenges, and project community needs and desires into a vision for the future – a future that ensures a legacy of parks and public open spaces for current and future generations.
18 https://www.orangecountync.gov/DocumentCenter/View/23130/2022-OC_Transit_Plan_Final
19 https://www.orangecountync.gov/1238/Comprehensive-Land-Use
20 https://orangecountync.gov/3008/Road-to-Zero-Waste-Master-Plan
21 https://berrydunn.mysocialpinpoint.com/orangecounty
22 https://www.orangecountync.gov/DocumentCenter/View/2070/Parks-and-Recreation-Master-Plan-PDF
INTRODUCTION
LOCAL PLANNING CONTINUED
In addition to the agency collaborations underway, the County has taken into account the alignment of regional commitments. Following state guidance, the County will work with its neighboring towns and university to share funding resources and best practices and maintain a dedicated focus to work collectively to ensure that these commitments stay on course. Table A portrays a snapshot of current state and regional commitments.
SECTOR ORANGE COUNTY STATE
Increase community EV adoption to 50% by 2035 and 100% by 2050
Decrease vehicle miles traveled (VMT) 30% from a 2019 baseline by 2050
Achieve 50% emission reduction target by 2030 and 100% by 2050 using a 2005 baseline
Achieve 100% clean renewable energy by 2050 in municipal and community sectors
Increase the % of community wide solar by 25% by 2035
Complete an electrification study and establish a long-term implementation plan (Phase 1 and Phase 2) for both municipal and community infrastructure by 2025
EO 246: Establishing targets of 1.25 million zero-emission vehicles registered and 50% of sales by 2030
EO 246. The order requires NC DOT to develop actionable strategies for Vehicle Miles Traveled (VMT)
EO 246. Reduce statewide GHG emissions to at least 50% below 2005 levels by 2030 and achieve net zero emissions by 2050
HB 951. Reduce electric power sector greenhouse gas emissions by 70% below 2005 levels by 2030
There are 31 community solar projects that operate in 93 of 100 counties in North Carolina providing electricity to 25% of North Carolina residents
All-electric new construction standards; All newly sold appliances are high-efficiency models
Electrify fleet passenger vehicles, light and medium duty trucks by 2040, and all heavy duty vehicles by 2050
Replace diesel buses and support vehicles with all-electric options over the next 20 years
Create walkable, bikeable, transit-served neighborhoods, Increase walking, biking and transit use (mode-shift)
Halfway to net zero by 2030: 15% of commercial, 30% of residential, 100% of Town buildings
Reduce 2010 levels of GHG emissions from motor vehicle use by 80% by 2030
Reduce GHG Emissions from Motor Vehicle Use by 80% by 2030
Municipal goal updated in 2020 to reduce 2010 levels of municipal emissions 80% by 2030 Community goal updated in 2020 to reduce 2010 levels of community emissions 80% by 2030
80% clean renewable energy by 2030; 100% by 2050
Green the Grid; Participating in Solarize the Triangle
Projects on Town buildings, including solar leasing; dedicate adequate funding to these projects
Pursue Community Solar Projects; Participate in Solarize the Triangle
Net-zero emissions for new construction; Energy audit requirement at time of sale
Table A: Current State and Regional Commitments
Facilitate Low Cost Financing for Energy Efficiency and Renewable Energy Projects
CHAPEL HILL
CARRBORO
INTRODUCTION
LOCAL PLANNING CONTINUED
SECTOR HILLSBOROUGH UNC
Develop and adopt electric vehicle requirements for developments; Offer incentives for electric vehicle charging infrastructure in developments
The Comprehensive Sustainability Plan identifies ways Hillsborough can convert vehicle trips into walking, biking, or transit trips.
Reducing U.S. GHG emissions 50% to 52% below 2005 levels by 2030.
80% renewable energy by 2030; 100% by 2050
Participating in Solarize the Triangle
Investigate opportunities and incorporate sustainability and climate initiatives in facility development including geothermal, solar, weatherization, and green infrastructure
Increase fuel efficiency of campus fleet based on CAFÉ standards
Expand Vehicle telematics; Establish a Commuter Alternative Program
Pledged to be carbon neutral by 2050 and established 15 near-term strategies to reach this goal.
DURHAM COUNTY CHATHAM
Encourage the use of plug-in electric vehicles in Durham as a substitute for petroleum powered vehicles to help achieve community-wide air quality and GHG emissions reduction goals
Increase use of environmentally preferred transportation options
Commitment to reducing emissions to net zero in the electricity sector
80% renewable energy by 2030; 100% by 2050
Commit to onsite solar and RECs
Participating in Solarize the Triangle
Continue Building Optimization Program; Continue Energy Conservation Measures Program
Reducing total energy use is a key tenant of Durham County’s ability to reach its renewable energy goals.
Encourage private vehicle owners to use electric vehicles; develop charging stations for electric vehicles and encourage apartment owners and homeowners to install charging stations
Expanded public transit is a stated goal of the CAP
Focus on energy efficiency and community EV adoption
100% clean energy by 2050; Install rooftop solar panels where feasible
Identify potential sites or areas for the location of renewable energy facilities, including solar farms and wind plantations
Encourage energy audits for private and public buildings with incentives for follow-up retrofits on existing buildings
Table A: Current State and Regional Commitments (continued from page 24)
OUR PROGRESS
In 2008, sustainability was threaded throughout Orange County’s 2030 Comprehensive Plan. The integration and collective impact of environmental, social and economic elements was recognized as a contributing factor to ensuring a healthy and vibrant community. Since then, Orange County has demonstrated a long-term commitment to pursuing initiatives that support this vision, as listed in the following sectors. The County will continue to incentivize and acknowledge those making efforts as this CAP is implemented over time.
INTRODUCTION
OUR PROGRESS CONTINUED
BUILT ENVIRONMENT AND ENERGY
Set a goal of using 100% renewable energy by 2050
Set goal of a 3% yearly reduction in energy use in County operations
Efficient lighting and HVAC (heating, ventilation & air conditioning) policies in place
On-site solar on several County buildings, with more under way
5 County buildings served by geothermal groundsource heat pumps
Received LEED for Cities and Communities (Gold certification)
All major County facilities served by energy-saving HVAC control systems
Updating County lighting to LED using County’s Sustainability Fund and Duke Energy’s Small Business Energy Saver Program
Policy of installing solar on all new County capital projects, where feasible
TRANSPORTATION
Updated Orange County Transit Plan in 2022
Operates a network of 23 free electric vehicle charging stations
Employee commute reduction programs in place
Operates County Commuter Options program offering alternatives to single-occupancy vehicle travel for the community
Transitioned 7 county vehicles to all electric; 10 more on order
RESOURCE CONSERVATION
Installed aerators on all bathroom and breakroom fixtures at County facilities to conserve water
Created a dedicated Recycling Education & Outreach Coordinator position
Achieved an approximately 60% increase in waste diversion compared to 1990 levels
Developed Lands Legacy Program in 2000
Diverted over 1,200 surplus county computers for reuse by an Orange County student training program
Established a Waste Wise Event Program to reduce trash at County staff events
GREEN COMMUNITY
Ordinances in place to preserve 33% of acreage from new developments
Rainwater collection systems built at County facilities
35% of County land area has designated green stormwater infrastructure
RESILIENT COMMUNITY
The County participated in the Triangle Regional Resilience Assessment (completed in 2018)
Updating the FEMA Hazard Mitigation Plan now
Updated the County’s State of the Environment Report in 2019
Offers Orange County Mobility on Demand rideshare services to Cooling Centers during extreme heat days
Continues to pursue hazard mitigation action items including acquiring structures in floodplains and returning the land to green space.
Adopted the Eno Haw Regional Hazard Mitigation Plan in 2020 and continue to participate in five year update cycles
GOVERNANCE
The Board of County Commissioners voted to uphold the Paris Agreement
Conducted greenhouse gas inventories in 2005 and 2017
Providing staff support for the Commission for the Environment Advisory Board
FINANCE
The Community Climate Action grant program, financed from a ¼ cent property tax, has provided funding for a variety of climate action projects including weatherization, solar installations, tree plantings, EV charger installations, LED lights, heat pump water heater replacements, compost monitors at farmer's markets, and more
The County has provided low-to-moderate income (LMI) funding through the Solarize the Triangle program to fund solar installations for LMI households
INTRODUCTION
THINGS YOU CAN DO YOURSELF
While governments and corporations can make significant mitigation impacts in the way they operate, individuals can make a difference in the way we live our daily lives. Our decisions give us the power to set a course for change by taking small actions that cause rippling effects across communities and can build dialogues that lead to broad behavior change. Join Orange County as it sets a course for community-wide climate change.
ENERGY PLEDGE TO:
Turn off the lights when you leave if your home or office does not have occupancy sensors
Skip the elevator and take the stairs for exercise and energy savings
Unplug or use a power strip
Obtain an energy audit for your home
Take advantage of your energy provider’s incentives for reducing your energy consumption
WATER PLEDGE TO:
Bring a reusable water bottle to work each day
Reduce meat consumption (biggest water user)
Reduce water use at home and work
Plant native plants that require less water than non natives
FOOD PLEDGE TO:
Say no to plastic by bringing a reusable to go container to work and for restaurant leftovers
Not ask for a straw
Only take what you can eat
Eat a more plant-based diet
GREEN SPACES PLEDGE TO:
Be a good steward to the earth by planting a tree
Convert some or all of your lawn space to native plants
Use an electric or battery operated mower

PURCHASING PLEDGE TO:
Prioritize local and minority owned farms and businesses and support those with a climate mission
Purchase products with reduced packaging
Make your next vehicle purchase an electric one instead of gas
TRANSPORTATION PLEDGE TO:
Ride your bike or carpool to work
Take public transportation as often as possible
Telecommute when possible
WASTE PLEDGE TO:
Reduce/eliminate use of single use plastic bags
Reduce food waste
Start composting
Purchase second-hand clothing whenever possible
Reduce paper copies and print double sided
Fix first before buying new
Donate usable clothing, furniture, housewares, and electronics
ENGAGE PLEDGE TO:
Talk and share ideas with others about climate change
Volunteer for a community climate action project
Stay informed and involved with what the County and region are doing to tackle climate change
Participate in community engagement efforts around climate change
IMAGE PROVIDED BY ORANGE COUNTY, NC.
INTRODUCTION
OUR IMPACT
An updated GHG Emission Inventory was conducted as part of this CAP planning process in order to understand the present state of environmental impacts and to establish a baseline for the forecasting of future emissions. The methodology was built using the US Community Protocol provided by the ICLEI ClearPath tool coupled with United States Environmental Protection Agency GHG emission factors which serve as the benchmark for GHG emission inventory analysis nationwide. Emissions were estimated based on best practices drawn from these resources. The year 2019 was selected for the GHG Emission Inventory to offer a more typical representation of GHG emissions against the year 2022, given that the COVID-19 pandemic significantly reduced travel emissions and markedly impacted emissions from other sectors as well. Notably, the years 2020, 2021, and 2022 recorded significantly lower emissions compared to current levels. A full understanding of the inventory can be found in Appendix A: 2019 GHG Emissions Inventory.
This GHG inventory analyzes two different tracks, which are presented separately. The community track encompasses all Orange County residents, including businesses, individuals, schools and industrial emissions sources. Community emissions were divided into sectors: commercial, residential, and industrial energy; transportation and mobile services; solid waste; and water and wastewater. The County operations GHG inventory is a subset of the community inventory and has specific usage portioned out from the community inventory that are directly related to the local government operations. The two tracks are considered on the following pages.
INTRODUCTION
OUR IMPACT CONTINUED
COMMUNITY GREENHOUSE GAS INVENTORY
In 2019, the Orange County community produced a total of 1,631,671 metric tons of carbon dioxide equivalent emissions (MT CO2e). As illustrated in Figure B, the greatest percentage of emissions was from transportation and mobile sources at 43%, or 702,701 MT CO2e. Building energy use was categorized into Commercial (business, university, and medical buildings), Residential (single and multi-family residences), and industrial (agricultural and factory buildings) sectors to assist in determining reduction strategies. Energy use in commercial buildings represents the next largest emission source at 34%, or 556,800 MT C02e. This is followed by residential building and industrial energy use at 18%, or 299,216 MT C02e and 2%, or 33,626 MT C02e respectively. The remainder of the community inventory includes solid waste with 21,350 MT CO2e, water and wastewater with 12,585 MT CO2e, and fugitive emissions with 5,393 MT CO2e.23
ORANGE COUNTY COMMUNITY INVENTORY
23 Percentages might not equal 100% due to rounding
Figure B: Orange County Community Inventory
INTRODUCTION
OUR IMPACT CONTINUED
COUNTY OPERATIONS GREENHOUSE GAS INVENTORY
As shown in Figure C, County operations GHG emissions were also analyzed. Orange County local government operations (LGO) were responsible for 19,359 MT CO2e. The largest emission sources were Employee Commuting at 33% (6,329 MT CO2e), followed by the Buildings & Facilities sector with 32% (6,185 MT CO2e). The local ICLEI advisor recommended including Water & Wastewater electricity emissions in the County electricity emissions and accounted for 23% (4,479 MT CO2e). Vehicle Fleet emissions contributed 11% (2,106 MT CO2e) and Transit Fleet accounted for the remaining 1% (251 MT CO2e). Fugitive emissions produced 9 MT CO2e.
ORANGE COUNTY GOVERNMENT OPERATIONS INVENTORY
Figure C: Orange County Government Operations Inventory
GOALS LOOKING TO 2050

GOALS LOOKING TO 2050
EMISSIONS FORECAST
To determine what the County’s emissions might look like in 2050, a series of GHG emissions forecasts were developed. As illustrated in Figure D, a Business-As-Usual (BAU) forecast was developed to predict the County’s emissions without any additional action from federal, state, or local governments. A series of growth factors such as population and household growth were applied to the County’s baseline emissions. Without any additional action, the County’s emissions are expected to increase from 1,631,671 metric tons in 2019 to 1,813,315 metric tons in 2050.
1. POPULATION GROWTH
2. ENERGY GROWTH
4. HOUSEHOLD GROWTH GROWTH FACTORS
3. VEHICLE MILES TRAVELED
To project the County’s emissions in 2050 including the expected impacts of state and local actions, an Adjusted Business-As-Usual (ABAU) forecast was developed. This forecast, shown in Figure E, includes expected increases in fuel economy and building energy efficiency in North Carolina, as well as the local utility companies' commitments to 50% emissions reduction in 2030 and net zero emissions by 2050. Further methodology on the emission forecast can be found in Appendix B. The ABAU shows the emissions in Orange County dropping from 1,631,671 MT CO2e per year to 947,191 MT CO2e per year.
the

EMISSIONS FORECAST
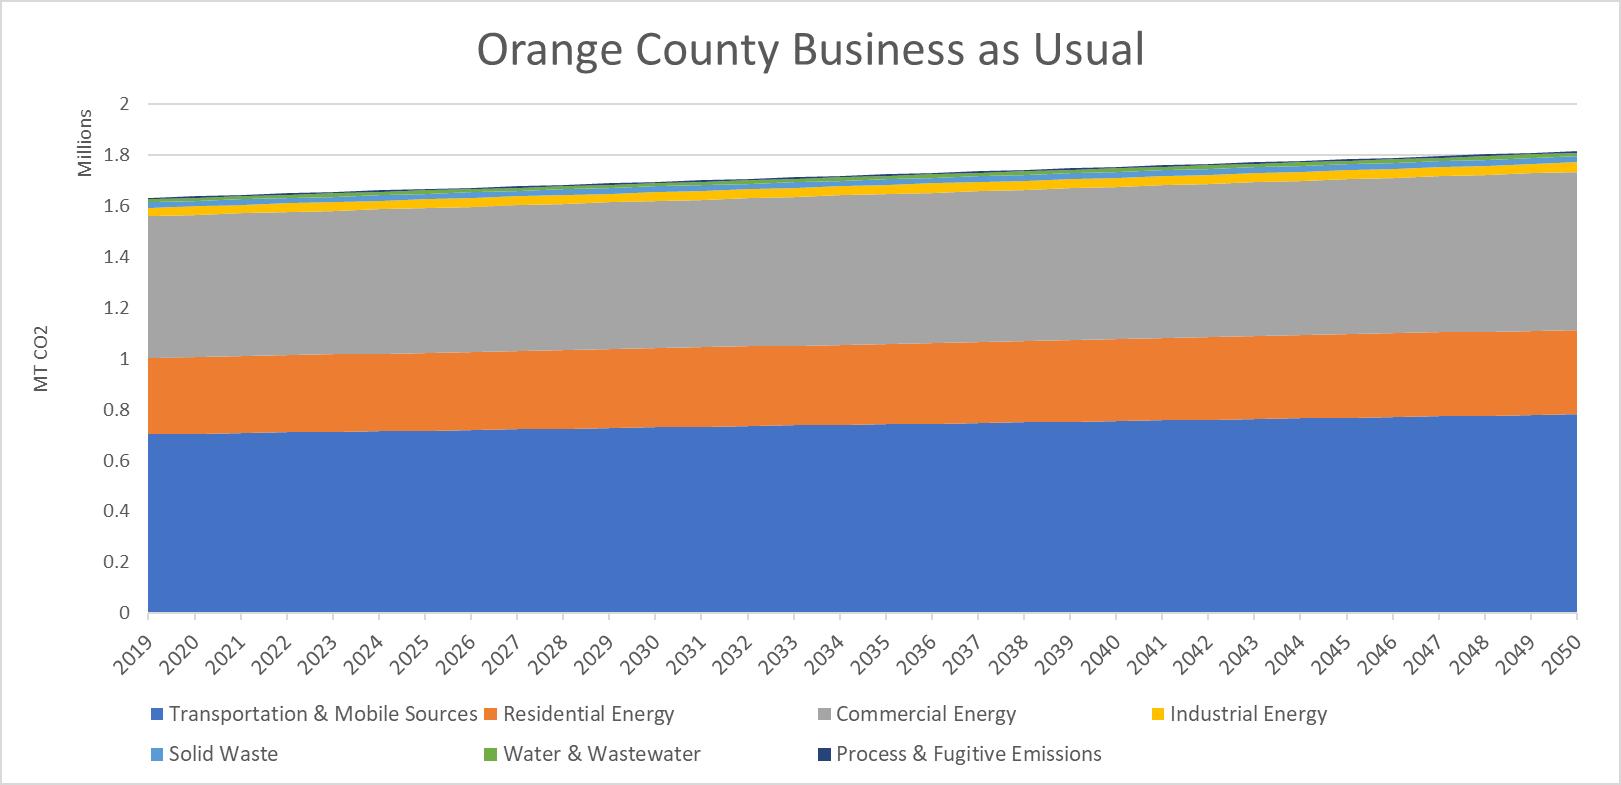
Figure C: Orange County Business as Usual
ENERGY RESIDENTIAL ENERGY TRANSPORTATION & MOBILE SOURCES PROCESS & FUGITIVE
Figure D: Orange County Business-As-Usual
To project the County ’s emissions in 2050 including the expected impacts of State and local actions, an Adjusted Business-As-Usual forecast was developed. This forecast, shown in Figure D, includes expected increases in fuel economy and building energy efficiency in North Carolina, as well as the local utility co 1,200,000 1,400,000 1,600,000
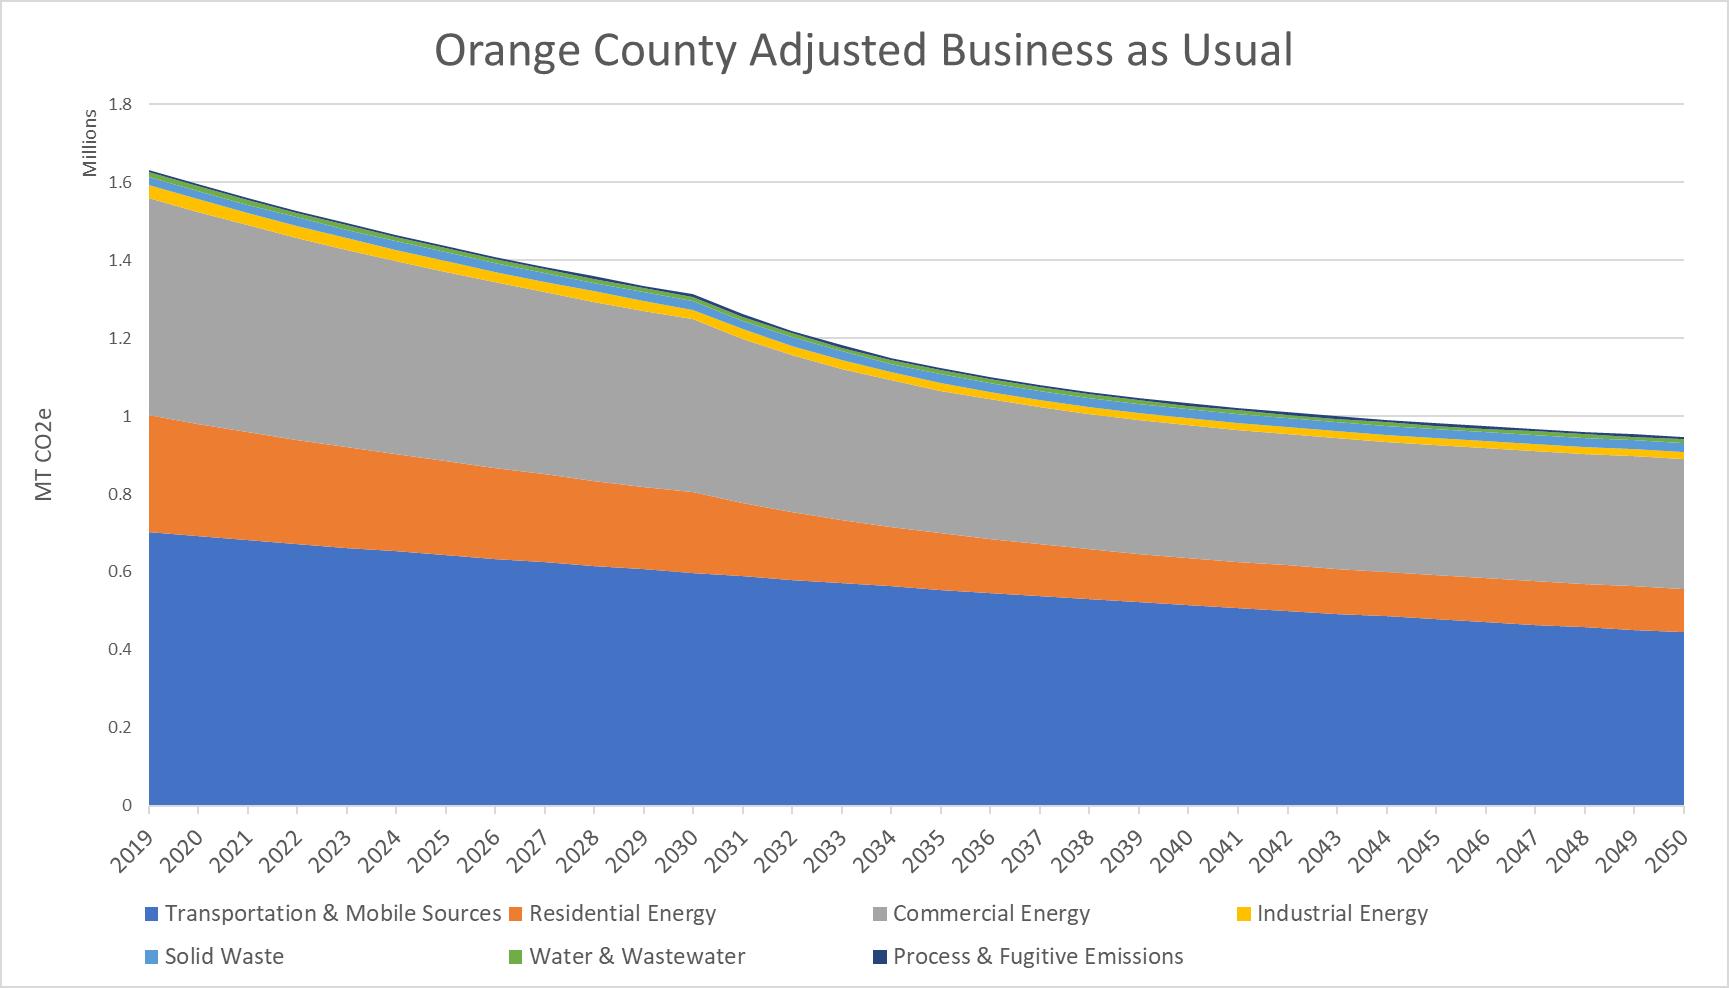
Figure D: Orange County Adjusted Business as Usual
Figure E: Orange County Adjusted Business-As-Usual

GOALS
LOOKING TO 2050
DEVELOPMENT AND METHODOLOGY
Through quantitative and qualitative analysis, goals, strategies, and actions were identified to enable the County to form a clear path toward implementation. Some of the strategies were derived from existing programs and policies within local and regional planning documents, while others emerged as new strategies drawn from the ongoing stakeholder process and the Climate Action Team subcommittee.
CAP STRATEGY DEVELOPMENT
DEVELOPMENT PROCESS:
Preliminary quantitative and qualitative strategies identified and agreed upon
Development of “Long List” of CAP actions to implement each strategy
Community and stakeholder feedback
Further refine into a “Short List” of CAP actions
Quantify emission reductions from actions
DEVELOPMENT TOOLS
There are two development tools that are being used to track annual progress of the CAP. ICLEI tracks the success of GHG emission reductions over time and the Climate Action Tracker acts as an internal tracking system for staff roles and responsibilities, timelines and funding approaches.
Local Governments for Sustainability is the first and largest global network of local governments devoted to solving the world’s most intractable sustainability challenges. They have produced an online software platform, ICLEI , which tracks GHG emissions and forecasts models for strategy implementation. ICLEI also has a monitoring component, Clearpath, which can be used to report ongoing implementation of the CAP. In ICLEI ClearPath each strategy developed can be inputted and updated with real time progress of emission reductions achieved. Reports can then be exported to provide data visualizations on the progress of strategy implementation.
IMAGE PROVIDED BY ORANGE COUNTY, NC.

DEVELOPMENT AND METHODOLOGY CONTINUED
The Climate Action Tracker combines stakeholder feedback with strategy development to determine and clearly identify what additional gaps in data or funding is needed. The Tracker functions like a workbook and serves as the single point for planning, reporting and ongoing performance monitoring. The Tracker: (1) establishes a “starting point” for future comparisons; (2) tracks strategies and actions identified in the CAP; (3) ensures contributions and actions of multiple County leaders; and (4) summarizes results and impacts. The Climate Action Tracker can be used to assign various action and reporting items to key departments responsible for reporting.
Climate Action Tracker sample. GOALS LOOKING TO 2050

PRIORITIZATION
The Climate Action Tracker provides initial priority rankings and timelines for each CAP strategy. As a primary step, each strategy is ranked by its potential impact on GHG emission reductions: Tier 1 Foundational, Tier 2 Supportive, and Tier 3 Complementary. Foundational strategies will be key to reducing the environmental impacts of climate change and are drawn out as immediate priorities. Orange County will need to make difficult decisions to ensure these strategies are prioritized. Supportive strategies are ranked next in line and indicate strategies that have less of a GHG reduction potential but are still critical elements in reducing the environmental impacts. Complementary strategies are focused on educational strategies that are a cornerstone to the CAP’s ability to succeed.
A second step is to assign co-benefits which help us understand the feasibility and effectiveness of each strategy. Four of the co-benefits are given a numerical score of 1 and ranked based on the high/medium/low impacts that each brings. The greenhouse gas reduction and equity and climate justice co-benefits are weighted higher, at 1.25, to indicate further emphasis on these environmental and social impacts. The numerical scores are combined into a Priority Score which is highlighted after each strategy.
EFFECTIVENESS
Greenhouse Gas
Reduction potential (High, medium, and low)
Cost-Effectiveness
(Net present value, impact versus dollar spent)
Community Benefits (Clean air, livable community, resiliency, etc.) Effects on the Economy (Impacts on workforce, broad economy)
ON THE ECONOMY
ALIGNMENT WITH STATE/LOCAL POLICIES
Alignment with State and Local Policies
(EO 246, HB951, 100% renewable energy resolution)
Incorporates Equity and Climate Justice (Fair distribution of resources)
& CLIMATE JUSTICE
IMAGE PROVIDED BY ORANGE COUNTY, NC.

GOALS
LOOKING TO 2050
DEVELOPMENT AND METHODOLOGY CONTINUED
COMMUNITY ENGAGEMENT
Orange County hosted a series of focus groups and workshops and embarked on a public education campaign to disseminate a public Climate Action Survey.
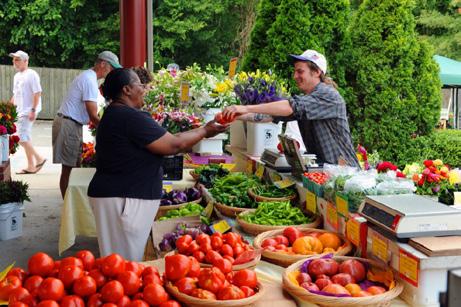
At the 2023 Orange County Agricultural Summit, the project team presented a baseline assessment of existing actions and potential best practices that the County could consider. Feedback centered around the need to strengthen support for young farmers and the need to increase local food networks. Breeze Farm was highlighted as a showcase property for teaching farmers sustainable agricultural practices including agro voltaics.
In addition to an internal County staff focus group, the County initiated outreach to key community stakeholders throughout the year. The County presented two focus groups: a Business and Vendor Perspectives and a Community and Environmental Priorities focus group. The County heard critical feedback from businesses, non profits, and public agencies on how the CAP could best support the broad community in terms of resources, education and additional programming needed. A Student Voices workshop was held at UNC to learn about potential research that is happening on campus and determine if there were opportunities to leverage that research to pilot new technologies within County facilities.
Finally, the final draft of the CAP was presented at a Community Symposium in the Fall. The public was invited to learn about the County’s priorities and roadmap for implementation.
500 people participated in the County’s Climate Action Survey which was distributed as a QR code at local farmer’s markets and similar outreach events in the County. Outreach examples include all three farmer's markets in Hillsborough, Chapel Hill and Carrboro, Climate Action Day at UNC, events through El Centro Hispano, Orange County Juneteenth event, and Orange County, Chapel Hill, and Carrboro City Schools. In addition, the survey was sent to all Orange County churches, community groups, and targeted local businesses with physical flyers with the QR code posted at libraries, grocery stores, parks, etc. The survey was translated in Spanish, Karen, Burmese and Mandarin.
IMAGE PROVIDED BY ORANGE COUNTY, NC.

community in terms of resources, education and additional programming needed. A Student Voices workshop was held at UNC to learn about potential research that is happening on campus and determine if there were opportunities to leverage that research to pilot new technologies within County facilities
feedback from businesses, non profits, and public agencies on how the CAP could best support the broad community in terms of resources, education and additional programming needed. A Student Voices workshop was held at UNC to learn about potential research that is happening on campus and determine if there were opportunities to leverage that research to pilot new technologies within County facilities.
feedback from businesses, non profits, and public agencies on how the CAP could best support the broad community in terms of resources, education and additional programming needed. A Student Voices workshop was held at UNC to learn about potential research that is happening on campus and determine if there were opportunities to leverage that research to pilot new technologies within County facilities.
feedback from businesses, non profits, and public agencies on how the CAP could best support the broad community in terms of resources, education and additional programming needed. A Student Voices workshop was held at UNC to learn about potential research that is happening on campus and determine if there were opportunities to leverage that research to pilot new technologies within County facilities.
feedback from businesses, non profits, and public agencies on how the CAP could best support the broad community in terms of resources, education and additional programming needed A Student Voices workshop was held at UNC to learn about potential research that is happening on campus and determine if there were opportunities to leverage that research to pilot new technologies within County facilities
GOALS
LOOKING TO 2050
Finally, 493 people participated in the County ’s Climate Action Su r vey which was distributed as a QR code at local Farmer ’s Market and similar outreach events in the county. Outreach examples include all three farmer's markets in Hillsborough, Chapel Hill and Carborro, Climate Action Day at UNC, events through El Centro Hispano, Orange County Juneteenth event, and Orange County, Chapel Hill, and Carborro city schools In addition, the sur vey was sent to all Orange County churches, community groups, and targeted local businesses with physical flyers with the QR code posted at libraries, grocery stores, parks, etc The survey was translated in Spanish, Karen, Burmese and Mandarin.
Finally, 493 people participated in the County ’s Climate Action Su r vey which was distributed as a QR code at local Farmer ’s Market and similar outreach events in the county. Outreach examples include all three farmer's markets in Hillsborough, Chapel Hill and Carborro, Climate Action Day at UNC, events through El Centro Hispano, Orange County Juneteenth event, and Orange County, Chapel Hill, and Carborro city schools. In addition, the sur vey was sent to all Orange County churches, community groups, and targeted local businesses with physical flyers with the QR code posted at libraries, grocery stores, parks, etc. The survey was translated in Spanish, Karen, Burmese and Mandarin.
Finally, 493 people participated in the County ’s Climate Action Su r vey which was distributed as a QR code at local Farmer ’s Market and similar outreach events in the county. Outreach examples include all three farmer's markets in Hillsborough, Chapel Hill and Carborro, Climate Action Day at UNC, events through El Centro Hispano, Orange County Juneteenth event, and Orange County, Chapel Hill, and Carborro city schools. In addition, the sur vey was sent to all Orange County churches, community groups, and targeted local businesses with physical flyers with the QR code posted at libraries, grocery stores, parks, etc. The survey was translated in Spanish, Karen, Burmese and Mandarin.
DEVELOPMENT AND METHODOLOGY CONTINUED
Finally, 493 people participated in the County ’s Climate Action Su r vey which was distributed as a QR code at local Farmer ’s Market and similar outreach events in the county. Outreach examples include all three farmer's markets in Hillsborough, Chapel Hill and Carborro, Climate Action Day at UNC, events through El Centro Hispano, Orange County Juneteenth event, and Orange County, Chapel Hill, and Carborro city schools. In addition, the sur vey was sent to all Orange County churches, community groups, and targeted local businesses with physical flyers with the QR code posted at libraries, grocery stores, parks, etc. The survey was translated in Spanish, Karen, Burmese and Mandarin.
Finally, 493 people participated in the County ’s Climate Action Survey which was distributed as a QR code at local Farmer ’s Market and similar outreach events in the county Outreach examples include all three farmer's markets in Hillsborough, Chapel Hill and Carborro, Climate Action Day at UNC, events through El Centro Hispano, Orange County Juneteenth event, and Orange County, Chapel Hill, and Carborro city schools In addition, the survey was sent to all Orange County churches, community groups, and targeted local businesses with physical flyers with the QR code posted at libraries, grocery stores, parks, etc The survey was translated in Spanish, Karen, Burmese and Mandarin.
An example of the sur vey results is shown in Figure F A full Stakeholder Report, outlining specific feedback received, can be found as Appendix F.
An example of the sur vey results is shown in Figure F. A full Stakeholder Report, outlining specific feedback received, can be found as Appendix F.
An example of the sur vey results is shown in Figure F A full Stakeholder Report, outlining specific feedback received, can be found as Appendix F.
An example of the sur vey results is shown in Figure F A full Stakeholder Report, outlining specific feedback received, can be found as Appendix F.
An example of the survey results is shown in Figure F. A full Stakeholder Report, outlining specific feedback received can be found as Appendix F
An example of the survey results is shown in Figure F. A full Stakeholder Report, outlining specific feedback received, can be found as Appendix C. , p ,
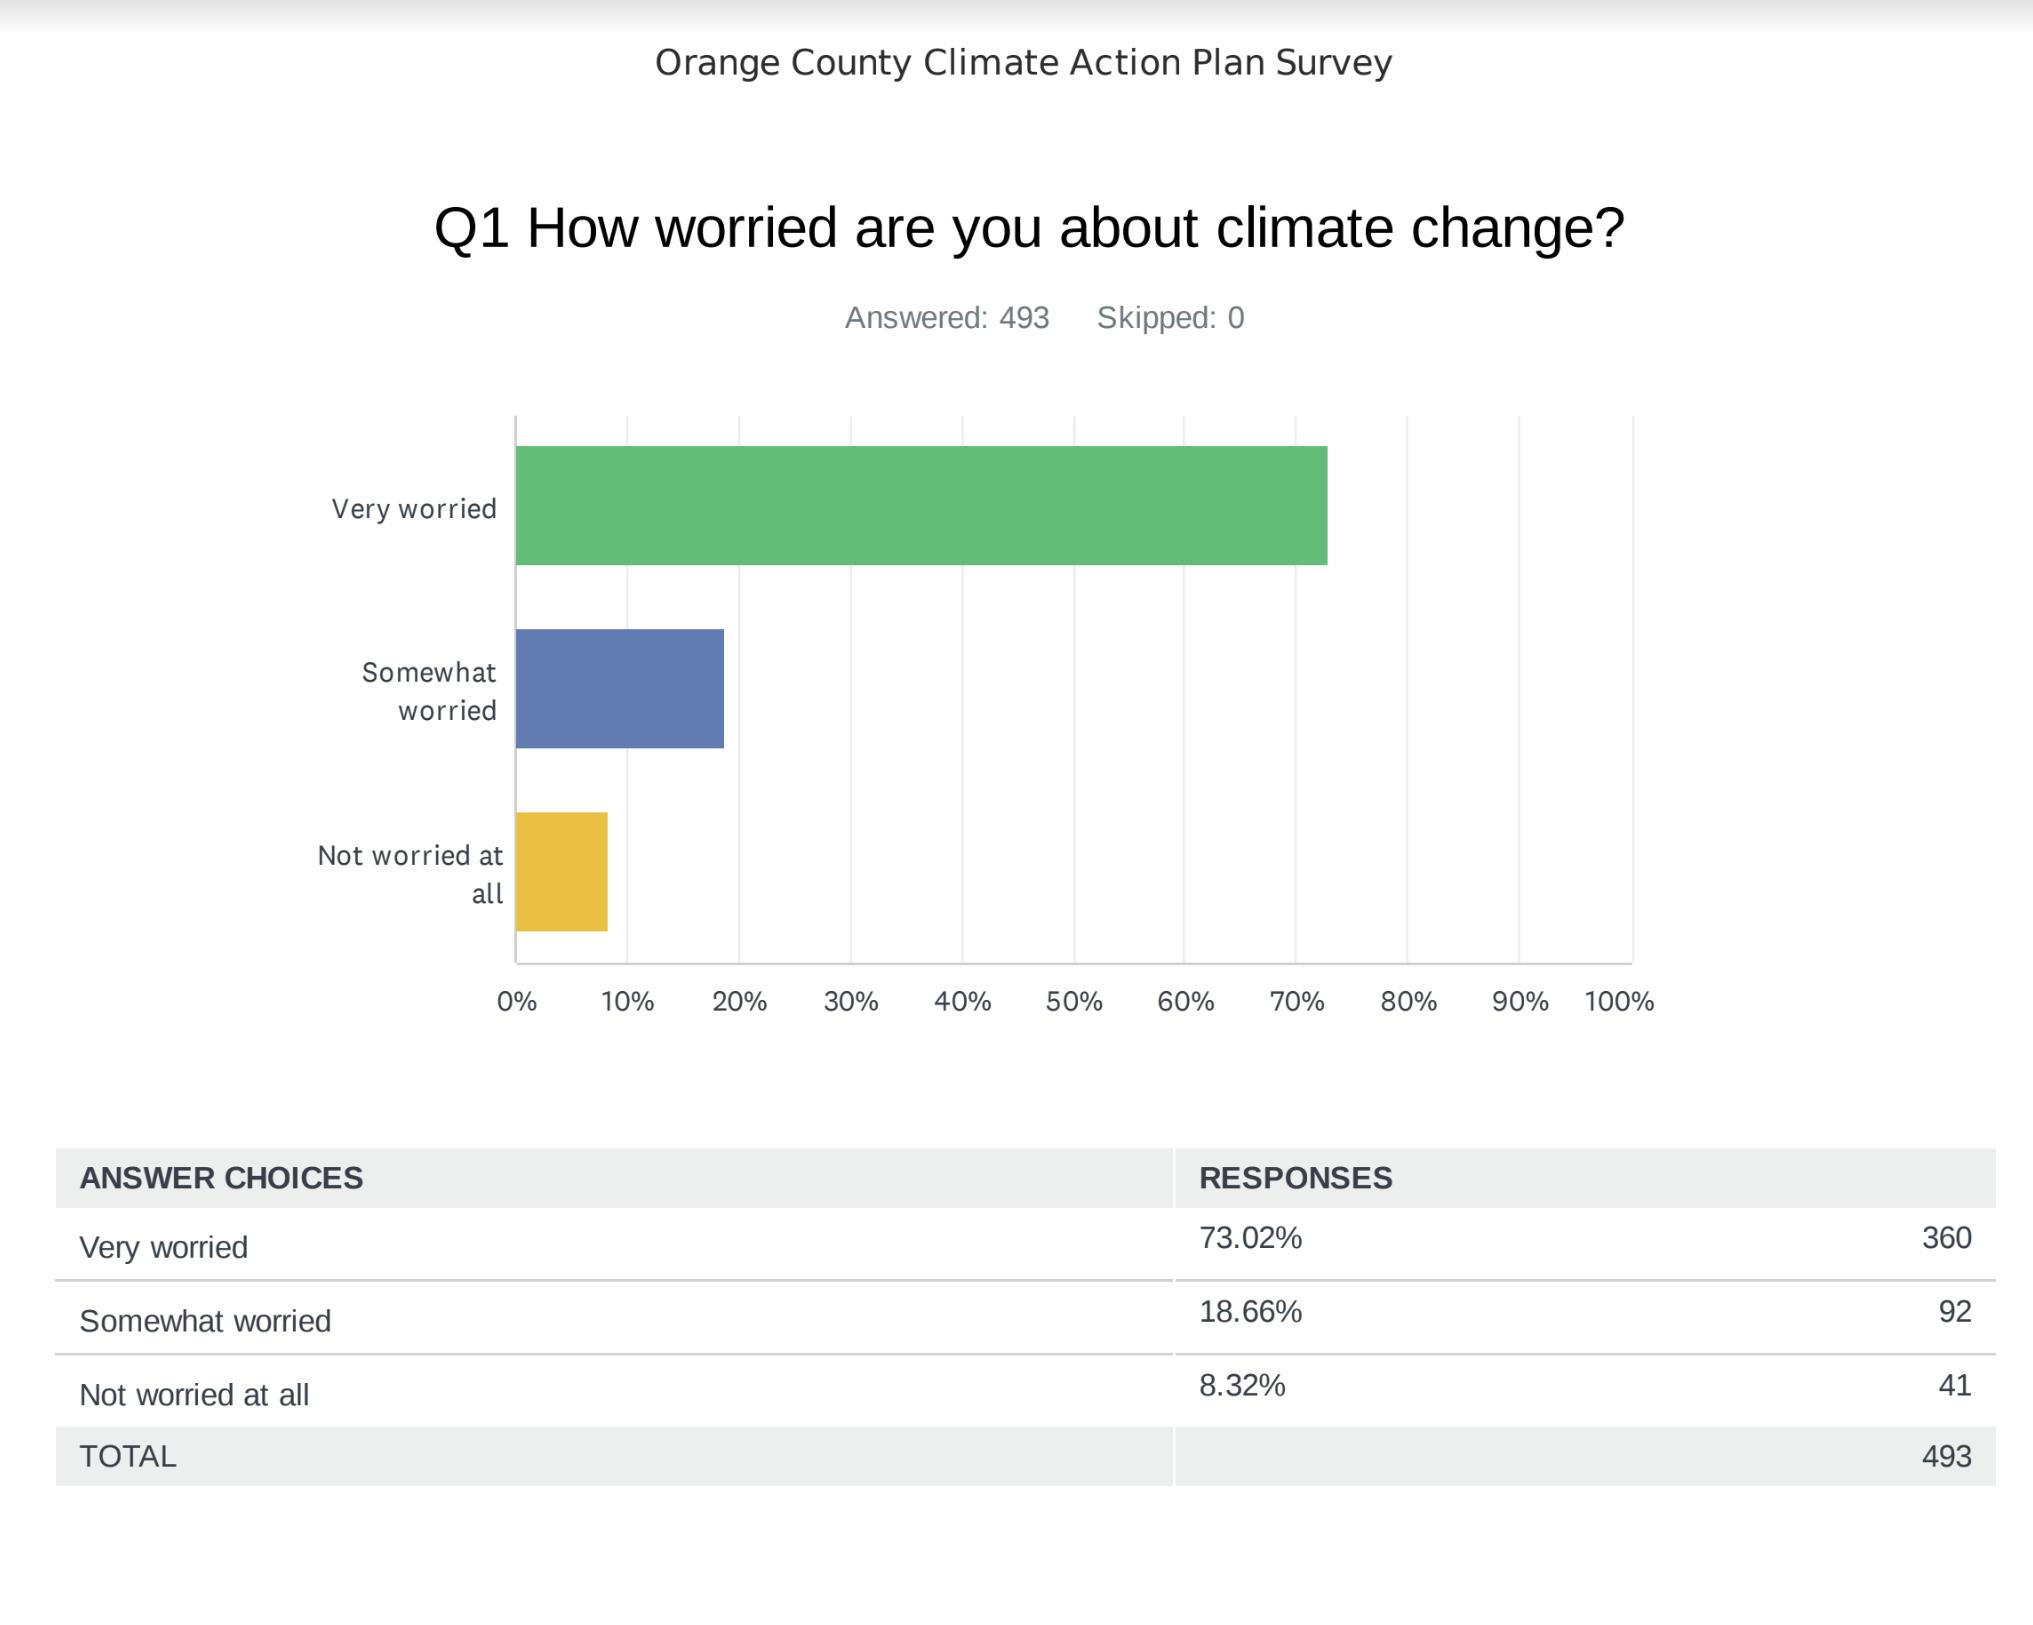
IMAGE PROVIDED BY ORANGE COUNTY, NC.
SCOPE S 1&2
GOALS AND STRATEGIES
RESILIENT COMMUNITY

GREEN COMMUNITY
COMMUNICATIONS GOVERNANCE
TRANSPORTATION
RESOURCE CONSERVATION
BUILT ENVIRONMENT AND ENERGY
As part of this process, the County reviewed current policies and programs and produced a comprehensive, annotated list of high-impact strategies that could be analyzed and prioritized based on feasibility, financial considerations, health benefits, and equity. In addition, many opportunities and barriers were considered as part of this process.
IMAGE
Transportation is the largest source of emissions within Orange County, with 43% of all community emissions coming from vehicle miles traveled (VMT) and 33% of County operations emissions coming from employee commutes; therefore, reducing fossil fuel vehicle travel is imperative. By increasing active transit like walking and biking and helping create a walkable and bikeable County, public health and social connectivity will be increased. The strategies and actions in this section are designed to make alternatives to single-occupant, fossil fuel trips easy, convenient, and attractive to residents and visitors. It is also critical to understand the impact of careful land use planning and its effect on sprawl and subsequent VMTs.
One of the Top 10 things the County should do is to transition all community-wide vehicles away from fossil fuel. This follows North Carolina’s Executive Order 246 which calls for an increase in registered zero-emission vehicles to at least 1,250,000 by 2030 and for 50% of sales of new vehicles in North Carolina to be zero-emission by 2030. The County expects this guidance to continue its trajectory of 100% of sales of new vehicles by 2050. The County will need to ramp up education and charging infrastructure to support this transition.
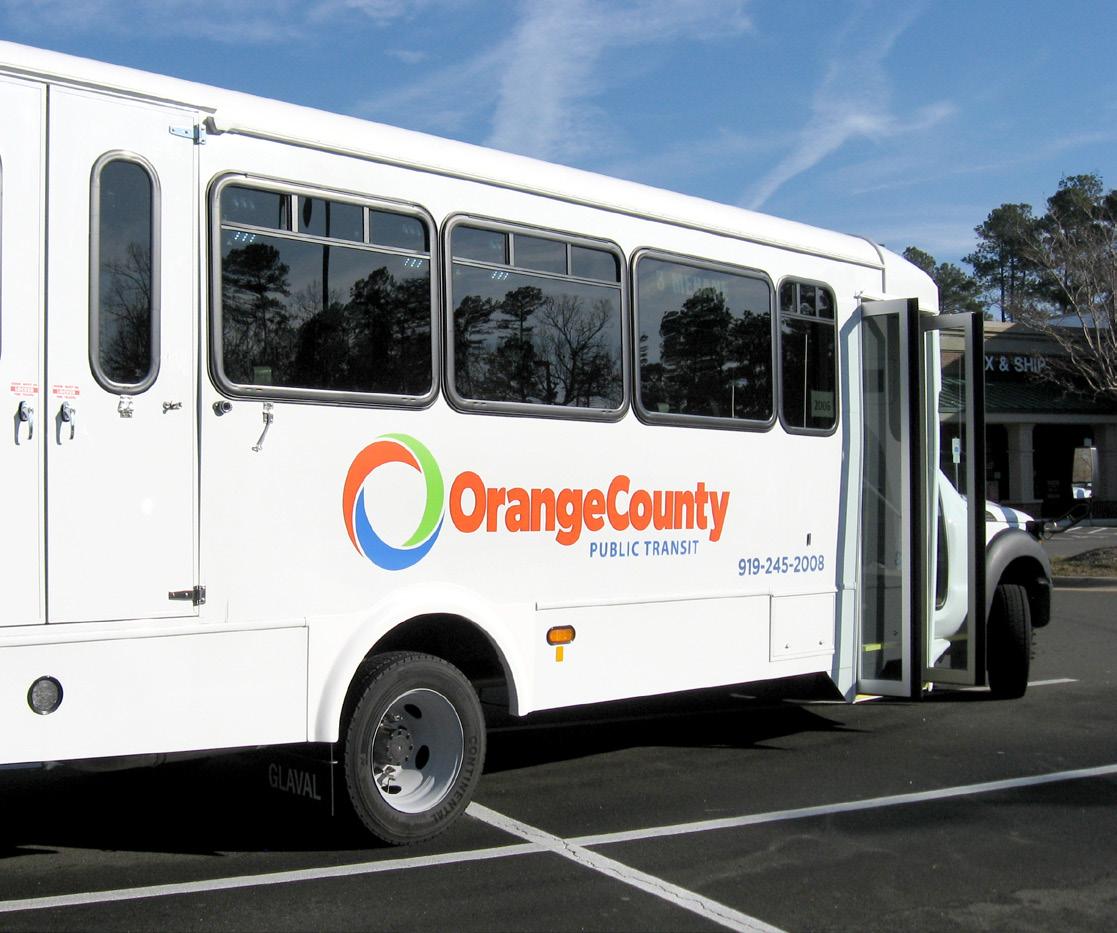
IMAGE PROVIDED BY ORANGE COUNTY, NC.
TRANSPORTATION
GOAL 1
T 1 ENHANCE AND DIVERSIFY PUBLIC TRANSPORTATION
TARGET
DECREASE VMT 30% FROM A 2019 BASELINE BY 2050
STRATEGY ACTION
T 1.1
Continue updating and executing the Orange County Transit Plan, addressing service gaps in Northern OC and scheduling issues
TIER: FOUNDATIONAL
PRIORITY SCORE: 4.38
CO-BENEFITS:

T 1.1.1
Hire a Transportation Demand Management Coordinator utilizing grant funding
T 1.1.2
Implement changes to address service gaps in Northern and Southern OC by 2030
T 1.1.3
Extend service hours by 3% and locations by 6% by 2030
STRATEGY ACTION
T 1.2
Transition to smaller, energyefficient buses or vans during peak hours, providing efficient and reliable services
TIER: FOUNDATIONAL
PRIORITY SCORE: 3.88
CO-BENEFITS:
T 1.2.1
Expand County fleet and transition to all electric vehicles
T 1.2.2
Expand peak schedules to ensure efficient and reliable services in response to measured demand
STRATEGY ACTION
T 1.3
Explore innovative public transportation options
TIER: FOUNDATIONAL
PRIORITY SCORE: 3.88
CO-BENEFITS:
T 1.3.1
Conduct a comprehensive study on successful micro mobility programs in other regions for reference and insight; (e.g. Shared bike/car/scooter programs) which could be applied within each town or county-wide
T 1.3.2
Carry out stakeholder engagement to understand local commuting needs and identify key locations that would benefit from micro-transit
T 1.3.3
Expand Orange County fixed routes, demand response and Mobility on Demand services across the County
GOALS LOOKING TO 2050
TRANSPORTATION
GOAL 2
T 2 IMPROVE ORANGE COUNTY COMMUTER OPTIONS (OCCO) PROGRAM
TARGET
DECREASE VMT 30% FROM A 2019 BASELINE BY 2050

T 2.1
Initiate pilot marketing campaigns that use innovative means/ methods to inform community about public transportation options/programs/incentives STRATEGY
TIER: FOUNDATIONAL
PRIORITY SCORE: 3.25
CO-BENEFITS:
T 2.1.1
Partner with Health Department on messaging campaigns to emphasize health benefits of commuting (cleaner air) and walkability using active transportation practices (walking, biking, micro-mobility, etc.)
STRATEGY
T 2.2
Partner with chamber networks and the Regional Transportation Alliance to develop education programs around the Orange County Commuter Options program and similar multimodal transportation solutions for private businesses
TIER: FOUNDATIONAL PRIORITY SCORE: 4.88
CO-BENEFITS:
T 2.2.1
Collaborate with chamber networks to host one Orange County Commuter Options program seminar annually
T 2.2.2
Expand Regional Transportation Alliance outreach within the private sector
GOAL
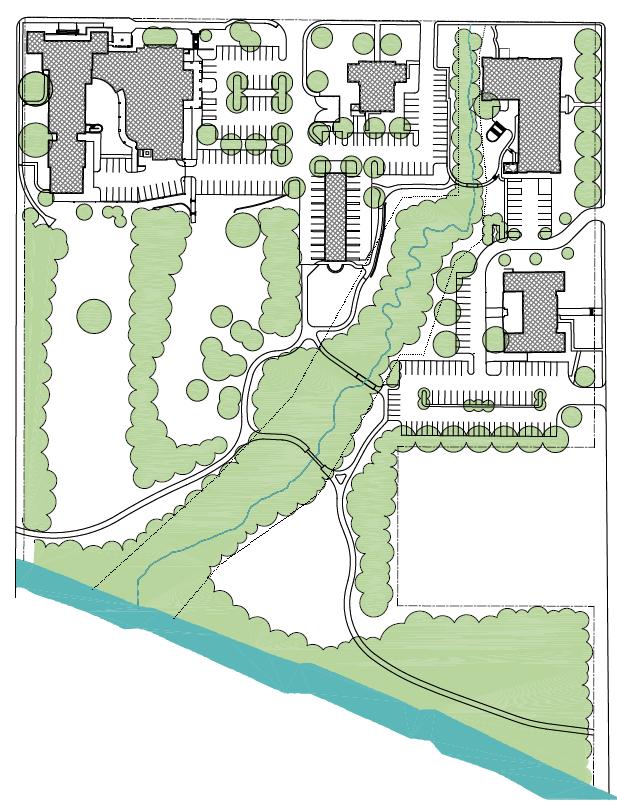
TRANSPORTATION
General Conditions and Adequacy for Intended Purpose and Uses:
The park requires and receives a moderate level of maintenance by a mobile crew.
Future Phase:
Phase 2 of the Park is expected to include these additional features and amenities:
Event/Performance Gazebo
T 3 PROMOTE CYCLING AND WALKING AS SUSTAINABLE TRANSPORTATION OPTIONS
Fencing improvements
TARGET DECREASE
Bridge and Trail improvements
Additional Notes:
VMT 30% FROM A 2019 BASELINE BY 2050
Planning is underway for a crosswalk/sidewalk connector from the west side of Churton Street into the park.
STRATEGY ACTION
T 3.1
Publicize and promote greenway trails and multi-modal transit lanes as an alternative means of transportation through Parks and Recreation educational programs, special events, promotions, outreach and marketing efforts
TIER: FOUNDATIONAL
PRIORITY SCORE: 3.88
CO-BENEFITS:
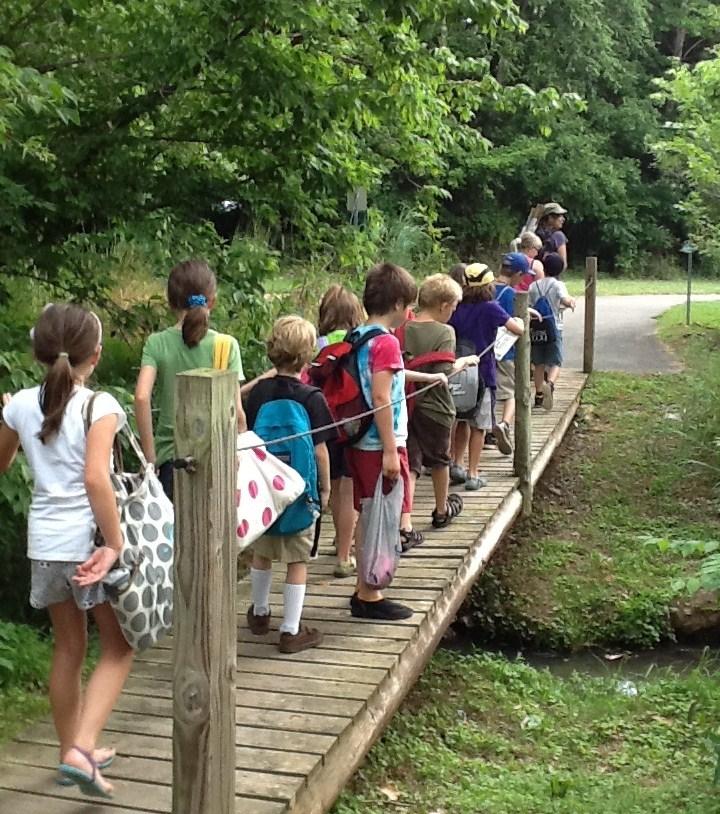
T 3.1.1
Develop greenways and other trails between towns for recreation and commuting - promoting connectivity, safety and a sustainable mode of travel
T 3.1.2
Cross promote rides and educational programs with Parks and Recreation and Health Department to emphasize the health benefits of active transportation (walking, biking, micro-mobility, etc.)
T 3.1.3
Partner with local bike shops and bike clubs to provide programs on bike safety and coordination around community-wide bike ride events
STRATEGY ACTION
T 3.2
Create a micro-mobility subsidy program that provides higher subsidies for low income residents town and county-wide. Similar to what City of Raleigh and Denver have done with e-bikes
TIER: FOUNDATIONAL
PRIORITY SCORE: 4.38
CO-BENEFITS:
T 3.2.1
Develop a Micro-Mobility Subsidy Allocation Plan: In collaboration with local stakeholders and transportation experts, develop a plan that outlines the structure of the micro-mobility subsidy program
T 3.2.2
Implement a Subsidy Application and Distribution Process: Create a clear and accessible application process for residents to apply for the micro-mobility subsidy
IMAGE SOURCE: OC 2030 PARKS & REC. MASTER PLAN.
TRANSPORTATION
GOAL
T 4 INCREASE EV INFRASTRUCTURE AND ADOPTION
TARGET
TRANSITION THE COUNTY'S FLEET TO ALL ELECTRIC BY 2035

T 4.1
Continue efforts to introduce more EVs into the County's fleet STRATEGY
TIER: FOUNDATIONAL PRIORITY SCORE: 3.13
CO-BENEFITS:
ACTION
T 4.1.1
Implement “EV-first” vehicle purchasing policy to ensure that EVs are considered as the primary replacement option for every vehicle
T 4.1.2
Develop an EV maintenance training program and training on how to address and provide EV road assistance
T 4.1.3
Conduct a review of charging infrastructure deployment, with an emphasis on rural connectivity, by 2025
T 4.1.4
Develop a policy to reimburse County staff who charge County vehicles at their personal residence
GOALS
LOOKING TO 2050
TRANSPORTATION
GOAL
T 4 INCREASE EV INFRASTRUCTURE AND ADOPTION (CONT.)
TARGET
INCREASE COMMUNITY EV ADOPTION TO 50% BY 2035 AND 100% BY 2050
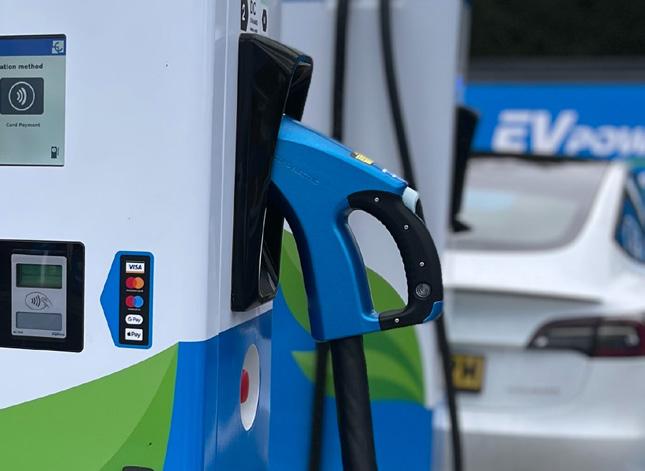
T 4.2
Accelerate the transition to EVs in the community through advocacy, education and awareness STRATEGY ACTION
TIER: FOUNDATIONAL
PRIORITY SCORE: 5.00
CO-BENEFITS:
T 4.2.1
Increase number of EV charging stations community-wide
T 4.2.2
Apply for grants for EV infrastructure expansion
T 4.2.3
Create an EV playbook for businesses detailing different levels of chargers, electrical capacity, and the process for installing EV chargers
T 4.2.4
Partner with Triangle Clean Cities and/or NC State Clean Technology Center to host an annual EV webinar/workshop for residents and commercial businesses
T 4.2.5
Add screening/landscaping/shade standards for County EV charging stations
T 4.2.6
Prepare and improve County capabilities to respond to EV-related emergencies
T 4.2.7
Support the transition to EV buses at schools county-wide
T 4.3
Explore the idea of providing rental EVs as an additional transportation option STRATEGY ACTION
TIER: FOUNDATIONAL
PRIORITY SCORE: 3.88
CO-BENEFITS:
T 4.3.1
Conduct feasibility study for a rental EV program
T 4.3.2
Pilot a rental EV program at a strategic location
T 4.3.3
Develop an EV ambassador program: For example, current EV drivers who can show off their vehicles at farmer's markets and participate in events like National Drive Electric Week to provide education/answer questions
GOALS LOOKING TO 2050
GOAL
T 5 CONTINUE AND EXPAND ANTI-IDLING INITIATIVES
TARGET
INCREASE NUMBER OF SCHOOLS PARTICIPATING IN ANTI-IDLING INITIATIVES BY TWO SCHOOLS PER YEAR FROM 2031 TO 2035
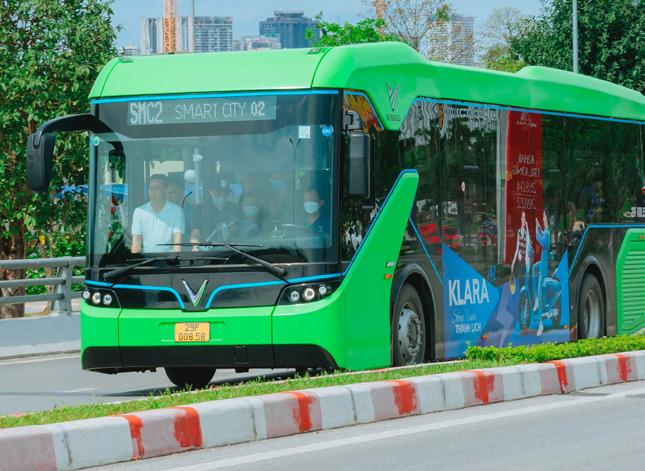
STRATEGY
T 5.1
Expand the "Driving is Exhausting" public education campaign
TIER: COMPLEMENTARY
PRIORITY SCORE: 3.13
CO-BENEFITS:
ACTION
T 5.1.1
Continue to partner with local schools to incorporate anti-idling signage at school drop-off/pick-up zones
T 5.1.2
Expand anti-idling program to County fleet operations to include an antiidling policy and education campaigns
BUILT ENVIRONMENT & ENERGY
Following transportation, commercial buildings contribute the second highest emission percentage at 34%. The next greatest contributor is residential energy which emits 19% of the total.
Buildings offer a unique opportunity to transition to a low carbon future. Buildings can reduce emissions in two ways. First, the energy efficiency of buildings can be improved. This reduces the need for carbon emitting energy from both electricity and natural gas. Second, gas-use equipment can be switched to electrical in both commercial and residential buildings. As utilities transition to 100% carbon-free renewable energy sources, building energy use will gradually become carbon free as a result.
To effectively manage the transition from gas to electric, electricity demand considerations should be kept in mind. As natural gas powered equipment is transitioned to electric equipment, the community will face changing electricity load patterns. These should be monitored, and planned for. Another consideration relates transportation strategies to electricity demand. For example, as the County and community transition their vehicles from internal combustion to all electric (EVs), EV charging stations may create spikes in energy usage for commercial and residential buildings. A concerted effort will need to be made on both the supply and demand side to ensure the transition to renewables is happening in a balanced way.

BUILT ENVIRONMENT & ENERGY
GOAL
B E 1 STRENGTHEN ENERGY EFFICIENCY AND CONSERVATION
TARGET
ACHIEVE 50% EMISSION REDUCTION TARGET OF ALL SCOPE 1 AND 2 EMISSIONS BY 2030 AND 100% BY 2050 USING A 2005 BASELINE
BE 1.1
Continue to strengthen policies for yearly reductions in energy use in County operations STRATEGY ACTION
TIER: FOUNDATIONAL
PRIORITY SCORE: 6.50
CO-BENEFITS:
BE 1.1.1
Achieve a 20% energy usage reduction in energy consumption by 2035 using a 2019 baseline BE 1.1.2
Install energy-efficient technologies in two County facilities each year from 2024–2029, prioritizing those facilities that have the highest energy use
BE 1.2
TIER: FOUNDATIONAL
PRIORITY SCORE: 5.25
CO-BENEFITS:
BE 1.2.1
Replace traditional lighting with LEDs in all county facilities by 2030
BE 1.2.2
Continue the transition to efficient lighting and green infrastructure across all County facilities STRATEGY ACTION
Evaluate high energy use in two County buildings for deployment of green infrastructure measures, vertical gardens, and tree plantings, to reduce energy used to cool these buildings by 2030
BE 1.2.3
Transition to motion sensor lights that automatically turn off during evening hours
BUILT ENVIRONMENT & ENERGY
STRATEGY ACTION
BE 1.3
Advocate for policy-driven measures for energy efficiency in new construction for County facilities by recognizing green developers through newsletters and similar County communication networks
TIER: FOUNDATIONAL
PRIORITY SCORE: 5.25
CO-BENEFITS: GOALS LOOKING TO 2050
BE 1.3.1
Provide an exhaustive list of all possible commercial and residential rebate programs on the County’s website (BE 4.1)
BE 1.3.2
Advocate for energy efficient building codes with the North Carolina Building Code Council
BE 1.4
Promote energy-saving behaviors through comprehensive education and incentive programs STRATEGY ACTION
TIER: SUPPORTIVE
PRIORITY SCORE: 5.38
CO-BENEFITS:
BE 1.4.1
Launch annual energy-saving education program to encourage actions such as turning off lights, powering down computers, and conducting energy audits
LOOKING TO 2050
BUILT ENVIRONMENT & ENERGY
GOAL
B E 2 EXPAND RENEWABLE ENERGY USAGE
TARGET ACHIEVE 100% RENEWABLE ENERGY BY 2050 IN MUNICIPAL AND COMMUNITY SECTORS
STRATEGY ACTION
BE 2.1
Proactively adopt and expand the use of clean energy solutions within County facilities and the community
TIER: FOUNDATIONAL
PRIORITY SCORE: 5.50
CO-BENEFITS:

BE 2.1.1
Complete a solar siting survey for County facilities
BE 2.1.2
Consider adding electric battery storage to critical facilities and resilience hubs identified in CR 1.4.1
BE 2.1.3
Regularly monitor, review, and comment on utility programs and legislative proposals impacting the adoption of clean energy in the County to ensure they align with the County's climate action goals
BE 2.1.4
Provide training to staff on maintenance of renewable energy systems
BE 2.1.5
Allocate funding to maintain municipal renewable energy systems
STRATEGY ACTION
BE 2.2
Explore partnerships and funding opportunities to address barriers to renewable energy adoption, tapping into Inflation Reduction Act (IRA) funding
TIER: FOUNDATIONAL
PRIORITY SCORE: 6.50
CO-BENEFITS:
BE 2.2.1
Participate in Duke Energy's “Green Source Advantage Choice” program to secure renewable energy from projects connected to the Duke Energy grid
BE 2.2.2
Incorporate the 10-year avoided cost bill credit option that Duke Energy is offering to receive a rebate for the cost of avoided utility infrastructure expenses
BE 2.2.3
Secure IRA funding for four renewable energy projects by 2035
STRATEGY ACTION
BE 2.3
Leverage parking lots to apply solar canopies to increase renewable energy generation and to combat urban heat island effects
TIER: FOUNDATIONAL
PRIORITY SCORE: 6.00
CO-BENEFITS:
BE 2.3.1
Include analysis on locations as part of the Solar Siting Survey (BE 2.1.1)
LOOKING TO 2050
BUILT ENVIRONMENT & ENERGY
GOAL
B E 2 EXPAND RENEWABLE ENERGY USAGE
TARGET
INCREASE THE % OF COMMUNITY-WIDE SOLAR BY 25% BY 2035
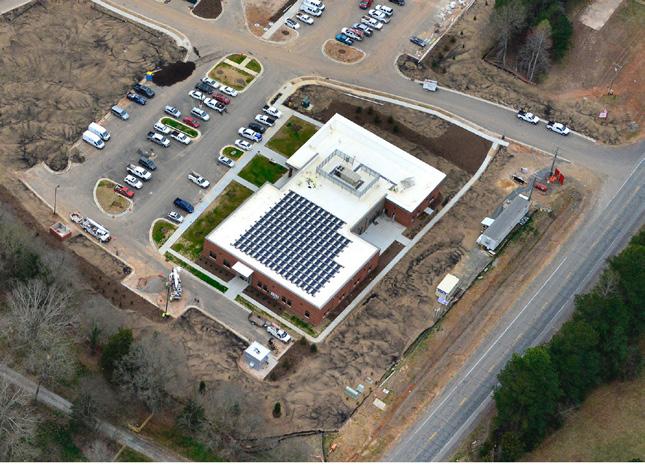
BE 2.4
Continue to release rounds of the "Solarize the Triangle" program which would work to install solar on residences, businesses and nonprofits in Orange County
TIER: FOUNDATIONAL
PRIORITY SCORE: 6.50
CO-BENEFITS:
BE 2.4.1
Release rounds of "Solarize the Triangle" as frequently as possible
BE 2.4.2
Pursue Sol Smart designation at the Gold or Platinum level
BE 2.4.3
Expand funding for “Solarize the Triangle” to low and moderate income households
BE 2.5
Implement an expedited permitting process for all new solar projects across the County STRATEGY ACTION
TIER: FOUNDATIONAL
PRIORITY SCORE: 6.50
CO-BENEFITS:
BE 2.5.1
Work with Planning Department to expedite permitting process for all new solar projects
STRATEGY ACTION
BE 2.6
Convene stakeholders to attend Focus Group/design charette to discuss capacity, implementation and design of agro voltaics and community solar projects
TIER: FOUNDATIONAL
PRIORITY SCORE: 6.50
CO-BENEFITS:
BE 2.6.1
Establish a Working Group as part of the annual Ag Summit
BE 2.6.2
Utilize the seed funding for County’s Cooperative Extension and Sustainability to launch this discussion
GOALS
LOOKING TO 2050
GOAL
BUILT ENVIRONMENT & ENERGY
B E 3 PROMOTE ELECTRIFICATION
TARGET
COMPLETE AN ELECTRIFICATION STUDY AND ESTABLISH A LONG-TERM IMPLEMENTATION PLAN (PHASE 1 AND PHASE 2) FOR BOTH MUNICIPAL AND COMMUNITY INFRASTRUCTURE BY 2025
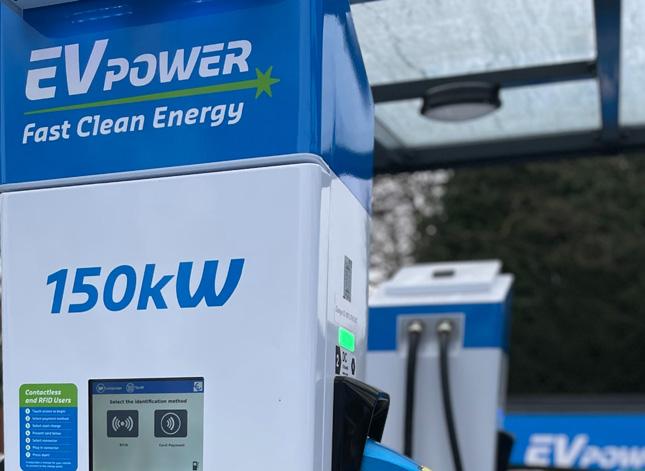
STRATEGY
BE 3.1
Facilitate the transition from natural gas to electricity, providing support in terms of funding, resources, and branding
TIER: FOUNDATIONAL
PRIORITY SCORE: 6.50
CO-BENEFITS:
ACTION
BE 3.1.1
Support energy efficiency programs and partners that provide energy efficiency services and education that reduce emissions, improve standards of living, support the local economy and bolster workforce development in historically-disadvantaged communities
BE 3.1.2
Release rounds of the “Electrify the Triangle” program which would work to install EV chargers, induction ovens, electric heat pumps, etc. in the community
BE 3.1.3
Write Phase 1 and Phase 2 plans incorporating BE 3.1.1 & BE 3.1.2 actions and the health benefits of electrification
BUILT ENVIRONMENT & ENERGY
Orange County Comprehensive Parks and Recreation Master Plan
LOOKING TO 2050
GOAL
B E 4 ENHANCE PUBLIC EDUCATION AND ACCESSIBILITY OF RESOURCES
TARGET
CHAPTER 8 - Economic, Health and Environmental Impacts of Parks and Recreation
STRENGTHEN THE COUNTY'S ROLE AS AN ACTIVE RESOURCE TO THE LOCAL BUSINESS AND RESIDENTIAL COMMUNITY
STRATEGY
BE 4.1
Re-design sustainability website for “one-stop-shop” information that educates public on the County's Climate Action Plan and sustainability practices, offering a centralized platform for information and resources
TIER: COMPLEMENTARY
PRIORITY SCORE: 2.50
CO-BENEFITS:
BE 4.1.1
Launch the website by December 31, 2024
BE 4.1.2
Destinations have multiple levels and types of products and services (i.e., hotels, restaurants, gas stations, attractions) that are brought together to form the overall tourism experience. Each component or element of the destination is a product in and of itself. “The attractions of a destination constitute the most powerful component of the supply side of tourism.” 14 Most public parks and recreation facilities and services fall into the attraction category. Crompton (2010) explains that in many communities, most tourism attractions are developed and/or operated by the public and nonprofit agencies, many of which are parks and recreation related. Therefore, tourism in most communities is heavily reliant on public park and recreation agencies.12
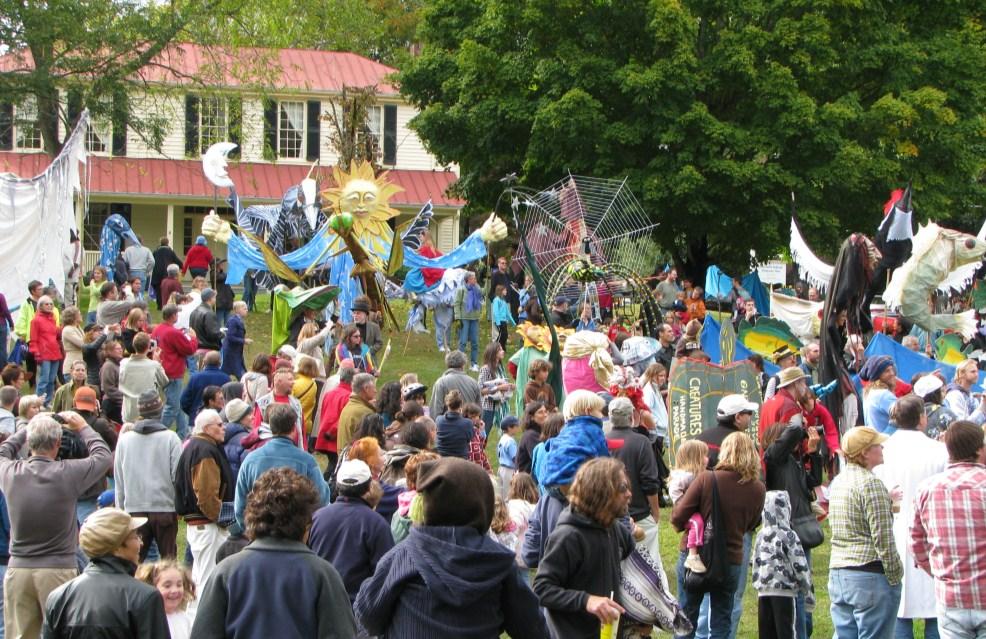
Compile a list of funding sources that local residents, businesses, or the County could potentially access to fund energy audits and energy efficiency improvements
BE 4.1.3
Develop and provide educational kits through the library and community groups to help with home energy audits and energy improvement education, summarizing information from the “one-stop-shop” website to create accessible resources
Most of the outdoor recreation space that is utilized by tourists in the United States is owned by a governmental agency (federal, state, or local). Many of the historical and cultural attractions in a community are located at a public park or in a public facility.15 Public parks and recreation facilities and services are a vital part of the tourism offerings in a community.
STRATEGY ACTION
BE 4.2
Develop a program to support businesses in adopting sustainable practices
TIER: SUPPORTIVE PRIORITY SCORE: 5.25
CO-BENEFITS:
BE 4.2.1
Launch a sustainable business toolkit for businesses by 2026
BE 4.2.2
For example, athletic fields used to host tournaments will draw players and fans from areas outside the local community. Those individuals traveling to the community to play in the tournament will need basic tourism services such as lodging and restaurants. The tournament, which may be run by the local parks and recreation agency, is the attraction. The facilities (i.e., fields, locker rooms, picnic shelters) that are being used are a requirement for the tournament to be held and are also considered attractions.
One of the emerging trends for travelers desire to stay healthy and fit while Tourists often desire places to run, walk, bike, and play. Local parks and recreation provide tourists with these opportunities. It as simple as a tourist running on one of parks and recreation department’s maintained playing basketball at the local park, or taking a group exercise class. Other examples of using park and recreation facilities could having a picnic at a community park, attending festival and/or taking a nature walk. The main ence between parks and recreation facilities attractions and those that are not is the manner which they are managed. For a facility or truly be considered an attraction it must aged with an understanding that tourists the facility and therefore policies and practices be in place to make the tourist welcome.
Develop an EV “playbook” for businesses/homes that provides guidance on EV charger installations and incentives
STRATEGY ACTION
BE 4.3
Develop a volunteer energy ambassador program. Use ambassadors to provide education about energy saving tips and resources
TIER: COMPLEMENTARY PRIORITY SCORE: 5.38
CO-BENEFITS:
BE 4.3.1
Staff tables at outreach events; Energy ambassadors staff informational tables at local events, engaging attendees with energy-saving tips and resources
BE 4.3.2
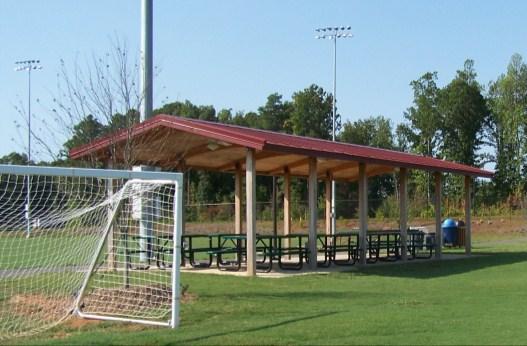
8 4
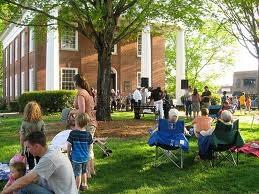
Host a community-wide event showcasing energy conservation, featuring workshops, exhibits, and expert speakers
IMAGE SOURCE: OC 2030 PARKS & REC. MASTER PLAN.
GOALS
LOOKING TO 2050
BUILT ENVIRONMENT & ENERGY
GOAL B E 5 ADVANCE
SUSTAINABLE BUILDING PRACTICES
TARGET IMPROVE BUILDING
PERFORMANCE WITH ALL NEW CONSTRUCTION AND RETROFITTING PROJECTS
STRATEGY ACTION
BE 5.1
Formalize and enhance the commitment to achieving LEED standards for County facilities
TIER: SUPPORTIVE
PRIORITY SCORE: 3.13
CO-BENEFITS:
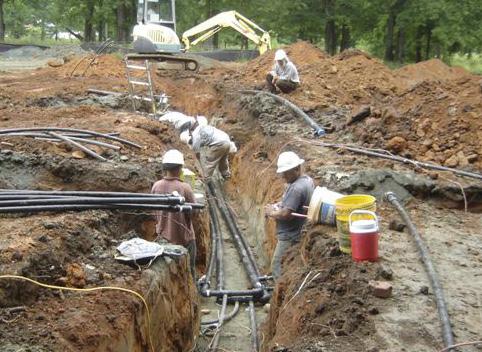
BE 5.1.1
Comply with LEED standards for all new construction of County facilities
STRATEGY ACTION
BE 5.2
Encourage the use of geothermal ground-source heat pumps in more County buildings (where appropriate), based on the success of current implementations
TIER: SUPPORTIVE PRIORITY SCORE: 3.13
CO-BENEFITS:
BE 5.2.1
Evaluate for geothermal heat pumps in County buildings
BE 5.2.2
Leverage the commitment of US Climate Alliance to fund heat pump projects
BE 5.2.3
Identify low income households and educate them on Inflation Reduction Act funding available for geothermal ground-source heat pumps
STRATEGY ACTION
BE 5.3
Encourage County staff to research green building materials/methods in order to conduct engineering work in-house to lower cost
TIER: SUPPORTIVE PRIORITY SCORE: 3.00
CO-BENEFITS:
BE 5.3.1
Set up a Train-the-Trainer model to share research County-wide
IMAGE
GOALS
LOOKING TO 2050
RESOURCE CONSERVATION
Waste disposal, water use and product consumption all contribute to overall GHG emissions. The effects of these activities can be reduced by making mindful choices to conserve the resources we use. Orange County has access to many resources to better support a circular economy. The overarching approach to resource conservation is to create a consistent framework of outreach resources and developing public private partnerships to disseminate those resources. Conservation measures are about changing community habits and connecting residents with the right solutions.

RESOURCE CONSERVATION
GOAL
RC 1 IMPLEMENT THE 2023-2045 SOLID WASTE MASTER PLAN
TARGET ACHIEVE ZERO WASTE BY 2045
STRATEGY ACTION
RC 1.1
Expand the existing reuse network with partner organizations, improving the ability to divert waste and increase the reuse of items within the County; as outlined in the 2023-2045 Solid Waste Master Plan (in support of BE 4.1)
TIER: SUPPORTIVE
PRIORITY SCORE: 3.25
CO-BENEFITS:

RC 1.1.1
Focus on expanding the reuse network of participating organizations; add resources to the website. Examples include North Carolina’s Waste Trader, Austin’s reuse marketplace, and Tennessee’s reuse marketplace
RC 1.1.2
Identify and increase accepted reuse items and report tonnage each year in overall diversion; add resource to website
RC 1.1.3
Promote local organizations that sell new and used furniture, building materials, appliances and household goods at discounted prices; add resource to website
RC 1.1.4
Distribute information about electric appliance rebates as community members drop off old gas appliances at the County Solid Waste Convenience Centers; add resource to website
RC 1.1.5
Make a list of organizations who accept reuse items and promote buying less
STRATEGY ACTION
RC 1.2
Partner with local businesses and nonprofit organizations to build a comprehensive reuse program for items such as pallets, takeout containers, electronics and school supplies
TIER: COMPLEMENTARY
PRIORITY SCORE: 3.25
CO-BENEFITS:
RC 1.2.1
Regularly track and report the program's impact on waste reduction; add resource to website (BE4.1)
RC 1.2.2
Consider expanding Repair Café North Carolina events in Orange County at libraries where residents can go to get help repairing common household items and electronics to keep them in circulation longer
RESOURCE CONSERVATION
STRATEGY ACTION
RC 1.3
Promote policies and incentives to eliminate non-essential single-use plastics and prioritize reusable food ware and utensils
TIER: SUPPORTIVE
PRIORITY SCORE: 2.00
CO-BENEFITS:
RC 1.3.1
Promote a “Don’t Waste Orange County” program, similar to Durham’s Green to Go program
RC 1.3.2
Create a policy prioritizing compostable options over singleuse plastics in County operations
STRATEGY ACTION
RC 1.4
Identify future programs, initiatives, facilities, and infrastructure to achieve the Zero Waste goal, as defined by the County, while ensuring the long-term financial stability of the County’s solid waste and recycling program
TIER: COMPLEMENTARY
PRIORITY SCORE: 3.25
CO-BENEFITS:
RC 1.4.1
Launch annual community Zero Waste workshop in partnership with the Solid Waste Department
RC 1.4.2
Add Extended Producer Responsibility (EPR) language to the Solid Waste Ordinance to require product manufacturers to take back hard to recycle items (e.g. carpet, paint, and mattresses)
RC 1.4.3
Create innovation Partnerships with UNC & UNC Health System
RC 1.4.4
Create County-level commercial and multifamily recycling requirements
RC 1.4.5
Offer multiple cart sizes
RC 1.4.6
Implement deconstruction ordinance updates
STRATEGY ACTION
RC 1.5
Evaluate the potential of a curbside composting program, backed by a County-led educational campaign on the importance and benefits of composting
TIER: SUPPORTIVE PRIORITY SCORE: 3.13
CO-BENEFITS: GOALS LOOKING TO 2050
RC 1.5.1
Complete a feasibility study for a curbside composting program by 2028 as part of the County's updated waste hauler agreement
RC 1.5.2
Work with the Solid Waste Department to launch an educational campaign on composting benefits, in accordance with the 2023–2045 Solid Waste Master Plan
RESOURCE CONSERVATION
STRATEGY ACTION
RC 1.6
Examine the implementation of an edible food recovery program, potentially in partnership with local restaurants and food pantries
TIER: SUPPORTIVE
PRIORITY SCORE: 4.38
CO-BENEFITS:
RC 1.7
RC 1.6.1
Work with Cooperative Extension and other partners to expand funding to build out the food recovery program
Work with the Solid Waste Department to conduct a post consumer waste audit of County facilities STRATEGY ACTION
TIER: SUPPORTIVE PRIORITY SCORE: 2.00
CO-BENEFITS: GOALS LOOKING TO 2050
RC 1.7.1
Select one dumpster from County facilities that would be emptied and sorted into material type
RC 1.7.2
Make a list of items that are not recyclable
RC 1.7.3
From this list, pinpoint where these non recyclable items are being generated and determine how to eliminate them completely
RESOURCE CONSERVATION
GOAL
RC 2 PROMOTE WATER CONSERVATION
TARGET
ACHIEVE 35% REDUCTION IN MUNICIPAL AND COMMUNITY WATER USAGE BY 2035 FROM 2019 BASELINE
STRATEGY ACTION
RC 2.1
Continue to install water-saving devices such as aerators and dual handles in County facilities and broaden these efforts to include other water-saving technologies in partnership with all water providers
TIER: SUPPORTIVE
PRIORITY SCORE: 2.50
CO-BENEFITS:
RC 2.1.1
Install water-saving devices in at least two additional County facilities annually. (i.e low flow)
RC 2.1.2
Regularly review and upgrade to newer water-saving technologies
STRATEGY
RC 2.2
Collaborate with educational institutions and the wider community to increase awareness about water-saving practices
TIER: COMPLEMENTARY
PRIORITY SCORE: 2.00
CO-BENEFITS:
RC 2.2.1
Utilize parks and other County owned facilities as demonstration areas that also include interpretive educational signage on sustainable water saving practices
RC 2.2.2
Distribute water-saving practice stickers in County facilities and residential properties and add “These use trees” stickers on all paper towel dispensers
RC 2.2.3
Provide water conservation kits in partnership with all water providers
IMAGE
RESOURCE CONSERVATION
STRATEGY ACTION
RC 2.3
Analyze facility design and usage to pinpoint opportunities for water conservation, including restrooms and optimized heating and cooling systems
TIER: SUPPORTIVE
PRIORITY SCORE: 1.50
CO-BENEFITS:
RC 2.3.1
Conduct annual audits of County facilities to identify water-saving and energy-saving opportunities
RC 2.3.2
Implement identified savings measures in at least four facilities by 2030
STRATEGY ACTION
RC 2.4
Transition 20% of the community water supply to recycled water by 2035
TIER: SUPPORTIVE
PRIORITY SCORE: 3.61
CO-BENEFITS:
RC 2.4.1
Consider implementing a Rainwater Rewards program similar to the City of Raleigh to help businesses and residences capture stormwater runoff, reduce flood impacts, and help prevent water pollutants from entering storm drains and streams
RC 2.4.2
Transition landscaping irrigation for all County facilities to greywater systems
RESOURCE CONSERVATION
RC 3 PROMOTE A SUSTAINABLE SUPPLY CHAIN
TARGET
STRATEGIZE AND ESTABLISH A COUNTY-WIDE SUSTAINABLE PROCUREMENT POLICY
STRATEGY ACTION
RC 3.1
Transition at least one procurement item annually to a recyclable, compostable, non landfill option through 2030
TIER: SUPPORTIVE
PRIORITY SCORE: 2.00
CO-BENEFITS:

RC 3.1.1
Identify item(s) using the list from the waste audit as outlined in Action RC 1.7.1
STRATEGY ACTION
RC 3.2
Eliminate purchasing of disposable or single-use plastics for nonessential uses for County operations
TIER: SUPPORTIVE
PRIORITY SCORE: 3.13
CO-BENEFITS:
RC 3.2.1
Implement policy of only using reuse items for break rooms and meetings/events
RC 3.2.2
Buy bulk when available
RC 3.2.3
Develop a sustainable purchasing guide
STRATEGY
RC 3.3
Establish Sustainable Materials Purchasing Guidelines with a list of construction materials with low embodied GHG emissions
TIER: SUPPORTIVE
PRIORITY SCORE: 3.63
CO-BENEFITS:
RC 3.3.1
Add specific language to the RFP process to provide additional criteria points in the selection process
RC 3.3.2
Develop a Sustainable Construction Materials Purchasing Guidelines document by 2026
GREEN COMMUNITY
Living in a green community contributes to an improved quality of life by providing a range of benefits for residents, including improved health and well-being, increased morale, and cleaner air. There is a mental health aspect to walking the streets lined with old growth trees and having access to a connectivity of open space. Additional community benefits include sheltering us from the intense rays of the sun, cooling temperatures, providing resilience to flooding, and using the carbon sequestration benefits that trees provide. Students also learn better when they are surrounded by shade trees. Climate change has refocused our attention on providing a way of living that places people’s long term needs as a core value. These projects also directly and indirectly reduce GHG emissions.
A critical focus should remain on proper zoning to prevent sprawl and encourage high density within the County. Planning efforts will have long term impacts towards directly reducing GHG emissions, preserving the rural nature of the County and protecting regional wildlife corridors. This needs to remain a focus and a priority within the Climate Action Plan (CAP).
LOOKING TO 2050
GOAL
GREEN COMMUNITY
GC 1 ENHANCE GREEN INFRASTRUCTURE AND SUSTAINABLE LAND USE
TARGET
PRIORITIZE AND IMPLEMENT
NATURE-BASED SOLUTIONS IN THE COMMUNITY
STRATEGY ACTION
GC 1.1
Prioritize the conservation of green spaces in the County to serve as rural buffers against climate impacts, continuing the goal of conserving a significant portion of total County land area
TIER: FOUNDATIONAL
PRIORITY SCORE: 5.50
CO-BENEFITS:
GC 1.1.1
Monitor and report annually on the progress of the “Orange CountyChapel Hill-Carrboro Joint Planning Agreement and Land Use Plan” to the Board of County Commissioners
GC 1.1.2
Develop a long term conservation plan in the Comprehensive Land Use Plan (currently under development) that prioritizes rural buffers and antisprawl zoning
GC 1.1.3
Develop rural buffer standards across the County, with carve outs for municipalities and grandfathering in existing structures
GC 1.1.4
Examine current development within the rural buffer; rewrite the regulations to prevent further suburban developments
STRATEGY ACTION
GC 1.2
Continue and enforce policies that preserve a significant percentage of acreage from new developments, with an emphasis on natural landscapes and native plants
TIER: SUPPORTIVE PRIORITY SCORE: 5.38
CO-BENEFITS:
GC 1.2.1
Focus on connectivity of open space as outlined in the Eno New Hope Plan
GC 1.2.2
Support DEAPR Department to prioritize natural areas with highest natural value for preservation from development
GC 1.2.3
Maintain a Rural Buffer planning zone to limit urban sprawl for over 30 years
STRATEGY ACTION
GC 1.3
Reduce/eliminate amount of mowed/manicured lawns on County properties; replace with pollinator gardens and native grasses
TIER: SUPPORTIVE PRIORITY SCORE: 4.75
CO-BENEFITS:
GC 1.3.1
Transition landscaping at a minimum of two County buildings per year beginning in 2027
GC 1.3.2
Organize an event showcasing the County's green infrastructure and offer a “How to” for implementing at residential and commercial spaces
GOALS
LOOKING TO 2050
GREEN COMMUNITY
GOAL
GC 2 INCREASE THE TREE CANOPY COMMUNITY-WIDE
TARGET
GIVE AWAY 10,000 TREE SEEDLINGS IN 10 YEARS (1,000 A YEAR)

STRATEGY
GC 2.1
Create a Tree Master Plan, quantifying the value of trees to preserve and increase tree cover across the County
TIER: FOUNDATIONAL
PRIORITY SCORE: 4.00
CO-BENEFITS:
ACTION
GC 2.1.1
Develop a Tree Master Plan by 2029 to design an integrated system for irrigating and maintaining trees; incorporate the Commission for Environment’s No Net Loss policy for County-owned properties
GC 2.1.2
Utilize “community scientists,” residents that support tree inventory efforts; partner with Trees for the Triangle
GC 2.1.3
Organize a bi-annual tree giveaway program and a native plant sale/seed giveaway. Maintain and make available a list of local native plant growers
GC 2.1.4
Research planting strategies and resources such as SilvaCell systems
GOALS
LOOKING TO 2050
GREEN COMMUNITY
GOAL
GC 3 PROMOTE SUSTAINABLE AGRICULTURE
TARGET REPORT ON SUSTAINABLE FARMING PRACTICES EACH YEAR
STRATEGY
GC 3.1
Expand and promote initiatives within the agricultural space such as carbon sequestration and agro voltaics
TIER: COMPLEMENTARY PRIORITY SCORE: 4.38
CO-BENEFITS:
ACTION
GC 3.1.1
Launch two new initiatives or collaborations with local farms each year; prioritize carbon sequestration projects, crop rotation, the use of organic fertilizers, cover crops, etc.
GC 3.1.2
Direct the public to sustainable agriculture from research-based organizations such as Cooperative Extension and other land-grant institutional programs
GC 3.1.3
Attend the focus group as part of BE 2.6

GOALS
GOAL
GC 4 PROMOTE LOCAL FOOD SYSTEMS
STRATEGY
GC 4.1
Strengthen the branding and promotion of locally sourced food, linking together existing farmers' markets and creating a unified front to support an Orange County foods movement
TIER: COMPLEMENTARY
PRIORITY SCORE: 5.38
CO-BENEFITS:
GREEN COMMUNITY
TARGET REPORT ON EXISTING LOCAL FOOD NETWORK EACH YEAR
Orange County Preparing Lifelong Active Youth (PLAY) to Move More is a partnership between HCOC, Orange County Schools (OCS), and UNC Campus Recreation to increase youth physical activity during afterschool. UNC Sport Club athletes visit OCS middle schools twice a month to teach youth sports related skills, and provide opportunities for structured play. The program encourages OCS to enhance physical activity for students during after school programs. Teachers strive to dedicate at least 30 minutes of after-school time to activities that get students moving. Be Active NC trains teachers to engage students in physical activity that promotes learning and wellbeing of both students and teachers. Healthy Carolinians hopes to have PLAY adopted throughout the school district.
8 8


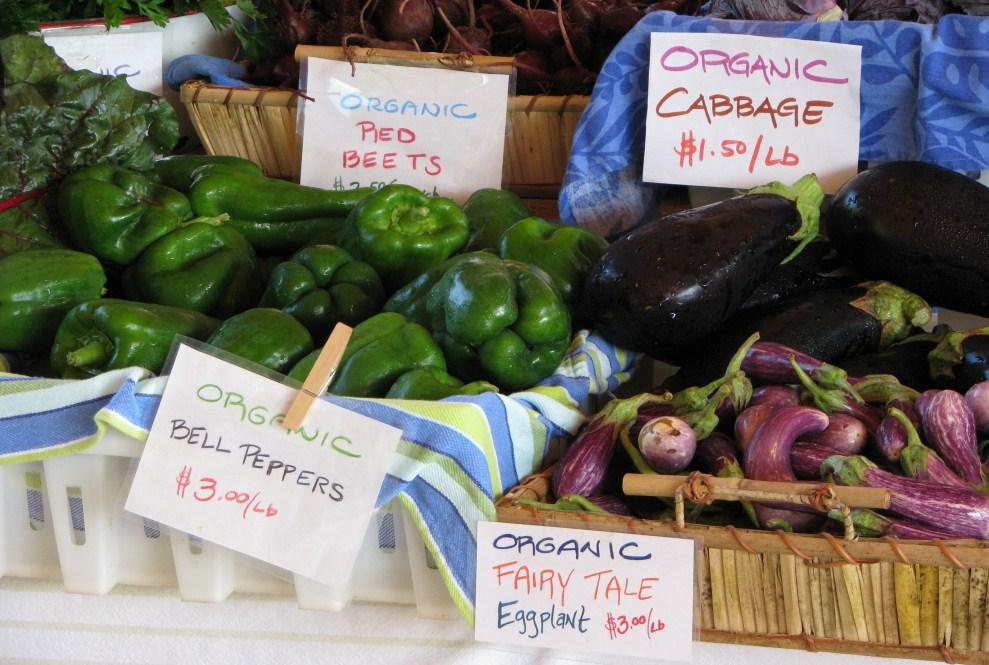
GC 4.1.1
Enhance branding of locally sourced food and focus on building a stronger ag tourism network; incorporate farmers’ markets
GC 4.1.2
Host gardening workshops utilizing community center gardens; promote staff/volunteer led gardens on County properties/parks that have space and especially in areas that may be considered food deserts
GC 4.1.3
Assess County facilities that would be good candidates for installation of edible gardens
IMAGE SOURCE: OC 2030 PARKS & REC. MASTER PLAN.
GOALS
LOOKING TO 2050
GOAL
GREEN COMMUNITY
GC 5 BROADEN OUTREACH AND RESOURCES TO BETTER SUPPORT THE SUSTAINABLE AGRICULTURAL INDUSTRY
TARGET
INCREASE SUSTAINABLE FARMING ACRES BY 5% EACH YEAR BEGINNING IN 2025
STRATEGY
GC 5.1
Encourage the use of County land for sustainable farming practices and education, leveraging Breeze Farms as a model for sustainable farming
TIER: SUPPORTIVE PRIORITY SCORE: 5.38
CO-BENEFITS:
ACTION
GC 5.1.1
Define sustainable farming practices and then promote through education and outreach
GC 5.1.2
Provide a clearinghouse of information for farmers and funding opportunities available for implementation of sustainable farm practices through County Extension office
GC 5.1.3
Promote the County's Community Garden Grant Program
GOALS
LOOKING TO 2050
GREEN COMMUNITY
GOAL
GC 6 BROADEN OUTREACH AND RESOURCES TO BETTER SUPPORT THE COMMUNITY
TARGET
IDENTIFY PARTNERSHIPS AND INTERNAL FUNDING SUPPORT TO BUILD A MORE NATURAL COMMUNITY

STRATEGY
GC 6.1
Develop programs and educational resources to promote native landscaping and support pollinators, leveraging partnerships with organizations like the Audubon Society and Master Gardeners
TIER: COMPLEMENTARY
PRIORITY SCORE: 3.25
CO-BENEFITS:
GC 6.1.1
Organize community workshops on the importance of native landscaping and pollinators
GC 6.1.2
Partner with existing recognition programs for households and businesses that adopt native landscaping
GC 6.1.3
Develop and promote sustainable landscaping campaigns such as "Leave the Leaves," "Leave the Lawn," "No Mow May," etc.
STRATEGY
GC 6.2
Expand workshops and resources for rainwater capture, learning from successful programs in other regions and leveraging tools like the EPA's EnviroAtlas
TIER: COMPLEMENTARY
PRIORITY SCORE: 3.75
CO-BENEFITS:
GC 6.2.1
Organize a workshop on rainwater capture each year beginning in 2024; focusing on new audiences
GC 6.2.2
Distribute free rainwater capture kits at each workshop
GC 6.2.3
Showcase rainwater capture infrastructure at the Bonnie B. Davis Center and replicate at other park facilities
GC 6.2.4
Consider ways to incorporate Audubon’s Bird-Friendly Habitat certification
LOOKING TO 2050
GREEN COMMUNITY
STRATEGY ACTION
GC 6.3
Utilize the County’s existing Lands Legacy Program to conserve important natural and cultural resources, working with the Eno-New Hope Landscape Conservation Plan and other initiatives to improve the natural environment through protection and linkage of lands and stream protection
TIER: COMPLEMENTARY
PRIORITY SCORE: 3.75
CO-BENEFITS: GOALS
GC 6.3.1
Establish partnerships with new initiatives each year to improve protection of lands and streams beginning in 2030 such as the new American Climate Corps, Scout Troops, Garden Clubs, Audubon, etc.
GC 6.3.2
Develop educational resources on land and stream protection
GC 6.3.3
Implement a volunteer restoration program for natural environment protection
STRATEGY
GC 6.4
Convert anticipated future abandoned railroad corridors and integrate into bike/hike trail networks bringing about positive impacts on mental health, transportation emissions, and the economy
TIER: SUPPORTIVE
PRIORITY SCORE: 4.50
CO-BENEFITS:
GC 6.4.1
Provide staff support for the implementation of the Chapel Hill-Carrboro Freight Train Trail Feasibility Study initiative
GC 6.4.2
Ensure that public transit pick up/drop off locations are located along these networks (Action T1.1)
GC 6.4.3
Promote the Train Trail initiative through the Parks and Recreation Department
GOALS
LOOKING TO 2050
GREEN COMMUNITY
STRATEGY ACTION
GC 6.5
Expand Community Climate Action Grant program to provide more funding to community projects that support the strategies in this CAP
TIER: FOUNDATIONAL
PRIORITY SCORE: 6.50
CO-BENEFITS:
GC 6.5.1
Receive Board of Commissioner approval
GC 6.5.2
Develop a donation fund for residents to donate towards the Community Climate Action Grant fund
STRATEGY ACTION
GC 6.6
Transition municipal off-road fossil fuel engines (landscaping equipment, construction equipment, recreational vehicles) to electric options and request County contractors use electric options
TIER: SUPPORTIVE
PRIORITY SORE: 5.25
CO-BENEFITS:
GC 6.6.1
Coordinate a swap out program for gas powered landscaping equipment with all electric
GC 6.6.2
Apply for grants that could offer subsidies for swapping out gas to all electric landscaping equipment
GC 6.6.3
Transition all County landscaping equipment to all electric by 2035
RESILIENT COMMUNITY
From a climate change perspective, natural variability in the climate and weather produce extreme events like droughts, wildfires, and floods over long time periods. While natural, living systems respond to and even rely on these phenomena, our dense settlement and production of greenhouse gas emissions have greatly changed climate hazards and their impacts.
From a resilient community perspective, climate impacts will not be felt equally. Some populations are more vulnerable to climate events because there is a lack of the physical or mental ability to adapt to changing conditions. Isolated individuals have a more difficult time receiving warnings and emergency services and may depend on sources of food, water, and energy that are more subject to interruption.
As part of the Top 10 things the County should do, County operations need to be prepared for climate change. The County should identify ahead of time and prioritize considerations around vulnerable populations and ensure that all decisions made moving forward integrate sustainability and resilience as a framework within the overall County's planning process.

GOALS
LOOKING TO 2050
RESILIENT COMMUNITY
GOAL
CR 1 INTEGRATE CLIMATE RISK SOLUTIONS IN ALL COUNTY PLANNING EFFORTS
TARGET IMPLEMENT MEASURES TO
REDUCE HEAT AND DROUGHT IMPACT

STRATEGY
CR 1.1
Conduct a Heat Island Mapping Study
TIER: SUPPORTIVE
PRIORITY SCORE: 2.75
CO-BENEFITS:
ACTION
CR 1.1.1
Once heat island mapping study is complete, implement the usage of reflective paint and plant trees in areas that the study identifies as needing relief from urban heat island effects
CR 1.1.2
Identify populations most vulnerable to the effects of extreme heat; prioritize tree plantings in these areas (in support of GC 2.1)
RESILIENT COMMUNITY
GOAL
CR 2 BE PREPARED FOR CLIMATE EMERGENCIES
TARGET
INTEGRATE ADAPTATION INTO EMERGENCY PREPAREDNESS AND RESPONSE
STRATEGY
CR 2.1
Continue updating the FEMA Hazard Mitigation Plan and ensure effective implementation of the Eno-Haw Regional Hazard Mitigation Plan
TIER: SUPPORTIVE
PRIORITY SCORE: 3.75
CO-BENEFITS:
ACTION
CR 2.1.1
Track mitigation performance metrics of the Eno-Haw Regional Hazard Mitigation Plan
CR 2.1.2
Organize quarterly meetings with stakeholders to assess the implementation of the Eno-Haw Regional Hazard Mitigation Plan
CR 2.1.3
Seek funding through FEMA hazard mitigation grants to support mitigation efforts
STRATEGY
CR 2.2
Develop and promote a clear communication plan for underserved communities during climate threats, leveraging social media, community leaders, nonprofits, and churches
TIER: FOUNDATIONAL
PRIORITY SCORE: 3.25
CO-BENEFITS:
ACTION
CR 2.2.1
Develop a comprehensive communication plan for climate threats by 2026
CR 2.2.2
Partner with at least four community leaders, nonprofits and schools annually to disseminate the communication
CR 2.2.3
Conduct new County employee training sessions on the use of social media for climate threat communication
GOALS
LOOKING TO 2050
RESILIENT COMMUNITY
STRATEGY ACTION
CR 2.3
Implement a program for discounted battery-powered generators for lowerincome residents with health issues who may be affected by power outages
TIER: SUPPORTIVE
PRIORITY SCORE: 2.75
CO-BENEFITS:
CR 2.3.1
Develop and implement a program offering discounted generators to residents beginning in 2027
CR 2.3.2
Organize an annual information campaign about the battery-powered generator discount program
CR 2.3.3
Identify a third party partner to offer discounted maintenance service for program recipients
STRATEGY ACTION
CR 2.4
Identify, fund, and prepare existing and new public facilities to serve as resilience hubs (i.e. locations which are able to generate power in the event of a power outage, distribute emergency supplies, and coordinate communication)
TIER: SUPPORTIVE
PRIORITY SCORE: 3.75
CO-BENEFITS:
CR 2.4.1
Identify potential County facilities that can serve as resilience hubs by 2025 and amend the Unified Development Ordinance to allow for these in certain zoning districts
CR 2.4.2
Promote these facilities through Orange County Emergency Services
CR 2.4.3
Organize resilience hub preparation and training sessions for facility staff
GOALS
GOAL
RESILIENT COMMUNITY
CR 3 INVEST IN INFRASTRUCTURE FOR CLIMATE RESILIENCE
STRATEGY
CR 3.1
Expand the use of green infrastructure (GI) to manage stormwater runoff, considering incentives to encourage implementation in local neighborhoods
TIER: SUPPORTIVE PRIORITY SCORE: 4.75
CO-BENEFITS:
TARGET
EXPAND COUNTY
BUDGET TO INCLUDE CLIMATE RESILIENCE EXPENDITURES

ACTION
CR 3.1.1
Partner with higher education resources within the County (UNCCH, Durham Tech) to perform research and test GI stormwater pilot programs. Plan for one research project per year beginning in 2027
CR 3.1.2
Establish partnerships with at least two schools or community organizations like Urban Sustainability Solutions to install rain garden installations and provide green infrastructure education in the community
CR 3.1.3
Implement permeable, GI alternatives to paving in sidewalks, parking lots and driveways at County facilities
CR 3.1.4
Provide guidelines and incentives for developers to use GI
CR 3.1.5
Pair permeable surfaces with stormwater management strategies such as bioswales and rain gardens at County facilities
CR 3.1.6
Attend neighborhood association and Rotary Club meetings to communicate green infrastructure improvements and offer a “How to” on translating this work onto specific residential properties
IMAGE
GOALS
LOOKING TO 2050
RESILIENT COMMUNITY
CR 3.2
TIER: SUPPORTIVE
PRIORITY SCORE: 4.75
CO-BENEFITS:
CR 3.2.1
Develop and implement a comprehensive riparian ecosystem restoration plan and relevant floodplain management policies
CR 3.2.2
Assess strategies for reducing impacts of climate change on municipal and community infrastructure STRATEGY ACTION
Partner with Arts Commission to create murals using heat reflective paint on County properties that do double duty as a resiliency measure and inform and educate the community about climate change and its impacts
CR 3.2.3
Do a study to evaluate reducing unnecessary parking spaces to decrease impervious surfaces and create more green spaces on County property
CR 3.2.4
Promote light-colored roofs and/or a minimum specified reflectance for commercial roofs when new or at replacement
CR 3.2.5
Partner with the Triangle Climate Resilience Partnership to promote alternative cooling strategies like shade trees, green roofs, and building awnings. Determine and enact standards for new buildings
GOALS
LOOKING TO 2050
RESILIENT COMMUNITY
GOAL
CR 4 BUILD A MORE ROBUST EMERGENCY RESPONSE NETWORK
TARGET
IDENTIFY AND PRIORITIZE ACTIONS TARGETED TO VULNERABLE POPULATIONS WITHIN THE COUNTY
CR 4.1
Continue outreach and comprehensive care strategies for vulnerable populations STRATEGY
TIER: COMPLEMENTARY
PRIORITY SCORE: 3.25
CO-BENEFITS:
CR 4.1.1
Use the Department of Social Services’ registry to continue to access populations with special needs during the time of disasters
CR 4.1.2
Expand Community Emergency Response Team program that teaches community members real world disaster response skills to respond to community emergencies in the event that public safety is compromised
CR 4.1.3
Collaborate with community-based organizations to develop an inventory of locations with isolated seniors and develop a plan for a social support network during heat waves, bad air quality days, and other emergencies
CR 4.1.4
Expand the Steps to Neighborhood Preparedness Program that helps communities connect and build neighborhood emergency plans
GOALS
LOOKING TO 2050
RESILIENT COMMUNITY
GOAL
CR 5 PROMOTE CLIMATE RESILIENCE EDUCATION AND AWARENESS
TARGET TRACK OUTREACH EFFORTS AND INCLUDE NUMBERS IN ANNUAL PROGRESS REPORTING
STRATEGY ACTION
CR 5.1
Develop programs to educate the public on climate impacts
TIER: COMPLEMENTARY PRIORITY SCORE: 3.25
CO-BENEFITS:
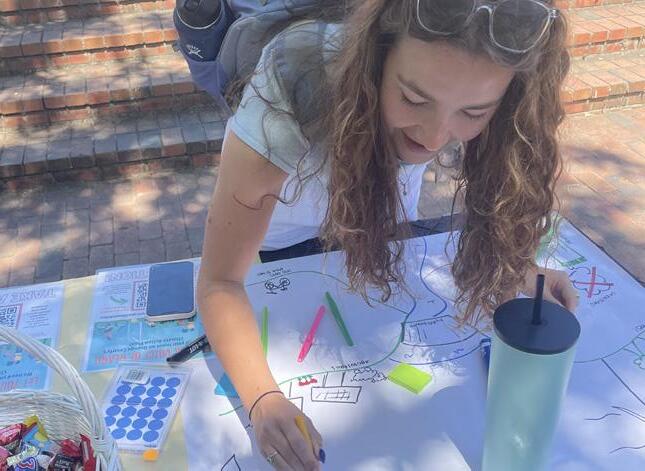
CR 5.1.1
Leverage existing public events to increase climate impact awareness
CR 5.2
Disseminate climate resilience information to the business community STRATEGY ACTION
TIER: COMPLEMENTARY PRIORITY SCORE: 3.75
CO-BENEFITS:
CR 5.2.1
Provide climate resiliency information in newsletters and other media channels geared for the business community
CR 5.2.2
Organize bi-annual networking events focused on climate preparedness and resiliency
CR 5.2.3
Promote the sustainable business toolkit developed in BE 4.2.1
IMAGE
GOALS
LOOKING TO 2050
RESILIENT COMMUNITY
STRATEGY ACTION
CR 5.3
Follow through on recommendations from the Triangle Regional Resilience Assessment, ensuring its findings are acted upon and incorporated into ongoing climate resilience efforts
TIER: SUPPORTIVE
PRIORITY SCORE: 4.25
CO-BENEFITS:
CR 5.3.1
Monitor and report annually on the implementation of the Resilience Assessment recommendations
STRATEGY ACTION
CR 5.4
Increase the number of vendors who are small business-owned or run by people of minority identities as much as possible
TIER: SUPPORTIVE
PRIORITY SCORE: 2.25
CO-BENEFITS:
CR 5.4.1
Acknowledge the importance of this consideration during planning sessions
CR 5.4.2
Mention these efforts when applying for grants and in requests for proposals; prioritize applications that meet this consideration
RESILIENT COMMUNITY
GOAL
CR 6 INCORPORATE CLIMATE ACTION INTO COUNTY POLICY, BUDGET, AND PLANNING
TARGET
INTEGRATE SUSTAINABILITY AS A FRAMEWORK WITHIN THE OVERALL COUNTY'S PLANNING PROCESS
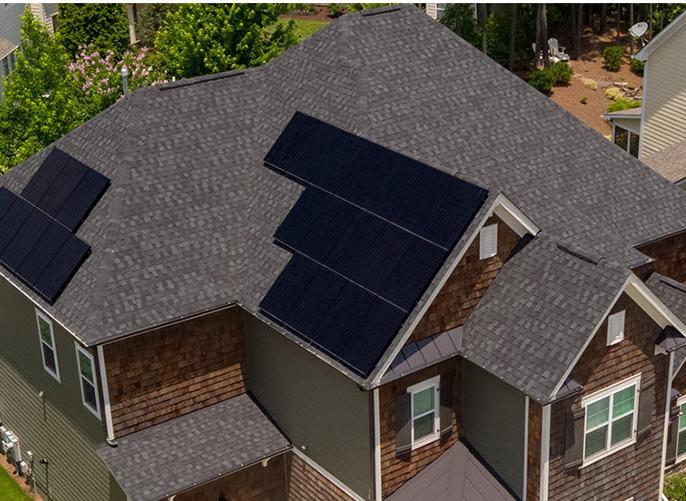
STRATEGY
CR 6.1
Incorporate climate preparedness into County programs, operations, and maintenance protocols
TIER: SUPPORTIVE
PRIORITY SCORE: 3.75
CO-BENEFITS:
STRATEGY
CR 6.2
Integrate CAP goals into County projects as an order of business
TIER: SUPPORTIVE
PRIORITY SCORE: 4.25
CO-BENEFITS:
CR 6.1.1
Ensure that maintenance reflects expected future climate conditions and variability and not historical climate data for all County buildings, facilities, structures, and infrastructure
CR 6.1.2
Establish an interdepartmental working group to integrate climate preparedness in planning, maintenance, and capital improvements through the development of work plans, screening of capital improvements, and cross-sector collaboration
CR 6.1.3
Develop a cross departmental “Green Team” whose purpose is to educate departments on implementing sustainable practices
CR 6.2.1
Integrate annual CAP report goals during the budget review process at the direction of the Board of County Commissioners. Plan to inventory GHG emissions every two years and track against targets
STRATEGY
CR 6.3
Provide funding for more sustainability staff in order to implement strategies, apply for grant funding and provide community outreach and education
TIER: SUPPORTIVE
PRIORITY SCORE: 5.00
CO-BENEFITS:
CR 6.3.1
Evaluate and fund additional staffing levels needed to implement CAP strategies
CR 6.3.2
Consider the merits of adding a grant administrator position to apply for state and federal funding available through IIJA and IRA that can provide significant levels of funding support to the actions in this CAP

IMPLEMENTATION AND REPORTING

IMPLEMENTATION AND REPORTING
OVERVIEW
The Commission for the Environment (CFE) is a citizen advisory board, composed of 15 members who are appointed by the Board of County Commissioners. The CFE’s primary responsibility is to advise the Board of County Commissioners on matters related to the environment. The CFE will act as an oversight committee, working with the Sustainability Manager, as the implementation and reporting process unfolds.
Sustainability is inherently wide-ranging and not every action can be implemented at once. Some strategies can start immediately while other strategies, such as policies and regulations, rely on staff putting time in up front. Other strategies like capital investments involve a long term series of steps from project scoping and procurement, to planning, design, and construction.
Many of the actions will be dependent upon the allocation of staff time and resources, and budget prioritization. The plan identifies a responsible department for each strategy and offers timeframes and relative costs associated with each policy. The Sustainability Manager will monitor implementation progress using implementation and monitoring tools outlined in this CAP and will report to the Board of Commissioners on annual progress. As part of annual progress reports, the Sustainability Manager will evaluate the effectiveness of each strategy to ensure that anticipated emissions reductions are occurring. In the event that reductions do not occur as expected, Orange County can modify and add policies or actions to ensure the target is achieved.
Not everything will necessarily be easy or work perfectly the first time, and perseverance will be important. It will also be important to maintain flexibility in implementing the CAP. As technologies, business models, and political agendas across all levels of government evolve, Orange County will need to remain flexible in “when” and “how” it implements the actions in this plan. As costs and feasibility change, the County will periodically evaluate and adjust course as necessary. Similarly, as progress towards key targets is tracked, the County may need to scale up or down its efforts, depending on the results observed. The County should update the CAP every five years starting in 2029 and report every year on progress towards their goals.
REPORTING TOOL
The opening page of the dashboard, titled ‘Focus Areas’ explains the five categories underpinning the action steps in the CAP: Transportation, Built Environment and Energy, Green Community, Resilient Community, and Resource Conservation. The second page, ‘Emissions,’ illustrates the emission’s trajectory with GHG reduction objectives. This page links the Top 6 strategies outlined for the County to its GHG emission sectors and translates reduction efforts into the equivalent number of cars removed from the road in a given year. The third page, ‘Green Energy,’ offers a map visualization, pinpointing the locations of solar panel installations, LEED and energy star-related buildings, and EV chargers, while also tallying the total number of EV registrations within the County. The fourth page, ‘Action Steps,’ showcases all actionable steps that Orange County has both planned and committed to implementing, with an ‘Action Step Tracker’ graphic showing the progress of these strategies. The final page, 'Resources,’ offers users links and descriptions of the programs, resources and plans upheld by the County, highlighting areas interconnected with the CAP.
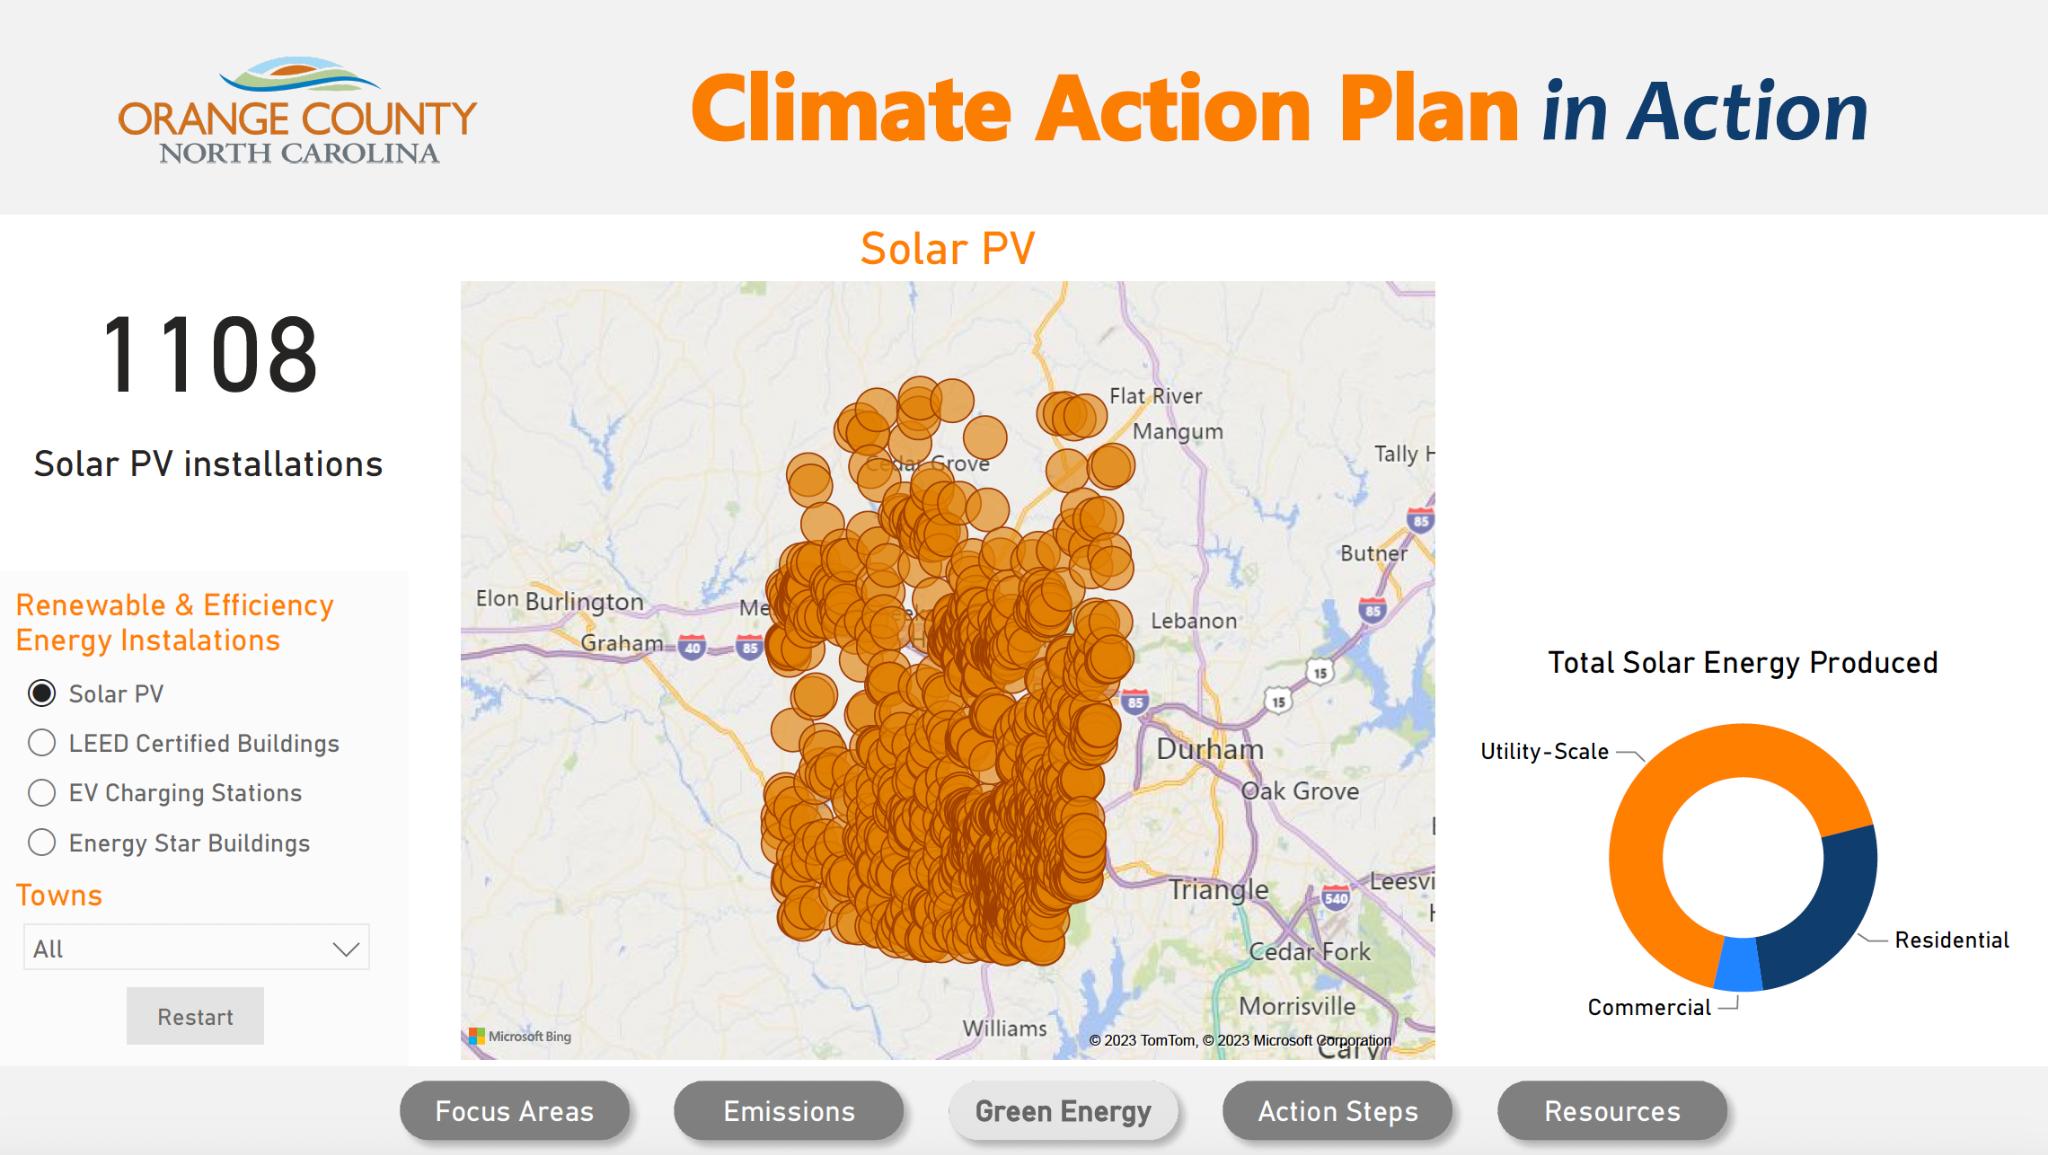
Budget
In 2019, the Board of Commissioners created the Community Climate Action Grant Program (CCAG) funded through a ¼ cent property tax to help meet adopted goals that would uphold the Paris Agreement and achieve 100% renewable energy by 2050 The Community Climate Action Grant Program provides funding for impactful public, non-profit, and small business projects, such as solar power at school districts and weatherizing affordable housing The CCAG will be used to in centivize grant applicants to support the actions identified within the CAP as well as new and innovative programs that complement the CAP through reducing GHG emissions.
Figure G: Page from Orange County’s Dashboard
BUDGET
In 2019, the Board of Commissioners created the Community Climate Action Grant Program (CCAG) funded through a ¼ cent property tax to help meet adopted goals that would uphold the Paris Agreement and achieve 100% renewable energy by 2050. The Community Climate Action Grant Program provides funding for impactful public, non-profit, and small business projects, such as solar power at school districts and weatherizing affordable housing. The CCAG will be used to incentivize grant applicants to support the actions identified within the CAP as well as new and innovative programs that complement the CAP through reducing GHG emissions.
In addition to the grant program, a review of the Sustainability Budget will need to be completed.
FUNDING PLAN
Securing the necessary funding to effectively execute the CAP demands a diverse range of funding strategies and avenues. An integral component of the financial approach is identifying potential external funding sources, particularly for actions that require additional support. Recognizing that certain strategies might surpass the County's current resources, tapping into external funding becomes essential. Within this framework, specific funding sources are identified where known. The implementation year for each strategy is selected based on the prioritization score, as well as the Top 10 strategies, as introduced in the CAP’s Executive Summary. An imminent implementation year signifies a high prioritization score for that strategy, while a later year means a comparatively lower score.
The cost estimates are indicative only; they are based on preliminary assessments, comparisons with similar programs, and expert input and are meant to provide a rough evaluation. For example, several of the strategies involve efforts of County staff. In these cases, a percentage of a staff’s time, reflected as a portion of a “full time equivalent” has been estimated. In other cases, estimated costs of newly purchased goods and services are used. 24 An inflation factor of 3% year-over-year was applied to the estimated costs. The budget will follow the County’s fiscal cycle and specific costs will be integrated into direct department budgets. It should be noted, however, that the County can rely heavily on the influx of state and federal grants to support many of these strategies. Strategy CR 6.3 will ensure that proper staff is in place to manage on-going grant opportunities.
24 The full description for all costs has been provided to the County, in a Climate Action Tracker, which accompanied this CAP, and is available upon request.
IMPLEMENTATION AND REPORTING
FUNDING PLAN CONTINUED
The financial details are organized into two tables. Table B outlines the total estimated costs by focus area that are needed over the next nine years, adding together the costs of all strategies related to that focus area for the given year. On the other hand, Table C shows the total estimated costs needed for each primary goal, summing up the costs of the strategies supporting these goals.
For a more comprehensive outline of funding mechanisms, costs, sources, and an Implementation schedule, refer to Appendices D-F, which align each strategy with its corresponding funding source(s).
Table B: Outlines the Total Estimated Costs By Focus Area
Table B: Outlines the Total Estimated Costs By Focus Area (continued from page 85)
FUNDING PLAN CONTINUED
Table C outlines the total estimated costs that are needed by each core goal.
CORE GOALS
T1. Enhance and diversify public transportation
T2. Improve Orange County Commuter Options (OCCO) program
T3. Promote cycling and walking as sustainable transportation options
T4. Increase EV Infrastructure and adoption
T5. Continue and expand anti-idling initiatives
BE1. Strengthen energy efficiency and conservation
BE2. Expand renewable energy usage
BE3. Promote electrification
$775,000
$27,000
$510,000
$562,000
$10,000
$467,000
$212,500
$50,000
BE4. Enhance public education and accessibility of resources $240,000
BE5. Advance sustainable building practices
RC1. Implement the 2023-2045 Solid Waste Master Plan
RC2. Promote water conservation
RC3. Promote a sustainable supply chain
GC1. Enhance green infrastructure and sustainable land use
GC2. Increase the tree canopy community-wide
GC3. Promote sustainable agriculture
GC4. Promote local food systems
GC5. Broaden outreach and resources to better support the sustainable agricultural industry
GC6. Broaden outreach and resources to better support the community
CR1. Integrate climate risk solutions in all County planning efforts
CR2. Be prepared for climate emergencies
CR3. Invest in Infrastructure for climate resilience
CR4. Build a more robust emergency response network
$852,000
$266,000
$315,000
$7,000
$160,000
$110,000
$25,000
$40,000
$40,000
$905,000
$346,000
$366,000
$137,000
$15,000
CR5. Promote climate resilience education and awareness -
CR6. Incorporate climate action into County policy, budget, and planning
$1,884,000
$1,821,500
$588,000
$1,280,000
$1,024,000
$160,000
Table C: Estimated cost by core goal

APPENDICES
IMAGE
Executive Summary
INTRODUCTION
This report provides an inventory of greenhouse gas (GHG) emissions that are attributable to human activities in Orange County. It acts as a foundational document for the 2023 climate action plan, which provides a roadmap for reducing carbon emissions while preserving the living standards of County residents. A GHG inventory describes the primary sources of emissions within the County, including those originating from residents, commercial enterprises, and governmental operations. The emissions studied can be either direct or indirect. Direct emissions are those emitted at the location of use such as natural gas combustion in heating buildings, whereas indirect emissions are purchased and used at one location but generated elsewhere, such as those originating from the electrical grid 1. A GHG inventory is crucial for creating strategies and programs that reduce future emissions and providing insight into the environmental condition of the County during the study year. This report was reviewed by the International Council for Local Environmental Initiatives (ICLEI) for completeness and accuracy to ensure its reliability as a foundation for informed decision-making and action.
This GHG inventory analyzes two different tracks, which are presented separately. The community track encompasses all Orange County residents, including businesses, individuals, and industrial emissions sources. Community emissions were divided into sectors: commercial, residential, and industrial energy; transportation and mobile services; solid waste; and water and wastewater. The County government operations track includes the emissions related to Orange County government activities, including government facilities, vehicle fleets, and employee commuting. The County operations inventory is a subset of the community inventory, and has specific usage portioned out from the community inventory.
This report relies on the best available data to date. If certain data could not be collected, best estimates were used. Emission factors were compiled for each sector from reliable sources, such as the Environmental Protection Agency (EPA) and the US Community Protocol, which update information regularly. This GHG inventory offers a reliable reflection of real-world emissions in Orange County. All calculations were made using the US Community Protocols for Greenhouse Gas Accounting studies, as published by ICLEI2. Two appendices are included in this report. Appendix A.1 lists raw usage data collected from utilities and other sources, while Appendix A.2 provides a detailed methodology of all calculations used in determining emission totals.
1 https://www.epa.gov/climateleadership/scope-1-and-scope-2-inventory-guidance
2 U.S. Community Protocol for Accounting And Reporting of GHG Emissions Version 1.2
July 2019 ICLEI–Local Governments for Sustainability USA. https://icleiusa.org/us-community-protocol/
COMMUNITY INVENTORY RESULTS
In 2019, the Orange County community produced a total of 1,631,671 metric tons of carbon dioxide equivalent emissions (MT CO2e). As illustrated in the figure below, the greatest percentage of emissions was from transportation and mobile service at 43%, or 702,701 MT CO2e. Energy use (which includes electricity and natural gas) in commercial buildings represents the next largest source at 34%, and energy from residential use followed, contributing 18%. Industrial energy use contributed just 2%. In terms of total amounts, commercial energy produced 556,800 MT CO2e, residential energy resulted in 299,216 MT CO2e, and industrial energy contributed 33,626 MT CO2e. The remainder of the community inventory includes solid waste with 21,350 MT CO2e, water and wastewater with 12,585 MT CO2e, and fugitive emissions with 5,393 MT CO2e. 3
3 Percentages might not equal 100% due to rounding
Figure 1: Orange County 2019 community inventory by sector
ORANGE COUNTY COMMUNITY INVENTORY
COUNTY OPERATIONS INVENTORY RESULTS
County operations GHG emissions were also analyzed. Orange County government operations were responsible for 19,359 MT CO2e. The largest emission sources were employee commuting at 33% (6,329 MT CO2e). Buildings and Facilities contributed 32%, with 6,185 MT CO2e. Water and Wastewater treatment facilities at 23% (4,479 MT CO2e) followed by Vehicle Fleet at 11% with 2,106 MT CO2e. The Transit Fleet accounted for the remaining 1% (251). Fugitive emissions produced 9 MT CO2e (less than 1%).
GOVERNMENT OPERATIONS INVENTORY
Figure 2. Orange County 2019 government operations emissions by sector
Introductory Summary
This inventory was performed using the U.S. Community Protocol Version 1.2, as developed by ICLEI and updated for this specific GHG accounting exercise in July 2019. Inventory emissions were calculated using best practices and were based on 2019 data gathered from the County. These “usage” data were assigned an appropriate emission factor to arrive at a figure for emissions emitted. The calculations took place within the ICLEI ClearPath tool. ClearPath assists in GHG accounting and management at the community and municipal levels. Emission factors were compiled from 2019 data and information from the federal Environmental Protection Agency GHG Emission Factors Hub,4 utilized in the ICLEI ClearPath tool.
As a result, this report compiles data from the County and models GHGs to provide an accurate depiction of the County’s real-world emissions. It also identifies key areas to focus on for strategy development and program creation to reduce emissions in the County. Finally, it serves as an update to the County’s existing GHG inventories completed in 2005 and 2017.5
Previous Inventories and Climate Resolutions
For two decades, Orange County has been actively striving to reduce carbon emissions. The County’s first GHG inventory was conducted in 20056 and the second in 2017. The present inventory, therefore, builds upon previous work to provide useful data on how the County is progressing towards reducing carbon emissions.
On June 6, 2017, Orange County Board of County Commissioners adopted a resolution to uphold the Paris Climate Agreement, committing to reduce GHG emissions between 26 and 28 percent by 2025 from 2005 levels and on September 5, 2017, the Board made an additional commitment to transition to a 100% renewable energy-oriented economy by 2050. These resolutions demonstrate the County’s leadership towards climate action by creating informed decisions based on data contained in GHG inventories.
Several important comparisons can be made across sectors between 2005, 2017 and today, despite the fact that not all sectors were consistently measured over the years. Specifically, comparisons can be drawn between residential, commercial, and industrial energy, transportation, and solid waste. As shown in figure 3, these sectors have experienced significant emission reductions since 2005. In 2005, Orange County was responsible for emissions amounting to 2.8 million tons of carbon dioxide equivalent. In 2017 emissions in Orange County had fallen to 1.78 million tons of CO2e. By 2019, emissions fell further, to 1.63 million tons of CO2e, a decrease of 40.7% between 2005 and 2019.
4 https://www.epa.gov/climateleadership/ghg-emission-factors-hub
5 https://www.orangecountync.gov/DocumentCenter/View/10049/ Orange-County-Greenhouse-Gas-Inventory-2017
6 https://www.orangecountync.gov/DocumentCenter/View/2002/ Greenhouse-Gas-Emissions-Inventory-and-Forecast-PDF
COMPARISON WITH 2005 BASELINE
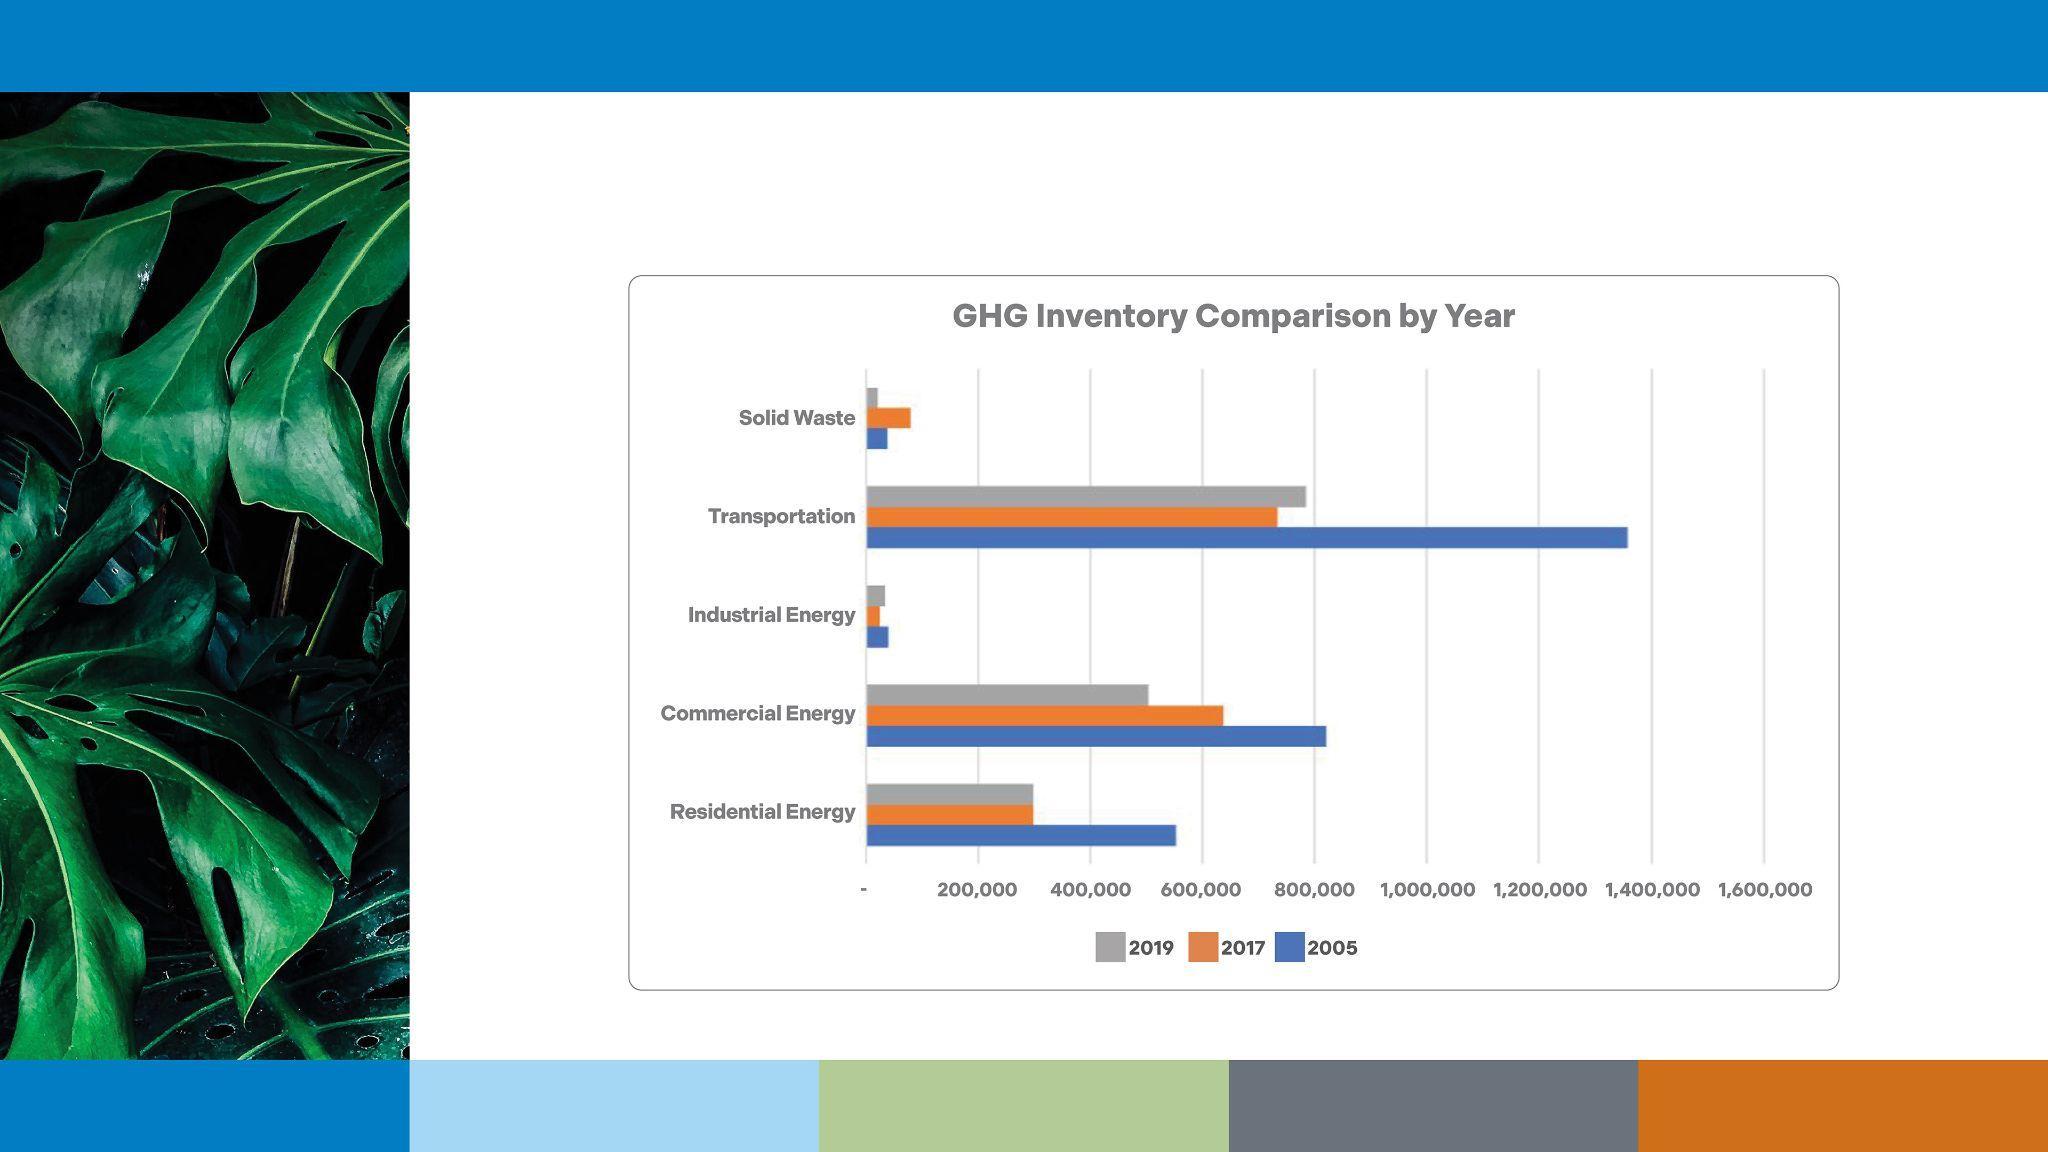
The methodology for this inventory was based upon best practices from the US Community Protocol provided by the ICLEI ClearPath tool, coupled with the United States Environmental Protection Agency GHG Emission Factors, which serve as the benchmark for GHG inventory analysis nationwide. Emissions estimates incorporate real-world usage data (listed in Appendix A.1), which were subsequently processed through ICLEI ClearPath functions.7
INVENTORY YEAR
The year 2019 was selected for this inventory because it offers a more typical representation of GHG emissions for the year 2022 since the COVID-19 pandemic significantly reduced travel emissions and markedly impacted other sectors as well. Notably, the years 2020, 2021, and 2022 recorded significantly lower emissions compared to current levels. Additionally, the Science Based Targets Initiative recommends using 2019 as a baseline year for future emission reduction targets. 8
COMMUNITY AND COUNTY OPERATIONS INVENTORIES
The inventory considers two distinct GHG accounting tracks: community and County operations. The community inventory includes emissions from residents within Orange County's jurisdiction, accounting for both emissions from residents within the County's
7 https://icleiusa.org/clearpath
8 https://sciencebasedtargetsnetwork.org/wp-content/uploads/2020/11/SBTs-for-cities-guide-nov-2020.pdf
limits and from people who recreate and work in Orange County; the community inventory is inclusive of all towns within the County. Required sectors for community GHG inventories are: 1) community building energy use from kilowatt hours and natural gas therms usage, and other significant energy sources 2) transportation emissions from vehicle miles traveled in the County, 3) solid waste disposed, 4) wastewater and water electricity used and gallons consumed. In contrast, the County operations inventory encompasses emissions resulting from Orange County operations and facilities, making it a subset of the community inventory. Although County emissions represent a small fraction of the emissions inventory, managing them is vital, given the government’s ability to influence and lead by example to combat climate change. The County operations inventory includes emissions from County buildings, County vehicle fleets, employee commutes, and water consumption.9
CALCULATING EMISSIONS
GREENHOUSE GASSES
Local governments are expected to evaluate emissions of the six internationally recognized greenhouse gasses (GHG) under the Kyoto Protocol,10 namely carbon dioxide (CO2), methane (CH4), nitrous oxide (N2O), hydrofluorocarbons (HFCs), perfluorocarbons (PFCs), and sulfur hexafluoride (SF6). Each of these greenhouse gasses is reported and converted into metric tons (MT), differentiated by their respective Global Warming Potential (GWP). The GWP of each is benchmarked on Carbon dioxide's potential, which is set at 1, as it serves as the reference point for the other gasses. Methane, with a GWP of 28, is largely emitted from landfills, wastewater, and natural gas leakage. Nitrous Oxide, with a higher GWP of 265, is primarily associated with energy production and wastewater treatment. Hydrofluorocarbons, having a wide GWP range of 12-11,700, are mainly tied to refrigerant usage. Perfluorocarbons, with a GWP between 6,500-9,200, typically result from manufacturing and production processes. Sulfur Hexafluoride, possessing the highest GWP of 23,900, is principally connected with power transmission and distribution. This inventory primarily uses Carbon dioxide, Methane, and Nitrous Oxide11 to establish the carbon dioxide emission equivalents (CO2e) for all sectors analyzed.12
SECTOR ACTIVITY DATA AND EMISSIONS FACTORS
The process of calculating Carbon dioxide equivalents (CO2e) utilizes both activity data and emission factors. When activity data is multiplied by corresponding emission factors, the result is an amount of carbon dioxide-equivalent emissions. By converting each sector's activity data into carbon dioxide equivalents, a comparative ratio for each sector can be established, enabling further analysis and facilitating decision-making about potential reduction strategies.
9 Data was not available for solid waste from County Operations to be differentiated from community waste, therefore all solid waste emissions are included only in the community inventory.
10 https://unfccc.int/resource/docs/convkp/kpeng.pdf
11 As referenced in the US Community Protocol the high GWP GHG’s perfluorocarbons and sulfur hexafluoride are not required to complete an accurate inventory. The County reported no refrigerant loss, and therefore hydrofluorocarbons do not appear in the inventory. All other GHGs are measured and reported.
12 https://icleiusa.org/ghg-protocols
EMISSIONS REPORTING
Emissions are quantified using the measure of Carbon dioxide equivalent (CO2e) and compared across sectors. Each sector is individually reported and assessed in relation to others, offering a comprehensive picture of emissions across the County. The community inventory covers building energy use, transportation, solid waste, wastewater, and water. Building energy is further divided into commercial, residential, and industrial use and consists of both electricity and natural gas consumption. The municipal inventory includes building energy use, employee commute, vehicle fleet, water, and wastewater.
Results
The following sections detail the findings from the community and County government operations GHG inventories, with results organized by sectors. The community and County operations inventories are separate endeavors, but the information is combined within this report. Each inventory should be considered as a benchmark for future emission reductions. Calculation methodologies for all results are provided in Appendix A.2.
Community Inventory
Community Inventory
In Orange County, total community emissions were 1,631,671 MT CO2e. This result includes emissions from the combustion of fuel for transportation and mobile services, onsite burning of natural gas in commercial, residential, and industrial buildings, emissions linked to electricity procurement for commercial, residential, and industrial edifices, emissions connected to water and wastewater services within the County, as well as solid waste emissions emanating from the County. this report. Each inventory should be considered as a benchmark for future emission reductions. Calculation methodologies for all results are provided in Appendix B.
In Orange County, total community emissions were 1,631,671 MT CO2e This result includes emissions from the combustion of fuel for transportation and mobile services, onsite burning of natural gas in commercial, residential, and industrial structures, emissions linked to electricity procurement for commercial, residential, and industrial edifices, emissions connected to water and wastewater services within the County, as well as solid waste emissions emanating from the County
Table 1: Orange County Community Inventory by sector
TABLE 1: ORANGE COUNTY COMMUNITY INVENTORY BY SECTOR
COMMERCIAL ENERGY
Commercial energy is the largest emitter of the three classes of energy emissions (the others being residential and industrial), producing 556,800 MT CO2e. Data on commercial electricity energy consumption was provided by Piedmont Electric Cooperative, extrapolated from 2017 data from Duke Energy, and obtained from the cogeneration plants at the University of North Carolina Chapel Hill. Data for natural gas usage was sourced from Dominion Energy.
Of the commercial total, electricity accounted for 258,454 MT CO2e, natural gas contributed 79,263 MT CO2e, and coal-powered cogeneration accounted for 219,083 MT CO2e. Thus, commercial energy constitutes 34% of total community emissions in Orange County.
Figure 4. Commercial Energy Breakdown
COMMERCIAL ENERGY
RESIDENTIAL ENERGY
Residential energy consumption incorporates emissions from natural gas combustion, electricity production, the burning of Liquid Petroleum Gas (LPG), and the use of distillate fuel oil No. 2, all specific to residential communities within Orange County. Data regarding Orange County's residential electricity usage was supplied by Piedmont Electric Cooperative and Duke Energy, while Dominion Energy provided data for natural gas. Statewide data served as the source for LPG and oil No. 2 usage - Orange County's proportionate share was established based on population demographics. Electricity data for 2019 from Duke Electricity was extrapolated from 2017 usage statistics.
Overall residential energy use contributed 299,216 MT CO2e. Of that total, emissions attributed to electricity was 200,750 MT CO2e, natural gas contributed 70,445 MT CO2e, LPG resulted in 26,538 MT CO2e, and distillate fuel oil no. 2 generated 1,483 MT CO2e. Residential energy constituted 19% of total community emissions.
RESIDENTIAL ENERGY
Figure 5. Residential Energy Breakdown
INDUSTRIAL ENERGY
Industrial Energy data was supplied by two entities: Dominion Energy for natural gas and Duke Energy for electricity. The cumulative emissions from industrial energy amounted to 33,626 MT CO2e. Industrial electricity accounted for 18,024 MT CO2e, making up 53% of all emissions from industrial energy. Emissions originating from the combustion of natural gas totaled 15,602 MT CO2e, contributing to 46% of overall industrial energy emissions. Industrial energy usage comprises 2% of the total community emissions in Orange County.
Figure 6. Industrial Energy Breakdown
INDUSTRIAL ENERGY
TRANSPORTATION AND MOBILE SOURCES
Transportation and Mobile sources are the primary contributor of emissions in Orange County, generating 702,701 MT CO2e and accounting for 43% of the County’s total emissions. Orange County is characterized by its widespread rural communities, where reliance on cars is significant, leading to a considerable amount of Vehicle Miles Traveled (VMT) within the County. The emissions produced by gasoline fuel vehicles is 513,127 MT CO2e, while the emissions produced from diesel vehicles equaled 189,575 MT CO2e.
SOLID WASTE
Emissions resulting from the waste sector are derived from estimated methane production due to decomposition of solid waste generated in the County. These calculations incorporate data gathered from the landfill and consider factors such as methane capture processes. Solid waste disposal contributes to 1% of the total emissions in Orange County, accounting for 21,350 MT CO2e.13 In 2013, the County landfill, Orange County Regional Landfill in Chapel Hill, was closed. All subsequent solid waste has been disposed outside of the County. The methane that is still produced at the County’s retired landfill is being destroyed through a partnership with the University of North Carolina, Chapel Hill and the County. Data received from Universities Sustainability Office states that the following totals of CO2e have been destroyed during fiscal years 2020 and 2021: 25,000 MTCO2e (2020) and 22,000 MTCO2e (2021). These amounts generally correspond to the EPA14 and estimations from ClearPath calculations of landfill gas emitted for the same fiscal years: 23,940 MTCO2e (Calendar year 2020) and 18,490 MTCO2e (Calendar year 2021).
WATER AND WASTEWATER
The Orange Water and Sewer Authority (OWASA) manages some of the County’s potable water supply and wastewater disposal and supplied all related data. Total emissions from water and wastewater amount to 12,585 MT CO2e, accounting for 1% of total emissions across the County. Electricity emissions from potable water processes in Orange County are 1,763 MT CO2e. Wastewater electricity consumption is 2,446 MT CO2e and natural gas usage is 196 MT CO2e. Emissions from digester gas consumed 5 MT CO2e. Digester gas flaring emitted 68 MT CO2e. Nitrogen discharge from water treatment emitted 103 MT CO2e. Specific to the community inventory are emissions related to household septic systems which produced 8,004 MT CO2e.
PROCESSES AND FUGITIVE EMISSIONS
Fugitive emissions, which are defined as unintended leaks or releases of gasses during the transportation or handling of substances like natural gas, contribute less than one percent to the total emissions of the County, amounting to an equivalent of 5,393 MT CO2e. These inadvertent emissions can occur at various stages of production, processing, storage, transmission, and distribution.
13 Waste management and landfill operations in Orange County were undergoing changes during recent years, the information used is extrapolated from 2017 data.
14 https://ghgdata.epa.gov/ghgp/service/facilityDetail/2021?id=1005524&ds=E&et=&popup=true
County Operations Inventory
The following sections provide detailed insights into the municipal GHG emissions within Orange County. The County’s emitting sectors include buildings and facilities, vehicle fleets, transit fleets, and employee commuting. In 2019, the County's municipal activities generated a total of 19,359 MT CO2e, making up roughly 1% of the County's total emissions.
TABLE 2: ORANGE COUNTY’S COUNTY OPERATIONS INVENTORY BY SECTOR
BUILDINGS AND FACILITIES
Orange County's government-owned and operated buildings and facilities contribute 32% of the total emissions in the Municipal Inventory, and total 6,185 MT CO2e. The generation and consumption of electricity, along with the combustion of natural gas, are the primary sources of these emissions. Electricity usage for the government consumed 4,510 MT CO2e, where the natural gas combustion consumed 1,675 MT CO2e.15
VEHICLE AND TRANSIT FLEET
The County's vehicle fleet (i.e., County maintenance, County law enforcement vehicles, etc.) represents 11% of total emissions, producing 2,106 MT CO2e. Further, since the County contributes funds towards the operation of transit vehicles (buses, vans, etc.), a portion of those emissions are also included. The County’s share of the transit fleet produced 251 MT CO2e.
EMPLOYEE COMMUTE
A survey of commuting habits was disseminated among all Orange County employees to gauge the carbon impact of the daily commute by the County's workforce. Based on the surveys, employee commuting is estimated at around 33% of the total emissions generated by local government operations, producing 6,329 MT CO2e.
15 The County does not have any streetlights under its jurisdiction, which are included at the community inventory level.
WATER AND WASTEWATER
Emissions associated with water and wastewater contribute to 23% of municipal emissions, as these services are managed and operated by government-owned programs. Electricity emissions from potable water processes in Orange County are 1,763 MT CO2e. Wastewater electricity consumption emitted 2,447 MT CO2e. Wastewater natural gas emitted 196 MT CO2e. Emissions from digester gas equal 5 MT CO2e. Digester gas flaring emitted 68 MT CO2e. Nitrogen discharge from water treatment emitted 103 MT CO2e. Total emissions from government related water and wastewater processes is 4,479.16
PROCESSES AND FUGITIVE EMISSIONS
Fugitive emissions account for less than 1% of the total emissions in the municipal inventory of Orange County and are estimated at 9 MT CO2e.
Conclusion
In 2019 in Orange County, the community generated a total of 1,631,671 MT C02e and County government operations produced 19,359 MT CO2e. The most significant contributors were transportation and mobile sources, accounting for 43% of community emissions. Commercial energy sources, including electricity, natural gas, and UNCCH Cogeneration Coal Boilers, were the second highest contributor, constituting 34% of the emissions. Residential energy was the third highest contributor; other sources contributed relatively minor amounts in comparison. As for the emissions attributable to Orange County's government operations, three primary areas were prominent: Employee commute, Buildings and Facilities and Water and Wastewater are responsible for 33%, 32%, and 23% of the total emissions, respectively. Moving forward, Orange County is committed to maintaining its leadership role in North Carolina's efforts to reduce greenhouse gas emissions.
16 This is not considered double counting emissions according to ICLEI protocols, since these are two separate inventories. In other sectors, municipal data is included in the community inventory in a less explicit way. For example, all County’s municipal facilities electricity is included in the community’s commercial electricity.
Appendix A .1: Attached Use Data
Appendix A.1: Attached Use Data
COMMUNITY INVENTORY
Community Inventory
Piedmont Electric Cooperative 2019
Orange County U S Census, and Energy Information Administration (EIA) 2019
Orange County U S Census, and Energy Information Administration (EIA) 2019
Energy 2019.
Annual Air Emissions Inventory Cogeneration Facility 78
COMMUNITY INVENTORY CONTINUED
Community Inventory
2018 Annual Air Emissions Inventory Cogeneration Facility
Piedmont Electric Cooperative 2019
Google Environmental Insights Explorer (EIE) 2019
Dominion Energy 2019
Google Environmental Insights Explorer (EIE) 2019
Orange County U S Census, and Energy Information Administration (EIA) 2019
2019 Orange Water And Sewer Authority (OWASA) Gas
Orange County U S Census, and Energy Information Administration (EIA) 2019
2019 Orange Water An d Sewer Authority (OWASA) Wastewater
Dominion Energy 2019.
2019 Orange Water And Sewer Authority (OWASA)
2019 Orange Water And Sewer Authority (OWASA)
Piedmont Electric Cooperative 2019
Piedmont Electric Cooperative 2019
2019 Orange Water And Sewer Authority (OWASA)
Orange County U S Census Data
2019 Orange Water And Sewer Authority (OWASA) County Operations Inventory
Orange Water And Sewer Authority (OWASA)
COUNTY OPERATIONS INVENTORY DATA
County Operations Inventory Data Activity
Building and Facilities
Vehicle Fleet Gallons
Transit Fleet Gallons
Digester Gas Combustion scf/day
Digester Gas Flaring cubic feet/day
Wastewater Natural Gas Therms
Orange Water And Sewer Authority (OWASA)
Orange Water And Sewer Authority (OWASA)
Orange Water And Sewer Authority (OWASA)
And Sewer Authority (OWASA)
Orange Water And Sewer Authority (OWASA)
Appendix A.2: Detailed Methodology
COMMUNITY INVENTORY
ELECTRICITY
Residential, commercial, and industrial electricity usage data for 2019 was furnished by Duke Energy and Piedmont Electric Cooperative. The process of determining emissions involved multiplying electricity usage by the emissions factor relevant to the jurisdiction where the electricity was generated. ICLEI: Local Governments for Sustainability17 provided emission factors for local jurisdictions, which is based on data from the EPA Emissions Hub for SERC Virginia/Carolina (SRVC) eGRID 2019. The specific emission factors are as follows: the CO2 emission factor is 0.089765 MT/MMBtu, the CH4 emission factor is 7.7084 x 10⁻⁶ MT/MMBtu, and the N2O emission factor is 1.0632 x 10⁻⁶ MT/MMBtu. When these are added to carbon emissions the result is CO2e which represents the total Global Warming Potential.
Duke Energy's recent billing modifications resulted in the loss of certain emission data for 2019. This prompted us to estimate emissions using the growth rate of Orange County from 2010-2020 using census data. The County experienced an average annual growth rate of 1.1%, which we used as the basis for our electricity usage estimations. For example, in 2017, residential electricity usage from Duke amounted to 467,602,240 kWh. After applying the growth factor, we estimated that Duke's residential electricity for 2019 would be around 477,946,069 kWh. We used the same method to estimate commercial electricity usage growth from 776,643,905 kWh to 793,824,044.8 kWh. We also estimated that Duke's industrial energy usage would rise from 57,245,643 kWh to 58,511,973.87 kWh.
NATURAL GAS
Data on residential and commercial natural gas was provided by Dominion Energy. The calculation of natural gas emissions involves multiplying the usage data by an emission factor provided by the US Community Protocol BE.1.1.18 The respective emission factors are 53.02 kg/MMBtu CO2, 0.005 kg/MMBtu for CH4, and 1 xE-4 for N2O. The full methodology is detailed in the U.S. Community Protocol for Accounting and Reporting of Greenhouse Gas Emissions Appendix C: Built Environment Emission Activities and Sources.
LPG AND DISTILLATE FUEL OIL NO.2
These categories are calculated using data from the United States Census Bureau information19 and methodologies from the US Community Protocol. 20 The Census Bureau tracks statewide residential non-utility fuel usage. To determine the proportion of fuel usage in Orange County, we compared the number of households in the County
17 U.S. Community Protocol for Accounting and Reporting of Greenhouse Gas Emissions Appendix C: Built Environment Emission Activities and Sources.
18 U.S. Community Protocol for Accounting and Reporting of Greenhouse Gas Emissions Appendix C: Built Environment Emission Activities and Sources
19 https://data.census.gov
20 U.S. Community Protocol for Accounting and Reporting of Greenhouse Gas Emissions Appendix C: Built Environment Emission Activities and Sources
using each type of fuel to the total number of households in the entire state using the same fuel type. In Orange County, 6,078 households use bottled, tank, or LP gas, and 445 use fuel oil, kerosene, or similar fuels. Statewide, 256,257 households use bottled, tank, or LP gas, and 91,569 use fuel oil, kerosene, etc. The proportion of households in Orange County using bottled, tank, or LP gas is 0.0237, while the proportion using fuel oil, kerosene, etc., is 0.0486. To calculate the County's share of energy consumption, we multiply these proportions by the statewide energy use. According to data from the US Energy Information Administration, 21 North Carolina consumes 17.6 trillion Btu of Hydrocarbon Gas Liquids (HGL, which includes LPG) and 4.1 trillion Btu of Distillate Fuel Oil. After converting these figures from trillion Btu to MMBtu and applying Orange County's proportions, we estimate that the County's consumption of LPG is 417,443 MMBtu and its consumption of Distillate Fuel Oil #2 is 19,925 MMBtu. These estimates are calculated to carbon equivalencies using the US Community Protocol in ICLEI, applying emission factors of 62.98 kg/MMBtu for CO2, 0.01087 kg/MMBtu for CH4, and 0.0010870 kg/MMBtu for N2O.
COAL
Emissions data from the coal cogeneration boilers at the University of North Carolina at Chapel Hill are sourced from the 2018 Annual Air Emissions Inventory Cogeneration Facility report, prepared by ClimeCo Corporation in 2019. 22 Detailed information about emissions from Boiler 6 can be found on pages 31-33, while Boiler 7's emissions are documented on pages 54-56.
Transportation
and Mobile Service
TRANSPORTATION AND MOBILE SERVICES
Transportation emissions in Orange County were computed using the Google EIE transportation data, 23 a source recommended by ICLEI. The emissions factors are sourced from the US Community Protocol, 24 which are as follows:
Transportation emissions in Orange County were computed using the Google EIE transportation data,22 a source recommended by ICLEI. The emissions factors are sourced from the US Community Protocol,23 which are as follows:
CO2 Emissions Factor 0 07024
CO2 Emissions Factor Units
CH4 Emissions Factor
CH4 Emissions Factor Units
N2O Emissions Factor
N2O Emissions Factor Units
Solid Waste
21 https://www.eia.gov/state/search
MT/MMBtu
1 9493 x 10-8
MT/mile
1 0608 x 10-8
MT/mile
22 2018 Annual Air Emissions Inventory Cogeneration Facility. The University of North Carolina at Chapel Hill: Chapel Hill, North Carolina
23 https://insights.sustainability.google/places/ChIJEejT22XdrIkRPupCdcVJt0k?hl=en-US
24 U.S. Community Protocol for Accounting and Reporting of Greenhouse Gas Emissions Appendix D: Transportation and Other Mobile Emission Activities and Sources
COUNTY,
Due to the existence of five waste haulers in the County and the closure of the local landfill in 2013, tracking the amount of solid waste produced in Orange County proved challenging The destination landfill was unable to provide the required data in time for this report, necessitating an estimation of total solid waste based on 2017 levels and a growth factor for two subsequent years Emission factors were determined using the 2019 Orange County Recyclables Characterization Study24 and the 2017 Waste Characterization study25 conducted by Kessler Consulting. The following are the specific emission factors: Mixed MSW Emission Factor
SOLID WASTE
Due to the existence of five waste haulers in the County and the closure of the local landfill in 2013, tracking the amount of solid waste produced in Orange County proved challenging. The destination landfill was unable to provide the required data in time for this report, necessitating an estimation of total solid waste based on 2017 levels and a growth factor for two subsequent years. Emission factors were determined using the 2019 Orange County Recyclables Characterization Study25 and the 2017 Waste Characterization study26 conducted by Kessler Consulting. The following are the specific emission factors: Mixed MSW Emission Factor (MT CH4/wet short ton) 0.0648, Newspaper Emission Factor (MT CH4/wet short ton) 0.042, Office Paper Emission Factor (MT CH4/wet short ton) 0.1556, Corrugated Cardboard Emission Factor (MT CH4/wet short ton) 0.1048, Magazines/Third Class Mail Emission Factor (MT CH4/wet short ton) 0.0476, Food Scraps Emission Factor (MT CH4/wet short ton) 0.0648, Grass Emission Factor (MT CH4/wet short ton) 0.0228, Leaves Emission Factor (MT CH4/wet short ton) 0.026, Branches Emission Factor (MT CH4/wet short ton) 0.058. The calculation methodology was adopted from the US Community Protocol. 27
WATER AND WASTEWATER
Both potable water and wastewater systems consume electricity, and the emissions from this are calculated as previously outlined. Additionally, wastewater treatment processes utilize natural gas, the emissions from which are calculated using the aforementioned methods. The process of digester gas combustion is estimated using site-specific data obtained from OWASA. This information is converted into emissions data by applying emission factors from the US Community Protocols. Specifically, the Biogenic CO2 Emissions Factor is 52.07 kg/MMBtu, the CH4 Emissions Factor is 0.0032 kg/MMBtu, and the N2O Emissions Factor is 6.3 x 10⁻⁴ kg/MMBtu. Further details on digester combustion calculations can be found in US Community Protocols WW.1.A, WW2.A, and WW.3. Emissions resulting from the flaring of digester gas are also considered in this inventory. This is determined using site-specific data sourced from OWASA and adhering to the best calculation practices provided by the US Community Protocol. The CH4 Emissions Factor in this case is 1.2177 x10⁻⁷ MT CH4/scf. Daily nitrogen discharge is another factor incorporated in this inventory. Using the daily nitrogen load provided by OWASA, emissions data is calculated in line with the US Community Protocol. Here, the N2O Emissions Factor stands at 0.005 kg N2O/kg N in effluent. Additional details concerning effluent discharge can be referenced in the US Community Protocol, specifically WW.12. The final aspect of the water and wastewater analysis pertains to emissions from septic systems. While OWASA services the majority of households in
25 ORANGE COUNTY, NORTH CAROLINA RECYCLABLES CHARACTERIZATION STUDY, Kessler Consulting, Inc.
26 https://www.orangecountync.gov/DocumentCenter/View/2826/ 2017-Orange-County-Waste-Characterization-Study-Final-Report-PDF
27 U.S. Community Protocol for Accounting and Reporting of Greenhouse Gas Emissions Appendix E: Solid Waste Emission Activities and Sources
Orange County, approximately 65,000 are not covered by the local wastewater agency. This results in widespread use of septic systems for wastewater disposal. Emissions from these systems can be calculated using a population-based method, which incorporates a CH4 Emissions Factor of 0.048213 MT CH4 per daily kg BOD5. An alternative calculation approach is documented in the US Community Protocol under reference WW.11 (alt). 28
FUGITIVE EMISSIONS
Fugitive emissions were calculated by usage data summed from natural gas. This was multiplied by a leakage factor of an industry standard recommended by the U.S. Community Protocol. 29 The leakage emissions are multiplied by an emissions factor of 6.1939x10⁻⁵ MT CH4/MMBtu natural gas used, and CO2 emission factor of 6.6316 x 10⁻⁵ MT CO2/MMBtu natural gas used.
COUNTY OPERATIONS INVENTORY
BUILDINGS AND FACILITIES
Orange County’s buildings and facilities emissions were calculated using usage data obtained from the government's tracking software. This software monitors both electricity and natural gas usage data. The calculations were carried out in the same manner as those for the community inventory of natural gas and electricity.
VEHICLE FLEET
Fuel usage for Orange County’s vehicle fleet was supplied by the County and calculated using the US Community Protocol.30 The annual miles traveled, and annual fuel usage are tracked and multiplied by emission factors from ICLEI. These include a CO2 Emissions Factor of 0.070268 MT/MMBtu, a Biogenic CO2 Emissions Factor of 0 MT/MMBtu, a CH4 Emissions Factor of 2.153 x10⁻⁸ MT/vehicle mile, a Biofuel CH4 Emissions Factor of 0 MT/ vehicle mile, a N2O Emissions Factor of 1.248 x10⁻⁸ MT/vehicle mile, and a Biofuel N2O Emissions Factor of 0 MT/vehicle mile.
TRANSIT FLEET
Data on Orange County’s transit fleet usage was also provided by the County. This data was broken down by vehicle types, with transit fleet vehicles identified as buses within the data sheet. Emission factors for transit fleet buses include a CO2 Emissions Factor of 0.07024 MT/MMBtu, a CH4 Emissions Factor of 1.93 x 10⁻⁸ MT/vehicle mile, and a N2O Emissions Factor of 1.48 x10⁻⁸ MT/vehicle mile.31
28 U.S. Community Protocol for Accounting and Reporting of Greenhouse Gas Emissions Appendix F: Wastewater and Water Emission Activities and Sources
29 https://www.edf.org/sites/default/files/US-Natural-Gas-Leakage-Model-User-Guide.pdf
30 U.S. Community Protocol for Accounting and Reporting of Greenhouse Gas Emissions Appendix D: Transportation and Other Mobile Emission Activities and Sources
31 U.S. Community Protocol for Accounting and Reporting of Greenhouse Gas Emissions Appendix D: Transportation and Other Mobile Emission Activities and Sources
EMPLOYEE COMMUTE
Data on employee commutes was provided by the 2019 commuting survey of Orange County employees. This survey asked employees about their commuting habits, and total annual Vehicle Miles Traveled (VMT) was extrapolated from the responses. While the survey results did not include total mileage, it was possible to calculate this by multiplying the average miles per commute by the average workdays per week and then calculating the yearly VMT using the average number of working weeks in a year, which is 49.32 This yields the total annual commuting VMT for Orange County. The emissions were then calculated using the US Community Protocol emission factors of CO2 Emissions Factor 0.07024 MT/MMBtu, CH4 Emissions Factor 1.8300 x 10⁻⁸ MT/ Mile, and a N2O Emissions Factor 8.3 x 10⁻⁹ MT/Mile.
WATER AND WASTEWATER
The emissions from water and wastewater operations for Orange County's municipal activities were calculated in the same manner as in the community inventory.33 As OWASA is a municipal operation, its emissions should be included under those from the County. The difference between the two sectors is that the municipal inventory does not include emissions from septic systems.
FUGITIVE EMISSIONS
These are calculated in the same way as the community inventory. Fugitive emissions were calculated by usage data summed from natural gas used by the County operations. Usage was multiplied by a leakage factor of an industry standard recommended by the U.S. Community Protocol.34 The leakage emissions are multiplied by an emissions factor of 6.1939 x 10⁻⁵ MT CH4/MMBtu natural gas used, and CO2 emission factor of 6.6316 x 10⁻⁵ MT CO2/MMBtu natural gas used.
32 https://www.bls.gov/news.release/pdf/atus.pdf
33 U.S. Community Protocol for Accounting and Reporting of Greenhouse Gas Emissions Appendix F: Wastewater and Water Emission Activities and Sources
34 https://www.edf.org/sites/default/files/US-Natural-Gas-Leakage-Model-User-Guide.pdf
Appendix B: Methodology of Emission Forecast
Summary
This report describes greenhouse gas (GHG) emissions reduction targets and estimated forecasts that are identified in Orange County’s 2023 Climate Action Plan (the Plan). It also describes the County’s mitigation target plan to the year 2050. The report quantifies the carbon reduction impact that local and federal laws, utility grid mix changes, and transportation efficiencies will have on Orange County’s businessas-usual forecast, which results in an “adjusted business-as-usual forecast.” Finally, it provides visualizations of the results of Orange County’s “Top 10” emission reduction strategies from the Plan.
Provisional targets for Orange County’s GHG mitigation efforts are as follows:
1. Achieve 50% emissions reduction target by 2030 from a 2005 baseline
2. Achieve 100% emissions reduction by 2050 from a 2005 baseline
This “forecasting” report focuses on emissions in comparison to the 2005 baseline. In 2005 the total tracked emissions 1 for Orange County were 2,802,500 2 metric tons (MT) of carbon dioxide equivalents (CO2e). 3 In 2017 the GHG inventory was 1,777,667 MT CO2e. 4 The total emissions in 2019 fell to 1,631,671 MT CO2e which represented a reduction of 40.7% in 14 years. 5 Looking forward, a business-as-usual (BAU) 6 forecast for Orange County shows emissions will grow to 1,693,944 MT CO2e by 2030, and to 1,813,315 MT CO2e by 2050, if no further action is taken. The adjusted business-asusual (ABAU) forecast shows emissions will reduce to 1,311,816 MT CO2e in 2030, and to 947,191 MT CO2e in 2050; this forecast considers the expected effect of several policy measures that are described below. To achieve targets set in the 2023 Climate Action Plan emissions from sectors listed in the 2005 GHG inventory (residential, commercial, and industrial energy, transportation, and solid waste) should not exceed 1,410,250 MT CO2e by the year 2030. A 100% reduction in emissions would require significant investment in the strategies listed in the Plan, in addition to other actors achieving State and local policy goals (i.e. utility renewable energy targets, vehicle efficiency measures, etc.). If targets from policy goals plus the Top 10 Emission reduction strategies from the 2023 Plan are met, the County’s emissions will reduce to 993,646 MT CO2e by 2030 and 56,991 MT CO2e by 2050.
1 https://www.epa.gov/climateleadership/scope-1-and-scope-2-inventory-guidance
2 https://www.orangecountync.gov/DocumentCenter/View/2002/ Greenhouse-Gas-Emissions-Inventory-and-Forecast-PDF
3 The only sectors surveyed in the 2005 inventory were residential, commercial, and industrial energy, transportation, and solid waste. Further, The GHG inventory associated with this Plan comes from 2019 data.
4 https://www.orangecountync.gov/DocumentCenter/View/10049/ Orange-County-Greenhouse-Gas-Inventory-2017
5 In 2019 there was tracking of water and wastewater, and fugitive emissions from natural gas processes, which increased total emissions.
6 The business-as-usual forecast was estimated starting in the year 2019 using projected growth in population, households, employment, and vehicle miles traveled between 2010 and 2020. Projections were obtained from the United States Census Data. Data for the years 2020 and 2050 were estimated using straight-line interpolation from the USA Census.
policy goals plus the Top 10 Emission reduction strategies from the 2023 Plan are met, the C emissions will reduce to 993,646 MT CO2e by 2030 and 56,991 MT CO2e by 2050.
local policy goals (i.e. utility renewable energy targets, vehicle efficiency measures, etc.). If targets from policy goals plus the Top 10 Emission reduction strategies from the 2023 Plan are met, the County’s emissions will reduce to 993,646 MT CO2e by 2030 and 56,991 MT CO2e by 2050.
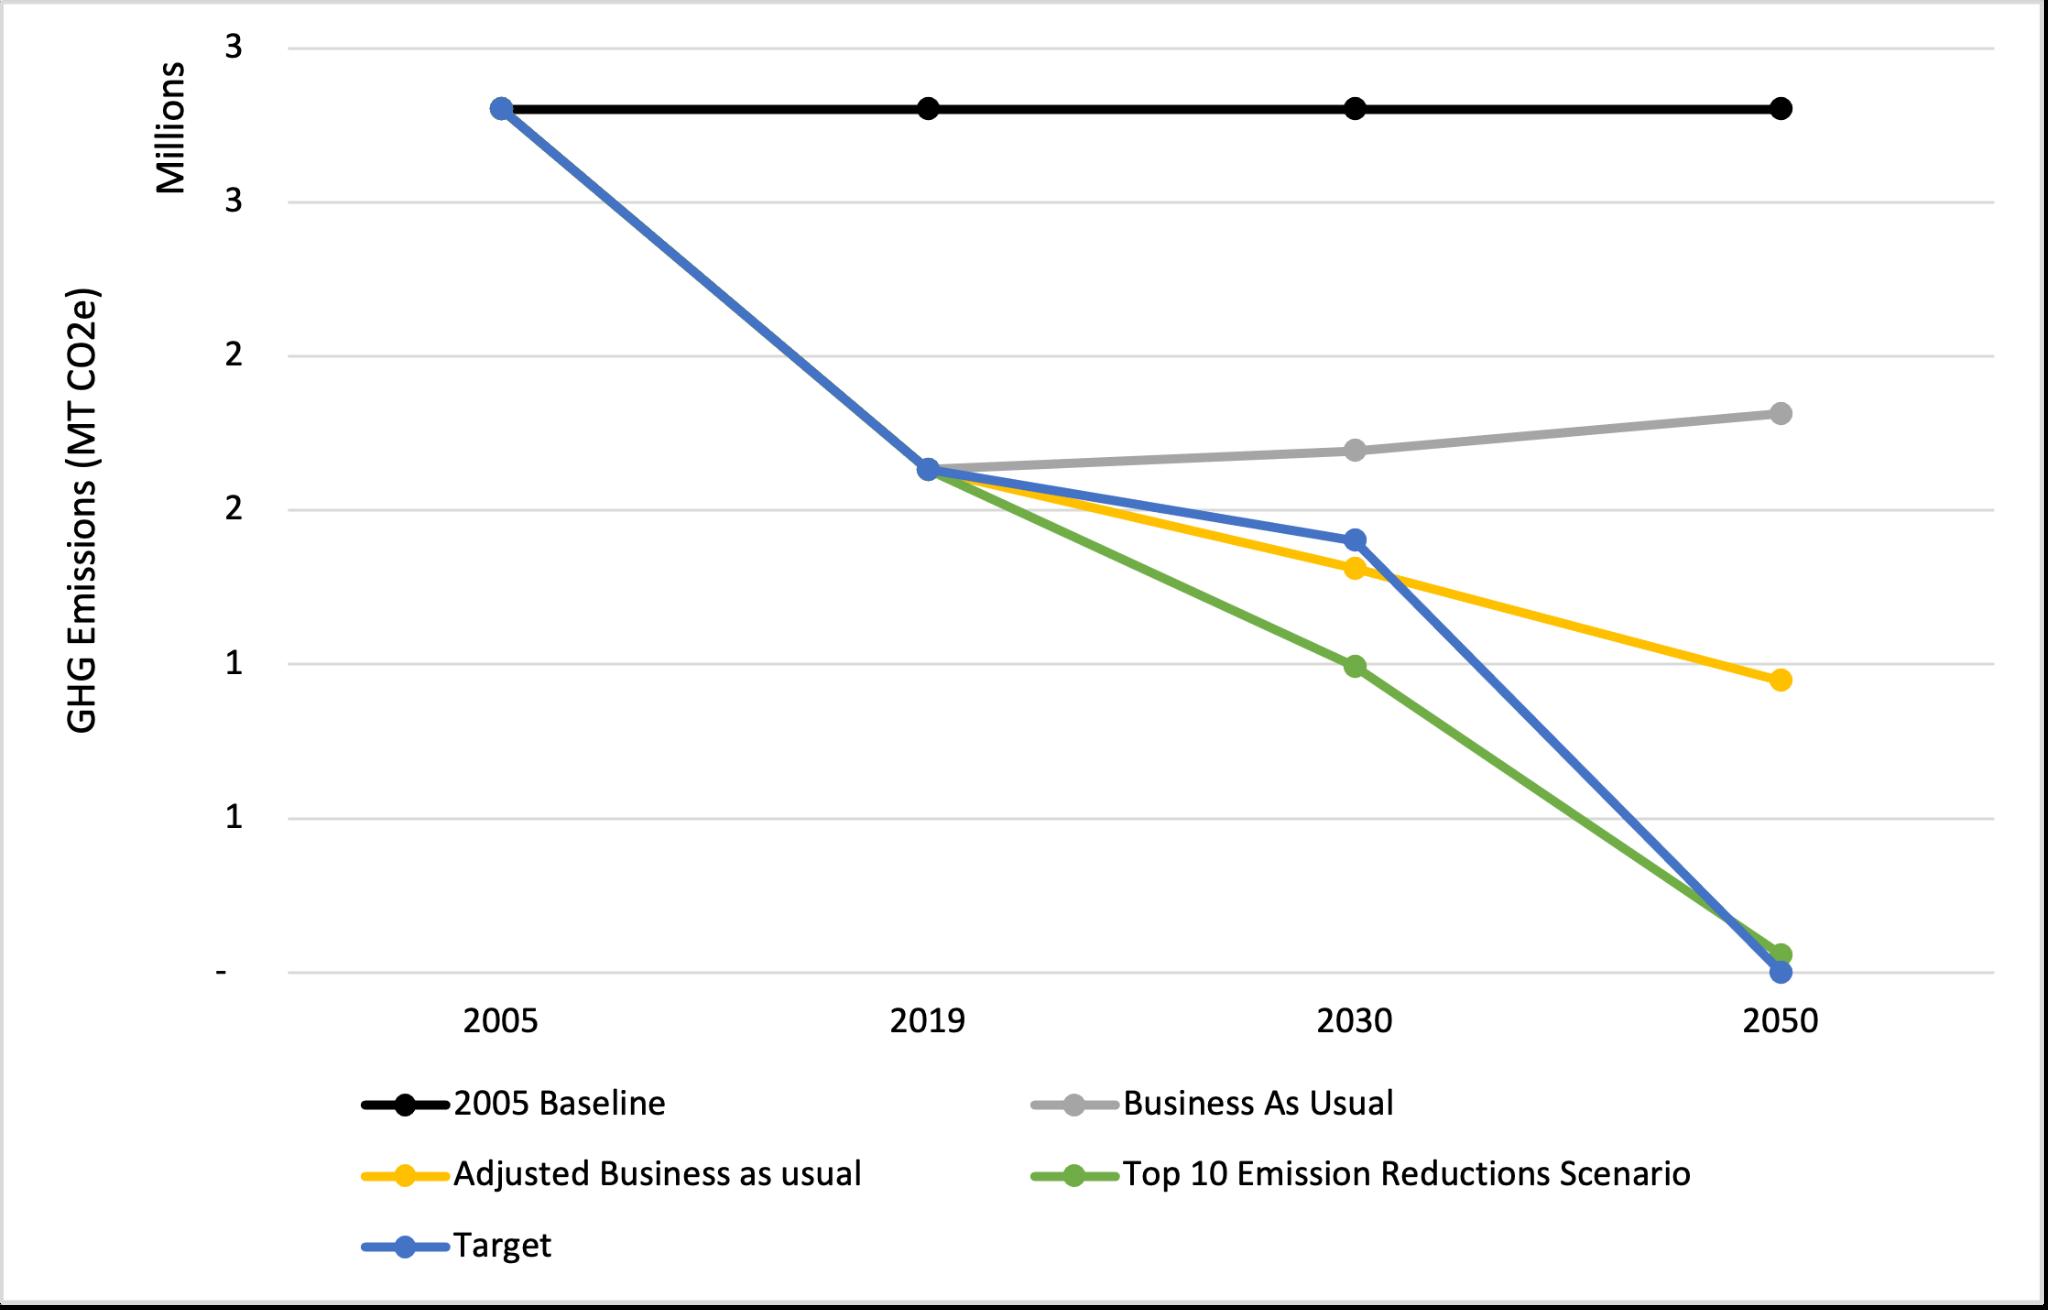
FIGURE 1: SUMMARY OF ORANGE COUNTY’S GHG EMISSIONS AND REDUCTION TARGET
FIGURE 1: SUMMARY OF ORANGE COUNTY’S GHG EMISSIONS AND REDUCTION TARGETS
FIGURE 1: SUMMARY OF ORANGE COUNTY’S GHG EMISSIONS AND REDUCTIO
Background
Background
Background
Orange County has set its goals within the context of a strong commitment for environmental mitigation from state and regional partners. The following describes several of the State, regional, and local policies that precede and form a foundation for the County’s Plan.
Orange County has set its goals within the context of a strong commitment for environmental mitigation from state and regional partners The following describes several of the State, regional, and local policies that precede and form a foundation for the County’s Plan
STATE GUIDANCE
Orange County has set its goals within the context of a strong commitment for envi mitigation from state and regional partners. The following describes several of the State, reg local policies that precede and form a foundation for the County’s Plan.
State Guidance
North Carolina Executive Order NO. 80 aligns the State to the 2015 Paris Agreement and the United States Climate Agreement. Further, North Carolina has ratified reduction targets for carbon emissions to 40% from 2005 levels.7 Executive Order 2468 builds upon the prior order to reduce GHG emissions by 50 percent below 2005 levels by 2030.
State Guidance
North Carolina Executive Order NO 80 aligns the State to the 2015 Paris Agreement and the United States Climate Agreement Further, North Carolina has ratified reduction targets for carbon emissions to 40% from 2005 levels7
House Bill 9519 authorizes utility companies in North Carolina to take necessary steps to reduce carbon emissions by 70% from 2005 levels by the year 2030, and to become carbon neutral in 2050.
North Carolina Executive Order NO. 80 aligns the State to the 2015 Paris Agreeme
House Bill 9518 authorizes utility companies in North Carolina to take necessary steps to reduce carbon emissions by 70% from 2005 levels by the year 2030, and to become carbon neutral in 2050
United States Climate Agreement. Further, North Carolina has ratified reduction targets for emissions to 40% from 2005 levels7.
7 https://www.deq.nc.gov/energy-climate/climate-change/nc-climate-change-interagency-council/ climate-change-clean-energy-plans-progress
8 https://governor.nc.gov/executive-order-no-246/open
9 General Assembly Of North Carolina Session 2021. Session Law 2021-165. House Bill 951
House Bill 9518 authorizes utility companies in North Carolina to take necessary ste carbon emissions by 70% from 2005 levels by the year 2030, and to become carbon neutral
7https://www.deq.nc.gov/energy-climate/climate-change/nc-climate-change-interagency-council/climate-c ange-clean-energy-plans-progress
The North Carolina Clean Energy Plan10 sets a net zero GHG emissions target for 2050 and established goals to support this target by fostering long-term energy affordability and accelerating clean energy innovation, development, and deployment to better serve business and residential communities. To support these goals, the plan states a commitment to develop carbon reduction policies, tools to support the policies, and to modernize the grid in support of clean energy resource adoption.
The Cities Initiative,11 led by the Environmental Defense Fund, is a collaborative effort among North Carolina local governments to reduce GHG emissions, evaluate barriers, understand business needs, and pursue partnership opportunities. During Phase 1, the Initiative identified 12 core goals around clean energy, transportation, and the built environment on which the collaborative will focus in the coming months. A large part of the process is to uncover funding approaches to support these goals. Phase 2 will unfold in 2024. During this phase, specific strategies and actions will establish a roadmap for implementation.
Triangle Clean Cities Coalition12 leverages resources from the Department of Energy’s Vehicle Technology office to promote alternative fuels and electric vehicle adoption. The coalition provides collaboration, multi-jurisdiction grant opportunities, workshop education and technical assistance to municipalities who are committed to finding sustainable transportation solutions.
Duke Energy has committed to a 50% reduction in emissions by 2030 and net zero emissions by 2050.13 Piedmont Electric Cooperative, another County supplier, also commits to reducing energy by 50% by 2030, and to achieving carbon neutrality by 2050.14
REGIONAL GUIDANCE
The Triangle Regional Resilience Partnership15 is a cooperative partnership among the Towns of Cary and Chapel Hill, the Cities of Durham and Raleigh, and the Counties of Durham and Orange. The Steering Committee is composed of the partners’ Sustainability Managers, Sustainability Directors, and Resilience Officers. This partnership—in conjunction with UNC Asheville’s National Environmental Modeling and Analysis Center and the Triangle J Council of Governments—performed a quantified assessment to help regional decision makers understand which assets are most vulnerable to specific threats and provide guidance on potential solutions.
10 “Clean Energy Plan. North Carolina Environmental Quality.” Clean Energy Plan | NC DEQ.
11 https://www.deq.nc.gov/energy-climate/climate-change/mitigation/cities-initiative
12 https://cleancities.energy.gov/coalitions/triangle
13 https://www.duke-energy.com/business/products/renewables/sustainability/ sustainability-goals#:~:text=We've%20already%20seen%20CO2,your%20higher%20carbon%20 energy%20usage.
14 https://pemc.coop/smart_energy/energy-portfolio/#:~:text=Piedmont%20Electric%20pledges%20 to%20reduce,providers%20to%20meet%20these%20goals.
15 https://www.centralpinesnc.gov/environment-resilience/climate-and-energy/triangle-regionalresilience-partnership
Triangle Sustainability Partnership has successfully initiated the “Solarize the Triangle” program, which hit its top goal of reaching Tier 8 pricing in its first year. It was also successful in lowering the cost of solar for all participants by thirty-seven cents per kilowatt ($0.37/kW), achieving $300,500 in annual utility bill savings, generating $5.98 million in new clean energy development, creating 1,731 kW of new clean energy capacity, and avoiding 3.5 million pounds of carbon dioxide annually. This program will be expanded in 2024 to focus on electrification with a new program entitled “Electrify the Triangle”.
Central Pines Regional Council (formerly Triangle J Council of Governments) is a resource and support hub for local governments, community members, and partners across Chatham, Durham, Johnston, Lee, Moore, Orange, and Wake counties. This public private partnership focuses on building networks to address gaps, overcome barriers, and surface funding opportunities in key areas, including Environment & Resilience and Mobility & Transportation.
The Southeast Sustainability Directors Network is another consortium with which Orange County is involved. The Network helps facilitate and advocate for regional climate initiatives, offers peer learning opportunities, equity resources, and information on regional funding.
Provisional GHG Reduction Targets
Blue Strike Environmental recommends the County adopt two GHG mitigation targets, one for 2030 and another for 2050. The targets are similar to those of nearby cities and the State of North Carolina. These goals are fully described in the 2023 Plan, but are summarized as follows:
1. Achieve 50% emissions reduction by 2030 from a 2005 baseline
2. Achieve 100% emissions reduction by 2050 from a 2005 baseline
These goals are consistent with state laws, regional partners, and local organizations regarding GHG mitigation. North Carolina identified a mid-term goal of reducing emissions by 50% by 2030 from a 2005 baseline, and a long-term goal of carbon neutrality by 2050 with Executive Order NO. 80, Executive Order NO. 246 and House Bill 951. By executing the strategies in the 2023 Plan, Orange County will meet these State guidelines. These targets are realistic given the surrounding local, regional, and state commitments, including those of the utilities from which the County draws its power.
TABLE 1: 2030 AND 2050 GHG EMISSIONS TARGETS
2030 Target (50% below 2005 Levels)
2050 Target (100% below 2005 Levels)
Neutrality
GHG Emissions Forecasts
Goals - Looking to 2050
Emissions Forecast
GHG emission forecasts can be used to estimate the effectiveness of the Plan’s carbon reduction strategies in reaching the County’s goals. Emission forecasts that include the implementation of the strategies, can be compared to forecasts that do not include the strategies, which are called Business as Usual (BAU) forecasts. An Adjusted Business as Usual (ABAU) forecast considers factors such as population and employment, projecting emission changes based on expected growth, but without the County taking any mitigation action. An ABAU forecast additionally considers the anticipated behaviors of outside actors on the County. A good example of such an actor is an electric utility company that has committed to reduce emissions from its energy mix; by virtue of their commitment, County emissions would fall due to declining emissions of the electricity used within the County. Finally, to measure the impact of the Plan, the GHG reduction potential of each strategy is subtracted from the BAU and/or ABAU forecasts.
To determine what the County ’s emissions might look like in 2050, a series of GHG emissions forecasts were developed As illustrated in Figure C, a Business-As-Usual forecast was developed to forecast the County ’s emissions without any additional action from federal, State, or local governments A series of growth factors such as population and household growth were applied to the County ’s baseline emissions. Without any add itional action, the County ’s emissions are expected to increase from 1,640,492 metric tons in 2019 to 1,823,115 metric tons in 2050
BUSINESS-AS-USUAL FORECAST
Growth factors
1. Population growth
2. Energy growth
3. Vehicle Miles Traveled
4 Household Growth
The Orange County business-as-usual forecast scenario shows an estimate of how GHG emissions would change between the years 2019 and 2050 if population trends, vehicle efficiencies, and energy usage continue, without further application of regulations that would reduce local emissions. As shown in Figure 2, under the 2019 business-as-usual forecast, Orange County’s GHG emissions are estimated to grow approximately 10% above 2019 emission levels by the year 2050 (from 1,631,674 MT CO2e to 1,813,315 MT CO2e).16
Figure C: Orange County Business as Usual
To project the County ’s emissions in 2050 including the expected impacts of State and local actions, an Adjusted Business-As-Usual forecast was developed This forecast, shown in Figure D, includes expected increases in fuel economy and building energy efficiency in North Carolina, as well as the local utility companies' commitments to 50% emissions reduction in 2030 and net zero emissions by 2050.
FIGURE 2: BUSINESS-AS-USUAL FORECAST
16 This forecast was developed in the ICLEI ClearPath program and utilizes baseline annual population growth which is calculated to be approximately 1.1% as according to the US Census Bureau between 2010 and 2020.
ADJUSTED BUSINESS-AS-USUAL FORECAST
There are several federal, state, and local regulations, along with organizational commitments, that have been enacted that would reduce Orange County’s GHG emissions. The influence of these regulations and commitments was quantified and included into the ABAU forecast to provide a more complete picture of emissions reductions to 2050. This forecast also shows the remainder of emissions the County will need to reduce if it wants to achieve carbon neutrality. As shown in the figure below, state regulations are expected to reduce Orange County’s business-as-usual GHG emissions by approximately 319,855 MT CO2e by 2030 and 684,480 MT CO2e by 2050.
North Carolina Executive Order NO. 80 aligns the State to the 2015 Paris Agreement and the United States Climate Agreement. North Carolina ratified targets for reducing carbon emissions 40% from 2005 levels.17 House Bill 951 18 provides for utility companies in North Carolina to take steps to reduce carbon emissions by 70% from 2005 levels by the year 2030, and further to become carbon neutral by 2050. Duke Energy has committed to a 50% reduction in emissions by 2030, and to net zero emissions by 2050.19 Piedmont Electric Cooperative has also committed to reducing energy by 50% by 2030, and to carbon neutrality by 2050. 20 Emission reductions from these commitments move the County towards green energy, with average reductions of 13,742 MT CO2 per year to 2050. The Corporate Average Fuel Economy (CAFE) standards also impact Orange County emissions by reducing the amount of carbon emitted by transportation and vehicle miles traveled. According to ICLEI ClearPath, increasing CAFE standards will reduce emissions by 1.8% per year. Within the County, CAFE standards can reduce emissions by an average of 8,322.6 MT CO2e annually.
17 https://www.deq.nc.gov/energy-climate/climate-change/nc-climate-change-interagency-council/ climate-change-clean-energy-plans-progress
18 General Assembly Of North Carolina Session 2021. Session Law 2021-165. House Bill 951
19 https://www.duke-energy.com/business/products/renewables/sustainability/sustainabilitygoals#:~:text=We've%20already%20seen%20CO2,your%20higher%20carbon%20energy%20usage.
20 https://pemc.coop/smart_energy/energy-portfolio/#:~:text=Piedmont%20Electric%20pledges%20 to%20reduce,providers%20to%20meet%20these%20goals.
1,800,000
RESIDENTIAL ENERGY TRANSPORTATION & MOBILE SOURCES PROCESS & FUGITIVE EMISSIONS
Development and Methodology
SOLID WASTE INDUSTRIAL ENERGY COMMERCIAL ENERGY
TOP 10 EMISSION REDUCTION STRATEGIES
Through quantitative and qualitative analysis, goals, strategies, and actions were identified to enable the County to form a clear path toward implementation Some of the strategies were derived from existing programs and policies within local and regional planning documents, while others emerged as new strategies drawn from the ongoing stakeholder process and the Climate Action Team subcommittee.
To evaluate the targets set in the 2023 Plan, Blue Strike modeled six of the Top 10 emission reduction strategies- those with associated quantifiable emissions reductions. Table 2 shows the annual emission reductions for each individual strategy. The annual emission reductions were calculated and modeled in the ICLEI ClearPath program.
CAP Strategy Development
Development Process:
• Preliminary quantitative and qualitative strategies identified and agreed upon
• Development of “Long List ” of CAP actions to implement each strategy
• Community and stakeholder feedback
TABLE 2: EMISSION REDUCTIONS STRATEGIES FROM 2023 CLIMATE ACTION PLAN
• Further refine into a “Short List ” of CAP actions
• Quantify emission reductions from actions
Decrease vehicle miles traveled (VMT) 30% from a 2019 baseline by 2050 613 MT CO2e/year
Development Tools
Increase community EV adoption to 50% by 2035 and 100% by 2050
There are two development tools that are being used to track annual progress of the CAP ICLEI tracks the success of GHG emission reductions over time and the Climate Action Tracker acts as an internal tracking system for staff roles and responsibilities, timelines and funding approaches.
MT CO2e/year
Achieve 50% energy emission reduction target by 2030 and 100% by 2050 using a 2005 baseline 30,871 MT CO2e/year
Achieve 100% clean renewable energy by 2050 in municipal and community sectors 912 MT CO2e/year
Local Governments for Sustainability is the first and largest global network of local governments devoted to solving the world’s most intractable sustainability challenges. They have produced an online software platform, ICLEI, which tracks GHG emissions and forecasts models for strategy implementation ICLEI also has a monitoring component, Clearpath, which can be used to report ongoing implementation of the CAP In ICLEI ClearPath each strategy developed can be inputted and updated with real time progress of
Complete an electrification study
Included in other strategies
FIGURE 3: ADJUSTED BUSINESS-AS-USUAL FORECAST
Figure D: Orange County Adjusted Business as Usual
Complete an electrification study
Included in other strategies
A forecast of emission reductions that includes the strategies is shown in Figure 4. When the strategies are added to the ABAU scenario the County could reduce its 2030 emissions to 993,646 MT CO2 per year, which achieves the target of 50% emission reduction by that year, against a 2005 baseline. By 2050 the County would emit just 56,991 MT CO2 annually, if the strategies are implemented. The remaining emissions are due to solid waste, water, and wastewater treatment The red uction of these remaining emissions, to fully meet a target of net zero emissions by 2050 is discussed in the 2023 Plan but is not quantified in the forecast.
A forecast of emission reductions that includes the strategies is shown in Figure 4. When the strategies are added to the ABAU scenario the County could reduce its 2030 emissions to 993,646 MT CO2 per year, which achieves the target of 50% emission reduction by that year, against a 2005 baseline By 2050 the County would emit just 56,991 MT CO2 annually, if the strategies are implemented. The remaining emissions are due to solid waste, water, and w
A forecast of emission reductions that includes the strategies is shown in Figure 4. When the strategies are added to the ABAU scenario the County could reduce its 2030 emissions to 993,646 MT CO2 per year, which achieves the target of 50% emission reduction by that year, against a 2005 baseline. By 2050 the County would emit just 56,991 MT CO2 annually, if the strategies are implemented. The remaining emissions are due to solid waste, water, and wastewater treatment. The reduction of these remaining emissions, to fully meet a target of net zero emissions by 2050 is discussed in the 2023 Plan but is not quantified in the forecast.
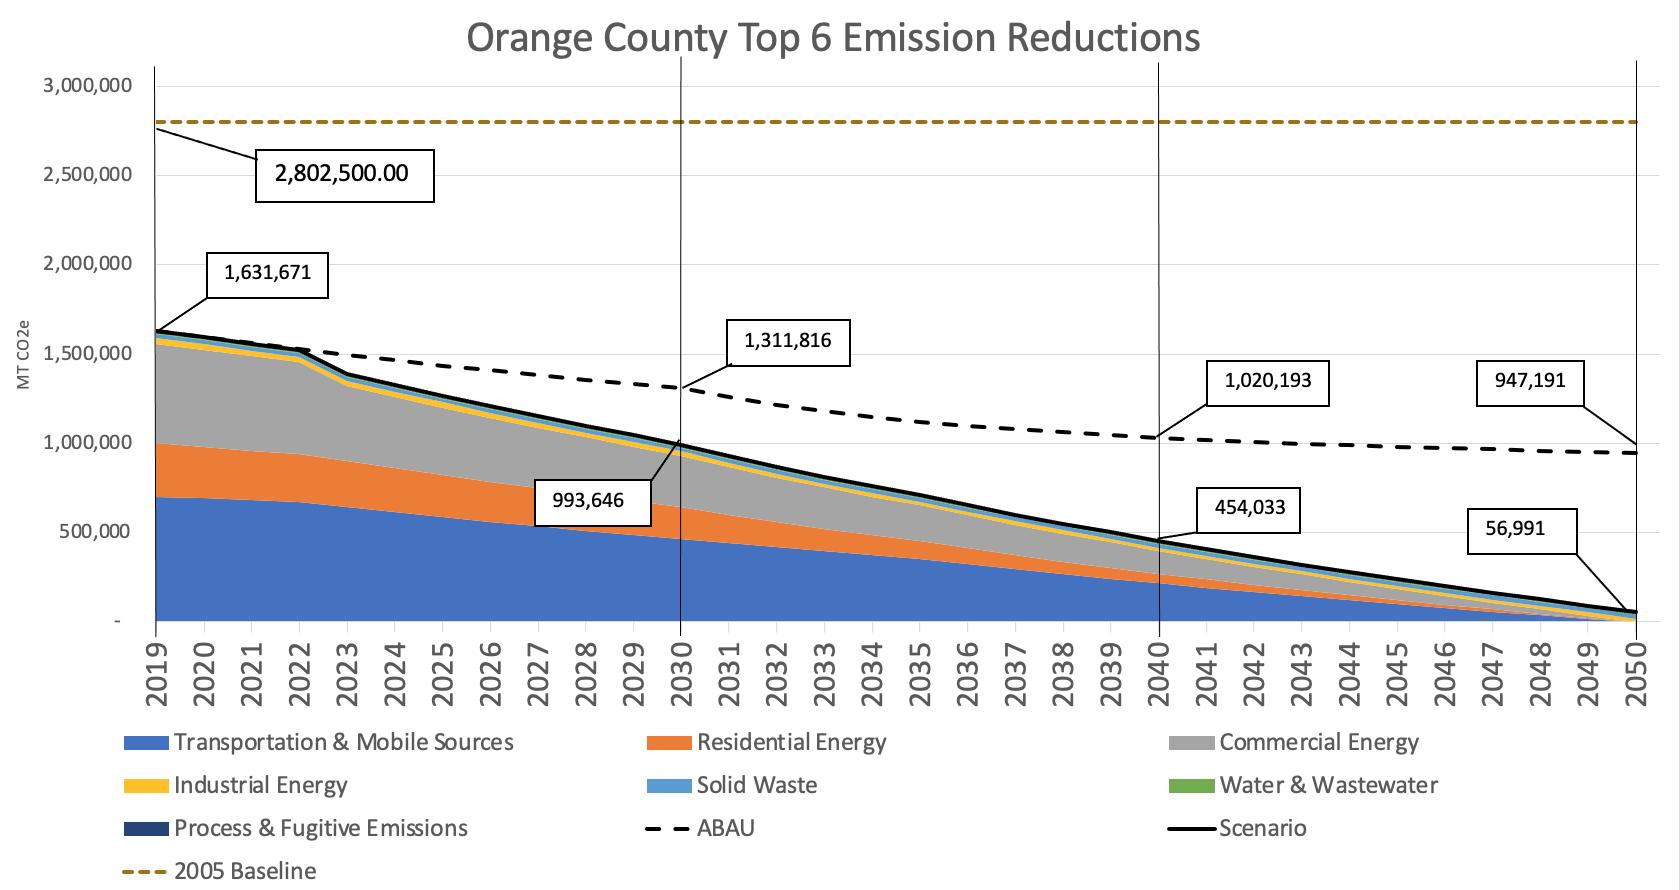
500,000
2,500,000 3,000,000 1,000,000 1,500,000 2,000,000 -
2,802,500
ecast of top 10 for 100%
FIGURE 3: ORANGE COUNTY TOP 6 EMISSION REDUCTIONS
Insert forecast of top 10 for 100%
Figure XX
7-10 are not specific to GHG emission reduction Instead, these strategies serve as guiding ks for consideration Expanded funding should be allocated to projects identified in the CAP al attention should be paid to additional staffing needs that might be necessary. In addition, all decisions should continue to weigh factors of environmental impacts against the social and impacts that these projects will present. Finally, all planning processes should adhere to the aintaining course to provide equitable solutions and to be prepared for climate change
reduction Instead, these strategies serve as guiding g should be allocated to projects identified in the CAP al staffing needs that might be necessary. In addition, all tors of environmental impacts against the social and nt. Finally, all planning processes should adhere to the solutions and to be prepared for climate change
n to the Top 10, goals, strategies, and actions are further developed throughout the CAP in the sectors: Transportation, Built Environment and Energy, Resource Conservation, Green ty and Resilient Community These sectors clearly map a qualitative and quantitative approach ble solutions that the County can take
older Engagement
Strategies 7-10 are not specific to GHG emission reduction. Instead, these strategies serve as guiding frameworks for consideration. Expanded funding should be allocated to projects identified in the CAP and special attention should be paid to additional staffing needs that might be necessary In addition, all planning decisions should continue to weigh factors of environmental impacts against the social and economic impacts that these projects will present Finally, all planning processes should adhere to the County maintaining course to provide equitable solutions and to be prepared for climate change
ctions are further developed throughout the CAP in the ment and Energy, Resource Conservation, Green tors clearly map a qualitative and quantitative approach
In addition to the Top 10, goals, strategies, and actions are further developed throughout the CAP in the following sectors: Transportation, Built Environment and Energy, Resource Conservation, Green Community and Resilient Community. These sectors clearly map a qualitative and quantitative approach to actionable solutions that the County can take.
Achieving emission reductions as substantial as those outlined in the 2023 Climate Action Plan will depend upon fully implementing the strategies of the 2023 Plan. By tracking these strategies, and regularly updating the GHG inventory, the County can look towards achieving its goals of 50% emissions reductions by 2030 and net zero by 2050.
ty engagement was a critical component of Orange County ’s CAP planning process. Community are the ones that experience the effects of its plan, projects and policies In the process of he CAP, Orange County worked (and will continue to collaborate) with existing universities, ons, small businesses, and public and private stakeholders in and around Orange County
nt of Orange County ’s CAP planning process. Community ts of its plan, projects and policies In the process of ll continue to collaborate) with existing universities,
Community engagement was a critical component of Orange County ’s CAP planning process Community members are the ones that experience the
Appendix C: Stakeholder Report
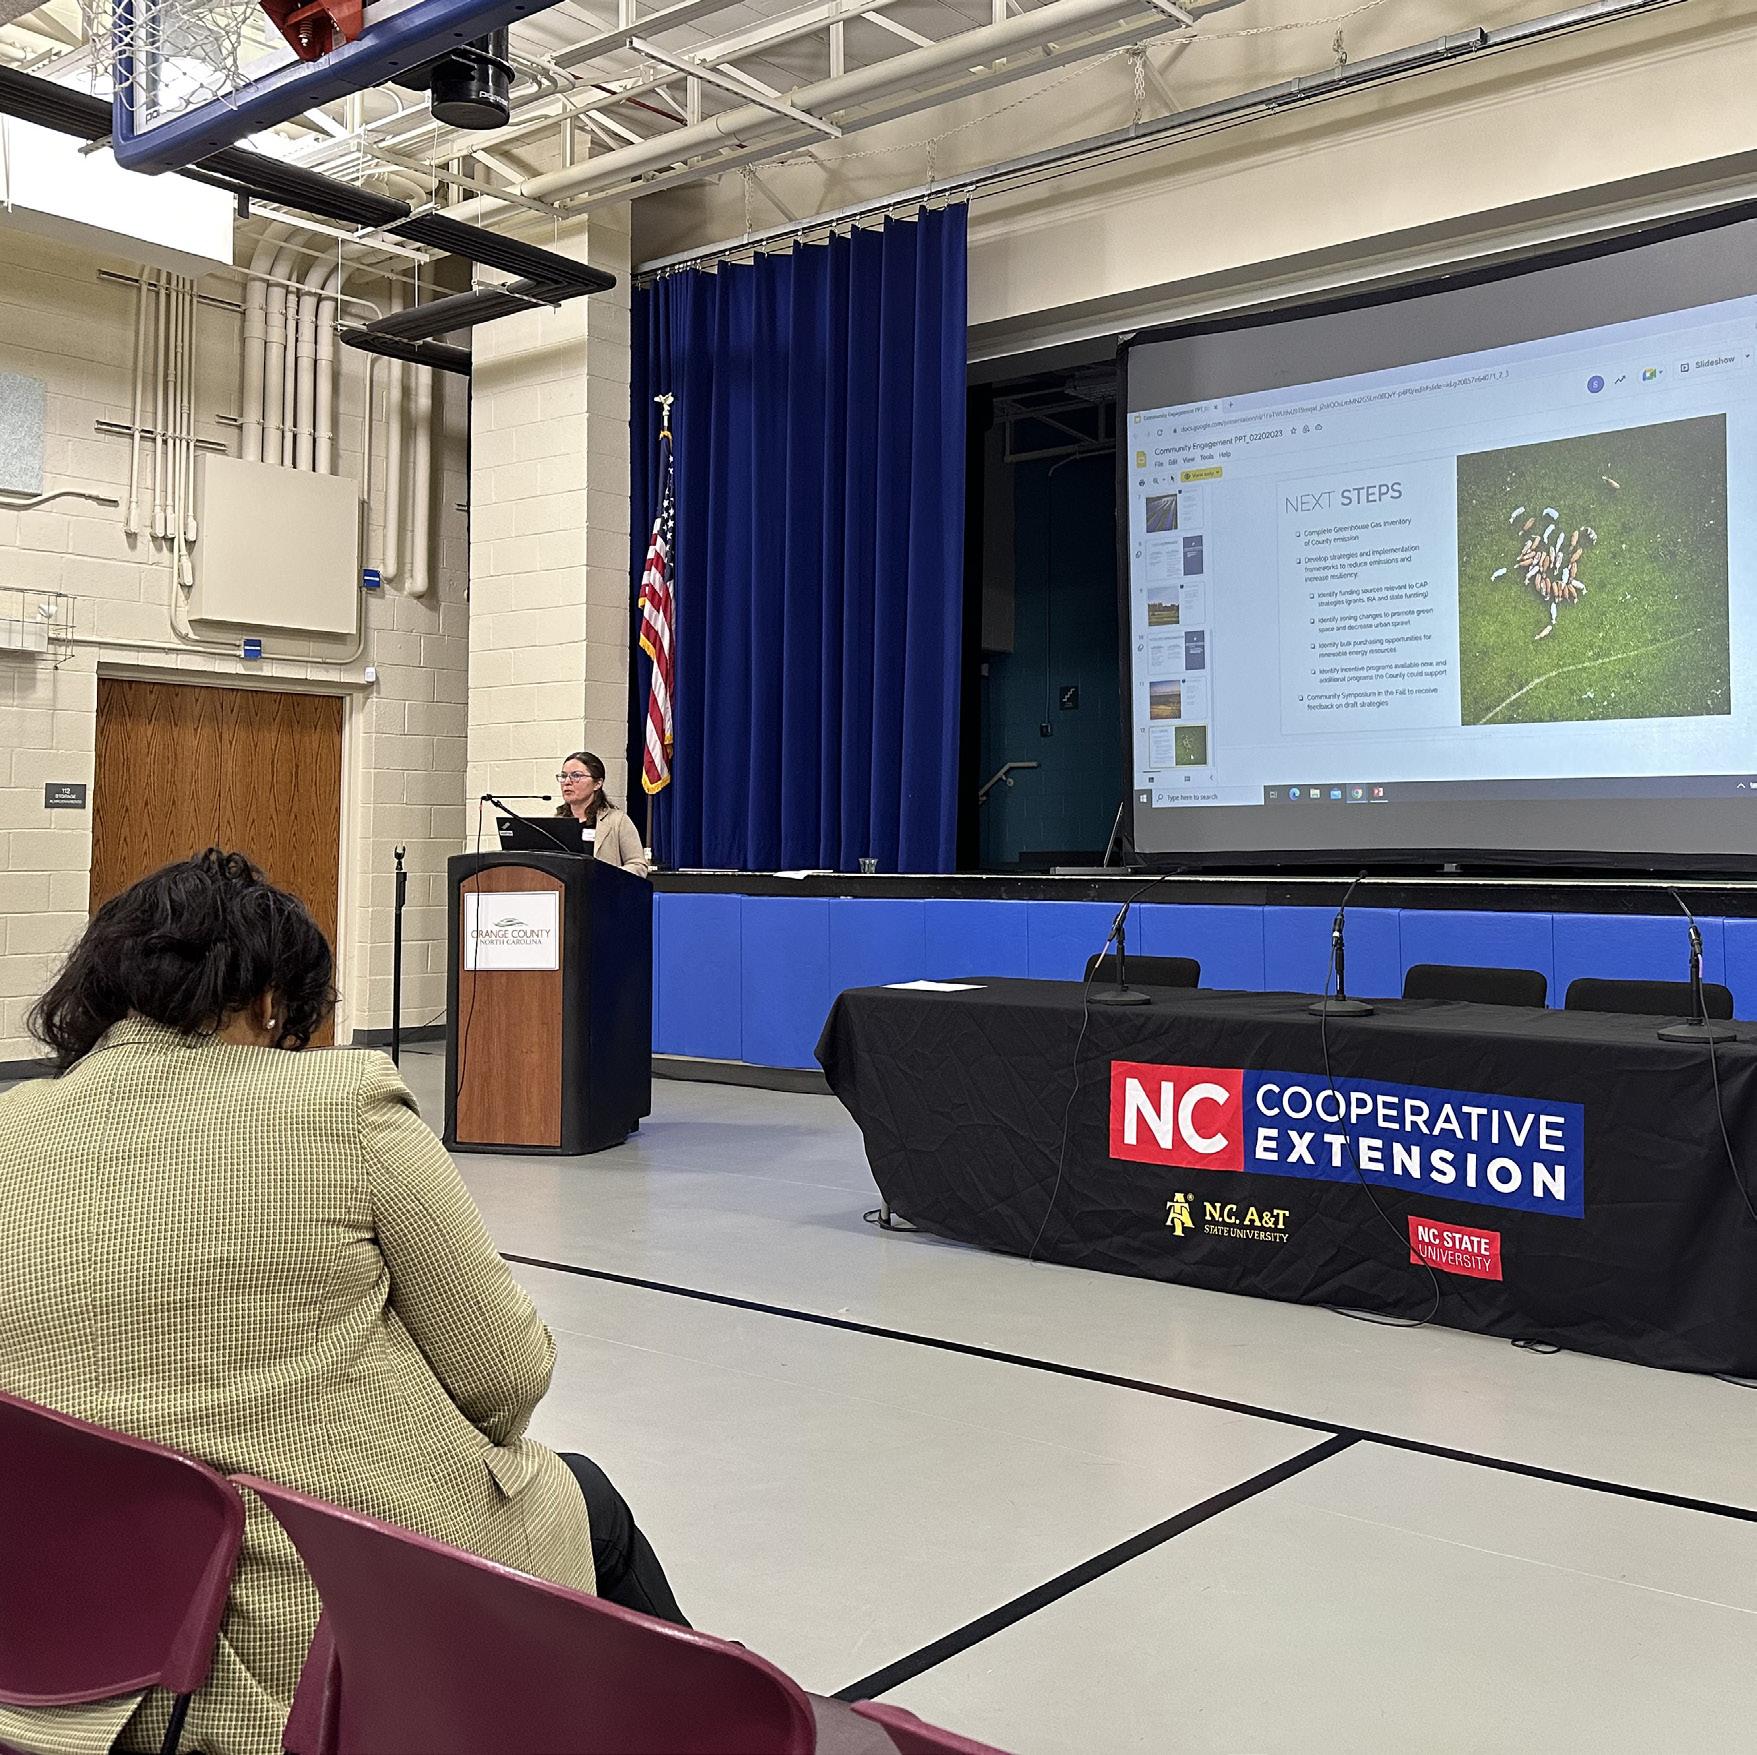
Background
The project team established a stakeholder outreach plan in advance of the CAP planning process. The purpose of this plan was to establish a baseline of actions taken by the County that were already underway, identify gaps and barriers for why some actions fell short, and to better understand what the communities’ values and goals are in the near, mid and long term horizon.
Four workshops were conducted over the course of three months. The Agricultural Summit was held in person and the remaining workshops were held on an online platform. This report highlights the feedback received.
Workshop #1 - Farming Community & Climate Impact
Date: February 20, 2023 • 11:00–12:00pm EST
Location: Orange County Agricultural Summit @ Cedar Grove Community Center
Est. Attendance: 40 people
KEY TAKEAWAYS (OPPORTUNITIES):
• Regional knowledge and resources to support carbon sequestration are lacking. Consider engaging in discussions with the water and soil district1 to explore the possibility of incorporating it into their education and outreach initiatives.
• Breeze Farms serves as an incubator farm and a pilot for various sustainability features, such as agro voltaics, EVSE, and carbon sequestration. This presents a significant opportunity to integrate climate action into conversations and determine the optimal utilization of the land.
• Currently, only two farmer/ranchers have small solar projects on their properties. Investigate Duke's restrictions and find solutions to facilitate bulk purchases.
• Local support is available, with Garland Truffles2 expressing interest in participating in the planning process.
• There are numerous programs and funding opportunities through NC Cooperative Extension. Explore possibilities for collaboration. The 2030 Comprehensive Plan3 is being updated by the Planning Department.
• A representative from the Community Land Trust4 attended the workshop and could serve as a valuable resource for education and outreach initiatives.
1 https://www.ocsoilny.org/agricultural-conservation.html
2 https://garlandtruffles.com/
3 https://berrydunn.mysocialpinpoint.com/orangecounty
4 https://www.nahb.org/-/media/NAHB/advocacy/docs/top-priorities/housing-affordability/case-studyorange-county-nc.pdf
● Local support is available, with Garland Truffles expressing interest in participating in the planning process.
● There are numerous programs and funding opportunities through NC Cooperative Extension Explore possibilities for collaboration The 2030 Comprehensive Plan is being updated by the Planning Department
• Determine the regulations pertaining to property line enhancements, as concerns were raised about the need for additional buffer zones between commercial and residential land units.
● A representative from the Community Land Trust attended the workshop and could serve as a valuable resource for education and outreach initiatives.
• There is limited knowledge regarding agroforestry. Define the potential role it could play in the Climate Action Plan (CAP).
● Determine the regulations pertaining to property line enhancements, as concerns were raised about the need for additional buffer zones between commercial and residential land units
● There is limited knowledge regarding agroforestry Define the potential role it could play in the Climate Action Plan (CAP)
• Agrotourism appears to be a popular topic. Assess the number of participating farms offering these services and establish how locally produced goods can contribute to the CAP.
● Agrotourism appears to be a popular topic Assess the number of participating farms offering these services and establish how locally produced goods can contribute to the CAP
We asked attendees to describe in one word their concerns about climate change. These were the results:
What is one word to describe your concern around climate change?
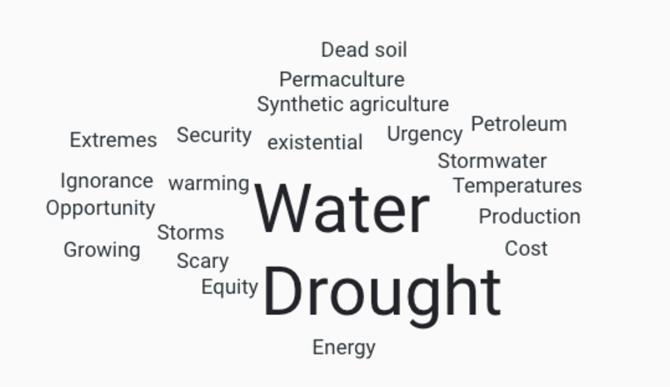
BEST PRACTICES: PRIORITIES
Best Practices: Priorities
Note: Attendees were asked to vote for the action items they would like to see implemented
Note: Attendees were asked to vote for the action items they would like to see implemented
- Promote water conservation and water-smart fixtures and appliances (1 dot)
• Promote water conservation and water-smart fixtures and appliances (1 dot)
- Increase waste diversion from construction and demolition debris (1 dot)
- Increase recycled and greywater use (3 dots)
• Increase waste diversion from construction and demolition debris (1 dot)
• Increase recycled and greywater use (3 dots)
• Increase the County’s tree canopy (3 dots)
• Pilot carbon farming opportunities (0 dots)
• Develop extreme heat protocols for outdoor workers (0 dots)
• Develop comprehensive riparian restoration plans (1 dot)
• Expand Green Infrastructure to reduce run-off (1 dot)
• Enact reflectivity standards for new development to reduce impact of Heat Islands (0 dots)
• Expand number of water fountains and cooling stations (0 dots)
• Update safety protocols to include climate hazards (1 dot)
• Adopt Green Building/Zero Net Energy building standards (0 dots)
• Develop County-supported energy efficiency programs (3 dots)
• Develop and incentivize residential and commercial fuel switching programs (1 dot)
• Development of on-site and off-site renewable energy projects (1 dot)
• Promote/incentivize the sale of electric vehicles in the County (1 dot)
• Expand the number of public and private EV charging stations (0 dots)
• Promote transit-oriented development principles for new development (3 dots)
• Increase the number of local public transit options (2 dots)
• Increase shared mobility options (bikes, scooters, etc.) (0 dots)
• Pass ordinance banning non-essential single use items (4 dots)
Workshop #2 - Business and Vendor Perspectives
Date: March 14 @ 9:00-10:30am EST
Location: Online via Zoom
Attendee(s):
• Jensen Anderson, Director of Community Engagement and Assistant to the President, Chapel Hill-Carrboro Chamber of Commerce
• Leigh Anne King, Clarion Associates
• David Shaw, CEO of Roc Records
• Scott Czechlewski, CEO, Hillsborough/Orange County (NC) Chamber of Commerce
KEY TAKEAWAYS:
GREEN COMMUNITY
• Reducing energy use and climate footprint in land use requires accessible office space located in town, but finding such space is challenging due to limited availability, particularly for smaller firms.
• Lack of affordable housing in their area could lead to people having to move further away and increase emissions from commuting.
• While businesses care about the environment, they may be hesitant to participate in a green business program due to current financial struggles.
• Complexity, cost, and time will be significant factors in getting the business community interested in a green business program. Need to start with easy, low-cost initiatives to get businesses invested, with community support and incentives being key motivators for participation. Food recovery program could be a good first step.
• If lots of businesses are participating in the program, others will (marketing/publicity important)
• Need to talk with developers/HOAs for green infrastructure (get boots on ground perspective/support)
• Some communities have implemented a sustainability point system in their ordinances, allowing developers to choose from a list of sustainable options to earn benefits such as increased density or an expedited process. Providing this flexibility and offering sustainable options is the way forward for building development.
• Opportunities for businesses to attract and retain customers through sustainability practices (brand loyalty). Local food network/recognition. The County could potentially support and create a network around this to encourage businesses to adopt sustainable practices.
- Example: David Shaw is a music distributor and he is actively working on becoming more sustainable in their manufacturing and packaging practices to improve their brand and attract more business.
• The County could provide resources such as networking sessions for businesses to share best practices and talk about cost, benefit, and analysis to help build out the conversation around sustainability practices.
RESOURCE CONSERVATION
• David Shaw’s Yep Roc label company, is interested in installing solar panels on their warehouse roof but the initial investment is a bit of a hurdle. Solarize the Triangle - He suggests having incentives for businesses to convert to more sustainable power and even install electric vehicle chargers. He also has a palette disposal issue and would benefit from a reuse program, as would other similar businesses in the area. Interest in building out a reuse market for C&D.
• There is a nonprofit organization called Don't Waste Durham5 that has implemented a program to work with local restaurants on using reusable takeout containers, and there may be interest from business owners in the County to participate in similar programs if they are financially viable.
• Incentivizing reusable practices such as bringing your own bag and offering discounts for businesses that participate, rather than penalizing those who use plastic bags or take out containers, could be more effective in reducing waste.
• Requiring new mixed-use spaces to have chargers for residents, would be important for addressing the issue of limited charging access in rural areas.
BUILT ENVIRONMENT
• Incentivizing LEED certification for construction through additional tax benefits as a means of ensuring that County standards are being followed.
TRANSPORTATION
• It would be helpful for businesses to have an EV playbook that guides them on the different levels of chargers, electrical capacity, and the process for installing EV chargers.
5 http://www.dontwastedurham.org
6
• Having quarterly networking sessions for discussing public transportation options for large manufacturing businesses and school buses could be helpful in reaching climate goal
• Working with the chamber networks to develop education programs around the Commuter Options program (Go Triangle program)
• More traffic may push people to take public transit, but there are interesting options beyond traditional transit, such as Wilson, NC's micro transit program partially paid for by the community. The program offers “on-demand trips' ' with smaller vehicles and are affordable.
• Providing more bike racks and water stations, to encourage people to use alternative transportation such as walking and biking
• Encouraging the inclusion of bike racks or garages in new apartment construction and showers in office buildings to increase bike usage and accessibility.
CLIMATE RESILIENCE
• Consider using tools like the CDC's Social Vulnerability Index and programs like Fern Leaf to identify disadvantaged populations in flood-prone areas and prioritize protection of important community assets from a safety standpoint.
• A discount or program to provide discounted generators for people with health issues who live in lower income areas would be helpful, especially since power outages can be a significant problem in those cases.
• Providing places like spray pads, pools, misters and similar amenities in outdoor malls and dining areas that can offer relief for people who do not have air conditioning during extreme heat events.
• Recommended to check out the Sustainable Development Code,6 a helpful website with sustainable development provisions by type, for resources on land use planning and zoning.
• Newsletter and quarterly network events would be a good way to disseminate information to the business community
Workshop #3 - Community
and Environmental Priorities
Date:: March 15 @ 1:00pm-2:30pm EST
Location: Online via Zoom
Attendee(s):
• Blake Tedder, Assistant Director of Engagement, Duke Forest
• Victor Lancaster
• Melissa McCullough, Vice Chair Orange Co Climate Council Chair, Climate Action Coalition of Orange Co.
• Kristin Prelipp, Orange County Community Relations
• Bill Black, Co-founder of the Orange County Business Owner Advisory Team
• Willim Ward
KEY TAKEAWAYS:
CLIMATE RESILIENCE
• To identify emergency response center, we should look at potential for resiliency hub at community center; solar and community gardens, resource to community and educational resource
- Communicate out? What is the plan? Especially to underserved communities
- Emergency services dept has communications in that regard, and community engagement office
- Social media announcements
• Social media is used to get the word out when there are climate threats. For underserved communities, and for people who do not have access to social media, they rely on community leaders and non-profits, as well as churches to disseminate info.
• 1 out of 10 people speak Spanish as first language; important to tap into all communities and strengthen relationships
• Need programs to educate the public on climate impacts.
• Explore options for engaging Duke or other local providers to approve or install microgrids and discuss potential concepts for implementing microgrids. Duke Univ. created programs the County could apply for.
• Melissa: expanding green infrastructure: lots relevant to education, but need to enable and expand green runoff in more diffuse way in order to address at the source; maybe tax incentives, or just get people to help in local neighborhoods; problems caused by what has been done in the past
RESOURCE CONSERVATION
• Want to talk to Habitat about expanding reusable items networks so more can be reused in County
• We should focus not just on where things go after purchase, but looking more upstream (ex.: using durables and reusable items). For example we could work with restaurants to build reuse program; identify partners/vendors, maybe have incentive program led by County
• Priority is on collaborating with the community; leverage County education programs/resources
• A curbside composting program is effective and becoming a standard practice, but requires education to emphasize its importance, and it can be replicated in OC.
• Melissa is the chair of the local Sierra Club and is willing to act as a conduit and suggests the Sierra Club could have a role in developing and implementing the CAP. She mentioned creating a train-the-trainer model. Need to follow up with her. She would be open to the idea of reposting social media posts or leveraging their newsletter, to help with outreach.
BUILT ENVIRONMENT
• IRA (Inflation Reduction Act) could be a significant resource for non-profits, local governments, and businesses, but the summary is too long and requires someone to coordinate and educate groups on how to tap into it effectively.
• County to develop a one-stop-shop type of website to educate on CAP and sustainability practices.
• Advocate for low-income individuals regarding IRA funding, which flows through states, and suggests using state representatives or emailing the governor's office to ensure that the state does not drop the ball.
• Natural gas is one of the biggest issues, and proactive County efforts are needed to help transition from gas to electric, which may require intervention and support in funding, resources, and branding. Orange County home preservation coalition could be a valuable partner to help low-income people navigate the transition.
• Interest in Solarize the Triangle, but funding is currently a barrier. Need to have templates to secure funding and a 30% credit from the Inflation Reduction Act (IRA) to expedite the request, which could be a significant incentive for developers.
• The transition to EVs is slow and needs more focus on multi-unit dwellings and minimizing costs, along with finding ways to make charging more accessible
• Exploring micro-mobility options like e-bikes and infrastructure incentives.
• Implementing a policy/requirement for all-electric new construction may face political challenges
• Need to make sure no disincentives for EV conversion, e,g. in the form of increased registration fees
GREEN COMMUNITY
• Breeze Farms serves as an incubator farm and a pilot for various sustainability features such as agro voltaics, EVSE, carbon sequestration, which presents a significant opportunity to weave climate action into discussions and explore how to best utilize the land
• The branding around native and water-efficient landscapes will be very important
• Audubon Society has programs/resources; could be good partner (“OC protects our pollinators”)
• Promoting locally-sourced food is a low-hanging fruit and an easy win in the Climate Action Plan, as there are already many farmers markets and a unified front could be created to link them together
• There is potential for an OC foods movement outside of restaurants.
• Opportunities to improve the natural environment include fighting sprawl, joining initiatives such as the Eno New Hope working group, which focuses on protecting and linking lands, as well as protecting streams.
• There is currently no value given to trees in Orange County and North Carolina, and exploring ways to quantify their value , such as through a Tree Master Plan, could be a potential recommendation for the Climate Action Plan.
• Melissa suggests initiatives that promote transitioning lawns towards native landscaping, and recommends a program to accompany efforts to support pollinators.
• There are currently no major obstacles for rainwater capture, and there are online resources available, but more hands-on workshops and exploration of programs such as those in California could be beneficial. The EPA EnviroAtlas is worth looking into
TRANSPORTATION
• Need to find a better way to publicize County commuter program
• The lack of bike lanes outside of Chapel Hill in the County and the high risk involved in using County roads are major barriers to walking and biking. Infrastructure improvements are necessary.
• While it may be challenging and expensive, there is an opportunity to coordinate with land linkage efforts for infrastructure, although wildlife habitat may pose some challenges for bike lanes.
• Bike infrastructure is a high priority, with a focus on creating an integrated network, securing funding sources, and linking opportunities with big employers, as well as exploring the possibility of converting abandoned railroads to bike/hike trails.
Workshop #4 - Student Voices
Date: March 23 @ 1:00pm-2:00pm EST
Location: Online via Zoom
Attendee(s):
• Environmental Club @ University of North Carolina at Chapel Hill
• 30 students participating in Climate Action Day
KEY TAKEAWAYS:
RESOURCE CONSERVATION
• Stickers in bathrooms and on washing machines were suggested as a way to encourage water-saving behaviors and promote more efficient washing cycles.
• Recycling bins were praised for being readily available in dorm rooms, while the addition of side-by-side recycling and trash bins in bathrooms was suggested for better waste separation.
• Presence of recycling and composting systems in dining halls and highlighted the involvement of the Green Guides program in educating students about proper waste sorting.
• The potential for implementing edible food recovery programs on campus was raised, as well as the focus on sustainability efforts by Carolina Dining Services.
• Implementation of Water Conservation Measures:
- Installing aerators in bathrooms and break rooms.
- Exploring the possibility of using dual handles in bathrooms for water conservation.
- Utilizing stickers in bathrooms and on washing machines to promote water-saving practices, such as adjusting washing cycles and reducing paper towel usage.
• Effectiveness of Recycling System:
- Recycling bins are provided in dorm rooms, but no trash cans are available.
- More trash cans than recycling bins on campus.
- Recycling and composting systems in dining halls.
- Green Guides program educates students on waste sorting.
- Accessibility of recycling facilities is considered good.
• Improvement in Waste Disposal Infrastructure:
- Suggestion for side-by-side recycling and trash bins in dorm rooms and bathrooms.
- Benefits of a 3-bin system or separate recycling and trash bins in all locations.
• Potential for Edible Food Recovery Programs:
- Awareness of composting programs like Compost Mates.
- Focus on sustainability in dining services, but no mention of edible food recovery programs.
- Interest in exploring the possibility of implementing edible food recovery initiatives.
GREEN COMMUNITY
• Incorporate green infrastructure practices, such as green roofs and rainwater collection systems, in campus buildings and facilities.
• Promote native and water-efficient plantings for landscapes on campus, reducing the use of pesticides and fertilizers.
• Explore collaborations with the local farm community to establish rooftop gardens and other innovative green initiatives on campus. For example, Eco-studio internships are focused on the edible campus gardens.
CLIMATE RESILIENCE
• Students consider climate impacts when making decisions about their future locations.
• Usage of reflective paint and the installation of misters in outdoor spaces on campus to mitigate heat island effects and enhance comfort for students, faculty, and staff.
• Assess the campus infrastructure to identify opportunities for incorporating stormwater catchment systems, swales, and vegetative solutions. These measures can help manage drought and flooding challenges, ensuring the availability and efficient use of water resources.
TRANSPORTATION
• Acknowledgement that the Chapel Hill transit system has programs in place to promote bus usage
• Program to reserve or rent a bike on campus so that students are able to bike to classes, or even off campus.
• It was noted that charging stations are already available on campus, and efforts by organizations like Orange County Anytown are underway to increase their number.
• The idea of providing rental electric vehicles to students for specific purposes was suggested as an appealing benefit.
• Limited parking on campus promotes sustainable transportation.
BUILT ENVIRONMENT
• The Renewable Energy Fee at UNC, managed by the Renewable Energy Special Projects Committee (RSPC), was mentioned, highlighting its significant budget and successful project implementation. The RSPC is a student-run committee that generates project ideas, presents proposals, and votes on funding allocation.
• Energy-saving measures implemented on campus included automated/sensor lights, solar panels on buildings, energy savings stickers, and low-flow showerheads.
• The potential use of technology and apps for waste sorting, water conservation, and sustainable choices was mentioned, although specific examples were not identified.
ADDITIONAL STUDENT OUTREACH
• Bladen Currier, Orange County Sustainability Intern did an outreach event at UNC’s Climate Action Day on April 13 where she extrapolated survey questions and had students put a mark next to the ones they agreed with. She also had a mural out where students could add pictures of climate action measures they would like to see in our community.
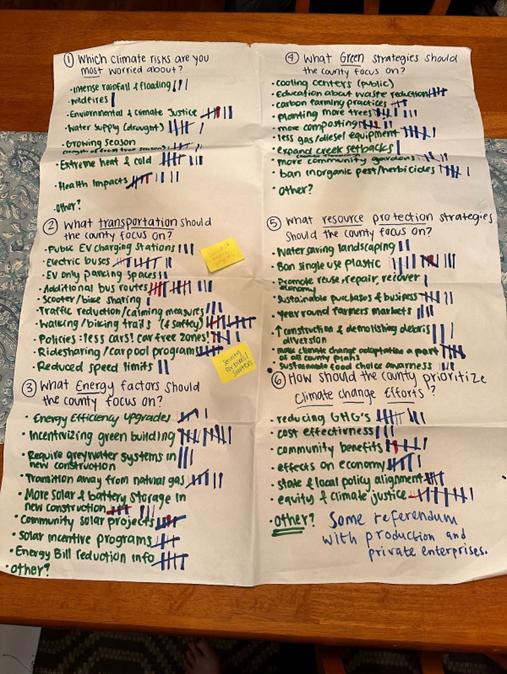
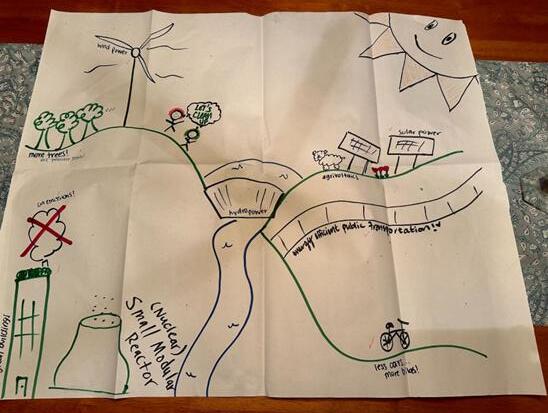
Top Image: The survey questions from the outreach event at UNC’s Climate Action Day on April 13, 2023. Images on right: Student mural project from the outreach event. Images by Bladen Currier.
Workshops #5 - Staff Perspectives
Date: April 20, 2023 @ 1:00 pm - 2:00 pm EST
Location: Online via Zoom
Attendee(s):
h . S h e a l s o h a d a m u r a l o u t w h e r e s t u d e n t s c o u l d a d d ip c t u r e s o f c l i m a t e a c t i o n m e a s u r e s t h e y w o u l d l i k e t o s e e i n o u r c o m m u n i t y . n e x t t o t h e o n e s t h e y a g r e e d w i t h . S h e a l s o h a d a m u r a l o u t w h e r e s t u d e n t s c o u l d a d d ip c t u r e s o f c l i m a t e a c t i o n m e a s u r e s t h e y w o u l d l i k e t o s e e i n o u r c o m m u n i t y .
● Bruce Woody, Assistant Director of Solid Waste
Workshops #5 - Staff Perspectives
Date: April 20, 2023 @ 1:00pm-2:00pm EST
Location: Online via Zoom
Attendee(s):
• Bruce Woody, Assistant Director of Solid Waste
• Chad Phillips, Deputy Tax Assessor
• Janice Tyler, Aging Director at Orange County Government
• Rhea Colmar, Nurse
• Caroline Hausler, Recycling Education and Outreach Coordinator
• Amy Eckberg, Sustainability Program Manager
KEY TAKEAWAYS:
RESOURCES CONSERVATION
• Inconsistency in Sustainable Resources across County Facilities: Discrepancies in resources across different County bathrooms were highlighted. Differences include the presence of automatic faucets and air blowers in some facilities but not all, which necessitates the need to consider the trade-offs when implementing sustainable solutions like installing electric hand dryers versus using paper towels, especially in older buildings.
• Proposal for Composting: Composting was proposed as a potential addition to County buildings, although usage levels were uncertain.
• Hybrid Working Model as a Resource Conservation Strategy: The newly approved hybrid working model was cited as a positive move towards conserving gas and reducing traffic.
• Preference for No Towels to Support Conservation Efforts: In order to save money and reduce waste, it was proposed that the County phase out the use of towels in the restrooms.
• Need for Facility Design Changes for Resource Conservation: Changes to facility design, like barrier-free entrances to restrooms, would be needed for some conservation measures. Challenges with temperature control were also noted, indicating room for optimization in heating and cooling systems.
• Struggles with Recycling and Waste Management: Struggles with recycling and waste management were identified. Public education on what materials are recyclable was cited as a major challenge, with policy initiatives such as wastewise events proposed as potential solutions.
GREEN COMMUNITY
• Promotion of Native Plants and Natural Landscaping: The use of native plants and natural landscaping instead of maintaining green grass lawns was suggested, which could reduce chemical use and water consumption. The County was suggested to set an example for the community in this regard.
• Appreciation for Local Farmers' Markets and Suggestions for Expansion: Local farmers' markets were appreciated and suggestions were made for bringing these markets to County buildings for easy access to County employees. Expansion of farmers' markets to underserved areas to tackle food deserts was also proposed.
• Opportunities within Agricultural Space: There was a consensus on the potential to expand on initiatives within the agricultural or farming space.
CLIMATE RESILIENCY
• Implementation of 2018 Assessment: One of the participants mentioned their involvement in the creation of the 2018 Assessment but was unsure whether the findings have been acted upon. It was suggested that the group needs to revisit the document, and potentially, COVID-19 has delayed some of the actions.
• Emergency Response System: It was stated that the County is doing well with its emergency response system, with improvements seen over the past five years. The system is effectively alerting the community during emergencies and efficiently setting up shelters.
• Assessment of Parking Spaces: A suggestion was made to assess the number of parking spaces and determine whether all are necessary. The idea is to reduce impervious pavement, lessen runoff, and create more green spaces. This approach aligns with a future vision of increased car-sharing, more public transportation, and reduced need for single-use vehicles.
• Cycling Infrastructure: It was recommended that the County invest more in creating safe spaces for cycling and preserving green spaces. The goal is to encourage residents to use alternative modes of transportation, such as bicycles, rather than relying on cars. A participant shared a vision for a greenway that connects different parts of the County, providing a safe and eco-friendly transportation route.
TRANSPORTATION
• Positive Response to EVs in County Fleet: The introduction of EVs in the County's fleet is seen as a positive step, with a recognition that more work needs to be done.
• Expansion of Bike Lanes and Greenways: Upgrades to bike lanes in Chapel Hill were positively received. Staff suggest similar upgrades and the addition of longdistance greenways connecting all parts of Orange County.
• Improvements in Public Transportation: Public transportation in Northern Orange is limited, and bus routes/schedules don't cater to everyone. Smaller, energyefficient buses or vans could be utilized during off-peak hours for a more reliable and frequent service.
• Expansion of Mobility On-Demand Service: There is a call to expand the mobility on demand service, which is currently limited in terms of hours and locations it's offered.
• Micro-vehicles over Larger Buses: A suggestion was made to switch from larger buses to smaller micro-vehicles in some areas.
• Concerns About Aging County Fleet: Concerns were raised about the aging and non-functional vehicles in the Orange County fleet, with an ongoing effort to improve the fleet.
BUILT ENVIRONMENT
• New Lighting System: A new $46,000 lighting system has been installed to a County’s facility to significantly reduce electricity use. This system uses sensors to turn off lights when rooms are not in use.
• Policy-Driven Energy Efficiency: There's a call for policy-driven approaches to energy efficiency, including mandating energy-efficient buildings for new constructions.
• Water-Saving Measures: Water-saving measures like aerators and low-flush toilets are mentioned as beneficial for energy saving.
• Energy-Saving Education and Incentives: Staff suggest more education or incentives to encourage energy-saving behaviors such as turning off lights and computers when not in use.
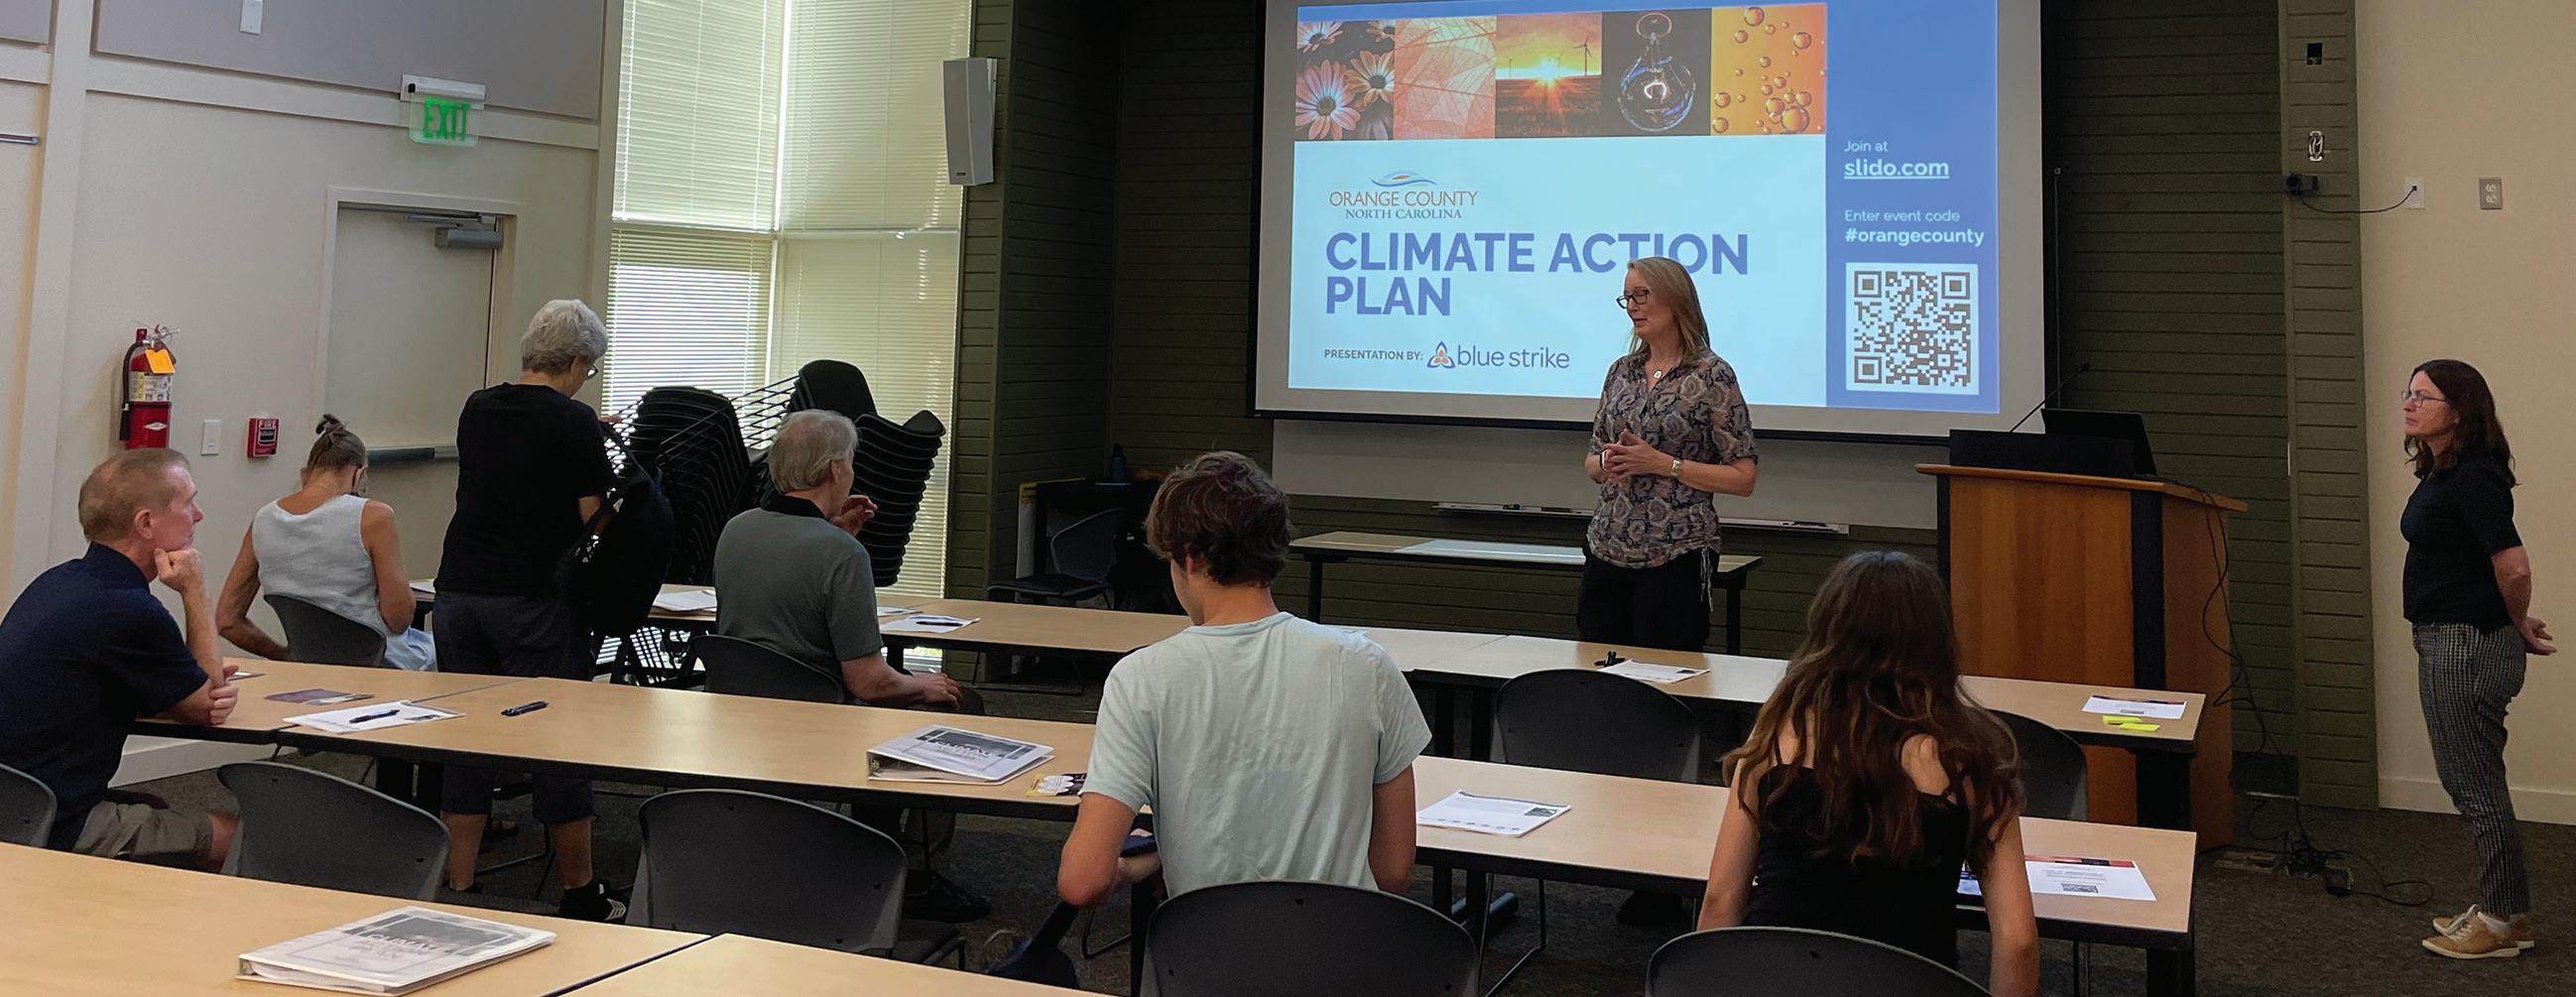
COMMUNITY SYMPOSIUM
DATE: September 6, 2023
LOCATION:
Solid Waste Service building
ATTENDEES:
Bill Ward, Chloe Sherer, Max Feldman, Kathy Kaufman, John Lohnes, Lauren Zola, Melissa McCullough, Veronica Penn Beattie, Kristie Mather, Amy Eckberg, Sandrine Mallet, Kristin Cushman
KEY TAKEAWAYS:
When asked people to describe one word to combat climate change, here are the responses.
• Public education
• Outreach
• Admit crisis
• Energy
• Standards
• Proper funding
- Presented the Intergovernmental Panel on Climate Change (IPCC) climate goals of 50% emission reductions by 2030 and 100% by 2050
- Top emission sectors are transportation and energy. Transportation emissions came from using both Google Environmental Insights and the unique data on Orange County’s vehicle fleet. Each was inputted to Local Governments for Sustainability ICLEI Clearpath tool to model the emissions. The commuting data came from a 2019 Employee Commute Survey
- Presented emissions forecast to 2050 using assumptions that Duke Energy will uphold their Renewable Energy Portfolio standards, It was discussed that the County will monitor Duke’s progress toward this goal and adjust the planning process accordingly
- Mentioned that there will be an online dashboard which will be presented at the November 2, 2023 Board of County Commissioners meeting
- Presented Top 10 things the County should do
FEEDBACK
• There needs to be more detail around weatherization. How can we expand education on rebates?
• How to get past public education and into supporting actions
- Joint statement to climate commitment among communities
- Make part of emergency preparedness
• Bill Ward reviewed the Top 10 and commented on the accuracy of the EV % of adoption. The consultant explained that she used NC Department of Transportation registration data from August 2023
• There was discussion around what the cost implications were on the TOP 10
• There was a suggestion to use the CAP to create a climate commitment campaign across multiple regional counties. It was felt that once the County Commissioners adopted the CAP, this campaign could really get people’s attention on climate issues.
• Discussed limitation for EV adoption. We need to better motivate residents by promoting rebates and increasing charging station connectivity. At the same time, we don’t want to lose focus on the importance of hiking and walking. Melissa mentioned that she can walk or bike to most of her activities.
- Greenbridge apartment complex needs chargers – what are the opportunities at multi unit dwellings? What role could the County play?
- Consider infrastructure and spaces for developers to install EV chargers.
• We discussed partners who were missing from our CAP list. Two came to mind: Carolina Advocates and the Sierra Club
• Consider a 2024 climate resolution from the County Commissioners, similar to what they did for emergency services?
• John discussed how to integrate climate into health care by forming a health advocacy group
• John mentioned that there was no public transportation in the north.
In addition to the Symposium, a draft of the CAP was posted on the County’s website, along with an online public comment portal. The County received 31 responses to the question “Please share your thoughts on the CAP” and each respondent was asked to rank the CAP as “Good: The CAP provides a clear path for a green future in Orange County.”, “Neutral: The CAP covers major points, but they could be improved.” or “Bad: The CAP does not serve Orange County's needs.” Comments from this process have been integrated into the final draft of the CAP.
Orange County’s intern, Chloe Sherer, participated in UNC-CH’s Sustainability Social event held in September where she led education/outreach efforts promoting the draft CAP. Chloe talked to 30 people; many people scanned QR code linking to CAP and survey; lots of professionals there; 2 who are running for town council – Melissa McCullough and Theodore Nollert. She said feedback focused on urban planning, equity and the environment. She talked to someone who works with Action for the Climate Emergency (ACES) and some folks from the business school. One person she spoke to was very interested in advancing nuclear energy. Another one was from solar equity on UNC-CH campus. She also spoke to Sustainability staff at the Town of Chapel Hill and other Eco Studio Interns/students.
One person she spoke to was very interested in advancing nuclear energy Another one was from solar equity on UNC-CH campus. She als o spoke to Sustainability staff at the Town of Chapel Hill and other Eco Studio Interns/students
Appendix D: Funding Mechanisms
Appendix D: Funding Mechanisms
Type
Special Benefit-Based Assessments
The full description for all costs has been provided to the County, in a Climate Action Tracker, which accompanied this CAP, and is available upon request.
Community Improvement Fee Levied on property owners to fund neighborhood enhancements
Special Taxes Open Space Preser vation Tax Tax on properties for preser ving County open spaces and green areas.
Property Tax Increment Tax Increment Financing
Incremental property tax revenue allocated for development projects
Utility User Tax Energy Consumption Tax County tax on utility ser vice consumption such as natural gas
Parking Fee County Parking Revenue User fee for County-owned parking facilities.
Enterprise Fund Waste Management Fund Self-sustaining funds generated from County-owned enterprises
Development Fee Land Use Development Charge Fee paid by developers for funding County infrastructure
Carbon Development Impact Fee
Carbon Footprint Charge Fee based on carbon emissions from developments to fund mitigation.
Congestion Pricing Traffic Congestion Charge User fee to reduce traffic congestion and raise funds
Green Bond Environmental Impact Bond
Green Revolving Fund Sustainability Investment Fund
Energy Performance Contracts (EPC)
Public-Private Partnerships (PPP)
Infrastructure as a Ser vice (IAAS)
Energy Efficiency Agreement
Renewable Energy Partnership
Energy Infrastructure Lease
Appendix E: Funding Sources
Geography / Agency
Bonds for capital improvements with an environmental focus
An internal fund where savings from efficiency projects are reinvested in future green initiatives
Contracts for energy upgrades in exchange for cash flows from a portion of savings
County partnerships with private companies for energy projects.
Leasing energy infrastructure from private entities for funds.
Appendix E: Funding Sources
Appendix E: Funding Sources
Geography / Agency Program
Federal / DOT DOT Surface Transportation Block Grant Program
Federal / DOT DOT Transportation Alternatives Program
Description
Funding for public road, pedestrian, bicycle infrastructure, and transit capital projects.
Funding for pedestrian/bicycle facilities, safe routes to schools, and other related projects / $20 million annually for NC.
Federal / DOT Charging and Fueling Infrastructure (CFI) Grant Program
Federal / DOE Energy Efficiency and Conser vation Block Grant Program
Federal / DOE Energy Improvements in Rural or Remote Areas (ERA)
Funding for deployment of publicly accessible electric vehicle charging infrastructure and other alternative fueling infrastructure.
Funding for local governments for energy efficiency and conser vation projects.
Funding for clean energy projects in rural or remote areas aiming to improve energy systems, reduce emissions, modernize infrastructure, develop microgrids, and enhance energy efficiency. Funding varies based on project specifics.
Federal / DOE Energizing Rural Communities Prize (American-Made Challenges)
Federal / EPA Clean Diesel Funding Assistance Program
A $15 million prize challenging individuals and organizations to create plans or financing strategies for rural communities to enhance their energy systems and further clean energy projects
Grants and rebates for clean diesel projects, up to 50% of cost.
Federal / USDA Rural Energy for America Program Grants/Loans for agricultural producers and small businesses to purchase renewable energy systems; funding varies based on project.
Federal / DOE Weatherization Assistance Program (WAP)
Federal / EPA Diesel Emissions Reduction Act (DERA)
Provides funding to increase the energy efficiency of homes. Typically, up to $6,500 per home.
Grants to reduce diesel emissions; varies based on project size.
Appendix E: Funding Sources
Geography
Federal / DHHS Low Income Home Energy Assistance Program (LIHEAP)
Federal (tax credits and deductions) Inflation Reduction Act (IRA) various programs:
● The Empowering Rural America (New ERA) Clean
● Energy Investment Tax Credit (ITC)
● Clean Energy ITC Technology Neutral
● Clean Energy Production Tax Credit (PTC)
● Clean Energy Production Tax Credit (PTC) Technology Neutral
● Commercial Clean Vehicle Tax Credit
● Etc
Federal (tax credits and deductions) 179D for energy efficiency initiatives
Provides assistance to low-income households to help pay for energy bills and weatherization improvements.
Provides various tax credits, deductions, grants, loans and bonds.
Federal / DOE Property Assessed Clean Energy (PACE) Financing
Federal / EPA Diesel Emissions Reduction Act (DERA) Program
Federal / EPA Clean Heavy-Duty Vehicle Program
Section 179D of the U S tax code provides a tax deduction for building owners or designers who implement energy-efficient improvements in commercial buildings. Under Section 179D, eligible non-profit universities can claim a deduction of up to $1.88 per square foot for energy-efficient improvements made to their buildings. This includes upgrades to lighting , heating , cooling , and ventilation systems, as well as improvements to the building envelope, such as insulation and windows.
Provides clean energy financing. Funding varies by program.
Grants and rebates to reduce harmful emissions from diesel engines ($115 million for FY 22-23).
Grants and rebates available for up to 100% of the costs associated with clean heavy-duty vehicles. Part of the Inflation Reduction Act.
Appendix E: Funding Sources
Geography /
Federal / EPA Solar Energy System Tax credits
Federal / FTA Grants for Buses and Bus Facilities Program
Federal / DOT RAISE grants
Federal / FEMA FEMA Pre-Disaster Mitigation Program
Description
Tax credits for solar water heaters and PV systems Receive 30% of the total solar system costs as a federal tax credit
Capital funding to replace, rehabilitate, and purchase buses and bus-related equipment
Grants for transportation projects
Grants to projects that implement long-term risk reduction from future hazards and climate events while reducing dependence on future federal disaster recovery assistance. Eligible projects include generator installation at critical facilities, eligible acquisition, elevation and mitigation reconstruction projects, and more
State North Carolina's Utility Savings Initiative (USI)
State Energy Star Plus State Rebate Program
State Energy Improvement Loan Program (EILP)
State North Carolina Energy Efficiency Rebates
State North Carolina Department of Environmental Quality (DEQ ) Volkswagen Settlement Mitigation Program
Promotes energy savings in the state.
Provides rebates to residential customers for installing certain energy efficient appliances and equipment that are Energy Star certified. Rebates typically range from $50 - $500 per appliance
Low-interest loans to fund energy efficiency, renewable energy, and water conser vation projects for commercial, industrial, nonprofit, schools, and local government customers
Offers rebates for homes/businesses implementing energy-efficient solutions; amounts vary by project
Funds for zero emission vehicle infrastructure and transportation, $92 million through 2027
Appendix E: Funding Sources
Geography
State North Carolina Energy Office Appliance Rebate Program
State North Carolina GreenPower Production Incentive
Incentive
State North Carolina Green Business Fund
Description
Rebates for purchasing energy efficient appliances. Varies based on products.
appliances Varies products
113
Payments for renewable energy produced; varies based on system size and energy generated.
produced; varies system size generated Fund
Offers grants and loans to small businesses and farms for implementing renewable energy, energy efficiency, and other sustainable practices .
State Clean Water State Revolving Fund
Regional / Piedmont Authority Piedmont Clean Energy Program
Regional / Piedmont Authority Piedmont Together Zero Emission Vehicle Readiness Planning
Provides low-interest loans to commercial, industrial, nonprofits, schools, and local governments for funding a wide range of water infrastructure projects.
grants and to implementing renewable practices to commercial, industrial, nonprofits, schools, governments a water projects / support initiatives.
Provides financial support for clean energy initiatives.
Planning grant from Duke Energy for EV infrastructure development.
Regional / Central Pines Regional Council Central Pines Regional Council Energy Planning & Technical Assistance
Free energy assessments and plan development support for local governments.
Regional Central Central Regional Council and plan
Local / OWASA Orange County Water and Sewer Authority (OWASA) Programs
Local and Sewer Authority
Local / Duke Energy Home Energy Improvement Program
Offers rebates for water-efficient appliances and Energy Energy Improvement Program
Local / Duke Energy Smart $aver Incentive Program
Offers rebates for water-efficient appliances and fixtures.
Offers rebates for qualified energy efficiency improvements; up to $600 per home for various improvements
On-bill financing program for certain energy efficiency improvements for homeowners and businesses
Offers for qualified energy efficiency improvements; up $600 per home for improvements. Energy Program financing program energy efficiency improvements for homeowners businesses.
Appendix F: Comprehensive Funding Plan
The cost estimates are indicative and based on with similar and F is meant to a broad idea of the for each The sources are not exhaustive and be to
6 https://www.duke-energy.com/home/products/smart-saver
The cost estimates are indicative and based on preliminary assessments, comparisons with similar programs, and expert input Appendix F is meant to give a broad idea of the possible funding source(s) for each strategy The sources are not exhaustive and may be subject to change based on various factors such as inflation, specific requirements during the time of
Appendix F: Comprehensive Funding Plan
The cost estimates are indicative and based on preliminary assessments, comparisons with similar programs, and expert input. Appendix F is meant to give a broad idea of the possible funding source(s) for each strategy. The sources are not exhaustive and may be subject to change based on various factors such as inflation, specific requirements during the time of execution, emerging technological advancements, or adjustments in the scope of a given strategy. As we navigate the details of various grants and funding avenues, the allocation of dedicated staff resources cannot be overstated. A role such as a Grants Administrator is crucial for adeptly handling the nuances of grant processes and ensuring optimal use of the funds received. Allocating resources as part of the plan to such specialized staff positions underscores our commitment to both fiscal responsibility and the maximization of grant opportunities.
T 1.2 Transition to smaller, energyefficient buses or vans during peak hours, providing efficient and reliable services 2024
$300,000 Transportation
$100k for developing and implementing a transition plan.
$200k for adjusting off-peak schedules.
$50k for comprehensive study.
FTA/DOT programs
Low interest loans
Operating and Capital budgets Orange County Transportation
T 1.3 Explore innovative public transportation options 2024
T 2.1 Initiate pilot marketing campaigns that use innovative means/ methods to inform community about public transportation options/programs/ incentives
$170,000 Transportation
$20k for stakeholder engagement.
$100k to expand MOD, including vehicles and other operational costs.
$10k for marketing campaigns (development and deployment).
DOT programs
TDM Coordinator, Orange County Transportation; EVs for Orange; “TransLoc.” rideshare app features
2024
$20,000 Transportation
$10k for partnering activities and program participation incentives.
T 2.2 Partner with chamber networks and the Regional Transportation Alliance to develop education programs around the Orange County Commuter Options program and similar multimodal transportation solutions for private businesses 2024
T 3.1 Publicize and promote greenway trails and multi-modal transit lanes as an alternative means of transportation through Parks and Recreation educational programs, special events, promotions, outreach and marketing efforts 2024
$7,000 Transportation
0.1 FTE for program development and coordination.
Operating and Capital budgets
TDM Coordinator, Orange County Transportation; PIO office to come up with a “Just the Bus” or similar campaign(s), distribute through communication networks
$10,000 DEAPR
$10k to crosspromote and develop new promotional materials and events.
Operating and Capital budgets
Operating and Capital budgets
HillsboroughOrange County Chamber of Commerce, Chapel HillCarrboro Chamber of Commerce
DEAPR, Climate Action Coalition of Orange Co.; local bike shops, Carolina Tarwheels; BikeWalkNC; Chapel Hill Cycling; Bicycle Alliance of Chapel Hill
T 4.1 Continue efforts to introduce more EVs into the County's fleet 2024
T 4.2 Accelerate the transition to EVs in the community through advocacy, education and awareness 2024
$210,000 Transportation
$210k for purchase of 3 new EVs to replace the aging fleet.
$70,000 per Rivian R1T truck according to caredge.com.
$50k for grant applications, development of EV playbook, and partnerships.
$72,000 Sustainability
$20k for landscaping and screening around new charging stations.
IRA funding
DOT and DOE programs Internal
DOT and DOE programs
IRA funding
T 5.1 Expand the "Driving is Exhausting" public education campaign 2024
$10,000
BE 1.1 Continue to strengthen policies for yearly reductions in energy use in County operations 2024 $157,000
0.1 FTE to conduct outreach ($7,000) and $3,000 for marketing/ signage materials
Operating and Capital budgets
Car dealers provide incentives; EVS for Orange; Climate Action Coalition of Orange Co. Triangle Clean Cities Coalition
Chapel HillCarrboro Public Schools; Orange County Schools; PTAs; Triangle Clean Cities
0.1 FTE for policy management and implementation ($7,000), $100,000 per facility upgrade (assumed 2 facilities per year), and $50,000 for annual audits and assessments. Green Revolving Fund Internal
BE 2.2 Explore partnerships and funding opportunities to address barriers to renewable energy adoption, tapping into Inflation Reduction Act (IRA) funding
$14,000
0.2 FTE/year ($14,000) for program participation and negotiating partnerships, acquiring funding and implementing renewable energy projects.
Operating and Capital Budgets
EmPOWERment, Duke Energy, Dominion Energy North Carolina, Piedmont Electric Cooperative, Triangle Sustainability Partnership, NC Clean Energy Fund
BE 2.3 Leverage parking lots to apply solar canopies to increase renewable energy generation and to combat urban heat island effects
BE 2.4 Continue to release rounds of the "Solarize the Triangle" program which would work to install solar on residences, businesses and nonprofits in Orange County
BE 2.5 Implement an expedited permitting process for all new solar projects across the County
BE 2.6 Convene stakeholders to attend a Focus Group/design charette to discuss capacity, design and implementation of agro voltaics and community solar projects
BE 3.1 Facilitate the transition from natural gas to electricity, providing support in terms of funding, resources, and branding
BE 4.1 Re-design sustainability website for one-stop-shop information that educates public on the County's Climate Action Plan and sustainability practices, offering a centralized platform for information and resources
Costs for planning, executing, summarizing and designing a conceptual plan for a pilot agro voltaic program
$50,000 for public education and outreach campaigns.
Solar siting survey consultant
$30,000 for website redesign, $20,000 for content creation, and $10,000 for ongoing maintenance and updates.
Local utility and state programs
Orange County Ag Summit, NC Clean Technology Center, UNCCH, Piedmont Electric Cooperative
ESCOs, Utility companies, OCHPC
RC 1.4 Identify future programs, initiatives, facilities, and infrastructure to achieve the Zero Waste goal, as defined by the County, while ensuring the longterm financial stability of the County’s solid waste and recycling program 2024
RC 2.1 Continue to install water-saving devices such as aerators and dual handles in County facilities and broaden these efforts to include other water-saving technologies; in partnership with all water providers 2024
$13,000
RC 2.2 Collaborate with educational institutions and the wider community to increase awareness about water-saving practices
RC 3.1 Transition at least one procurement item annually to a recyclable, compostable, non landfill option through 2030
RC 3.2 Eliminate purchasing of disposable or singleuse plastics for nonessential uses for County operations
$37,500
Asset Management Services
$95,500 DEAPR, Community Relations
0.1 FTE to manage programs and partnerships ($7,000).
$5,000 for program development, including workshops. $1,000 for outreach materials and promotion.
$500 per device installations, assuming 3 devices per facility upgraded each year and 5 facilities for a total of $7,500. Regular review and upgrade to newer water-saving technologies assumed to be $30,000.
$70,000 for educational materials and signage (10 signs at $7,000 each).
$500 for stickers.
$25,000 for providing 1000 water conservation kits (at $25 per kit) in partnership with Orange County Water and Sewer Authority.
Operating and capital budgets Waste hauler
State (DEQ) grants
Operating and Capital budgets
Orange County Water and Sewer Authority
Operating and capital budgets
Incremental cost for procurement adjustments and sustainable sourcing will vary N/A
Incremental cost for procurement adjustments
Orange County Water and Sewer Authority, UNC
GC 6.1 Develop programs and educational resources to promote native landscaping, community gardens and support pollinators, potentially in partnership with organizations like the Audubon Society and Master Gardeners 2024
GC 6.2 Expand workshops and resources for rainwater capture, learning from successful programs in other regions and leveraging tools like the EPA's EnviroAtlas 2024
$40,000
GC 6.5 Expand Community Climate Action Grant program to provide more funding to community projects that support the strategies in this CAP
$45,000
Cooperative Extension, DEAPR
Costs of developing educational resources ($10,000), organizing community workshops ($10,000), and establishing a recognition program for households and businesses that adopt native landscaping ($20,000).
Costs for the organization and promotion of 5 more workshops on rainwater capture each year ($2,000 per workshop x 10 = $20,000/year).
Cooperative Extension, DEAPR
Costs for distributing 100 free rainwater capture kits at each workshop (50 kits x $100 per kit = $5,000/ workshop x 5 workshops/year).
Costs for showcasing and replicating rainwater capture infrastructure at the Davis Center and additional County facilities ($10,000).
At Board of County Commissioner (BOCC) discretion
Operating and Capital budgets
Audubon Society, Master Gardeners
Operating and Capital budgets
N/A
EPA's EnviroAtlas, Master Gardeners
CR 2.3 Implement a program for discounted battery powered generators for lower-income residents with health issues who may be affected by power outages
$80,000
CR 3.1 Develop programs to educate the public on climate impacts
$44,000
Emergency Services, Social Services, Housing, Aging
Generator discount program development cost: $10,000. Annual information campaign cost: $20,000/year. Generator incentives for 100 lower-income residents annually (at $500 off per generator): $50,000/year.
Sustainability, Community Relations "Raleigh Rainwater Rewards" program development cost: $30,000.
Annual public events cost: $4,000/year. Community organization partnership cost: $10,000/year.
Federal (EPA) and state grants
Operating and capital budgets
El Centro Hispano, Nami Orange County. PORCH Hillsborough, Orange County Rescue Mission, Orange County Home Preservation Coalition, Marion Cheek Jackson Center, Orange County Community Centers, Refugee Community Partnership
BOCCappropriated funds and general grant opportunities School districts, community groups and the library
CR 3.4 Increase the number of vendors who are small business-owned or run by people of minority identities as much as possible
CR 4.1 Continue outreach and comprehensive care strategies for vulnerable populations
CR 6.1 Incorporate climate preparedness into County programs, operations, and maintenance protocols
CR 6.2 Integrate CAP goals into County projects as an order of business
$15,000
$20,000
Aging, Social Services, Health Department
Outreach program for vulnerable populations cost: $10,000.
Survey and outreach to vulnerable populations cost: $5,000/year.
Asset Management Services, Sustainability, Emergency Services Maintenance cost for climate-ready County buildings: $20,000/year.
Operating and Capital budgets
El Centro Hispano, Nami Orange County. PORCH Hillsborough, Orange County Rescue Mission
Operating and Capital budgets
CR 6.3 Provide funding for more sustainability staff in order to implement strategies and provide community outreach
BE 1.4 Promote energy-saving behaviors through comprehensive education and incentive programs
BE 2.1 Proactively adopt and expand the use of clean energy solutions within County facilities and operations
BE 4.3 Develop volunteer energy ambassador program. Use ambassadors to provide education about energy saving tips and resources
BE 5.3 Encourage County staff to research green building materials/ methods in order to conduct engineering work in-house to lower cost
RC 1.1 Expand the existing reuse network with partner organizations, improving the ability to divert waste and increase the reuse of items within the County; as outlined in the 2023-2045 Solid Waste Master Plan (in support of BE 4.1)
Finance and Administrative
2 FTE in addition to Sustainability Program Manager and grant administrator
$10,000/year for development and distribution of educational materials
Operating Budget Community Climate Action Grant Program Internal
and Capital Budgets
0.2 FTE/year ($20,000) for program oversight, $50,000/year for conducting solar siting surveys, $100,000/year for adding battery storage to critical facilities Federal Grants FEMA programs
$10,000 for training of ambassadors, $10,000 for program management, and $10,000 for community outreach events.
Operating and capital budgets
Duke Energy Dominion Energy North Carolina Piedmont Electric Cooperative
El Centro Hispano, Climate Action Coalition of Orange Co.,Orange County Home Preservation Coalition, Commission for the Environment
0.1 FTE/year ($10,000) for additional staff and training, $120,000 for salary increase. IRA funding (Low-Carbon Transportation Materials Grants program) and LEED credits Internal
State (DEQ) grants
Operating and Capital budgets Waste hauler, Solid Waste Convenience Centers, Climate Action Coalition of Orange Co.
RC 1.2 Partner with local businesses and nonprofit organizations to build a comprehensive reuse program for items such as pallets, takeout containers, electronics and school supplies
$87,000
GC 1.1 Encourage and prioritize the conservation of green spaces in the County to serve as rural buffers against climate impacts, continuing the goal of conserving a significant portion of total County land area
GC 1.2 Continue and enforce policies that preserve a significant percentage of acreage from new developments, with an emphasis on natural landscapes and native plants
GC 4.1 Strengthen the branding and promotion of locally sourced food, linking together existing farmers' markets and creating a unified front to support an Orange County foods movement
$40,000
Sustainability, DEAPR, Planning
Staff Time Planning, DEAPR
0.1 FTE to manage programs and partnerships ($7,000).
$10,000 for promotion and partnership development.
$70,000 for program setup and maintenance, including a regional swap-out/ recycling program for replacing gas-powered lawn equipment.
State (DEQ) grants
Operating and Capital budgets
Climate Action Coalition of Orange Co., Community Worx, Chamber of Commerces
5-year land conservation plan cost: $40,000 Land Conservation Fund North Carolina State Climate Office
$40,000
Cooperative Extension, DEAPR
It seems the ordinances are already in place, so no cost required, only enforcement, which should technically be in the budget
Costs of enhancing branding of locally sourced food and focus on building a stronger ag tourism network ($10,000), hosting gardening workshops ($10,000), and developing an online platform linking all farmers' markets in the County ($20,000).
N/A
Cooperative Extension, Eno River Association, Triangle Land Conservancy
Operating and Capital budgets
Explore Agricultural Grants
Refugee Community Partnership, Soil & Water Conservation District, OC Food Bank, Second Harvest Food Bank
GC 5.1 Encourage the use of County land for sustainable farming practices and education, leveraging Breeze Farms as a model for sustainable farming
$40,000
CR 1.1 Conduct a Heat Island Mapping Study
CR 2.1 Continue updating the FEMA Hazard Mitigation Plan and ensure effective implementation of the Eno-Haw Regional Hazard Mitigation Plan
$20,000
Cooperative Extension, DEAPR
Costs of hosting training workshops for farmers on sustainable farming practices ($15,000), offering incentives for farmers practicing sustainable farming on County land ($500 per incentive X 50 farms = $25,000)
Operating and Capital budgets
Eno River Association, Soil & Water Conservation District, Ag Summit, Carolina Farm Stewardship Association
BE 1.2 Continue the transition to efficient lighting green infrastructure across all County facilities
2026
$200,000
Sustainability, Emergency Services Heat Island Mapping Study cost: $20,000 State grants
Annual reviews and updates cost: $20,000/year Annual report production cost: $15,000/year
Asset Management Services, Sustainability
Average cost of $15,000 per facility for lighting upgrades. 10 facilities to be upgraded per year, the total cost for lighting upgrades comes to $150,000. The remaining $50,000 is for annual evaluations and green infrastructure measures.
Green Revolving Fund Energy Efficiency Grants Programs with local utility and U.S. DOE Internal, ESCOs Duke Energy Saver Program
BE 1.3 Advocate for policy-driven measures for energy efficiency in new construction for County facilities by recognizing developers at the Board of County Commissioner meetings
2026
$100,000 Asset Management Services
0.1 FTE/year ($10,000) for policy implementation, $10,000 for initial policy development, $30,000/year for training, $50,000/year for compliance monitoring and other costs.
Programs with U.S. DOE Internal
POTENTIAL PARTNERS
BE 4.2 Develop a program to support businesses in adopting sustainable practices
2026
$150,000 Sustainability
RC 1.7 Work with the Solid Waste Department to conduct a post consumer waste audit of County facilities
2026
GC 6.6 Transition municipal off-road fossil fuel engines (landscaping equipment, construction equipment, recreational vehicles) to electric options and require that County contractors use electric options
CR 2.2 Develop and promote a clear communication plan for underserved communities during climate threats, leveraging social media, community leaders, non-profits, and churches
2026
$23,000 Solid Waste Services
$50,000 for program development, $50,000 for program management, $50,000 for general business sustainability incentives.
0.1 FTE to liaise with waste hauler and conduct audit ($7,000). $15k for waste hauler fees to conduct the audit. $1k for developing and maintaining a list of nonrecyclable items, including any necessary training or communication materials.
IRA funding for charging infrastructure
Green Business Program Best Practices
2026
$100,000 DEAPR, Solid Waste Services
50 swaps of landscape equipment at $2,000 per piece; tax rebates of 30% (range pricing)
Operating and Capital budgets
Solid Waste Services, Waste hauler; build into annual Franchise
Operating and capital budgets Internal
$34,000 Emergency Services, Aging, Social Services
Communication plan development cost: $10,000. Monthly training session costs: $24,000/year.
Operating and capital budgets
El Centro Hispano, Nami Orange County, PORCH Hillsborough, Orange County Rescue Mission, Orange County Home Preservation Coalition, Marion Cheek Jackson Center, Orange County Community Centers
2027
RC 1.3 Promote policies and incentives to eliminate nonessential single-use plastics and prioritize reusable food ware and utensils.
GC 1.3 Reduce/ eliminate amount of mowed/manicured lawns on County properties; replace with native pollinator gardens, native grasses
2027
$48,410
2027
Solid Waste Services
$120,000 DEAPR
0.1 FTE to oversee the program and liaise with partners ($7,000).
$20,000 for legal fees.
$20,000 for promotion, enforcement, and partnership with the Green To Go program.
Costs of transitioning landscaping at two County buildings per year ($80,000), installing rainwater collection systems in two County buildings per year ($20,000), and organizing an event showcasing County's green infrastructure ($10,000).
Operating and Capital budgets Internal
CR 2.1 Expand the use of green infrastructure to manage stormwater runoff, considering incentives to encourage implementation in local neighborhoods.
CR 3.2 Assess strategies for reducing impacts of climate change on municipal and community infrastructure
2027
$40,000
Sustainability, DEAPR, Asset Management Services
Operating and Capital budgets
2027
$60,000
Sustainability, Asset Management Services
5-year green infrastructure plan development cost: $30,000.
Research partnership cost: $10,000/year.
Ecosystem restoration plan cost: $40,000. Mural creation cost: $5,000/year ($10 / sq ft for 500 sq ft)
Alternative cooling strategies cost: $10,000/year.
Upper Neuse River Basin Association funds
Soil & Water Conservation District, Cooperative Extension
UNC, Durham Tech research, Community Climate Action grant funding, Urban Sustainability Solutions
EPA grants Parks and Recreation Trust Fund
The Triangle Climate Resilience Partnership
T 1.1 Continue updating and executing the Orange County Transit Plan, addressing service gaps in Northern OC and scheduling issues.
2028
$305,000 Transportation
0.5 FTE for project coordination and management ($35,000).
$50,000 for consultant fee for updates and strategy design.
$120,000 for implementation of changes to address service gaps and extended services (assuming upgrades in infrastructure, vehicles, and technologies).
100,000 for TDM Coordinator.
U.S. FTA/DOT programs
Operating and Capital budgets
POTENTIAL PARTNERS
T 3.2 Create a micromobility subsidy program that provides higher subsidies for low income residents town and county-wide. Similar to what City of Raleigh and Denver have done
RC 1.5 Evaluate the potential of a curbside composting program, backed by a County-led educational campaign on the importance and benefits of composting
2028
$500,000 Sustainability/ Transportation
$500 subsidy per e-bike, with a target to subsidize 1,000 e-bikes. Subsidy money can come from state and federal programs.
0.2 FTE to manage programs and relationships with haulers ($14,000).
$30,000 for feasibility study.
State programs
Orange County Public Transportation, GoTriangle, Durham-Chapel Hill Metropolitan Planning Organization (DCHC-MPO), Chapel Hill Transit, UNCChapel Hill and the towns of Chapel Hill, Carrboro and Hillsborough
TDM Coordinator to work with El Centro Hispano, Rogers-Eubanks Neighborhood Association, Marion Cheek Jackson Center
2028
$64,000 Solid Waste Services
$20,000 for education campaign development, delivery and collaboration with hauler for campaign.
State (DEQ) grants
Operating and Capital budgets
Internal, waste hauler, Waste Reduction Partners to conduct audits
RC 1.6 Examine the implementation of an edible food recovery program, potentially in partnership with local restaurants and food pantries
2028
$32,000 Solid Waste Services
0.1 FTE to manage programs and relationships with partners ($7,000).
$10,000 for program development.
$5,000 for outreach materials and promotion.
$10,000 to work with Orange County's Food Assistance Program for program expansion
State (DEQ) grants
Operating and Capital budgets
USDA programs
Table Feeding Local Hungry Kids, Orange County Food Council, OC Food Bank, Second Harvest Food Bank of Orange County, Orange County's Food Assistance Program
GC 3.1 Expand and promote initiatives within the agricultural space, potentially including collaborations with local farms and Orange County Master Gardeners for innovative practices like rooftop gardens and agro voltaics.
CR 3.3 Follow through on recommendations from the Triangle Regional Resilience Assessment, ensuring its findings are acted upon and incorporated into ongoing climate resilience efforts
2028 $25,000
T 4.3 Explore the idea of providing rental EVs as an additional transportation option
2028
$33,000
Cooperative Extension, Economic Development, DEAPR
Emergency Services/ Sustainability/ Planning
Costs for launching new initiatives or collaborations with local farms each year ($5,000 per initiative x 2 initiatives/year = $10,000/year for 2.5 years)
Resilience Assessment recommendation review cost: $10,000.
Urban heat mapping study cost: $20,000.
$50k for feasibility study. $200k for a pilot program, including purchasing EVs, establishing rental locations, and promotional activities.
Operating and Capital budgets
Explore Community Garden Grants Orange County Master Gardeners, Good Agricultural Practices (GAP) Certification
Operating and Capital budgets
DOT and DOE programs
IRA funding
Operating and Capital budgets
Car Companies
The Triangle Climate Resilience Partnership
Rental car companies; EVS for Orange’ Climate Action Coalition of Orange Co.
GC 2.1 Create a Tree Master Plan, quantifying the value of trees to preserve and increase tree cover across the County.
$110,000 DEAPR
Costs of developing a Tree Master Plan ($60,000), and organizing an annual tree giveaway program, native plant sale/ seed giveaways (1,000 giveaways @ $50 = $50,000).
Operating and Capital budgets
Explore Conservation Trust Grants
Soil & Water Conservation District, Commission for the Environment
2029
RC 2.4 Transition 20% of the community water supply to recycled water by 2035
$130,000
RC 3.3 Establish Sustainable Materials Purchasing Guidelines with a list of construction materials with low embodied GHG emissions
GC 6.3 Utilize the County’s existing Lands Legacy Program to conserve important natural and cultural resources, working with the EnoNew Hope Landscape Conservation Plan and other initiatives to improve the natural environment through protection and linkage of lands and stream protection
$7,000
Planning Asset Management Services
$30,000 for legal and consulting fees to add a requirement that all irrigation use recycled water in new developments. $100,000 to expand Orange Water and Sewer Authority recycled and reuse water programs into County facilities, if primary recycled water lines are already in place ($40 x foot * 2500 feet).
Finance and Administrative Services Asset Management Services 0.1 FTE for guidelines development and enforcement ($7,000).
Costs of developing educational resources on land and stream protection ($10,000), and implementing a volunteer program for natural environment protection ($10,000).
State (DEQ) grants
Operating and Capital budgets Orange County Water and Sewer Authority
Operating and Capital budgets Best Practices
Operating and Capital budgets
Eno River Association, Soil & Water Conservation District
CR 2.4 Identify, fund, and prepare existing and new public facilities to serve as resilience hubs
$212,000
BE 5.1 Formalize and enhance the commitment to achieving LEED standards for County facilities
$22,000
Emergency Services/ Sustainability, Asset Management Services
Costs for identification of potential public facilities for resilience hubs: $10,000. Cost for preparing these facilities to serve as resilience hubs: $200,000. Costs for quarterly resilience hub preparation and training sessions for facility staff: $500 per session x 4 sessions/year = $2,000/year.
Cost of $7,000 per year for LEED certification for two new buildings annually (2 buildings x $3,500 per building = $7,000) over a 10-year span, plus $15,000 in contingency for potential additional costs related to standard updates, inspections, or additional certifications.
FEMA grants, DOE Grants Orange County Public Library, Rogers Road Community Center, Efland Cheeks Community Center, Cedar Grove Community Center
BE 5.2 Encourage the use of geothermal ground-source heat pumps in more County buildings, based on the success of current implementations
RC 2.3 Analyze facility design and usage to pinpoint opportunities for water conservation, including restrooms and optimized heating and cooling systems
$700,000
$600,000 for heat pump installation in 3 buildings, $100,000 for infrastructure improvements.
0.1 FTE to conduct audits and implement savings measures ($7,000). $45,000 for annual audit and implementation costs at 3 facilities. State grants
Operating and Capital budgets Orange County Water and Sewer Authority
2032
GC 6.4 Convert abandoned railroad corridors and integrate into bike/ hike trail networks bringing about positive impacts on mental health, transportation emissions, and the economy
$700,000 per mile
This number came directly from the Rails to Trails initiative.
Operating and Capital budgets
Association, Soil & Water Conservation District
CR 4.3 Expand green infrastructure program to reduce impermeable surface areas and capture runoff from paved areas
2032
$50,000
Cost for implementing porous paving projects: $10 per square foot. This will vary based on the size and complexity of the project. If we assume that the project will cover an area of 5,000 square feet per year, the annual cost will be $50,000.
Federal (EPA) grants
Operating and Capital budgets
Cooperative Extension, Soil & Water Conservation District, Eno River Association, Triangle Land Conservancy, Urban Sustainability Solutions
Eno River
ABAU: adjusted business-as-usual
BAU: business-as-usual
BOCC: Board of County Commissioners
Btu: British thermal unit
CAFE Standards: Corporate Average Fuel Economy Standards
CAP: Climate Action Plan
CCAG: Community Climate Action Grant Program
C&D: construction and demolition
CDC: Center for Disease Control
CFE: Commission for the Environment
CFI: Charging and fueling infrastructure
CH4: methane
CO2: carbon dioxide
CO2e: carbon dioxide equivalent
DCHC-MPO: Durham-Chapel Hill Carrboro Metropolitan Planning Organization
DEAPR: Department of Environment, Agriculture, Parks, and Recreation
DEQ: Department of Environmental Quality
DERA: Diesel Emissions Reduction Act
DOT: Department of Transportation
DOE: Department of Energy
EIA: Energy Information Administration
EIE: Environmental Insights Explorer
EILP: Energy Improvement Loan Program
EO: Executive Order
EPA: Environmental Protection Agency
EPC: Energy Performance Contracts
ERA: Energy Improvements in Rural or Remote Areas
ESCO: Energy Service Company
EV: electric vehicle
EVSE: electric vehicle supply equipment
FEMA: Federal Emergency Management Agency
FTA: Federal Transit Administration
GAP Certification: Good Agricultural Practices Certification
GHG: greenhouse gas
GI: green infrastructure
GWP: global warming potential
HB: House Bill
HFCs: Hydrofluorocarbons
HGL: Hydrocarbon Gas Liquids
HOA: Homeowner Association
HVAC: heating, ventilation, & air conditioning
ICLEI: International Council for Local Environmental Initiatives
IPCC: Intergovernmental Panel on Climate Change
IRA: Inflation Reduction Act
ITC: Investment Tax Credit
kg N: kilograms of nitrogen
kW: kilowatt
kWh: kilowatt hours
LEED: Leadership in Energy and Environmental Design
LGO: local government operations
LIHEAP: Low Income Home Energy Assistance Program
LMI: low-to-moderate income
LPG: Liquid Petroleum Gas
MOD: Mobility on Demand
MMBtu: one million British thermal units
MSW: municipal solid waste
MTCO2e: metric tons carbon dioxide equivalent
MW: megawatt
MWH: megawatt hours
NC: North Carolina
N2O: Nitrous oxide
OC: Orange County
OCCO: Orange County Commuter Options
OWASA: Orange Water and Sewer Authority
PACE: Property Assessed Clean Energy
PFCs: Perfluorocarbons
PIO: Public Information Office
PORCH Hillsborough: Food Security Community Organization
PPP: public-private partnerships
PTA: Parent-Teacher Association
PTC: Production Tax Credit
RAISE: Rebuilding American Infrastructure with Sustainability and Equity
RECs: Renewable Energy Certificates
RFP: request for proposals
RSPC: Renewable Energy Special Projects Committee
SF6: Sulfur hexafluoride
SFC: specific fuel consumption
SRVC: South East Reliability Corporation (SERC) Virginia/Carolina
TDM: transportation demand management
UNC: University of North Carolina
USDA: United States Department of Agriculture
USI: Utility Savings Initiative
VMT: vehicle miles traveled
WAP: Weatherization Assistance Program
Level 1 chargers: Provides charging through a common residential 120-volt (120V) AC outlet
Level 2 chargers: Offers higher-rate AC charging through 240V (in residential applications) or 208V (in commercial applications) electrical service
Level 3 chargers: Offers the fastest way to charge an EV
Scope 1: Carbon emissions resulting directly from fuel use
Scope 2: Carbon emissions associated with energy purchased by Orange County and generated elsewhere