Mono County Resource Efficiency Plan

05/13/22

05/13/22

Mono County
Community Development Department
Post Office Box 347
Mammoth Lakes, CA 93546
(760) 924-1800
Prepared for Mono County by:


Mono County Resource Efficiency Plan
Abbreviation Definition
AB Assembly bill
C Conservation Element
CAPCOA California Air Pollution Control Officers Association
CARB California Air Resources Board
CDP Census-Designated Place
CEQA California Environmental Quality Act
CFL compact fluorescent light bulb
CO Conservation and Open Space Element
DOF Department of Finance
E �O� Executive order
EDD Employment Development Department
EPA Environmental Protection Agency
GBUAPCD Great Basin Unified Air Pollution Control District
GHG greenhouse gas
GPS global positioning system
HVAC heating, ventilation and air conditioning
IMACA Inyo Mono Advocates for Community Action, Inc�
kW kilowatt
kWh kilowatt hour
LED light-emitting diode
LGOP Local Government Operations Protocol
LU Land Use Element
MPO Metropolitan Planning Organization
MTCO2e metric tons of carbon dioxide equivalent
MW megawatts
PACE property assessed clean energy
REP Resource Efficiency Plan
RPS Renewables Portfolio Standard
SB Senate bill
SCE Southern California Edison
SCS Sustainable Communities Strategy
SGC Strategic Growth Council
VMT vehicle miles traveled

In 2012, Mono County was awarded a Sustainable Communities Planning Grant from the California Strategic Growth Council (SGC) to prepare a targeted update to the County’s General Plan, including a Resource Efficiency Plan (REP; Plan).
In 2012, Mono County was awarded a Sustainable Communities Planning Grant from the California Strategic Growth Council (SGC) to prepare a targeted update to the County’s General Plan, including a Resource Efficiency Plan (REP)
Recently, the State of California has passed legislation with the purpose of reducing Greenhouse Gas (GHG) emissions. These policies include:
- Assembly Bill (AB) 32, which established a target of reducing statewide GHG emissions to 1990 levels by 2020;
Recently, the State of California has passed legislation with the purpose of reducing Greenhouse Gas (GHG) emissions These policies include:
- Senate Bill (SB) 32, which established a midterm target of reducing statewide GHG emissions to 40 percent below 1990 levels by 2030; and
- Executive Order (EO) S-3-05, which recommends a 2050 statewide long-term goal of reducing GHG emissions by 80 percent below 1990 levels;
- Executive Order (EO) S-3-05, which recommends a 2050 statewide long-term goal of reducing GHG emissions by 80 percent below 1990 levels.
- SB 100, which established that 100% of all electricity in California must be obtained from renewable and zerocarbon energy resources by December 31, 2045;
Therefore, this REP has been updated to ensure that the policies outlined in the 2015 REP are consistent with the state climate directives and demonstrate that the strategies in the plan will meet the long-term statewide goal for reduction of GHGs.
- EO B-55-18, which established a statewide goal to achieve carbon neutrality by 2045; and
- EO N-79-20, which set a statewide target of 100 percent of in-state sales of new passenger cars and trucks being zero-emission by 2035
In addition, the REP has been updated to reflect the results of the updated emissions forecasting and modeling.
Therefore, this REP has been updated to ensure that the policies outlined in the 2015 REP are consistent with the state climate directives and demonstrate that the strategies in the plan will meet the long-term statewide goal for reduction of GHGs Specifically, the REP has been updated to meet the standards in the California Air Resources Board (CARB) 2017 Climate Change Scoping Plan (CARB 2017) CARB is currently in the process of developing a 2022
This updated REP presents Mono County’s path toward creating more sustainable, healthy, and livable communities. The strategies outlined in this Plan will reduce greenhouse gas (GHG) emissions and provide energy, fuel, water, and monetary savings while improving the quality of life for residents in Mono County.
Mono County Resource Efficiency Plan
Climate Change Scoping Plan to address carbon neutrality by 2045 The 2022 Climate Change Scoping Plan was not available at the time of this REP update�
In addition, the REP has been updated to reflect the results of the 2020 emissions forecasting and current modeling that reflects recent projects developed by the County and changes in State policy
This updated REP presents Mono County’s path toward creating more sustainable, healthy, and livable communities The strategies outlined in this Plan will reduce greenhouse gas (GHG) emissions and provide energy, fuel, water, and monetary savings while improving the quality of life for residents in Mono County
The REP includes the following:
• An explanation of local context and the framework under which this Plan was created (Introduction – Chapter 1);
● An assessment of local activities that consume resources and (Emissions Sources, Forecasts, and Targets – Chapter 2);
• An assessment of local activities that consume resources and generate GHG emissions (Emissions Sources, Forecasts, and Targets – Chapter 2);
● Mono County’s strategy to improve resource efficiency and reduce Efficiency Measures– Chapter 3);
• Mono County’s strategy to improve resource efficiency and reduce GHG emissions (Resource Efficiency Measures – Chapter 3);
● The steps necessary to successfully implement this REP (Implementation–
• The steps necessary to successfully implement this REP (Implementation – Chapter 4)
In developing this REP, the County recognizes the compelling need for maximize the efficient use of resources and reduce emissions within government operations. Figure 1 identifies some of the County’s motivations With this plan, the County charts a comprehensive strategy to further in a manner consistent with state guidelines and regulations, and opportunities to existing and future residents, businesses, and development to a more sustainable community. The REP also provides a framework for and an educational resource to the community.
In developing this REP, the County recognizes the compelling need for a locally based approach to maximize the efficient use of resources and reducing emissions within the community and from government operations� Figure 1 identifies some of the County’s motivations to prepare the REP With this plan, the County charts a comprehensive strategy to further improve resource efficiency in a manner consistent with state guidelines and regulations, and to afford cost-effective opportunities to existing and future residents, businesses, and development projects to contribute to a more sustainable community The REP also provides a framework for environmental leadership and an educational resource to the community
Be Consistent with State Guidance
Provide an Educational Resource
Promote Environmental Leadership
Purpose and Scope
Provide Mitigation for Future Projects
Implement the General Plan
The purpose of the REP is to identify sources of GHG emissions occurring
The purpose of the REP is to identify sources of GHG emissions occurring in the unincorporated county and to establish policies and programs that reduce emissions within the County’s jurisdictional or operational control� These sources include energy use, water consumption, transportation, waste disposal, and agricultural practices They specifically exclude naturally occurring emissions sources such as wildfires
This REP update includes baseline GHG inventories for both County government operations and for the community at-large for the calendar year 2019 Where high-quality data wasn’t available for 2019, 2020 was used as a proxy A 2005 inventory prepared for community activities was used as a starting point for calculating GHG emissions reduction targets consistent with Assembly Bill (AB) 32 While AB 32 identifies a statewide goal in relation to 1990 levels, the availability of data can compromise a jurisdiction’s ability to accurately assess emissions generated from activities in the community in 1990 In lieu of 1990 emissions estimates CARB recommends that jurisdictions assess emissions for a calendar year between 2005 and 2008, in this case 2005
GHG emissions from Mono County government operations in 2019 totaled approximately 12,956 metric tons of carbon dioxide equivalent (MTCO2e) emissions, an increase of 11% from 2010 levels GHG emissions within the broader unincorporated areas totaled 352,213 MTCO2e in 2019, a decrease of 4% from 2010 levels and a reduction of 19% from 1990 levels Without action by the County to reduce emissions, by 2050 government emissions would decrease by 26% to 9,533 MTCO2e compared to 2010 levels, while community emissions would decrease by 43% to 185,650 MTCO2e compared to 2005 levels1�
The 2014 REP proposed approximately 120 actions relevant to the rural and mountainous nature of the county� They included implementing net-zero energy policies for County facilities, replacing and consolidating vehicles in the County fleet, and strategic opportunities to improve resource efficiency by residents, businesses, and visitors Actions from the 2014 REP reduced 2020 emissions by approximately 111,620 MTCO2e� This REP update sets new reduction targets consistent with the 2017 CARB Scoping Plan based on updated inventories and forecasts for the County and recent statewide policies and mandates The REP policies were adopted as part of the County’s General Plan in 2015� Goals, objectives, policies, and actions were included in the Conservation and Open Space, Circulation, and Land Use elements
In addition, the REP includes 38 megawatts (MW) of additional renewable energy including 30 MW as part of the Casa Diablo IV project, which became operational in 2022 This project is estimated to result in additional GHG emissions reductions of 89,000 MTCO2e per year2 over 2019 modeled conditions�
1 Emission levels for 2005 were available for the Community, but not for Government Operations Therefore, the comparison year for Government Operations is 2010
2 Mono County 2014 Draft Target Setting Working Paper
Located between the Sierra Mountain range and the Nevada state line, Mono County is a rural California county characterized by a small year-round population, a tourism-based economy, a considerable amount of land under federal or state ownership, and a diverse range of climate conditions Identifying and achieving sustainability goals in Mono County requires a unique approach This REP is designed to highlight the County’s rural setting, small communities, and remote location�
Rural Character and Limited Access - Development in and access to Mono County have traditionally been limited by the distance from nearby metropolitan areas (six hours by car to Los Angeles or San Francisco, three hours to Reno) and limited transportation access US Route 395, the county’s primary transportation route, runs the entire length of the county, while State Route 120 and US Route 6 connect the county to Nevada, Yosemite National Park, and California’s Central Valley, over routes that are frequently closed during winter months due to snow accumulation The Eastern Sierra Transit Authority and Yosemite Area Regional Transit System operate intercity bus service along the US 395 corridor The County has one small airport with a limited number of flights to SFO and Los Angeles�
Community Planning Areas - As of 2020, more than half of Mono County’s approximately 13,295 full-time residents live in Mammoth Lakes, the only incorporated community in the county The other 5,596 year-round residents live in a number of small communities distributed throughout the county Table 1 contains Mono County Regional Transportation Plan population estimates for 2020
Table 1: Mono County Communities (with 2020 Population)
Source: Mono County 2019 Regional Transportation Plan3
Tourism-Based Economy - Mono County attracts more than 1 7 million visitors annually from all over the world Tourism is the dominant sector of the local economy, generating an estimated $601 million in visitor spending in 2019 (Mono County Economic Development Dept 2019) Major destinations include the Mammoth Mountain and June Lake resorts, the unique ecosystem of Mono Lake, and the ghost town of Bodie
Federal and State Land Ownership - Approximately 94% of the land in Mono County is publicly owned, consisting of 88% by the federal government and 6% by the state of California, the Los Angeles Department of Water and Power, or Native American tribal groups
Seasonal Conditions – As with most communities located at elevations higher than 6,000 feet in or near the Sierra Mountain range, Mono County is exposed to a variety of weather conditions and dramatic temperature swings The County receives an average of 90 inches of snow and 15 inches of rain annually� Mono County also has an average of 277 sunny days per year
3 Community-level forecasts do not necessarily match County total because community-level census data was not available for 2019
Many great efforts have already been made and numerous policies have been adopted to promote resource efficient practices and reduce emissions throughout Mono County Prior to the REP, these practices and policies have existed in a variety of different documents and/or implemented by County staff through informal practices The REP compiles these efforts into one document and will serve as a go-to resource for best practices for the County and community to reduce individual and collective resource consumption and emissions
County Resource Efficiency Actions
The County has established an Energy Task Force and is in the process of implementing numerous energy efficiency, renewable energy, and transportation actions at County facilities, including:
2022
• 9 6 kW Solar array and back-up battery
• Election office renovation
• Electric Vehicle Charging Station at Mono County Civic Center
• Electric Vehicle Charging Station at Memorial Hall/Bridgeport Campus
• Transition to EV fleet
2020
• Mono County Civic Center (new office building for County employees that is more energy efficient)
2019
• Gus Hess Park Electric Vehicle Charging Station
2018
• Solar Pavilion in Lee Vining
2017
• Biomass Boiler
The state of California is the 15th largest emitter of greenhouse gas in the world, ultimately accounting for 2% of global GHG emissions However, the state has been proactive in working to reduce emissions and has a long history of proven leadership in addressing energy and climate issues spanning the last 40 years� Numerous initiatives in California address climate change, with the majority of legislation passed between 2000 and the present day These initiatives have strengthened the ability of entities in California to engage in accurate data collection and have created ambitious targets and regulations that have and will continue to reduce resource consumption and GHG emissions�
California’s efforts have established the state’s role as the leader in the United States for climate planning strategies, and have garnished worldwide attention and accolades Efforts to address climate change, reduce consumption of resources, and improve energy efficiency led by state legislation or programs are described below
Executive Order (E O ) S-3-05, signed in 2005, declared that California is vulnerable to the impacts of climate change through reductions in the Sierra Nevada snowpack (a major source of water for the state), reduced air quality, and rising sea levels E O S-3-05 also set the following GHG reduction goals for the state:
• Reduce emissions to 2000 levels by 2010
• Reduce emissions to 1990 levels by 2020
• Reduce emissions to 80% below 1990 levels by 2050
• The California Global Warming Solutions Act of 2006 (AB 32)
The California Global Warming Solutions Act of 2006, also known as Assembly Bill (AB) 32, codifies the goals set in E O S-3-05 and sets a target for the state to reduce its total GHG emissions to 1990 levels by 2020 through a series of market-based and regulatory mechanisms These mechanisms are discussed in the AB 32 Scoping Plan, developed by the California Air Resources Board (CARB) and released in 2008� Actions in the Scoping Plan include producing 33% of the state’s electricity from renewable sources by 2020, implementing clean car standards, and developing a cap-and-trade program for major stationary sources The Scoping Plan also identifies local governments as strategic partners to achieve the statewide reduction goal and establishes a GHG emissions reduction of 15% below existing levels as being comparable to a return to 1990 levels
AB 32 requires CARB to update the Scoping Plan at least once every five years The first major update to the Scoping Plan was adopted by CARB on May 22, 2014 The updated Scoping Plan summarizes the most recent science related to climate change, including anticipated impacts to California and the levels of GHG emissions reduction necessary to likely avoid risking irreparable damage It identifies the actions California has already taken to reduce GHG emissions and focuses on areas where further reductions could be achieved to help meet the 2020 target established by AB 32 The Scoping Plan update also looks beyond 2020 toward the 2050 goal established in E O S-3-05, though not yet adopted as state law, and observes that “a mid-term statewide emission limit will ensure that the state stays on course to meet our long-term goal ” The Scoping Plan update does not establish or propose any specific post-2020 goals, but identifies such goals adopted by other governments or recommended by various scientific and policy organizations
Senate Bill (SB) 97, signed in 2007 and effective in 2010, requires projects to estimate GHG emissions associated with project-related vehicle traffic, energy use, water use, and construction activities as part of the environmental review process under CEQA Projects located in jurisdictions with a Qualified GHG Reduction Strategy can streamline GHG evaluation by showing compliance with the strategy A Qualified GHG Reduction Strategy must satisfy the following six requirements identified in State CEQA Guidelines Section 15183�5(b):
a) Quantify GHG emissions, both existing and forecast over a set time period, from activities within a defined geographic area�
b) Establish a level below which GHG emissions from activities covered by the plan are not cumulatively considerable, based on substantive evidence�
c) Identify and analyze the GHG emissions as a result of specific actions or categories of actions anticipated within the defined geographic area�
d) Specific measures or a group of measures, including performance standards, which would collectively achieve the specified emissions level if implemented on a project-by-project basis, as demonstrated by substantive evidence
e) Establish a mechanism to monitor the plan’s progress toward achieving the level and to require revisions to the plan if it is not achieving the specified levels
f) Be adopted in a public process following environmental review
All six requirements are addressed through development and adoption of this REP�
The 2017 Scoping Plan for Achieving California’s 2030 Greenhouse Gas Target (Scoping Plan or 2017 Scoping Plan) identifies how the State can reach our 2030 climate target to reduce greenhouse gas (GHG) emissions by 40 percent from 1990 levels, and substantially advance toward our 2050 climate goal to reduce GHG emissions by 80 percent below 1990 levels�
Executive Order B-30-15 sets a 2030 goal of reducing emissions 40 percent from 2020 levels The EO requires consideration of climate change impacts in the State's Infrastructure Investment Plan and in all state planning and investment decisions The EO also sets principles for the state's action to address climate impacts and calls for monitoring of state progress
Executive Order B-55-18 calls for Statewide carbon neutrality by 2045 The EO sets the following goals for the state:
• A new statewide goal is established to achieve carbon neutrality as soon as possible, and no later than 2045, and achieve and maintain net negative emissions thereafter This goal is in addition to the existing statewide targets of reducing greenhouse gas emissions
• The California Air Resources Board shall work with relevant state agencies to develop a framework for implementation and accounting that tracks progress towards this goal
• CARB shall work with relevant state agencies to ensure future Scoping Plans identify and recommend measures to achieve the carbon neutrality goals
• CARB, the California Environmental Protection Agency, the California Natural Resources Agency, and the California Department of Food and Agriculture shall include sequestration targets in the Natural and Working Lands Climate Change Implementation Plan consistent with the carbon neutrality goal�
• All policies and programs undertaken to achieve carbon neutrality shall seek to improve air quality and support the health and economic resiliency of urban and rural communities, particularly low-income and disadvantaged communities
• All policies and programs undertaken to achieve carbon neutrality shall be implemented in a manner that supports climate adaptation and biodiversity, including protection of the state’s water supply, water quality and native plants and animals
• State agencies will engage the support, participation, and partnership of universities, businesses, investors, and communities, as appropriate, to achieve the goals contained in the EO
SB 32 affirms the importance of addressing climate change by codifying into statute the GHG emissions reductions target of at least 40 percent below 1990 levels by 2030 contained in Governor Brown’s Executive Order B-30-15
Senate Bill (SB) 100 established a landmark policy requiring renewable energy and zero-carbon resources to supply 100 percent of electric retail sales to end-use customers by 2045
SB 605, which was signed in September 2014, required CARB to develop a plan to reduce emissions of short-lived climate pollutants (SLCPs) CARB approved the Short-Lived Climate Pollutant (SLCP) Reduction Strategy in March 2017 with a goal of reducing emissions of high global-warming potential gases with short atmospheric lifetimes SLCPs include the greenhouse gases methane and hydrofluorocarbons (HFC), and anthropogenic black carbon� State law mandates a 40 percent reduction in methane and HFC emissions by 2030 and a 50 percent reduction in anthropogenic emissions of black carbon by 2030
SB 1383 directed CARB to approve and begin implementing the SLCP Reduction Strategy SB 1383 also set statewide emissions reduction targets specifying a 40 percent reduction in methane, a 40 percent reduction in HFCs, and a 50 percent reduction in anthropogenic black carbon below 2013 levels by 2030� SB 1383 also established statewide targets to reduce statewide disposal of organic waste by 50 percent below 2014 levels by the year 2020, and a 75 percent reduction below 2014 levels by 2025
SB 375
SB 375 requires Metropolitan Planning Organizations (MPOs) to adopt a Sustainable Communities Strategy (SCS) or Alternative Planning Strategy, showing prescribed land use allocations in each MPO’s Regional Transportation Plan CARB, in consultation with the MPOs, provides each affected region with reduction targets for GHGs emitted by passenger cars and light trucks in their respective regions for 2020 and 2035
EO N-79-20 requires CARB to develop regulations to mandate that 100 percent of in-state sales of new passenger cars and trucks are zero-emission by 2035� In addition, the CARB is to develop regulations requiring operations of mediumand heavy-duty vehicles to be 100 percent zero emission by 2045 where feasible, with the mandate going into effect by 2035 for drayage trucks
The 2014 REP was developed in conjunction with the Mono County General Plan update to identify sources of GHG emissions occurring in the unincorporated county, and established policies and programs to reduce resource consumption and associated emissions within the County’s jurisdictional or operational control
The 2014 REP policies, actions, and reduction targets became a part of the Mono County General Plan, which was adopted in 2015 Embedding GHG reduction and resource efficiency targets in a General Plan affords a local government considerable discretion to craft an approach that responds directly to its local conditions and circumstances California Government Code Sections 65300 7 and 65301 5 establish the Board of Supervisors’ legislative authority regarding the General Plan, and its ability to exercise discretion to tailor the contents of the General Plan to fit local conditions and circumstances, so long as General Plan policies and actions meet minimum requirements of state legislation When the County addresses GHG emissions within the context of the General Plan, this same authority and discretion extend to (a) setting a GHG reduction target, (b) identifying emissions reduction strategies to achieve the target, and (c) determining the desired degree of participation needed to achieve the target, considering local conditions and circumstances�
While local governments serve an important role as strategic partners in achieving California’s GHG reduction goals identified in the 2017 Scoping Plan, along with SB 32, SB-100, AB 32, and EO B-30-15, there is currently no regulatory requirement for Mono County to set a specific fair-share GHG reduction goal, nor are there penalties imposed for falling short of established goals� While compliance with AB 32 is not a requirement for local jurisdictions, demonstrating consistency with statewide reduction goals can help Mono County to qualify for incentives such as grant funding
The County developed the 2022 REP using the iterative five-step process described in Figure 2 This document fulfills steps one through three and provides a framework to complete steps four and five Step five, evaluating progress, helps the County estimate the effectiveness of this REP on an annual basis and determine if additional measures should be implemented
The remainder of this document elaborates on how the County has or will complete each of the steps in the process and achieve the resource efficiency targets

This component of the REP establishes a baseline for the calendar year 2010 by inventorying GHG emissions occurring in the community and from County operations The inventory collects information on resource consumption patterns (activity data), calculates the resulting GHG emissions (baseline greenhouse gas emissions), identifies likely changes or growth in future resource consumption (growth indicators and forecasts), and assists in determining the needed reductions in GHG emissions and resource consumption (resource efficiency targets)
As part of the REP planning effort, the County completed GHG emissions inventories for 2005 and 2010� The local resource consumption and emissions profile of both the community and County government operations, as well as California’s statewide emissions, are identified in Figure 3
State, community, and government operations inventories should be considered as subsets of one another County government activities often occur wholly or partially within the unincorporated county and thus are included in the aggregated community activity data and resulting emissions� Likewise, community emissions identified in the unincorporated county are a part of the California statewide inventory The relationship between the three inventories illustrates the scale at which Mono County contributes to California’s emissions, and emphasizes the shared role of the state, community, and County government to reduce emissions�
Mono County Resource Efficiency Plan
Figure 3: 2019 Emissions Profiles (MTCO2e)
STATE OF CALIFORNIA EMISSIONS
418,100,000
MONO COUNTY COMMUNITY EMISSIONS
352,213
MONO COUNTY GOVERNMENT OPERATIONS EMISSIONS
12,956
In California, many communities utilize the CARB Local Government Operations Protocol (2010), commonly referred to as LGOP, to identify and assess GHG emissions from local government activities� The County operations and community inventories for Mono County are consistent with the US Community Protocol and LGOP� While these protocols are not regulatory, they identify relevant sources or activities, recommend methods to estimate GHG emissions from each source, and provide consistency in the identification, assessment, and presentation of emissions results across multiple jurisdictions
Several data items used to estimate GHG emissions from energy use and transportation occurring in Mono County are only available at the countywide level (i e , they include both unincorporated Mono County and the Town of Mammoth Lakes)� While population and households are often appropriate metrics used to estimate emissions within a city or county, the influence of visitors and tourism on the local economy in Mono County dictates the need for a modified approach that considers how tourism affects energy use, travel patterns, and resulting GHG emissions
To ensure countywide emissions sources and activities are appropriately assigned to the Town of Mammoth Lakes and to unincorporated Mono County, effective annual population metrics that account for both permanent residents and visitors have been identified for 2020 (see Table 2) These metrics rely on 2019 US Census data for the year-round resident populations of the town and county, in addition to data from Mono County’s Economic Impact Visitor Profile Study (2008), the State of California Department of Finance E-4 Population Estimates for Cities, Counties, and the State, and the Mammoth Community Water District’s Urban Water Management Plan (2015 and 2020) to estimate annual visitors This effective annual population metric has been applied to propane use, water use, and on-road transportation to assign countywide results to the unincorporated county�
The Town of Mammoth Lakes has already determined an effective annual population The unincorporated County effective annual population uses countywide tourism for the effective population for all of Mono County, then subtracts the effective population of Mammoth Lakes�
Note: Numbers may not appear to total correctly due to rounding
The following section describes the sources, methods, and results for calculating emissions from each activity analyzed in the County government operations and community inventories� This information and activity data also provide the technical foundation for assessing the effectiveness of future policies and programs at reducing both GHG emissions and the consumption of resources
Consistent with the LGOP, Mono County’s government operation emissions inventory identifies the emissions from activities under the County’s operational control Activities included in the government operations inventory include facilities, public lighting, vehicle fleet and equipment, solid waste, and employee travel�
GHG emissions from Mono County government operations in 2019 totaled approximately 12,956 MTCO2e The total County emissions are broken down by emissions sector, as shown in Figure 4� The solid waste sector, including landfills operated by the County, represented the largest source of emissions, accounting for 8,160 MTCO2e, or 63% of all County government operation emissions This represents a 20% increase from 2010 levels The second largest source of emissions was the County’s vehicle fleet and equipment (2,090 MTCO2e, 16% of emissions, an increase of 16% from 2010 levels), followed by emissions from employee travel (1,536 MTCO2e, 12% of emissions, a 2% decrease from 2010 levels), and energy used at County facilities (1,140 MTCO2e, 9% of emissions, a decrease of 19% from 2010)
The remaining government operation emissions (30 MTCO2e, less than 1%, and flat from 2010) were attributed to public lighting, which includes streetlights owned or maintained by the County
Greenhouse Gas Emissions
Consistent with the US Community Protocol, Mono County’s community inventory includes GHG emissions from the following activities that occur in the unincorporated county4: residential energy, nonresidential energy, transportation, off-road equipment, solid waste, water and wastewater, agriculture, and landfills�
Similar to most California communities, transportation (on-road vehicles) was the largest source of emissions at 268,290 MTCO2e in Mono County 2019 (75% of emissions, an increase of less than 1% from 2005 levels5), followed by residential energy use (29,240 MTCO2e, 8% of emissions, an increase of less than 11 6% from 2010 levels), nonresidential energy use (23,690 MTCO2e, 7% of emissions, a decrease of -22%), and agricultural activities (7,180 MTCO2e, 2% of emissions, a decrease of 67%) The remaining community emissions (23,813 MTCO2e, 7%, flat from 2010 levels) were attributed to landfills, off-road equipment, water and wastewater, and solid waste disposal activities Figure 5 summarizes the community inventory results
Electricity: 24,269,650 kWh
Propane: 1,235,290 Gallons
Wood: 10,530 Tons
Electricity: 15,663,630 kWh
Propane: 3,573,030 Gallons
Vehicle travel: 468,464,570 VMT
Activity data not available �
Disposals: 6,900 Tons
Electricity: 699,160 kWh
Wastewater: 1,171 sewer connections 2,200 septic tanks
Domesticated animal production: 32,000 Heads
Crop fertilization: 5,520 Acres
Landfilled 6: 8,163 Tons
4 Including activities by government agencies other than the County such as the US Forest Service, Bureau of Land Management, and the California Department of Transportation
5 There was an update to the 2019 VMT methodology, and 2005 VMT emissions were recalculated to reflect that update
6 Includes Alternative Daily Cover
An activity and emissions forecast estimates how emissions would grow over time if no action is taken at the federal, state, or local level to reduce them A forecast has been prepared for Mono County’s government operations and community activities, assuming that 2010 energy consumption, waste disposal, and vehicle travel rates on a per person or per effective population rate remain constant These 2010 emissions rates are combined with applicable growth indicators to determine the anticipated increase in emissions The following growth indicators are essential components to estimating how emissions in Mono County may increase over time�
County government employee estimates identified by County staff are used to forecast most County government operations emissions for 2020, 2035 and 2050 (see Table 3) While staffing levels declined between 2010 and 2015, the number of County employees returned to approximately 2010 levels in 2020 Beyond 2020, the number of County employees is estimated to grow at 0 33% annually to 343 employees by 2035 and 360 employees by 2050 This would result in a 10% net increase in the number of County employees between 2020 and 2050, which aligns with anticipated growth in the number of residents, employees, and visitors in Mono County over the same time frame�
Mono
Source: Mono County 2022
Emissions from County-operated landfills are forecast based on the amount of waste disposed at each landfill by the community (both unincorporated county areas and the Town of Mammoth Lakes) Therefore, emissions from these landfills are forecast using effective countywide population Landfill emissions forecasts also assume that the Benton Crossing Landfill will no longer accept additional waste after 2023 However, the waste sector forecasts attempt to address how the County will manage waste disposal following closure of the Benton Crossing Landfill
Community growth indicators were derived using a combination of sources, including the California Department of Finance (DOF), the US Census Bureau, CARB, California Department of Transportation (Caltrans), and California’s Employment Development Department (EDD) Table 4 identifies growth indicators and sources used to forecast community emissions
7
Note:
1 Annual VMT reflects adjustments made to the countywide annual VMT forecast prepared by CARB to account for effective annual population within the unincorporated area
An emissions forecast estimates how emissions would grow over time if no actions were taken at the federal, state, or local level to reduce them Emissions forecasts have been prepared for both Mono County’s government operations and unincorporated community activities, assuming that energy consumption, waste disposal, and energy efficiency rates remain constant and considering the forecast indicators described above The forecast addresses two years: 2035 and 2050 Both target years align with 2017 Climate Change Scoping Plan targets
The County government operations emissions forecast estimates how emissions would grow if County government resource consumption rates remain constant at baseline levels, but the number of employees and buildings increases to provide services and improved amenities to Mono County’s growing number of visitors and residents
As shown in Figure 6, County government operation emissions are estimated to decrease by 7 6% from 2019 levels by 2035 to 11,983 MTCO2e, and by 26% from 2019 levels by 2050 to 9,533 MTCO2e� Between 2019 and 2035 facilities emissions are forecasted to decrease by 9% to 1,030 MTCO2e, Employee Travel is forecasted to decrease by 26% to 1,159 MTCO2e, Vehicle Fleet emissions are forecasted to increase by 1% to 2,090 MTCO2e, Solid Waste & Landfill emissions are forecasted to decrease by 6% to 7,679 MTCO2e, and Public Lighting emissions are forecasted to decrease by 64% to 11 MTCO2e, as renewable portfolio standards mean all electricity sources are being converted to renewable energy Between 2019 and 2050 facilities emissions are forecasted to decrease by 15% to 960 MTCO2e, Employee Travel is forecasted to decrease by 36% to 997 MTCO2e, Vehicle Fleet emissions are forecasted to increase by 1% to 2,112 MTCO2e, Solid Waste & Landfill emissions are forecasted to decrease by 27% to 5,931 MTCO2e, and Public Lighting emissions are forecasted to decrease by 100% to 0 MTCO2e, as renewable portfolio standards mean all electricity sources are renewable (by 2045) (Please see the Technical Appendix for a complete description of GHG calculations and methodology�)
The solid waste sector includes methane generation from landfills operated by the County, including the Benton Crossing Landfill, which is expected to close in 2023� The life cycle of a landfill has a methane generation profile similar to that of a bell curve in that it typically peaks within a year or two after a landfill closes and then gradually declines over time As a result, annual emissions in Mono County’s solid waste sector increase overall between 2010 and 2035, despite a decline between 2020 and 2035 due to closure of the landfill in 2023�
Figure 6: County Operations GHG Emissions by Category (2035 and 2050 are Forecasts) 0 2,000 4,000 6,000 8,000 10,000 12,000 14,000
The community emissions forecast estimates how emissions would change over time if the number of people, households, and jobs continues to grow modestly in unincorporated Mono County The forecast also assumes that the rate of EV adoption leads to a 3% annual emission savings in the on-road transportation sector 7 � Community emissions are anticipated to decrease by 31% from 2005 levels by 2035, and by 50% from 2005 levels by 2050 (see Figure 7).
As can be seen in the Figure, emissions from residential and commercial energy are expected to rise by 10% and 2% respectively, from 2010 to 2050, in an adjusted BAU scenario Residential energy use increases from 29,219 MTCO2e to 32,065 MTCO2e, and commercial from 23,553 MTCO2e to 24,029 MTCO2e Emissions from transportation are expected to fall by 61% (from 268,290 MTCO2e to 104,395 MTCO2e) during the same period Emissions from off-road activities also fall from 10,030 MTCO2e to 6,062 MTCO2e (40%), while those from solid waste also decline from 4,540 MTCO2e to 3,432 MTCO2e (24%) Emissions from water and wastewater increase from 1,080 MTCO2e to 2,592, a 140% increase driven by septic system methane release Agriculture remains flat, while the emissions from landfill mass decrease from 8,160 MTCO2e to 5,931 MTCO2e (27%) (Please see the Technical Appendix for a complete description of GHG calculations and methodology )
Figure 7: Community GHG Emissions by Category (2010-2050 are Forecasts)
Transportation
Transportation
Residential Energy
Residential Energy
Non-Residential Energy
Non-Residential Energy
Off-Road Activities
Agriculture
Off-Road Activities
Agriculture
Landfill Mass
Landfill Mass
Solid Waste
Solid Waste
Water and wastewater
Water and wastewater
Most California cities and counties prepare climate action plans to achieve a minimum 15% reduction in GHG emissions from a 2005–2008 baseline year by 2020, as an equivalent to reducing GHG emissions to 1990 levels by 2020 This approach to setting a GHG reduction target relies on substantial evidence provided by SB 97 Final Statement of Reasons, the AB 32 Scoping Plan, and in some cases, thresholds established by an air quality management district as a basis to determine that GHG emissions from activities covered by the plan would not be cumulatively considerable While the Scoping Plan identifies local governments as essential partners in achieving state GHG reduction goals and encourages them to consider reduction targets of at least 15%, there is currently no legislative requirement to set a specific fair-share GHG reduction goal, nor are penalties imposed for falling short of established goals
Through this plan, Mono County is establishing a policy framework to locally fulfill the goals of AB 32 and will be responsible for leading implementation efforts, rather than requiring community members to address AB 32 solely through individual actions As a CEQA lead agency, Mono County has the authority to identify cumulative thresholds supported by substantial evidence in a manner consistent with State CEQA Guidelines Section 15183�5(b)� The REP is designed to fulfill and implement the GHG reduction goals of the AB 32 Scoping Plan at the local level as well as to support Scoping Plan objectives for the state as a whole Figure 8 identifies the County’s near-term resource efficiency targets to be achieved through the implementation of this plan Substantial evidence for these targets is provided through analysis completed to support the REP (Please see the Technical Appendix for resource efficiency target calculations)
Local achievement of a 40% reduction from 1990 emissions levels by 2030 through local benefits of statewide emissions reduction policies and implementation of all feasible local GHG reduction measures.
Local achievement of a 80% reduction from 1990 emissions levels by 2050 through local benefits of statewide emissions reduction policies and implementation of all feasible local GHG reduction measures.
-40% -80% +38
Implementation of two geothermal projects, Casa Diablo IV and Mammoth Pacific, will account for 38 MW of renewable energy in the unincorporated county, resulting in additional GHG emissions credits of 108,000 MTCO2e per year.
To support a comprehensive assessment of all potentially feasible policies and actions that could be implemented by the County, staff and consultants reviewed more than 500 potential actions from the California Air Pollution Control Officers Association’s (CAPCOA) Quantifying Greenhouse Gas Mitigation Measures guide, and the Institute for Local Government’s Sustainability Best Practices Framework when developing the 2014 REP The Board of Supervisors determined approximately 120 of these policies and actions to be feasible for Mono County in the near term The REP relies on a balanced approach to reducing GHG emissions across all activity sectors and addressing both existing and new development This update ensures the REP policies and actions represent the most technologically and economically feasible approach to reducing GHG emissions in Mono County (Please see the Resource Efficiency Metrics section of this report for estimated emissions reductions, and the Technical Appendix for the calculation of GHG reduction targets)
Counties play an important role in supporting projects that have a larger statewide benefit and contribute to the achievement of statewide GHG reduction goals, though they may not directly reduce emissions within the jurisdiction’s boundaries Mono County has a long history of supporting, coordinating, and permitting renewable energy projects to support the electric generation needs of the Los Angeles Department of Water and Power, Southern California Edison, and private power generators Examples include the recently approved Mammoth Pacific I Replacement and Casa Diablo IV Geothermal Development projects, which together will reduce emissions by 108,000 MTCO2e per year when completed� With the addition of the Casa Diablo IV plant, scheduled to come online at the beginning of 2022, the total generation for the complex will be 60 MW – enough to power 45,000 homes The County’s support and coordination of these renewable energy projects serves an important role in helping the state and energy service providers to meet Renewables Portfolio Standard goals�

This chapter describes the process for identifying, developing, and refining the measures needed to achieve the County’s resource efficiency targets, as well as the methods used to evaluate the resource efficiency and GHG reduction benefits of each goal, policy, and action�
Through the process of developing the 2014 REP, County staff reviewed more than 500 actions that are typically considered in sustainability and climate action plans for local jurisdictions� Of those, approximately 120 had been identified as relevant to the rural and mountainous nature of the county and considered politically, technically, and economically feasible to implement The policies include implementing net-zero energy policies for County facilities, replacing and consolidating vehicles in the County fleet, and strategic opportunities to improve resource efficiency by residents, businesses, and visitors These policies were adopted by the County and incorporated into the 2015 General Plan
The proposed REP policies are structured to become a part of the County’s General Plan Goals, objectives, policies, and actions are presented for use within the Conservation and Open Space (CO), Circulation (C), and Land Use (LU) Elements� To balance the level of detail and inputs needed to track implementation, emissions reductions estimates are presented at the policy level for 2020
In addition to the policies proposed in the REP, to highlight the resource efficiency and GHG reduction efforts that have already been implemented or adopted by Mono County and California, the REP policy matrix presents the following actions and activities:
State Regulations – Key state programs and requirements that affect local emissions are credited toward the 2030 and 2050 emissions reduction targets While these programs and requirements are enacted statewide, they affect vehicle emissions, the renewable energy content of electricity, and energy efficiency at the local level� Key state programs that affect local emissions in Mono County include the Pavley vehicle standards, Renewables Portfolio Standard (RPS), and Title 24 Energy Efficiency Standards Considering the emissions forecast, state programs will reduce 2020 emissions in Mono County by an average of 8,444 MTCO2e/year from 2020 to 2050
REP Policies – The REP policies are a diverse mix of incentives, education, and standards applicable to both new and existing development The policies are designed to reduce emissions from each source to avoid relying on any one strategy or sector to achieve resource efficiency goals Considering the emissions forecast, REP policies will reduce 2020 emissions in Mono County by 27,120 MTCO2e
The goals, objectives, policies, and actions included in this REP can be implemented to further reduce emissions beyond state reductions and existing local actions Using an initial feasibility analysis based on the geography, population density, and decision-making patterns present in Mono County, approximately 120 feasible actions were identified in the 2014 REP that the County could take to increase resource efficiency in community activities and County government operations These actions were incorporated into the 2022 REP update Most actions address improving energy efficiency in existing buildings, which corresponds to the largest sources of emissions in Mono County
The emissions reduction benefit of each policy is determined by changes in operation, activity, or efficiency. Two types of reductions are considered: avoided emissions (e.g., walk instead of drive) and greater efficiency (e.g., drive an electric vehicle instead of a gasolinepowered model).
Figure 10: REP Policy Structure
Figure 11 summarizes information used to estimate emissions reductions. The baseline inventory and 2020 forecast serve as the foundation for quantifying REP policies. Activity data from the inventory (e.g., vehicle miles traveled (VMT) and kilowatt hour (kWh) of electricity) are used with performance metrics to calculate the emissions reduction potential of each policy. This approach ensures that emissions reductions relate to activities in the community and County operations.
The emissions reduction benefit of each policy is determined by changes in operation, activity, or efficiency� Two types of reductions are considered: avoided emissions (e g , walk instead of drive) and greater efficiency (e g , drive an electric vehicle instead of a gasoline-powered model)
Figure 9 summarizes information used to estimate emissions reductions The baseline inventory and 2050 forecast serve as the foundation for quantifying REP policies Activity data from the inventory (e g , vehicle miles traveled (VMT) and kilowatt hour (kWh) of electricity) are used with performance metrics to calculate the emissions reduction potential of each policy This approach ensures that emissions reductions relate to activities in the community and County operations
11: Emissions Quantification Sources and Tools
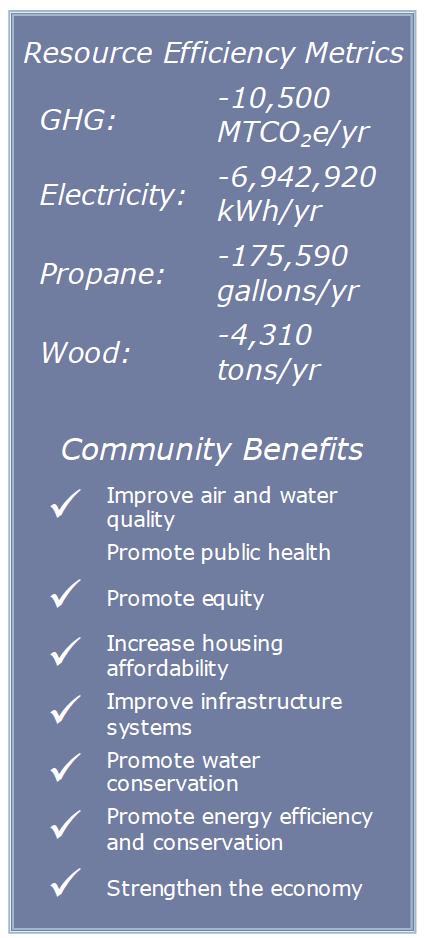
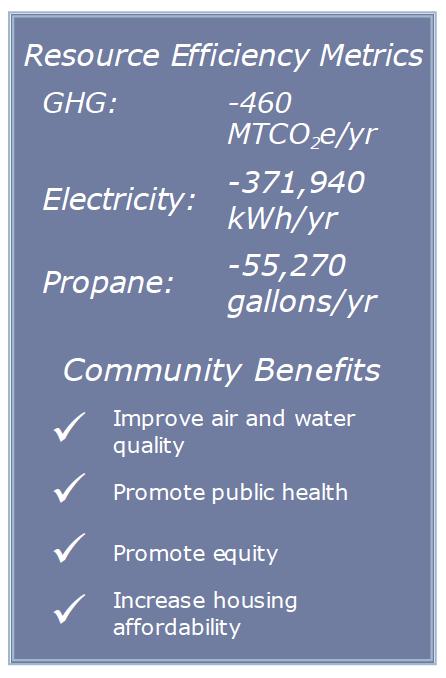
For each goal, a summary of the relevant resource efficiency metrics have been provided to highlight each goal’s contribution toward reducing GHG emissions and resource consumption The reduction values presented with each goal represent annual reductions that can be achieved through implementation of the associated goals, policies, and actions by 2030 and 2050� A detailed accounting of the GHG reduction estimates associated with each policy is provided in the work plan in Chapter 4
Additionally, implementation of REP goals provides indirect benefits to the Mono County community through achievement of the following program objectives of California’s SGC:
• Improve air and water quality
• Protect natural resources and agricultural lands
• Promote public health
• Reduce automobile usage and fuel consumption
• Promote equity
• Improve infrastructure systems
• Increase housing affordability
• Promote water conservation
• Increase infill and compact development
• Promote energy efficiency and conservation
• Revitalize urban and community centers
• Strengthen the economy
The contribution toward reducing GHG emissions, resource consumption, and achieving SGC program goals are highlighted for each goal, next to the goal introduction, and summarized at the end of this chapter�
Advancing equity is a key priority of the SGC The Affordable Housing and Sustainable Communities program administered by the SGC prioritizes grant funding to support resource efficiency throughout California, particularly among lower-income residents As of 2022, the 1,424-acre Ullman Ranch has been conserved via an agricultural conservation easement through a partnership between Sustainable Agricultural Lands Conservation (SALC) and the United States Department of Agriculture’s Natural Resource Conservation Service Agricultural Conservation Easement Program The ranch is located west of Bridgeport and is being conserved for water, wildlife, and sustainable cattle ranching
There is wide income disparity in unincorporated Mono County; according to the most recent US Census data, approximately 19% of households earn less than $35,000 a year, while approximately 22% of households earn over $100,000 annually� REP goals, policies, and actions are intended to allow all Mono County community members, regardless of income, occupation, age, or other factors, to equally benefit from resource efficiency Several REP actions are specifically focused toward lower-income individuals, including weatherization assistance, improving availability of produce from local farms, and supporting development of lower-cost transportation
Much of the energy use within buildings in future years will occur in buildings constructed prior to the development of the REP, as many of the current buildings in Mono County will still be occupied in 2035, and the County is not expecting a substantial amount of new construction� Older buildings often lack the energy-efficient features found in newer structures Policies and actions supporting Goal CO 1 seek to reduce the energy used by older buildings in Mono County, including educational events and small-scale improvements (such as energy-efficient light bulbs), replacement of home appliances (such as pumps and stoves), and whole-building retrofits� These actions address both residential and nonresidential buildings, including rented and leased buildings, and County-owned facilities Additionally, these actions include monetary incentives and potential financing options, helping to make the upfront cost of energy efficiency more affordable
These actions decrease energy use in existing buildings, including electricity and heating fuels such as wood and propane These actions save building owners and tenants money on their utility bills and can make buildings more comfortable places to live and work By reducing electricity and fuel use, these actions will help reduce some of the largest sources of GHG emissions in Mono County Reductions in fuel use can also improve air quality in the county, providing health benefits for residents and visitors
Objective CO.1.A.Improve the information and support available to residential and nonresidential property owners to reduce energy use.
Policy CO.1.A.i. Work with nonprofits and utility providers to provide property owners with technical assistance, energy efficiency programs, and financial incentives�
Action CO.1.A.i.a. Support and publicize compact fluorescent (CFL) or light-emitting diode (LED) giveaways, and incandescent bulb exchange programs
Action CO.1.A.i.b. Work with utility providers to encourage home/commercial audits and energy efficiency retrofits�
Action CO.1.A.i.c. Support or host events that highlight and promote successful programs
Action CO.1.A.i.d. Promote and reward energy efficiency efforts of local visitor-serving and recreational businesses
Policy CO.1.A.ii. Provide green building information and resources in a publicly available format, such as a dedicated page on the County website
Action CO.1.A.ii.a. Provide green building information and resources
Action CO.1.A.ii.b. Provide information about programs, rebates such as the California Solar Initiative, on-bill financing, or other financial incentives to help residents and businesses complete energy-saving measures such as audits and whole-house retrofits
Action CO.1.A.ii.c. Provide information on low-income assistance programs, such as weatherization
Action CO.1.A.ii.d. Provide information to local businesses about resource-efficient procurement opportunities
Objective CO.1.B.Increase the number of programs available and accessibility to capital to assist residential and nonresidential properties with implementation of resource-efficient practices.
Policy CO.1.B.i. Provide programs and information to reduce existing energy use�
Action CO.1.B.i.a. Offer a property assessed clean energy (PACE) financing program for residential and nonresidential energy efficiency�
Action CO.1.B.i.b. Work with the Great Basin Unified Air Pollution Control District to provide incentives to replace older woodstoves with Environmental Protection Agency-certified pellet stove or propane units�
Policy CO.1.B.ii. Encourage energy-efficient measures and practices through standard County programs, such as well and building permits�
Action CO.1.B.ii.a. Promote installation of variable frequency drive water pumps to serve existing residential buildings�
Action CO.1.B.ii.b. Encourage voluntary upgrades of residential and nonresidential HVAC systems
Action CO.1.B.ii.c. Encourage energy audits and voluntary retrofits for residential and nonresidential buildings at the time of sale or major renovation (>50% of building square footage, or addition of >500 square feet)
Policy CO.1.B.iii. Provide incentives and information to support upgrades to rental properties, non-primary housing, and other types of housing
Action CO.1.B.iii.a. Promote opportunities to improve energy efficiency and install renewable energy systems in rental or secondary homes
Action CO.1.B.iii.b. Provide information on programs such as upgrades to mobile homes, blow-in insulation, and double-paned glazed low-e windows
Objective CO.1.C. Reduce energy use in existing County facilities.
Policy CO.1.C.i. Continue progress toward net zero energy use in County facilities
Action CO.1.C.i.a. Seek funding for and then develop a net zero energy feasibility study for County facilities that would include renewable energy generation, whole-building energy audits, construction costs and return on investment horizons, and potential time frames
Action CO.1.C.i.b. Consider installing cool roof materials on existing and new County-owned buildings
Action CO.1.C.i.c. Replace appliances and equipment in County-owned and leased buildings with energyefficient models
Action CO.1.C.i.d. Develop and implement a schedule—for example, through whole-building energy audits—to address no cost/low cost energy retrofit projects in County-owned and -leased buildings
Action CO.1.C.i.e. Reduce energy demand in County-owned buildings by capturing “daylighting” opportunities
Action CO.1.C.i.f. Collaborate with owners of leased buildings to audit and benchmark energy use, retrofit for efficiency, and develop a preferred leasing agreement that incorporates energy-efficient practices
Policy CO.1.C.ii. Continue to manage maintenance and ongoing programs that support energy reduction
Action CO.1.C.ii.a. Periodically audit and benchmark energy use in County-owned buildings to identify opportunities for energy efficiency and conservation
Action CO.1.C.ii.b. Ensure that HVAC and lighting systems in County-owned and -leased buildings are operating as designed and installed
Action CO.1.C.ii.c. Continue to use energy management software to monitor real-time energy use in Countyowned and -leased buildings to identify energy usage patterns and abnormalities
Action CO.1.C.ii.d. Install motion sensors, photocells, and multi-level switches to control room lighting systems in County-owned and -leased buildings�
Action CO.1.C.ii.e. Encourage utility providers to install smart meters on County-owned buildings
Although new construction in Mono County is expected to be limited and the California Building Standards Code contains many items to improve the energy efficiency of newer buildings, Mono County has an opportunity to show leadership in green building by supporting practices that go beyond state standards Policies and actions supporting Goal CO 2 will improve energy efficiency in new construction and major renovations through voluntary actions and incentives These include providing educational materials about the benefits of exceeding California’s green building standards, incentivizing key green building practices, and collaborating with utility companies, residents, and building industry professionals to offer training and technical assistance These actions also promote green building in County facilities
The actions will reduce energy use in new and retrofitted buildings beyond the standards of the California Building Standards Code, decreasing electricity and propane bills for owners and tenants� By reducing the amount of fuel burned to generate electricity or heat homes, these actions help reduce Mono County’s GHG emissions, and can improve local and regional air quality�
Objective CO.2.A. Increase green building practices in new construction and major renovations.
Policy CO.2.A.i. Support and promote residential and nonresidential green building construction
Action CO.2.A.i.a. Offer incentives (e g , streamlined permitting, prescriptive designs, fee waivers/reductions) for green building practices, such as verifiable green building practices that exceed state or local minimum standards, ground-source heat pumps, or photovoltaic solar installations�
Action CO.2.A.i.b. Work with utility providers to provide information to businesses about available rebates for new residential and commercial buildings that exceed Title 24 by at least 15%�
Action CO.2.A.i.c. Offer technical expertise and assistance for community members, builders, and businesses undertaking green building projects
Action CO.2.A.i.d. Provide information on how contractors can attend energy efficiency training
Policy CO.2.A.ii. Continue to transition to green building practices in new County facilities
Action CO.2.A.ii.a. Consider certification by a third-party rater to ensure all new County facilities and renovations of existing facilities comply with green building standards�
Action CO.2.A.ii.b. Target meeting net-zero energy requirements or exceeding minimum Title 24 requirements for new County buildings and renovation of existing facilities�
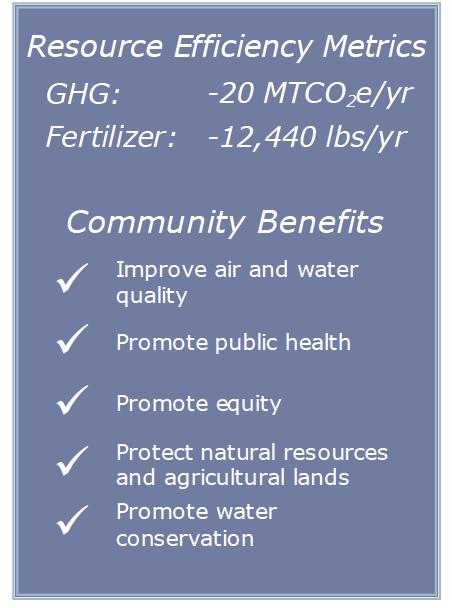
Mono County residents and visitors to the area are fortunate to enjoy a spectacular natural setting The County’s open spaces provide extensive recreational opportunities and make Mono County a destination for visitors from around the world, while the County’s gardens and agricultural land supply food grown and raised locally Goal CO 3 manages and preserves these vital lands to reduce resource use and contribute to the County’s GHG reduction efforts Policies and actions supporting Goal CO 3 include providing incentives to preserve agricultural land and open space, support economically viable agricultural practices that reduce environmental impacts, and exploring options to allow farmers and ranchers to use their land to sequester carbon without disrupting normal agricultural activities� They also include steps to provide economic support for local farmers and ranchers, including helping to make locally grown and raised food more widely available, and buying locally supplied food for County events when feasible
Many of these actions are considered supportive, meaning that their resource efficiency and GHG benefits cannot be definitively identified However, these actions help to preserve and expand Mono County’s agricultural and open space land, providing scenic benefits and contributing to the local economy By providing farmers with best practices on fertilizer and pesticide use, Mono County can help save farmers money, reduce health risks, and decrease GHG emissions from agricultural activities� The possibility of using agricultural land to sequester carbon may provide additional financial benefits to farmers and ranchers
Objective CO.3.A. Improve the health and resilience of the natural and agricultural landscape.
Policy CO.3.A.i. Maintain open space and manage open space from fire and erosion
Action CO.3.A.i.a. Proactively manage the County’s current parks, open space, recreational facilities, and other natural areas owned or operated by the County to ensure the long-term health and viability of trees and other vegetation
Action CO.3.A.i.b. Evaluate future opportunities to convert closed landfills to parks or open space
Policy CO.3.A.ii. Encourage other programs that protect natural areas�
Action CO.3.A.ii.a. Promote biomass heat/energy utilization projects meeting environmental standards as a means to incentivize fuel reduction projects for healthy forests by creating an economic market for woody biomass
Policy CO.3.A.iii. Support optimal agricultural practices�
Action CO.3.A.iii.a. To the extent feasible, purchase locally grown food for County events and purposes
Action CO.3.A.iii.b. Encourage community gardens and farmers markets to support the availability of healthy, locally grown produce�
Action CO.3.A.iii.c. Promote conservation tillage and other agricultural practices to retain carbon fixed in soils
Action CO.3.A.iii.d. Provide financial or other incentives for low-income residents to purchase fresh produce at farmers markets
Action CO.3.A.iii.e. Offer incentives (e g , development credits, support for the Williamson Act) to promote the preservation of farmland, open space, and sensitive lands
Action CO.3.A.iii.f. Support the Great Basin Unified Air Pollution Control Districts standards for the burning of agricultural residue
Action CO.3.A.iii.g. Encourage best practices in fertilizer and pesticide use
Action CO.3.A.iii.h. Research carbon sequestration programs on agricultural lands
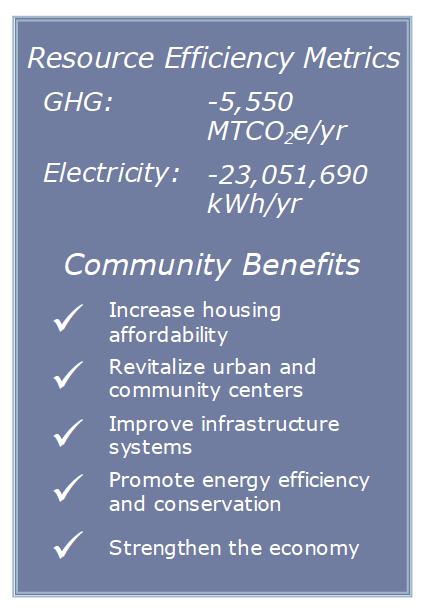
Goal CO�4 supports increased individual and community-scale renewable facilities in Mono County in a manner consistent with the County’s values and visual setting Policies and actions support solar photovoltaic systems on new and existing buildings, educational opportunities regarding the benefits of renewable energy systems, and support for community-scale renewable energy plants that are environmentally responsible and financially feasible This measure does not support industrial or utility-scale solar installations that are incompatible with Mono County’s rural character To help decrease the costs of renewable energy systems, the County proposes incentives and unique financing opportunities for renewable energy development
Renewable energy systems reduce the amount of fossil fuels burned to create energy, decreasing GHG emissions and improving air quality Renewable energy systems attached to buildings, such as solar panels on a building roof, reduce the amount of energy that needs to be purchased from utility companies, and allow building occupants to sell electricity back to the utility company (a process called net metering), which can reduce energy bills Community-scale facilities contribute to California’s overall renewable energy goals
Objective CO.4.A.Increase renewable energy generation that is consistent with the county’s visual and aesthetic qualities and values.
Policy CO.4.A.i. Support and incentivize residential and nonresidential distributed renewable energy generation�
Action CO.4.A.i.a. Pursue installation of solar photovoltaic systems, power purchase agreements, or solar collective programs to meet all or part of the electrical energy requirements of County-owned or -leased buildings�
Action CO.4.A.i.b. Offer incentives (e g , streamlined permitting, prescriptive designs, fee waivers/ reductions) to encourage installation of photovoltaic systems on new or existing buildings�
Action CO.4.A.i.c. Offer workshops and information for residents and businesses to provide resources and permitting assistance for those interested in adding renewable energy systems to their properties
Policy CO.4.A.ii. Encourage community-scale (<3 MW) renewable energy development on suitable lands, such as a biomass co-generation facility
Action CO.4.A.ii.a. Support the development of appropriately sited community-scale renewable energy systems that meet critical evaluation criteria, such as environmental standards, sensitive species, financial feasibility, and transmission capacity�
Action CO.4.A.ii.b. Work with utility providers, regulatory agencies, and local stakeholders to develop technical, environmental, and social feasibility�
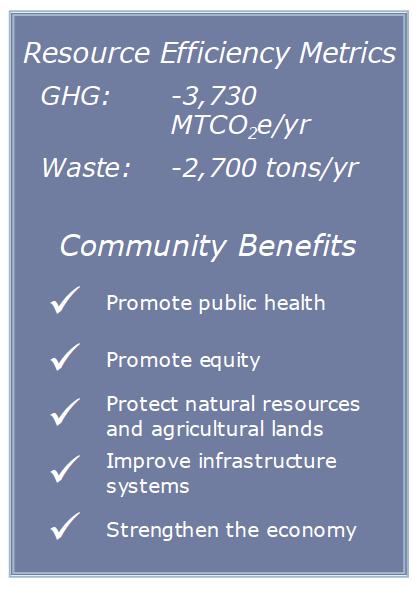
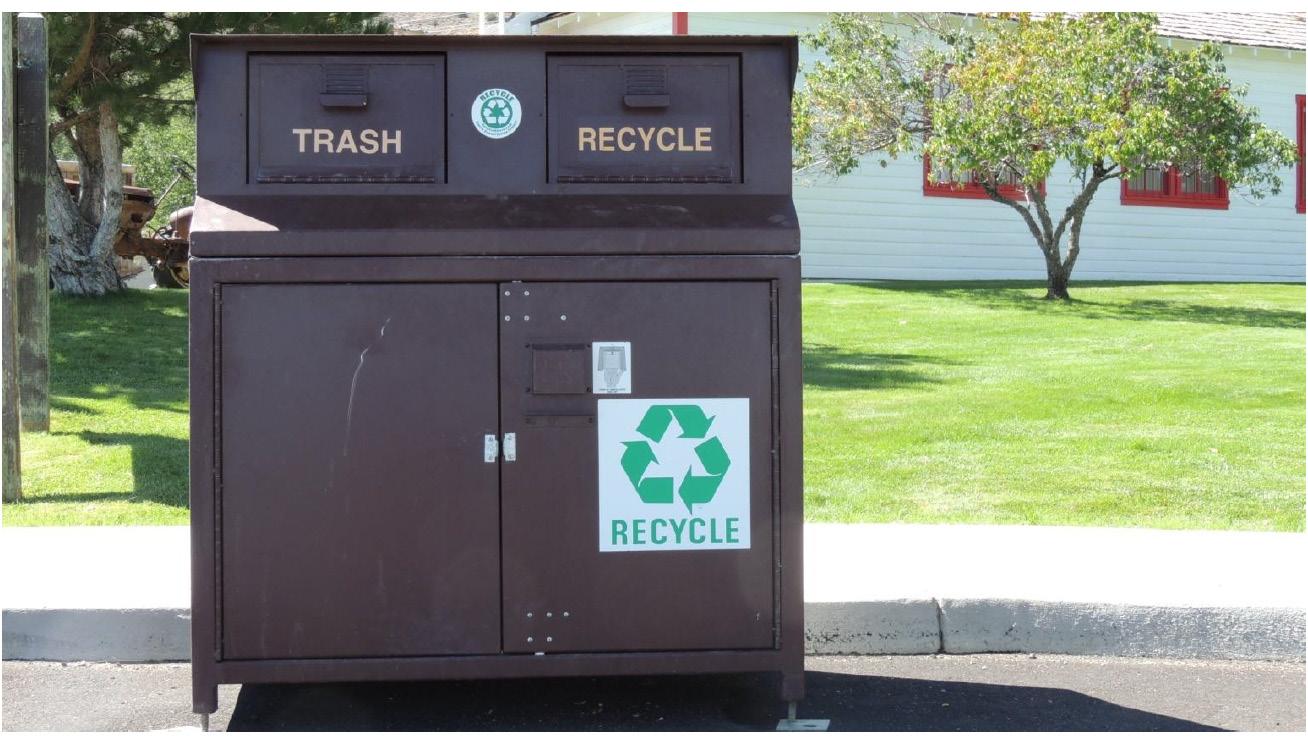
Material thrown away in a trash can in Mono County ends up in a landfill operated by the County government, taking up space and decomposing to produce methane, a potent GHG Goal CO 5 reduces the amount of waste that ends up in a landfill by promoting recycling and composting, and reducing the amount of waste produced by County residents, businesses, and visitors Policies and actions supporting Goal CO 5 include finding opportunities to collect and recycle waste that cannot be easily disposed of (for example, electronic waste), supporting the expansion of recycling programs, and identifying the need for new programs and facilities They also promote steps by the County government to lead by example, including providing County staff with information about waste reduction, recommending actions to decrease paper waste, and exploring the feasibility of upgrading County waste management facilities�
Waste reduction actions decrease the amount of material that ends up in a landfill, thereby reducing the GHGs produced in waste decomposition They also help to conserve landfill space, decreasing the need for the County to dedicate additional space or develop potentially costly alternatives� These actions can save money as well; for example, efforts to reduce the amount of paper used in County government operations decreases the amount of money the County needs to spend to buy new paper�
Objective CO.5.A. Reduce waste deposited in the county’s landfills.
Policy CO.5.A.i. Increase composting and recycling programs, and reduce waste generation, throughout the county
Action CO.5.A.i.a. Identify and encourage reducing, reusing, and recycling opportunities for construction and demolition waste
Action CO.5.A.i.b. Establish a program to use the maximum amount of organic waste possible generated within the county to produce compost for use in parks and landscaping
Action CO.5.A.i.c. Increase opportunities for e-waste and hazardous materials collection and recycling
Action CO.5.A.i.d. Evaluate current recycling infrastructure relative to future needs and anticipated waste generation Provide incentives for new recycling infrastructure facilities in the county
Action CO.5.A.i.e. Encourage the installation of recycling receptacles and containers at multi-family housing developments
Action CO.5.A.i.f. Explore measures to reduce waste from commercial operations, such as banning singleuse bags and polystyrene containers
Policy CO.5.A.ii. Promote a standard of reduce, reuse, and recycle within County government operations
Action CO.5.A.ii.a. Provide County staff with information on recycling items such as ink cartridges, toner, batteries, and light bulbs
Action CO.5.A.ii.b. Encourage paper use reduction through activities such as:
— Promoting a “think before you print” campaign�
— Reducing margins and logos on County templates, letterhead, and memos
— Setting printer default options to print double-sided pages
— Using computer software that removes blank pages and images from documents
— Using “e-copy” machines that allow users to scan and distribute documents via e-mail
— Uploading bid documents using online resources�
— Requiring fewer or smaller-sized copies of project plans or submittals, and allowing digital submittals
— Using electronic devices for agendas and notes at public meetings�
Action CO.5.A.ii.c. Review and implement the adopted procurement policy to establish purchasing standards for climate-friendly products�
Policy CO.5.A.iii. Partner with other agencies, such as the Town of Mammoth Lakes, on green procurement, waste reduction, and recycling activities�
Objective CO.5.B. Reduce greenhouse gas emissions from County solid waste operations.
Policy CO.5.B.i. Reduce or off-set methane generation from county landfills
Action CO.5.B.i.a. Investigate new technologies available to capture methane at county landfills
Action CO.5.B.i.b. Identify opportunities to install renewable energy systems at county landfills
A SUSTAINABLE
AND MEET OR EXCEED
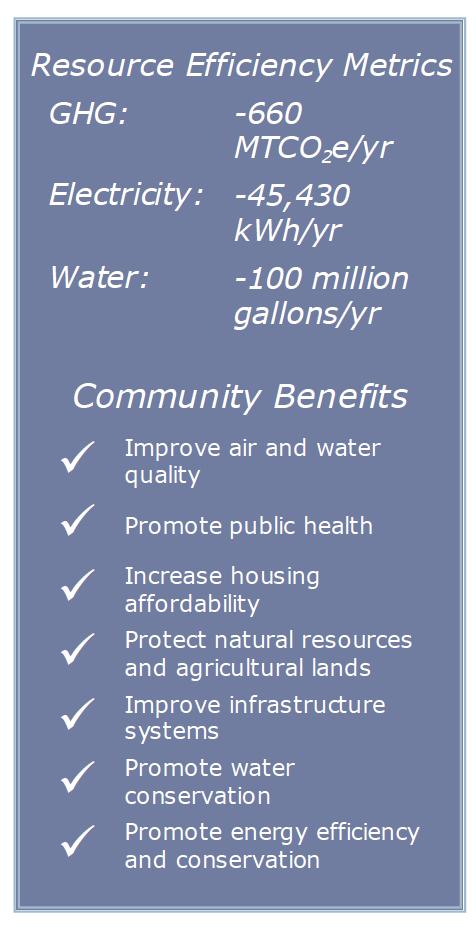
2022 was the driest year in the last 128 years, and as of March 2022 100% of Mono County residents were affected by drought8� In the relatively dry environment that comprises much of Mono County and the state, there is a critical need to maintain an adequate supply of safe, clean water Goal CO 6 seeks to meet this need through a number of water conservation and water quality actions Policies and actions supporting Goal CO 6 include encouraging new buildings to exceed the water efficiency standards in the California Building Standards Code, promoting development solutions and practices that preserve water quality, encouraging water efficiency retrofits in existing homes and businesses, and promoting more efficient wastewater treatment�
These water conservation actions directly preserve a vital resource for all residents, business owners, and visitors� Reductions in water use result in less energy use to treat and supply water, reducing utility bills and decreasing Mono County’s GHG emissions� Goal CO�6 also improves wastewater treatment efficiency, achieving further reductions in energy use and “direct” emissions caused by the decomposition of materials in wastewater�
Objective CO.6.A. Protect and conserve water resources throughout communities.
Policy CO.6.A.i. Encourage reduced water consumption in residential and nonresidential properties�
Action CO.6.A.i.a. Encourage and promote the installation of residential greywater systems on existing residential and commercial properties that meet appropriate regulatory standards
Action CO.6.A.i.b. Encourage installation of water conservation measures in existing homes and businesses
Action CO.6.A.i.c. Encourage new residential and commercial construction and new County facilities to exceed CALGreen water conservation requirements
Action CO.6.A.i.d. Encourage prospective homebuyers to conduct water efficiency audits at point of sale for commercial and residential properties
Action CO.6.A.i.e. Assess, maintain, repair, and program existing irrigation systems to minimize water use, including parking lot landscaping, public restrooms and parks, and recreational facilities
8 NOAA Drought gov website, retreived 3/28/22 https://www drought gov/states/california/county/mono
Action CO.6.A.i.f. Ensure applicable projects comply with the Water Efficient Landscape Ordinance
Policy CO.6.A.ii. Protect water quality throughout communities
Action CO.6.A.ii.a. Promote low-impact development solutions (see General Plan Appendix B) for stormwater management on private property, such as rain gardens, green roofs, and detention ponds
Action CO.6.A.ii.b. Use non-toxic fertilizers in county parks and landscaped areas to reduce potential water quality issues through stormwater runoff
Action CO.6.A.ii.c. Maintain drainage systems associated with roads and public infrastructure for stormwater management
Objective CO.6.B. Promote sustainable alternatives to reduce and treat wastewater.
Policy CO.6.B.i. Promote energy-efficient wastewater treatment and biosolids recycling practices�
Action CO.6.B.i.a. Work with wastewater service providers to implement an audit, cycling, and equipment replacement program to increase energy efficiency for water and wastewater pumps and motors�
Action CO.6.B.i.b. Where feasible, replace septic systems with community package treatment systems
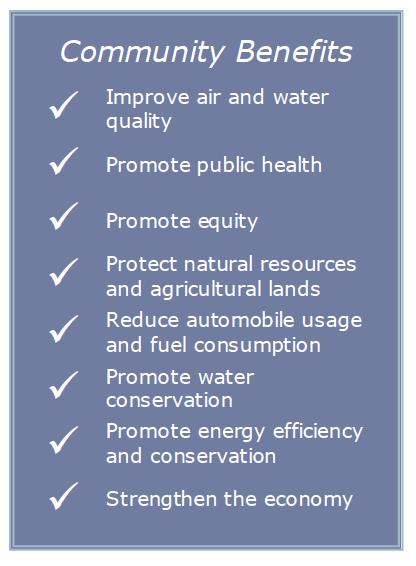
Resource efficiency policies have a much better chance of success when there is extensive support from community members, and when implementing agencies such as the County government partner with other local and regional organizations While the policies and actions supporting Goal CO 7 do not result in direct or measurable GHG reduction or resource efficiency metrics, they do encourage collaboration and cooperation among community members and organizations in order to meet numerous County resource objectives� They include efforts to educate community members about resource efficiency and sustainability, opportunities to create events for community leaders to discuss resource conservation, and ways that Mono County can promote resource efficiency and sustainability goals beyond the County boundaries
These supportive actions contribute to the success of all other resource efficiency goals by improving the visibility of and building support for resource conservation and sustainability Indirectly, these actions help to achieve the benefits of other resource efficiency goals, including reduced energy use, improved air quality, financial savings, and resource conservation
Objective CO.7.A. Leverage resources regionally to build capacity for resource efficiency programs.
Policy CO.7.A.i. Work with local schools to support educational opportunities that promote resource efficiency
Action CO.7.A.i.a. Collaborate with high schools to provide students with resource-based internship opportunities
Action CO.7.A.i.b. Partner with local community colleges and grade schools to develop classes or workshops with a resource focus
Policy CO.7.A.ii. Collaborate with local, state, and regional agencies and organizations to identify resource conservation opportunities and share information
Action CO.7.A.ii.a. Integrate energy conservation discussions and opportunities into projects or efforts with other federal, state, and regional agencies
Action CO.7.A.ii.b. Utilize the Regional Planning Advisory Committees to create ongoing opportunities for community members to provide feedback on resource policies and programs
Action CO.7.A.ii.c. Promote the Mono County “Living Light Guide” that outlines steps residents and businesses can take to reduce energy and water use, recycle, and use alternative transportation
Action CO.7.A.ii.d. Include information in County mailings, websites, and other media about actions that individuals and businesses can take to improve resource efficiency�
Action CO.7.A.ii.e. Participate in the CoolCalifornia Challenge which challenges local agencies to engage residents in taking action to reduce household energy use and vehicle miles traveled�
Policy CO.7.A.iii. Support and participate in the outreach, education, and collaboration efforts of the Eastern Sierra Energy Initiative partnership�
Action CO.7.A.iii.a. Distribute giveaway items, such as reusable bags and compact fluorescent (CFL) light bulbs, to encourage environmental responsibility
Action CO.7.A.iii.b. Develop public service announcements and/or talk shows related to resource efficiency
Action CO.7.A.iii.c. Use social media to inform the community about resource efficiency activities and opportunities
Action CO.7.A.iii.d. Host a leadership summit for community leaders, school groups, and businesses to gather and share resource conservation experiences, expertise, strategies, and ideas
Action CO.7.A.iii.e. Provide recognition programs for individuals, groups, and businesses that adopt resource efficiency practices
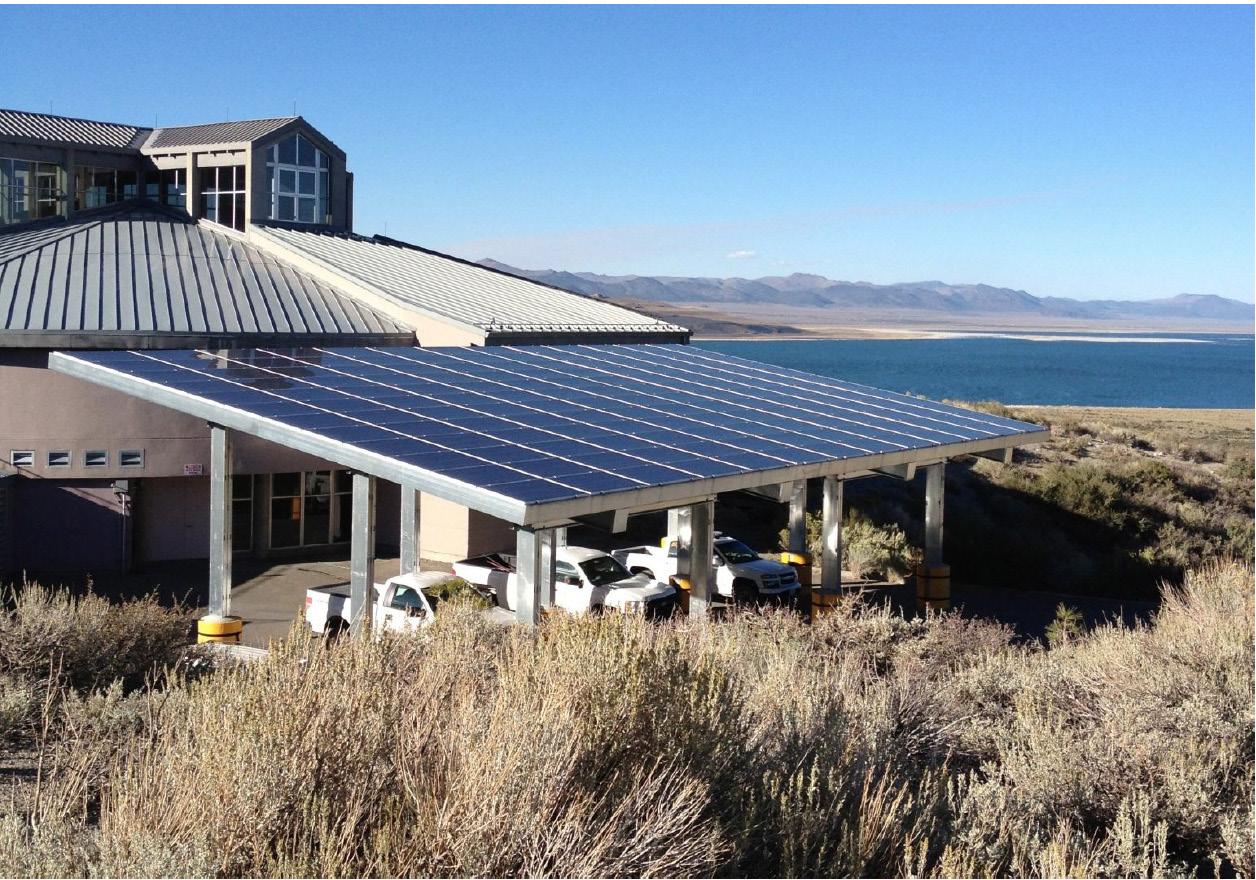
On-road vehicles are the single largest source of GHG emissions in Mono County and the rural, spread-out nature of the county presents a challenge to residents, employees, and visitors alike to use alternative means of transportation However, a number of opportunities to improve transportation within the county exist, some of which are addressed by the policies and actions supporting Goal C 1 These actions recognize the diverse reasons people have for traveling within Mono County and seek to provide a number of options to get around that are safe, convenient, and affordable The actions include improvements to bicycle networks, support for rideshare and shuttle systems for large tourist-serving employers and uses, and working with local transit providers to improve transit service Strategies to improve transportation efficiency and promote the use of alternative fuels in County government operations are also promoted Alternative vehicle fuels such as electricity, compressed natural gas, and emerging and future technologies are all supported by the policies and actions of Goal C 1
By providing alternatives to travel in single-occupancy vehicles, these actions reduce vehicle fuel use in Mono County, decreasing the amount of GHGs and air pollution produced by cars and trucks and creating financial savings for residents and employees who may not need to fill up their vehicle fuel tanks as frequently� Some actions encourage people to walk or use bicycles, providing health benefits to community members and visitors and supporting recreational tourism that benefits the local economy�
Objective C.1.A. Expand resident and visitor transportation options.
Policy C.1.A.i. Provide for viable alternatives to travel in singleoccupancy vehicles
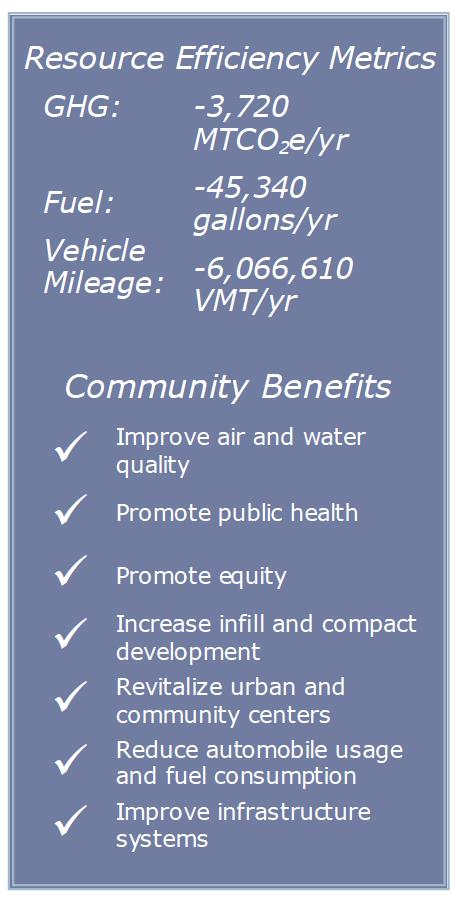
Action C.1.A.i.a. Work with major employers to offer voluntary incentives and services that increase the use of alternative forms of transportation, particularly tourismbased employers and uses�
Action C.1.A.i.b. Provide bicycle access to transit services along transit corridors and other routes that may attract bicyclists, such as routes providing access to visitor-serving locations�
Action C.1.A.i.c. Develop a ridesharing program that utilizes a website and/or mobile technology to connect potential carpoolers
Action C.1.A.i.d. Adopt a countywide bicycle master plan to guide bikeway policies and implement development standards to make bicycling safer, more convenient, and enjoyable
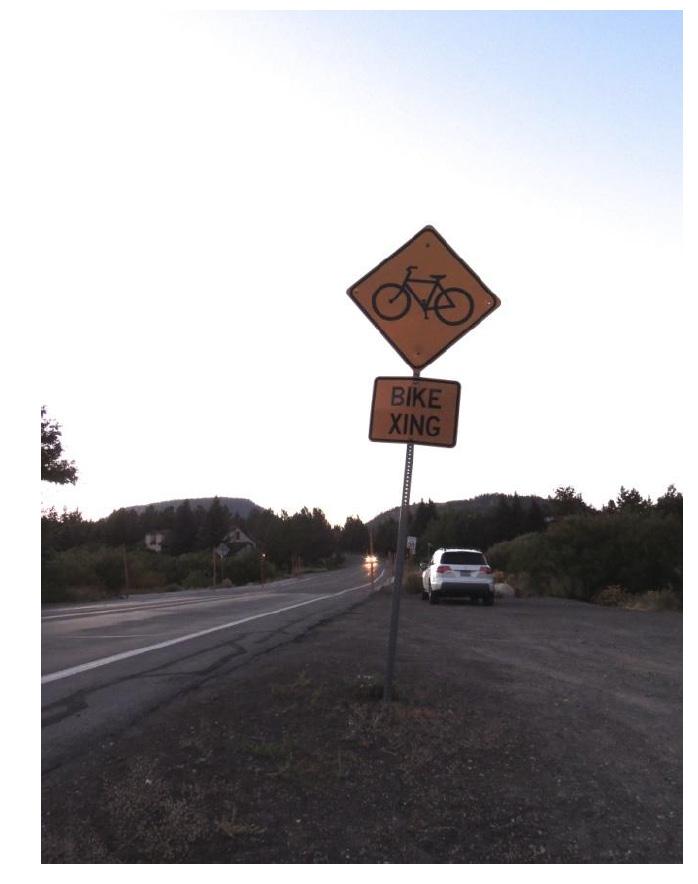
Action C.1.A.i.e. Identify opportunities to offer bicyclesharing programs within communities�
Action C.1.A.i.f. Encourage the installation of bicycle rack, showers, and/or other amenities as part of new commercial development projects to promote bicycle use by employees and residents
Policy C.1.A.ii. Improve efficiency of County fleet operations
Action C.1.A.ii.a. Set fleet efficiency standards for new agency vehicles that can meet climate conditions and needs while reducing fuel use Consider purchasing fuel-efficient or alternative-fuel vehicles, including zero or near-zero emission vehicles
Action C.1.A.ii.b. Utilize technology options (e g , digital service requests accessible by mobile devices) for field personnel to avoid extra trips back to the office
Action C.1.A.ii.c. Install battery systems for vehicles with onboard equipment to decrease truck idling while equipment is used
Action C.1.A.ii.d. When alternative-fuel infrastructure (such as electric vehicle charging stations) is installed for County government use, ensure public access and use is considered in the design and operation of such facilities
Action C.1.A.ii.e. Perform appropriate vehicle maintenance or retrofits to ensure maximum cold weather performance
Action C.1.A.ii.f. Maintain County off-road vehicles to reduce fuel use and idling time�
Action C.1.A.ii.g. Implement the County’s on- and off-road equipment replacement plan to comply with the California Air Resource Board’s heavy-duty vehicle Tier 4 requirements, to simultaneously reduce fuel use in the County fleet
Action C.1.A.ii.h. Provide incentives to improve maintenance of agricultural vehicles and equipment to reduce fuel use
Policy C.1.A.iii. Reduce vehicle miles traveled from employee commutes and County operations
Action C.1.A.iii.a. Implement a flexible work schedule for County employees incorporating telecommuting, videoconferencing, and modified schedules, including remote attendance at meetings
Action C.1.A.iii.b. Offer County employees incentives to use alternatives to single-occupant commuting, such as flexible schedules, transit incentives, bicycle facilities, bicycle-sharing programs, ridesharing services and subsidies, and telecommuting�
Action C.1.A.iii.c. Construct bicycle stations for employees that include bicycle storage, showers, and bicycle repair space�
Action C.1.A.iii.d. Consolidate offices that community members often visit at the same time (such as building permitting and environmental health permitting)�
Action C.1.A.iii.e. Continue to utilize a crew-based maintenance plan instead of individual assignments, creating a “carpool effect” that lowers the annual miles traveled for maintenance staff�
Action C.1.A.iii.f. Survey County staff for ideas to reduce vehicle miles traveled while minimizing service delivery impacts�
Policy C.1.A.iv. Encourage the use of alternative fuels in County operations and throughout the community
Action C.1.A.iv.a. Develop permitting standards and streamline the permitting process for installation of electric vehicle charging stations at residential and commercial buildings
Action C.1.A.iv.b. Consider installation of electric vehicle charging stations at public facilities, such as at parking lots and airports, for community use
Action C.1.A.iv.c. Work with electrical providers to develop and implement an electric vehicle charging infrastructure plan
Action C.1.A.iv.d. Encourage new commercial- and visitor-serving projects to include electric vehicle charging stations in parking areas
Policy C.1.A.v. Improve public transportation infrastructure�
Action C.1.A.v.a. Work with local transit agencies (e g , Eastern Sierra Transit Authority and Yosemite Area Regional Transportation System) to increase the number and frequency of routes or capacity of Dial-a-Ride programs serving Mono County
Action C.1.A.v.b. Continue to monitor the feasibility of a shuttle service connecting hotels, resorts, and campgrounds to locations such as Bodie, Mono Lake, and the June Mountain Ski Area
Action C.1.A.v.c. Use global positioning system (GPS) and integrated software to increase reliability and timing awareness for system riders through trip planning and location information
Policy C.1.A.vi. Implement engineering and enforcement solutions to improve vehicle fuel efficiency�
Action C.1.A.vi.a.
Support state/Great Basin Unified Air Pollution Control District efforts to implement and enforce limitation on idling for commercial vehicles, construction vehicles, buses, and other similar vehicles
Action C.1.A.vi.b. Consider the use of roundabouts in lieu of signalized intersections or stop signs as a way to improve traffic flow, reduce accidents, and reduce greenhouse gases
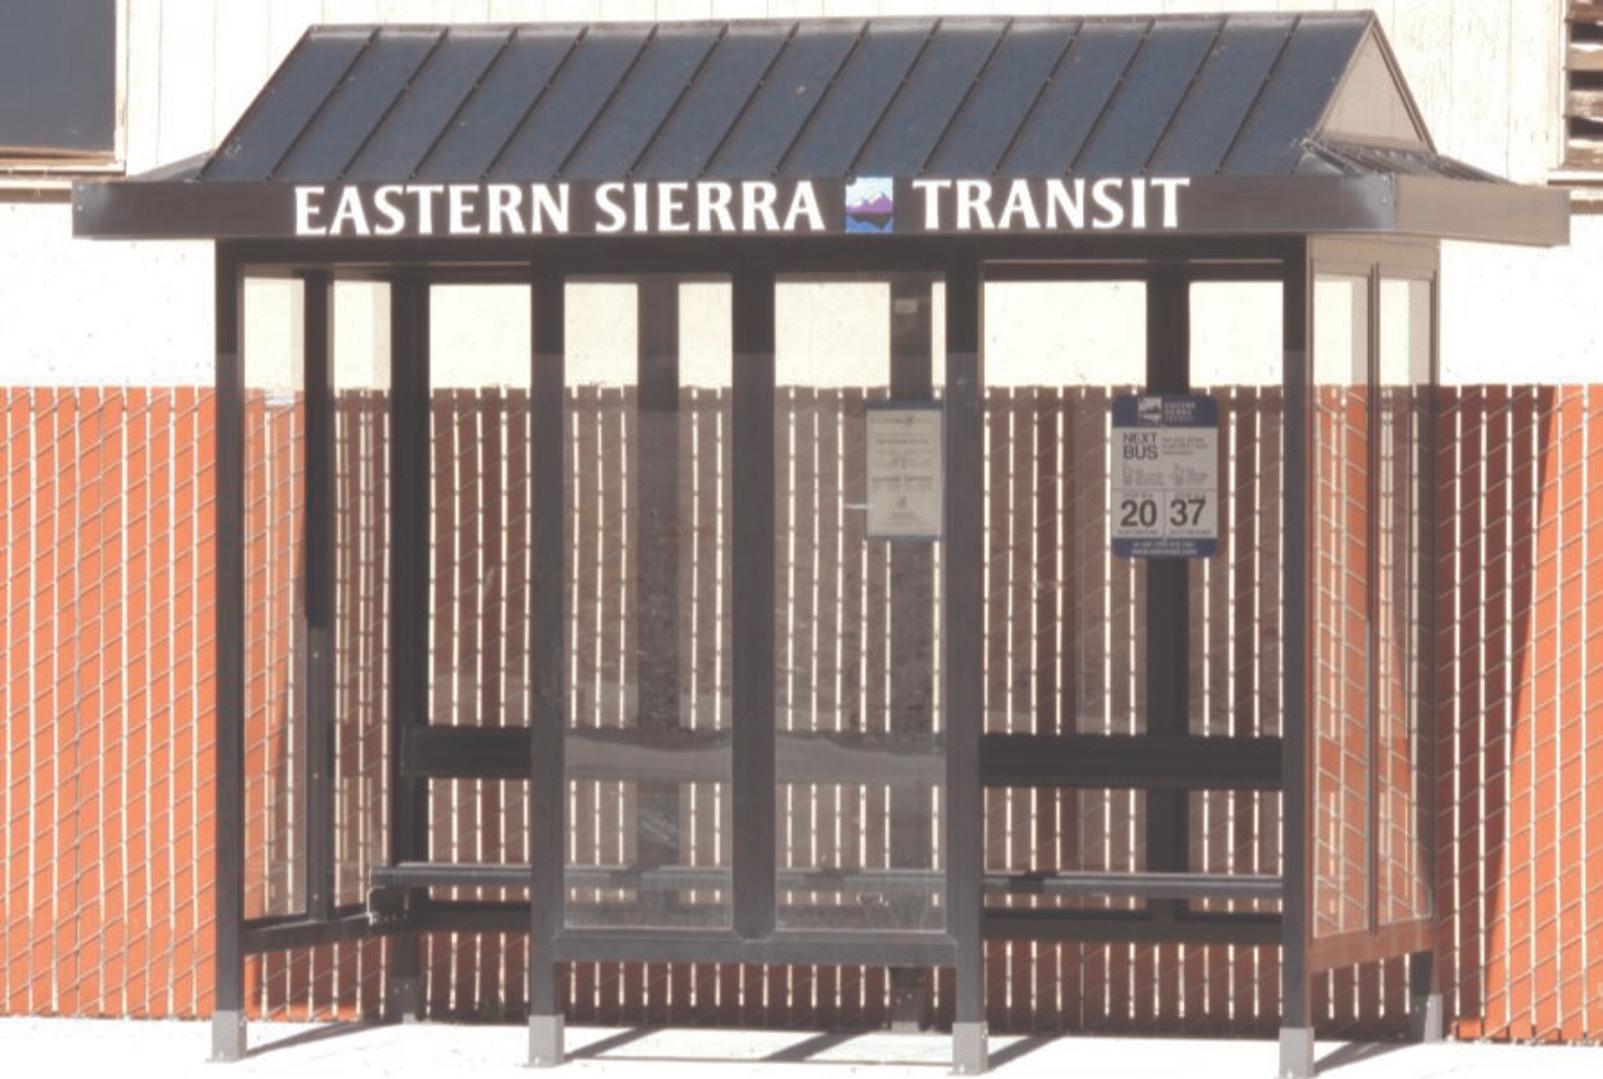
The low population density and distance between communities in Mono County mean that residents, employees, and visitors often have to travel lengthy distances as part of their daily routines While the rural quality of Mono County is not likely to change, the policies and actions supporting Goal LU�1 seek to concentrate new development within or adjacent to existing communities, promoting more concentrated communities, preserving undeveloped land, and maintaining Mono County’s natural landscape� These actions coordinate new growth and infrastructure in existing community areas, reduce vehicle miles traveled through future transportation plans, and direct future development to locations near transportation nodes
Locating new growth in existing communities increases the amount of housing, jobs, and services located within the community, and by extension decreases the need to travel to other communities for these activities� Residents, employees, and visitors can walk, bike, or take a short car trip within their community instead of traveling long distances This decreases the amount of fuel used by vehicles, saving money for vehicle owners and reducing the GHGs and air pollutants Similarly, new efficient growth can attach to existing infrastructure These actions also preserve existing agricultural land and open space, protecting Mono County’s rural character�
Objective LU.1.A. Reduce vehicle miles traveled through efficient land use patterns.
Policy LU.1.A.i. Concentrate new growth and development within existing community planning areas
Action LU.1.A.i.a. Utilize the County’s community area boundaries and Local Agency Formation Commission’s sphere of influence boundaries, and coordination through the multiagency Landownership Adjustment Program, to focus growth and infrastructure investment in established community areas
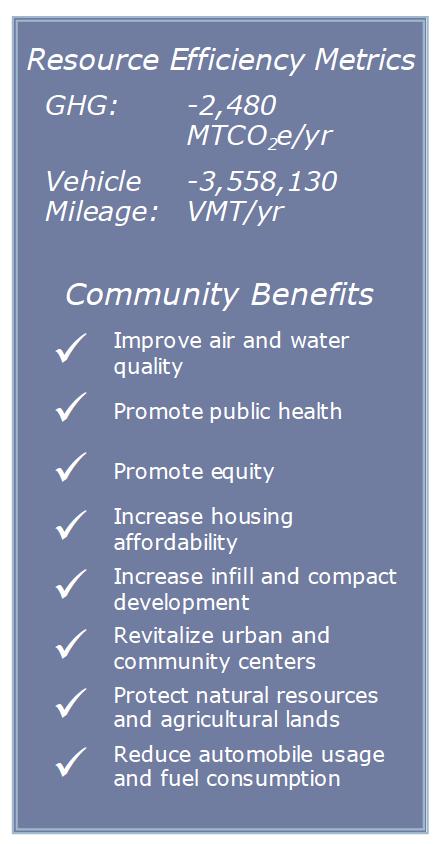
Action LU.1.A.i.b. Through the regional transportation planning process and the multi-agency Landownership Adjustment Program, develop and adopt a preferred land use and transportation scenario for future development to reduce vehicle miles traveled
Action LU.1.A.i.c. Utilize the ridgeline and hills ordinance as a way to focus growth within community areas or within spheres of influence
Policy LU.1.A.ii. Concentrate future tourist-serving and nonresidential development around existing and planned transportation routes and stops
Action LU.1.A.ii.a. Provide incentives and remove potential barriers to the development of future projects near transit stops and along transit routes
Climate change is a very broad issue, both in terms of the scope of activities that contribute to it and the potential impacts of climate change on many elements of daily life As a result, climate change cannot be addressed through a single budget or code update, but rather requires a long-term process to monitor the problem, identify risks and opportunities, and revise the policy response as needed The policies and actions supporting Goal LU 2 establish a flexible framework for Mono County to address climate change in an effective, cost-efficient way that is consistent with the rural character of the area This framework allows the County to help mitigate the effects of climate change through more efficient resource use and sustainable development, and to decrease the threats that climate change poses to Mono County by improving the County’s adaptive potential� These actions also encourage working with the Town of Mammoth Lakes to create a regional approach to climate change
These actions are supportive; on their own they do not result in a definitive decrease in resource use or GHG emissions However, by creating a regional framework to respond to climate change, they integrate issues such as resource efficiency and climate resiliency into Mono County’s regular operating practices
Objective LU.2.A.Increase greenhouse gas emission mitigation and adaptation planning efforts.
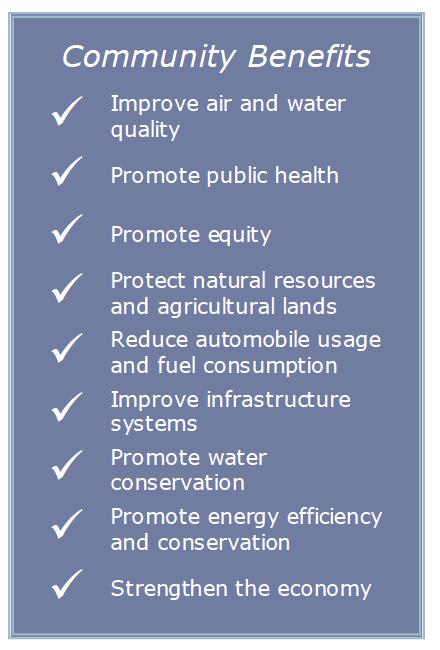
Policy LU.2.A.i. Reduce greenhouse gas emissions through local land use and development decisions, and collaborate with local, state, and regional organizations to promote sustainable development
Action LU.2.A.i.a. Work with the Town of Mammoth Lakes to identify and address existing and potential regional sources of greenhouse gas emissions�
Action LU.2.A.i.b. Analyze impacts of development projects on safety and involve emergency responders and public safety staff early and consistently in development of growth plans�
Action LU.2.A.i.c. Collaborate with the Town of Mammoth Lakes and regional and state agencies to share land use and community design-related information�
Action LU.2.A.i.d. Continue to involve a diverse group of stakeholders through the Regional Planning Advisory Committees and the Collaborative Planning Team in planning processes to ensure that County planning decisions represent community interests
As depicted in Table 5, state regulations and the anticipated increase in EV adoption rates are anticipated to reduce local emissions by 74,603 MTCO2e in 2030 and 169,911 MTCO2e in 2050, while the REP policies would contribute an additional annual GHG emissions reduction of 11,736 MTCO2e in 2030 and 37,903 MTCO2e in 2050� Credits from geothermal energy production will contribute 108,000 MTCO2e reduction per year through 2050 In total, implementation of proposed REP policies would help reduce local sources of emissions by 56% below 2005 levels by 2030 and 86% below 2005 levels by 2050, meeting the GHG reduction targets established by the County�
Table 5: 2030 & 2050 Estimated Emissions Reductions
2035 Reductions from RPS + EV Adoption Increase
2050 Reductions from RPS + EV Adoption Increase -166,563
2035 REP Policy Reductions
Figure 10 summarizes the estimated resources that will be saved by 2030 and 2050 in the unincorporated Mono County community through the implementation of REP goals, policies, and actions
Figure 10: 2035 Annual Resource Efficiency Summary
To ensure the success of this updated REP, the County will implement the identified actions As the County moves forward with updating other regulatory and planning documents, such as specific plans or building regulations, staff will ensure that these documents support and are consistent with the updated REP The County will also review new project proposals for consistency with the REP using the GHG Checklists enclosed in Appendix B
Implementing the REP will require County leadership to execute the actions and report progress Many of the actions will be dependent upon the allocation of staff time and resources, and budget prioritization The plan identifies a responsible department and offers time frames and relative costs associated with each policy Staff will monitor implementation progress using an implementation and monitoring tool and will report to the Board of Supervisors on annual progress Monitoring efforts should be conducted at the highest levels of County government, which will help to coordinate monitoring work and ensure that items are being addressed without unnecessary redundancies As part of annual progress reports, staff will evaluate the effectiveness of each policy to ensure that anticipated emissions reductions are occurring In the event that reductions do not occur as expected, the County can modify and add policies or actions to ensure the target is achieved
The following programs are designed to ensure success in implementing the REP
Implementation Program 1: Bi-annually monitor and report progress toward achieving resource efficiency targets.
Actions to support Implementation Program 1:
A. Identify key staff responsible for annual reporting and monitoring
B. Use the monitoring and reporting tool to assist with annual reports�
C. Prepare an annual progress report for review and consideration by the Regional Planning Advisory Committees, Planning Commission, and Board of Supervisors�
Implementation Program 2: Update the baseline emissions inventory and REP every five years.
Actions to support Implementation Program 2:
A. Prepare an updated emissions inventory every 5 years�
B. Update the REP no later than 2027 to incorporate new technology, programs, and policies that reduce emissions and consider a reduction target for future horizons consistent with state legislation�
C. Update and amend the REP, as necessary, should the County find that specific measures are not achieving intended emissions reductions
Implementation Program 3: Continue to develop collaborative partnerships with agencies and community groups that support REP implementation.
Action to support Implementation Program 3:
A. Continue to participate in local and regional organizations that provide tools and support for energy efficiency, energy conservation, GHG emissions reductions, adaptation, education, and implementation of this plan
Implementation Program 4: Pursue funding to implement REP policies and actions.
Actions to support Implementation Program 4:
A. Identify funding sources and levels for REP policies and actions as part of annual reporting
B. Include REP policies and actions in the capital improvement program and other plans as appropriate�
C. Pursue local, regional, state, and federal grants to support implementation
An Excel-based monitoring tool has been developed to support effective monitoring and implementation of the REP� The implementation and tracking program identifies the lead department and funding needs for implementation It also allows the County to track progress in reducing emissions, VMT, waste generation, and energy use over time using readily available data sources�
The tool is an interactive workbook used to collect data, track GHG emissions and resource consumption, and assess the effectiveness of REP policies and actions� It enables the County to sort measures based on timing, responsible department, and level of success, progress, or completion The tool also includes a dashboard to track measurable data, such as energy use, waste generation, and VMT, over time The dashboard provides a snapshot of activity and emissions that can assist County staff to provide annual updates on progress toward achieving GHG reduction and resource conservation goals
The work plan provided in Table 6 contains information to support staff and community implementation of the REP policies and actions and to effectively integrate them into budgets, the capital improvement program, and other programs and projects
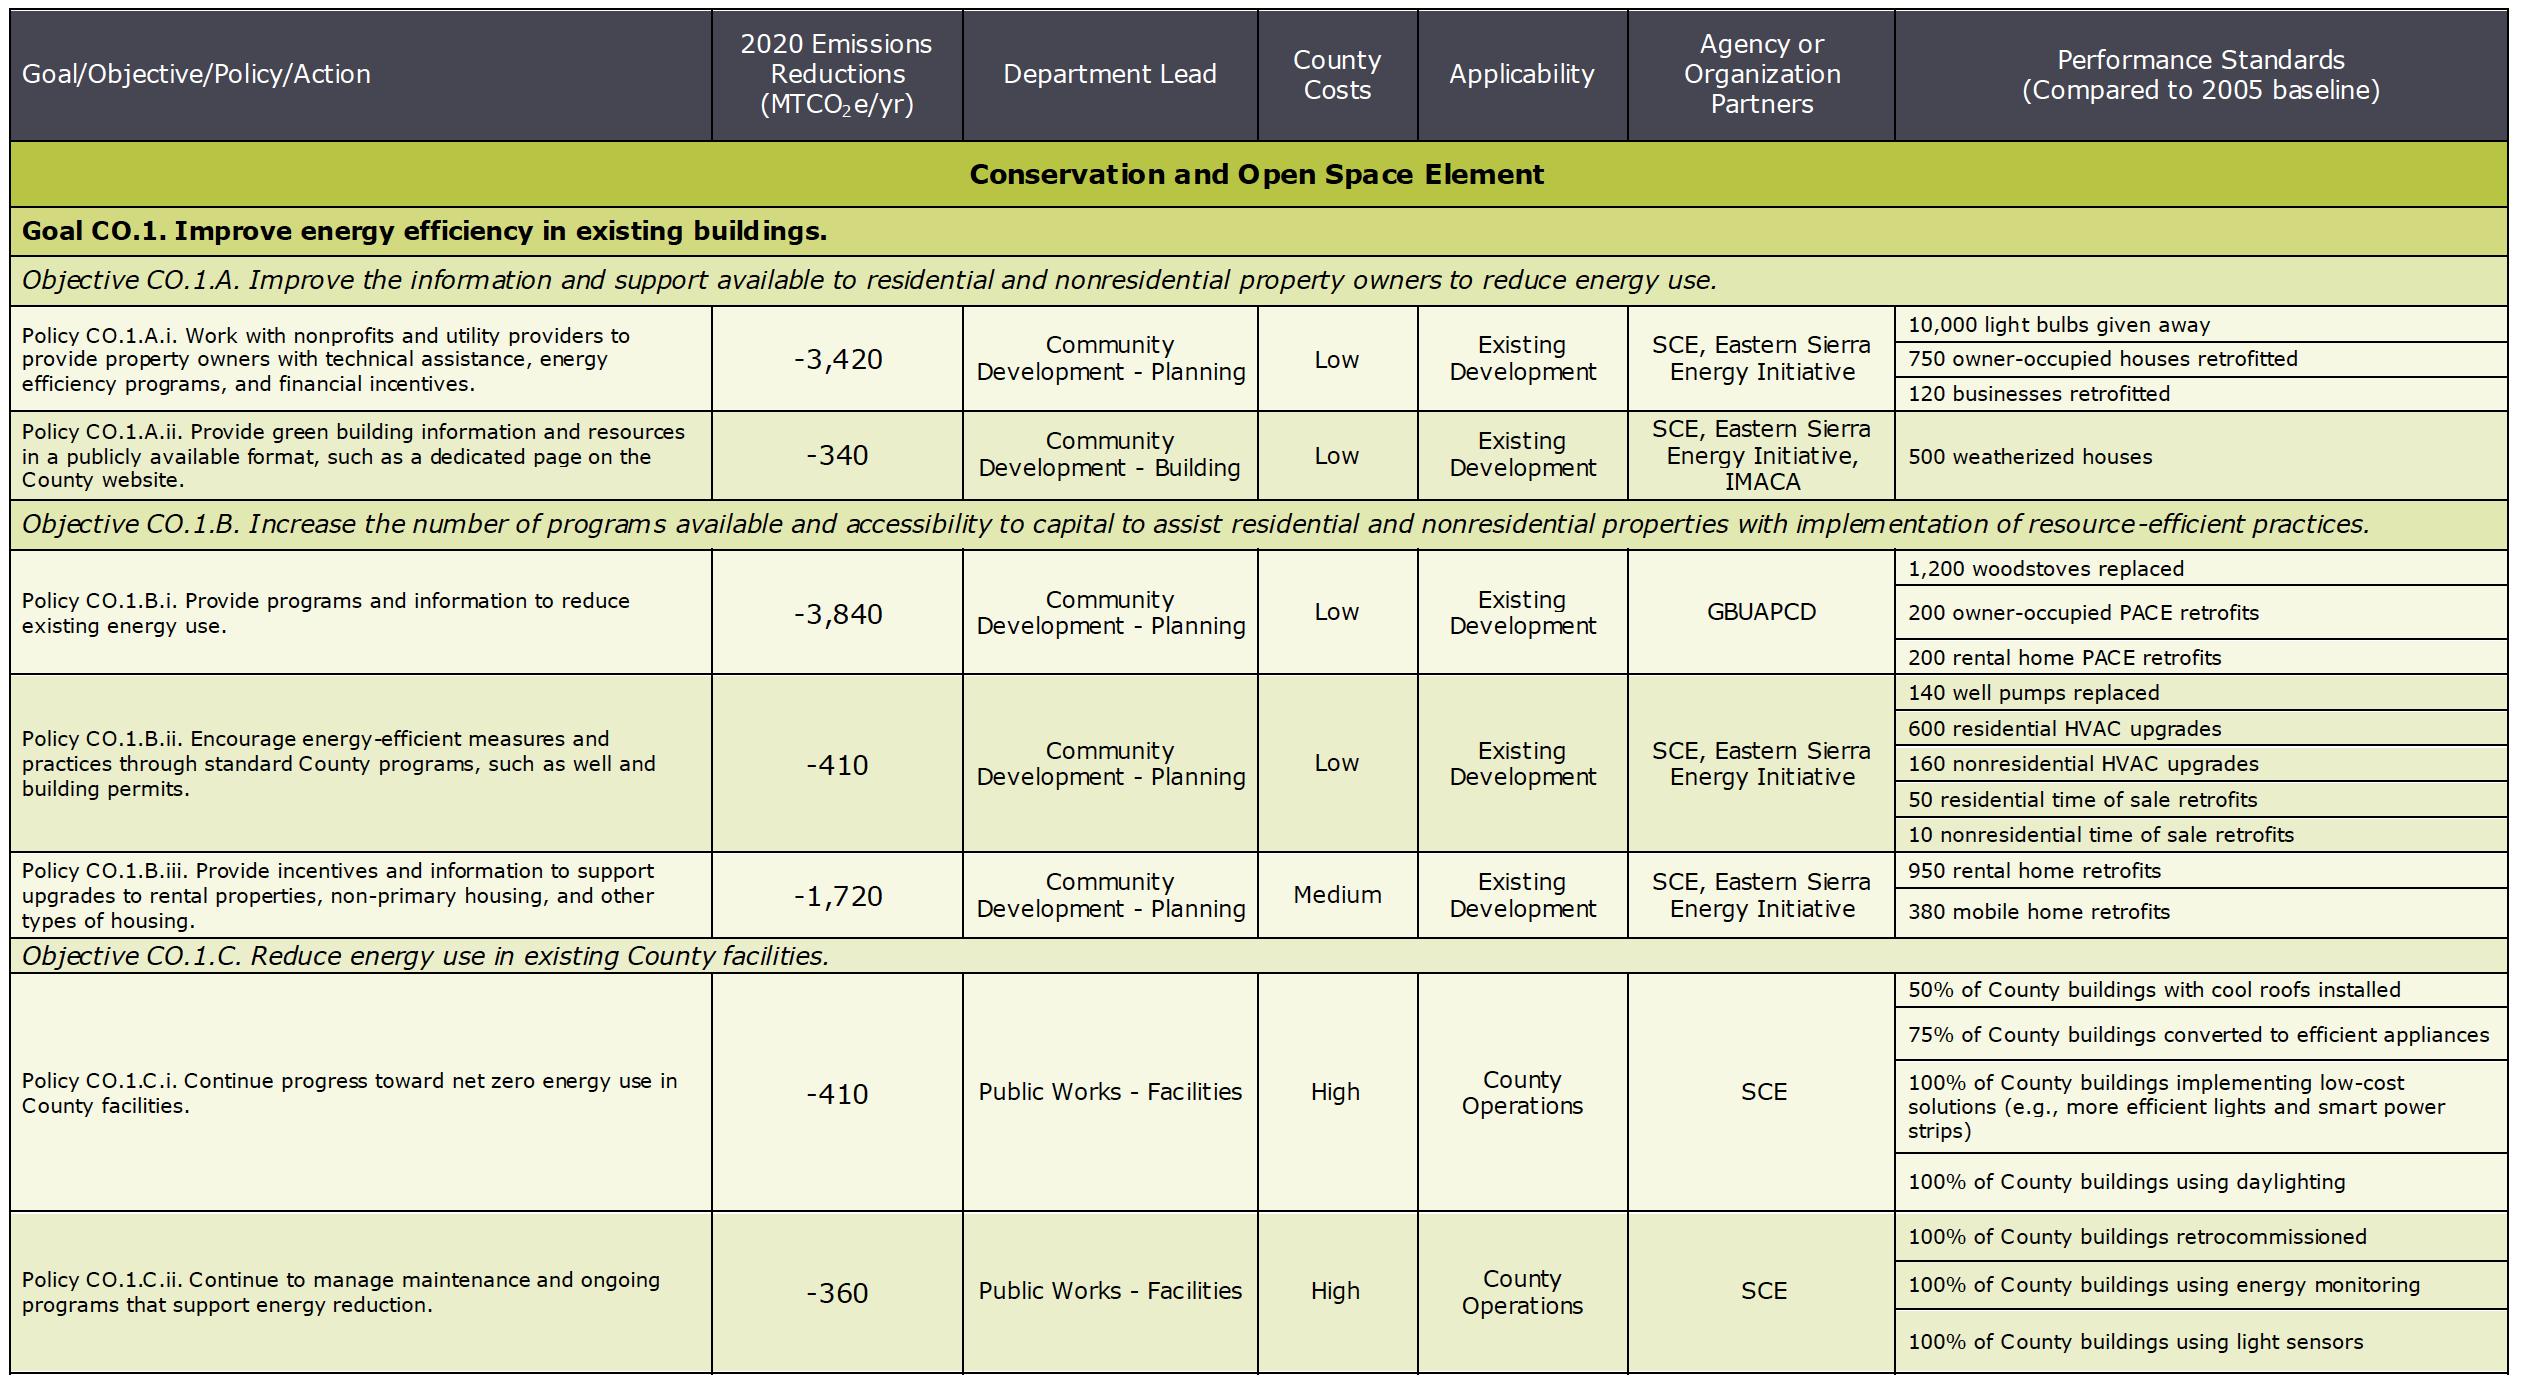
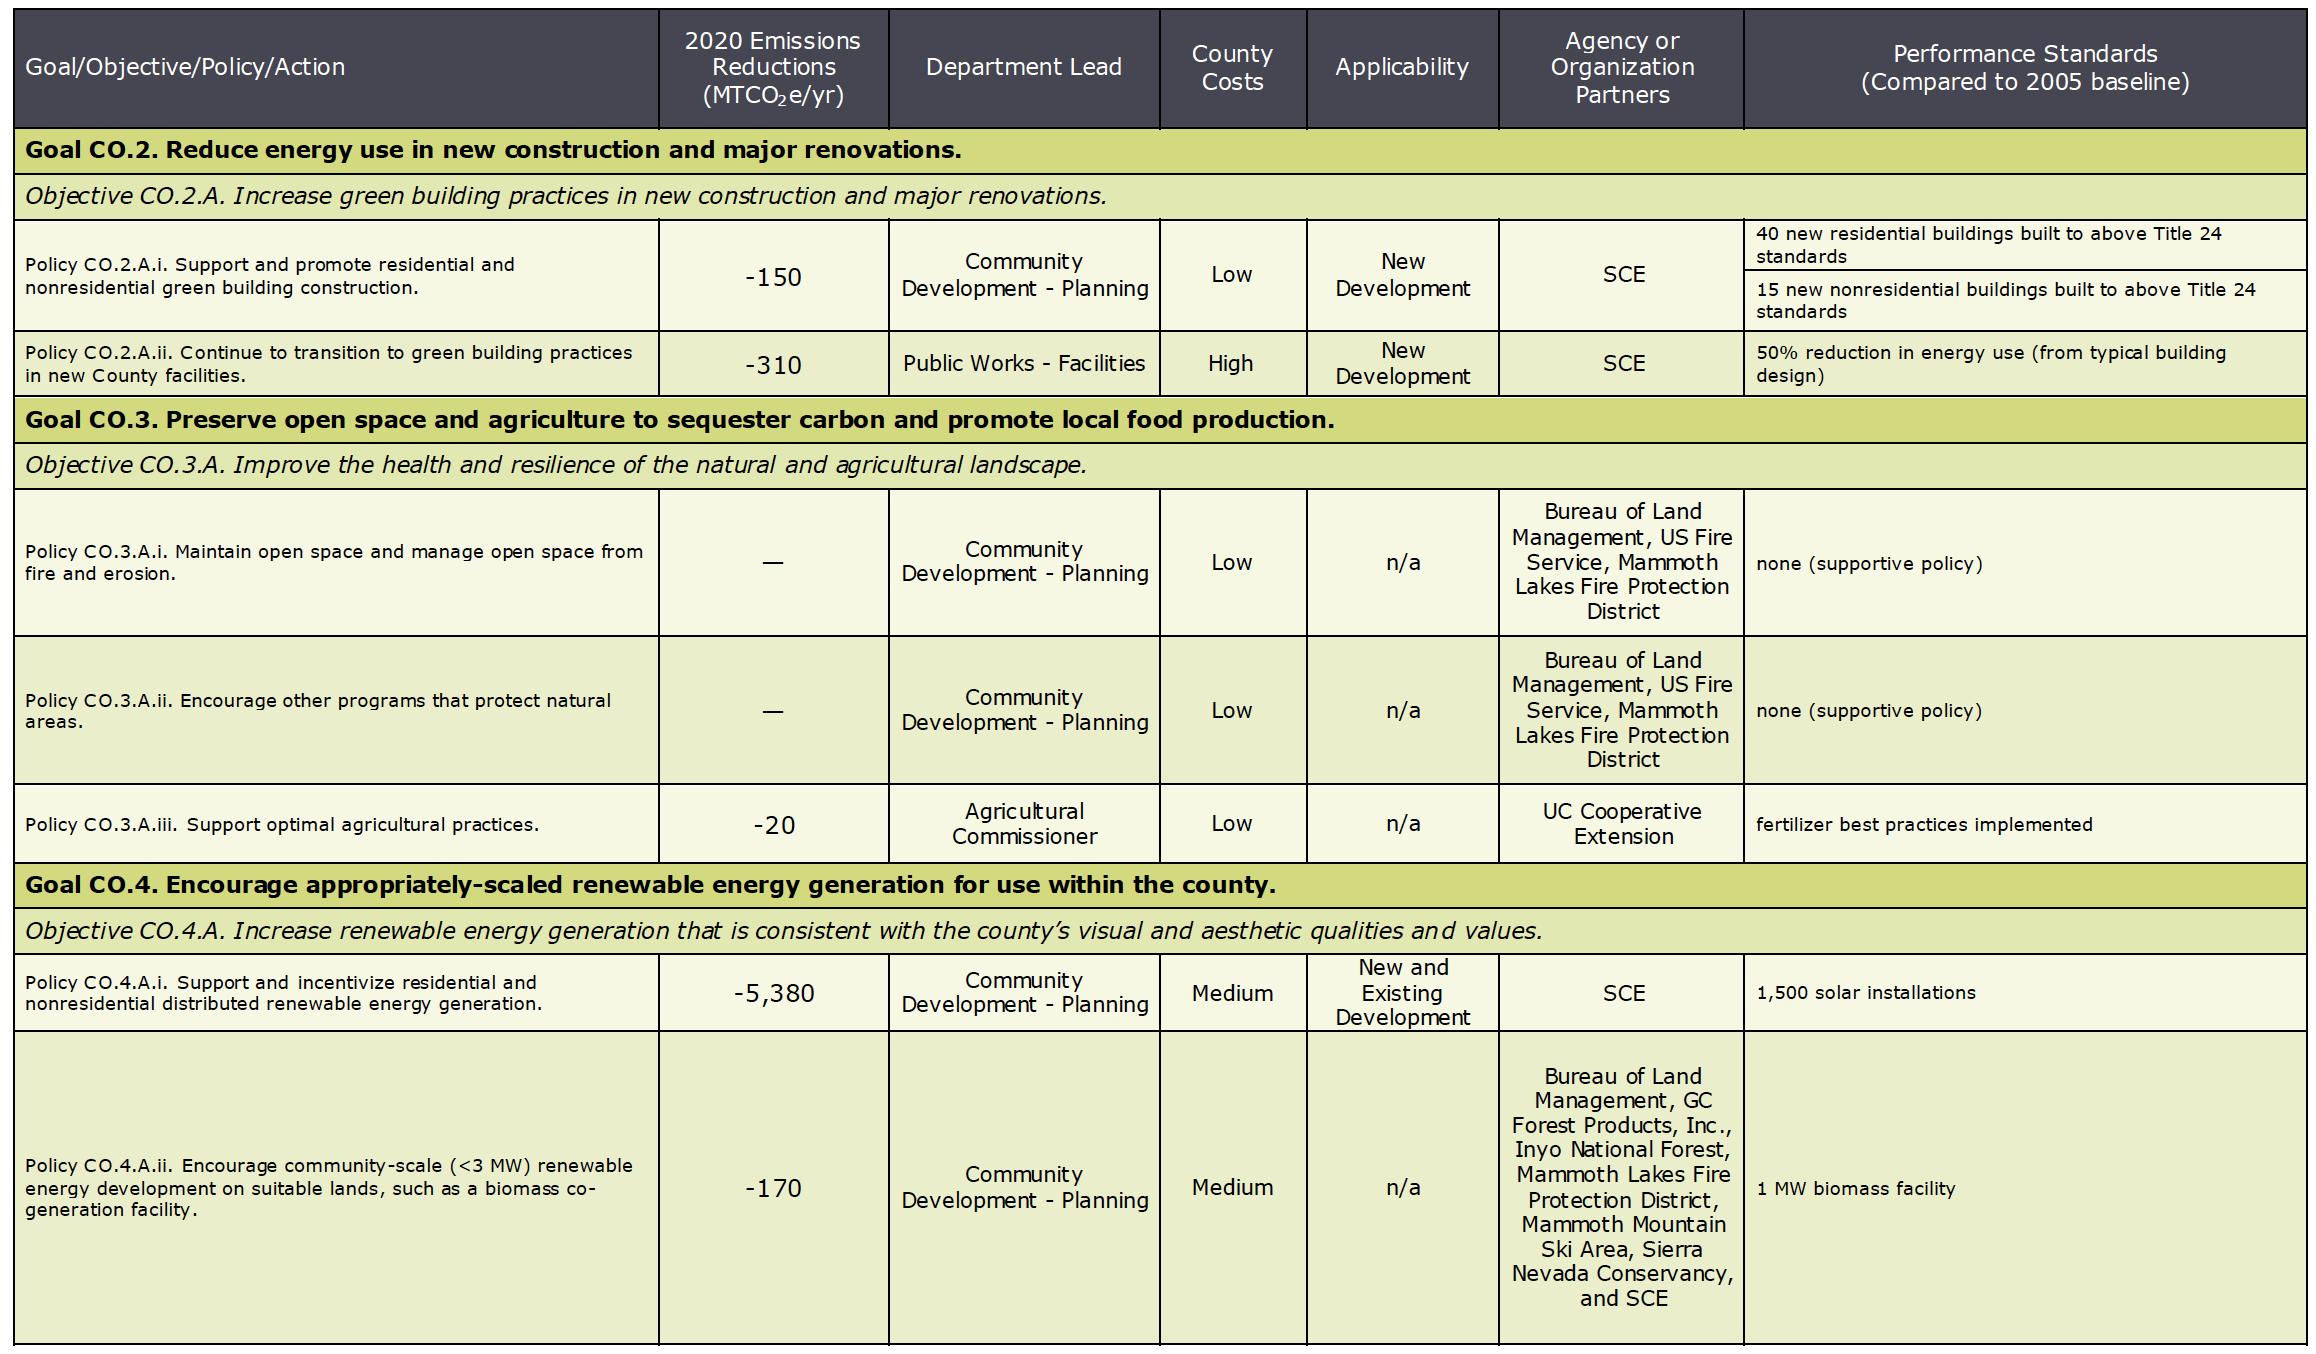
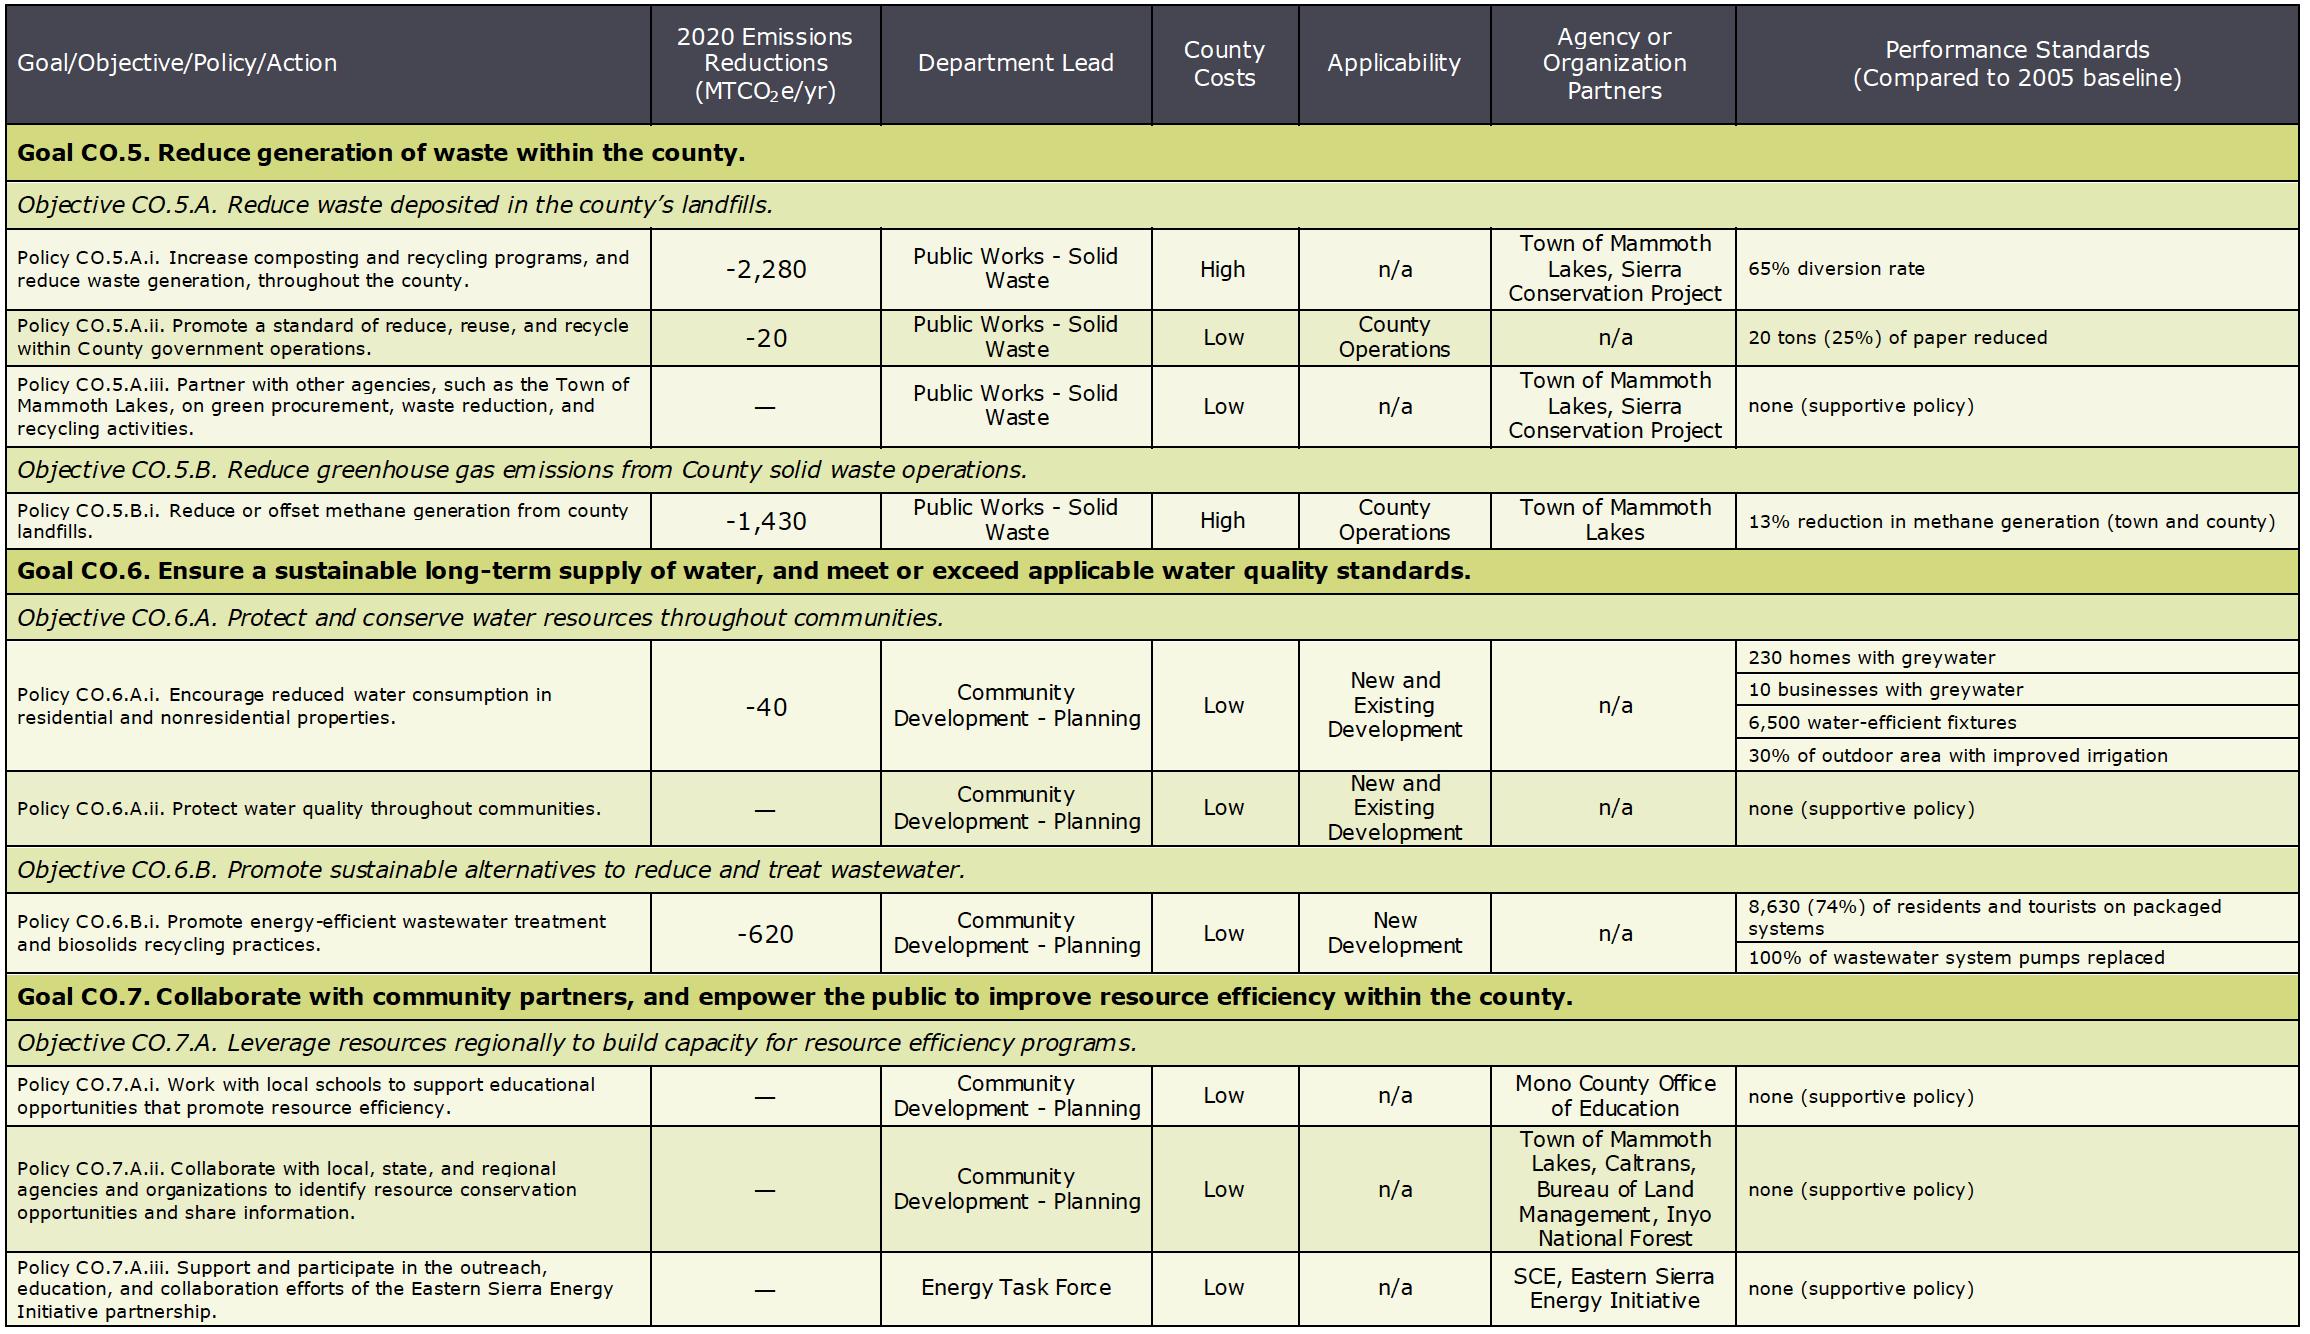
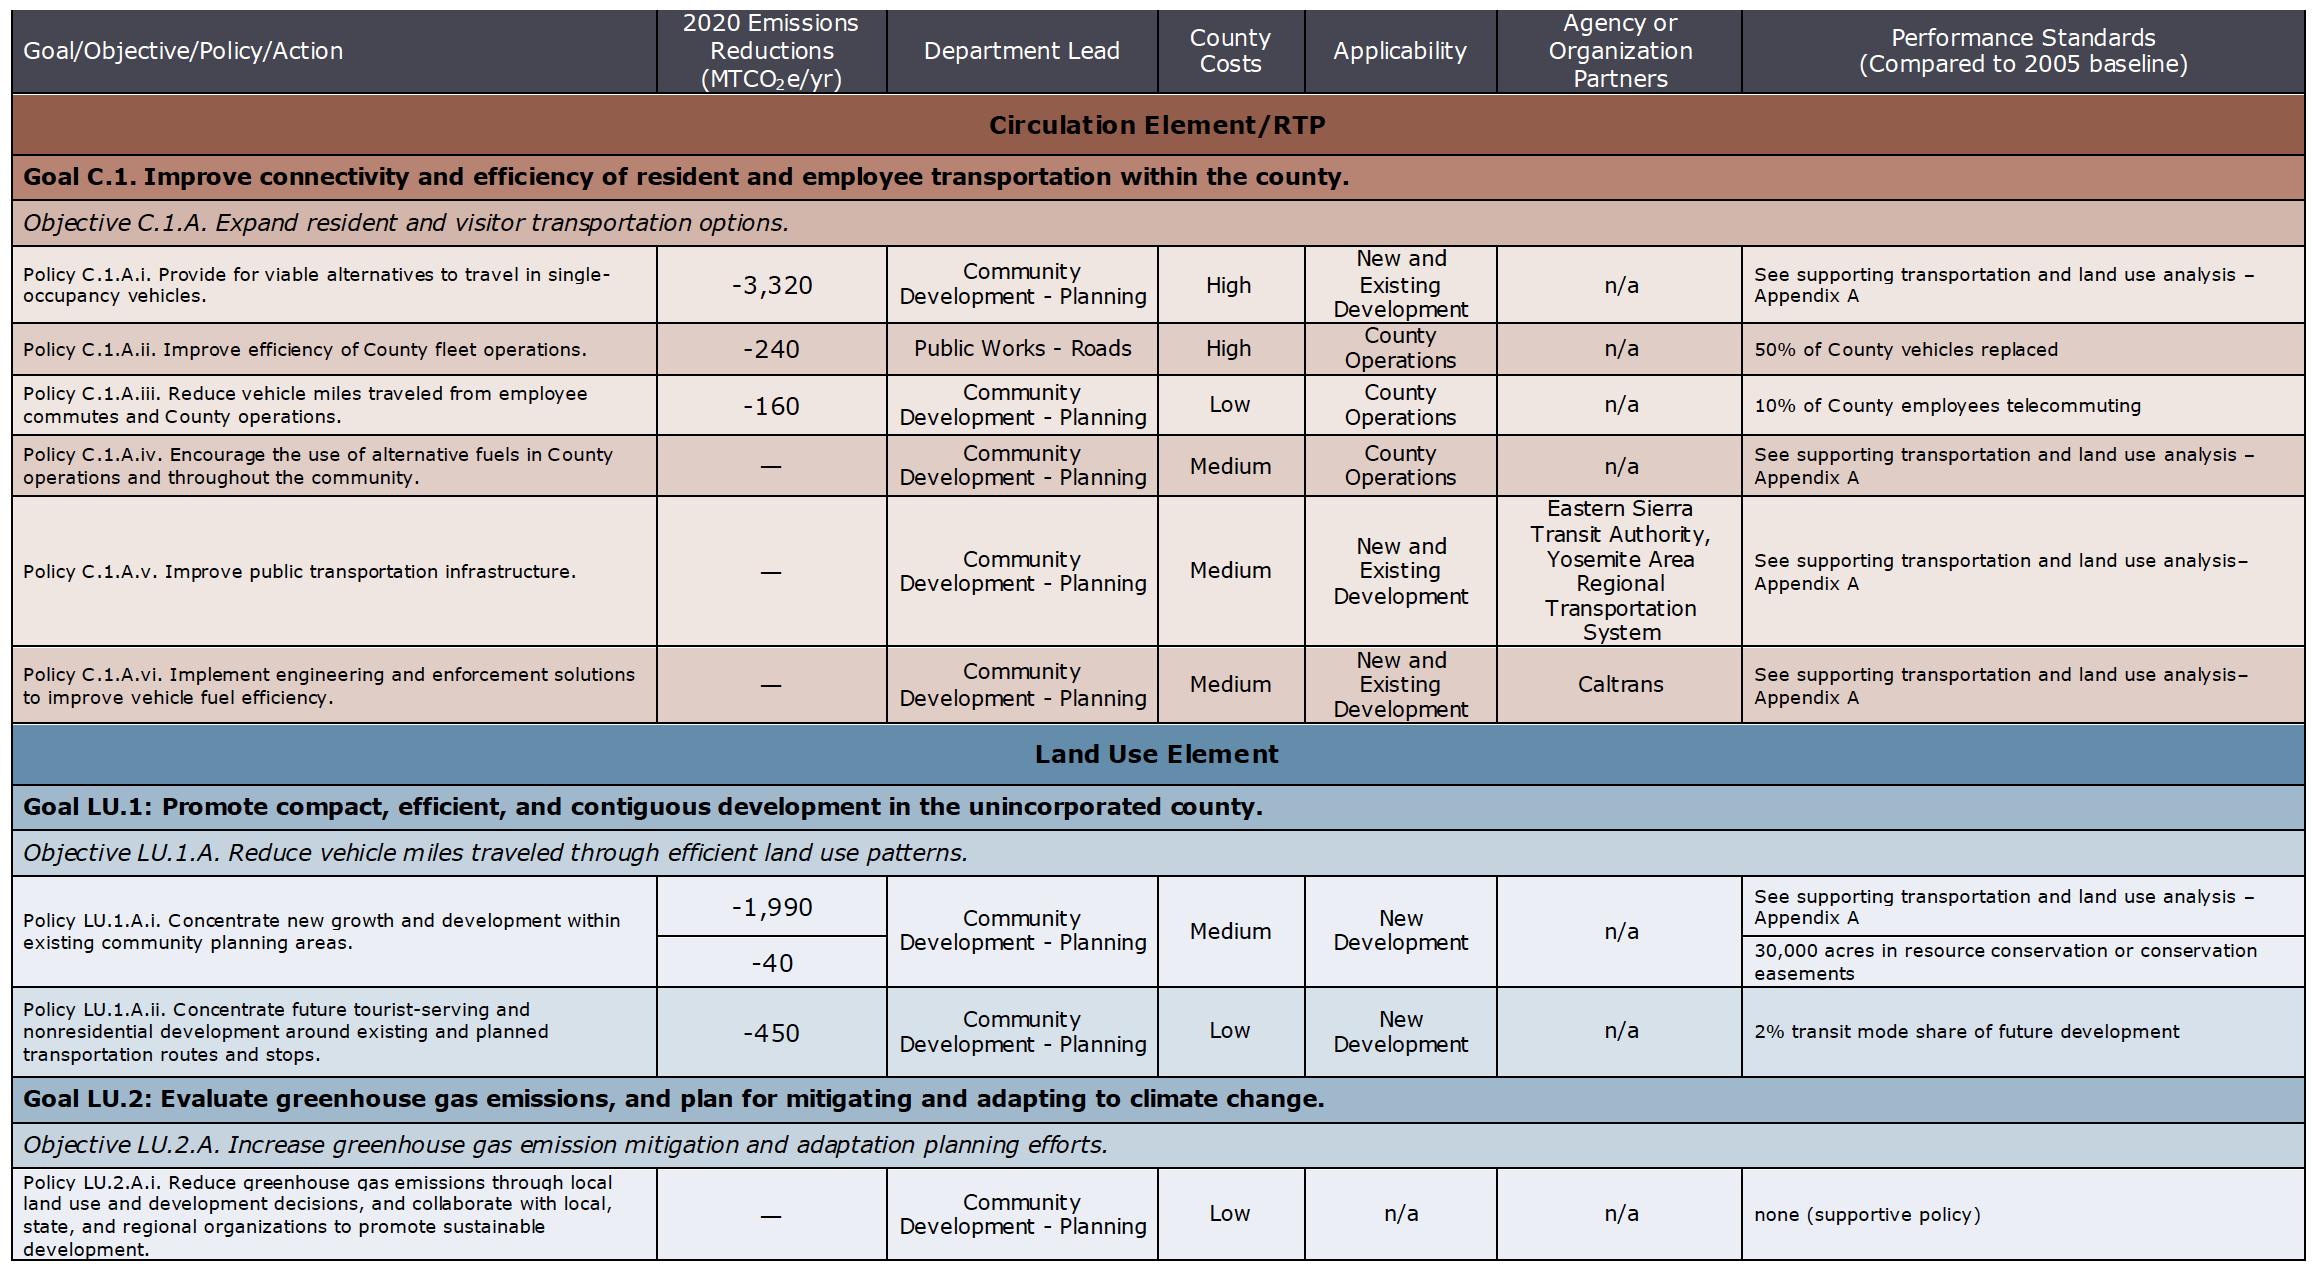

Barager, Cedar� 2013� Mono County� Attached image [of refrigerant use] (e-mail)� August 18�
Barager, Cedar. 2013. Mono County. Attached image [of refrigerant use] (e-mail). August 18. Best Places to Live. 2021. Climate in Mono County, California. https://www.bestplaces.net/climate/city/california/mono_city
Best Places to Live� 2021� Climate in Mono County, California� https://www bestplaces net/climate/city/california/mono_city
CalRecycle (California Department of Resources Recycling and Recovery). Disposal Reporting System. http://www.calrecycle.ca.gov/lgcentral/drs/
CalRecycle (California Department of Resources Recycling and Recovery) Disposal Reporting System http://www calrecycle ca gov/lgcentral/drs/
Caltrans (California Department of Transportation). 2017. California Economic Forecasts by County, 2017–2050. Sacramento. https://www.shastaedc.org/wp-content/uploads/2018/07/ CalTrans-2017-2050.pdf.
Caltrans (California Department of Transportation) 2017 California Economic Forecasts by County, 2017–2050 Sacramento� https://www�shastaedc�org/wp-content/uploads/2018/07/CalTrans-2017-2050�pdf�
CARB (California Air Resources Board). 2003. Livestock Population Methodology. https:// ww2.arb.ca.gov/carb-miscellaneous-process-methodologies-livestock.
CARB (California Air Resources Board) 2003 Livestock Population Methodology https://ww2 arb ca gov/carbmiscellaneous-process-methodologies-livestock
———. 2021. OFFROAD 2021, Version 2.0.1.2. https://arb.ca.gov/emfac/emissions-inventory.
2021 EMFAC Off Road Emissions 2021, Version 2 0 1 2 https://arb ca gov/emfac/emissions-inventory
———.2017 Scoping Plan. Sacramento. https://ww2.arb.ca.gov/our-work/programs/ab-32-climatechange-scoping-plan/2017-scoping-plan-documents.
� 2021� EMFAC On Road Emissions� 2021, Version 1�0�1� https://arb�ca�gov/emfac/emissions-inventory�
———. 2019. Local Government Operations Protocol for the quantification and reporting of greenhouse gas emissions inventories, version 1.1.
� 2021� EMFAC 2021 Volume III Technical Document� Version 1�0�1�
———. 2011. ARB Landfill Emissions Tool. http://www.arb.ca.gov/cc/protocols/localgov/ localgov.htm.
�2017 Scoping Plan� Sacramento� https://ww2�arb�ca�gov/our-work/programs/ab-32-climate-change-scopingplan/2017-scoping-plan-documents
2019 Local Government Operations Protocol for the quantification and reporting of greenhouse gas emissions inventories, version 1 1
———. 2011. Documentation of California’s Greenhouse Gas Inventory: Agriculture, Forestry, and Other Land Use: Nitrogen applied in fertilizer – Synthetic fertilizers: Nitrous oxide (N2O). http://www.arb.ca.gov/cc/inventory/archive/doc90/ docs3/3c4_fertilizernitrogen_syntheticfertilizers_n2o_1990.htm.
2022 ARB Landfill Emissions Tool 2022, Version 1 3 https://ww2 arb ca gov/local-government-operationsprotocol-greenhouse-gas-assessments
———. 2013. California Greenhouse Gas Inventory for 2000–2019 – Trends of Emissions and Other Indicators. https://ww2.arb.ca.gov/sites/default/files/classic/cc/ ca_ghg_inventory_trends_2000-2019.pdf.
———. 2021. EMFAC2021. https://arb.ca.gov/emfac/.
2011 Documentation of California’s Greenhouse Gas Inventory: Agriculture, Forestry, and Other Land Use: Nitrogen applied in fertilizer – Synthetic fertilizers: Nitrous oxide (N2O)� http://www�arb�ca�gov/cc/inventory/archive/ doc90/docs3/3c4_fertilizernitrogen_syntheticfertilizers_n2o_1990 htm
2013 California Greenhouse Gas Inventory for 2000–2019 – Trends of Emissions and Other Indicators https:// ww2 arb ca gov/sites/default/files/classic/cc/ca_ghg_inventory_trends_2000-2019 pdf
Counties of Inyo and Mono Agriculture Department 2006 2005 Agriculture Crop and Livestock Report http://www inyomonoagriculture com/uploads/2/9/2/1/2921614/2005croprpt pdf
2011 2010 Crop and Livestock Report http://www inyomonoagriculture com/uploads/2/9/2/1/2921614/ cropreport2010 pdf,
deBethizy, Heather� 2013� Mono County� County heavy equipment fuel 2010 (e-mail)� August 6�
� 2013� Report P-1: Summary Population Projections by Race/Ethnicity and by Major Age Groups� http://www� dof ca gov/research/demographic/reports/projections/p-1/
EDD (California Employment Development Department) 2020 Labor Market Information for the Eastern Sierra Region Industry Employment Projections Table 2018–2028 Sacramento http://www labormarketinfo edd ca gov/Content asp?pageid=133�
EIA (US Energy Information Administration)� 2011� Table CT1: Energy Consumption Estimates for Major Energy Sources in Physical Units, Selected Years, 1960–2011, California http://www eia gov/state/seds/sep_use/total/pdf/ use_CA pdf
2013 Table HC 1 11: Fuels Used and End Uses in Homes in West Region, Divisions, and States, 2009 http:// www eia gov/consumption/residential/data/2009/xls/HC1 11%20Fuels%20Used%20and%20End%20Uses%20 in%20West%20Region xls
n d Table HC15 4: Space Heating Characteristics by Four Most Populated States, 2005 http://www eia gov/ consumption/residential/data/2005/hc/hc4spaceheating/excel/tablehc15 4 xls
EPA (Environmental Protection Agency) 2022 eGrid Power Profiler https://www epa gov/egrid/power-profiler#/
Landfill Gas Emission Tool (LandGEM), version 3 03 2020 https://www epa gov/catc/clean-air-technologycenter-products#software
Guidance for Evaluating Landfill Gas Emissions from Closed or Abandon Facilities 2005
Heaney, James P , et al 1998 Nature of Residential Water Use and Effectiveness of Conservation Programs http:// bcn�boulder�co�us/basin/local/heaney�html�
ICF International� 2010� 2010 Propane Market Outlook: Assessment of Key Market Trends, Threats, and Opportunities Facing the Propane Industry Through 2020
http://www afdc energy gov/uploads/publication/2010_Propane_Market_Outlook_Final pdf
2010 County Residential Propane Model, version 3 2
2013 2013 Propane Market Outlook: Assessment of Key Market Trends, Threats, and Opportunities Facing the Propane Industry Through 2020
http://www afdc energy gov/uploads/publication/2013_Propane_Market_Outlook_1_ pdf
ICLEI (ICLEI-Local Governments for Sustainability) 2019 US Community Protocol for Accounting and Reporting of Greenhouse Gas Emissions, version 1�01�
Kauffman et al� Calculate How Much Propane Gas You Will Use Per Month�
https://www kauffmangas com/blog/calculate-how-much-propane-will-you-use-per-month/
Kuhns, Michael, and Tom Schmidt Heating with Wood: Special Characteristics and Volumes http://forestry usu edu/ htm/forest-products/wood-heating/
Lauren Schlau Consulting 2019 Profile of Mono Visitors and Economic Impacts of Tourism
MCWD (Mammoth Community Water District) 2021 Urban Water Management Plan
2011 2010 Urban Water Management Plan http://www mcwd dst ca us/2010%20Final%20UWMP%20reduced pdf
Meyer, Roland D , Daniel B Marcum, Steve B Orloff, and Jerry L Schmierer 2007 Alfalfa Fertilization Strategies http://alfalfa ucdavis edu/IrrigatedAlfalfa/pdfs/UCAlfalfa8292Fertilization_free pdf
Molina, Louis 2013 Mono County Wells & septic systems (e-mail) September 13
Mono County 2019 Profile of Mono County Visitors & Economic Impacts of Tourism Study https://monocounty ca�gov/sites/default/files/fileattachments/economic_development/page/31221/mono_co_2018_visitor_econ_imp_ study_report pdf
2009 County of Mono Facility Needs Assessment Report
n d Mono County Facilities Address and Contact List http://www monocounty ca gov/sites/default/files/ fileattachments/public_works_-_facilities/page/730/facilitiesaddresslist pdf
2014 Mono County General Plan Bridgeport, CA http://www monocounty ca gov/planning/page/general-plan
2019 Mono County Regional Transportation Plan Bridgeport, CA http://www monocounty ca gov/sites/ default/files/fileattachments/local_transportation_commission_ltc/page/343/2013_rtp_12 9 2013 pdf
NASS (National Agricultural Statistics Service) 1991 Agricultural Chemical Usage, 1990 Vegetables Summary, Part 2 http://usda01�library�cornell�edu/usda/nass/AgriChemUsVeg//1990s/1990/AgriChemUsVeg-06-30-1990_summary�txt�
Propane Education and Research Council� 2020� 2018 Propane Industry’s Economic Impact Report�
SCE (Southern California Edison)� 2013� Summary of Results (January 1, 2005–December 31, 2005), Unincorporated Mono County
2013 Summary of Results (January 1, 2010–December 31, 2010), Unincorporated Mono County
State of California, Department of Finance 2021 E-4 Population Estimates for Cities, Counties and the State, 2021 https://dof ca gov/forecasting/demographics/estimates/
Sugimura, Wendy 2013 Mono County Sheriff propane data (e-mail) August 19
2013 Mono County [Commute] survey (e-mail) August 22
University of California Cooperative Extension 2010 Sample Costs to Establish a Vineyard and Produce Winegrapes: Cabernet Sauvignon http://coststudies ucdavis edu/files/grapewinesonoma2010 pdf
Mono County Resource Efficiency Plan
2012 “Fertilizing Vegetables ” http://sfp ucdavis edu/pubs/Family_Farm_Series/Veg/Fertilizing/vegetables
US Census Bureau Census data for Mono County, CA Quick Facts - Mono County https://data�census�gov/cedsci/all�
US Census Bureau� 2019� American Community Survey 5-Year Estimates, House Heating Fuel: Table B25040�
USGS (United States Geological Society)� 2015� Water Use Data for California� http://waterdata�usgs�gov/ca/nwis/ water_use/
Whittman, Ken 2013 Liberty Utilities Mono County usage request (e-mail) August 1
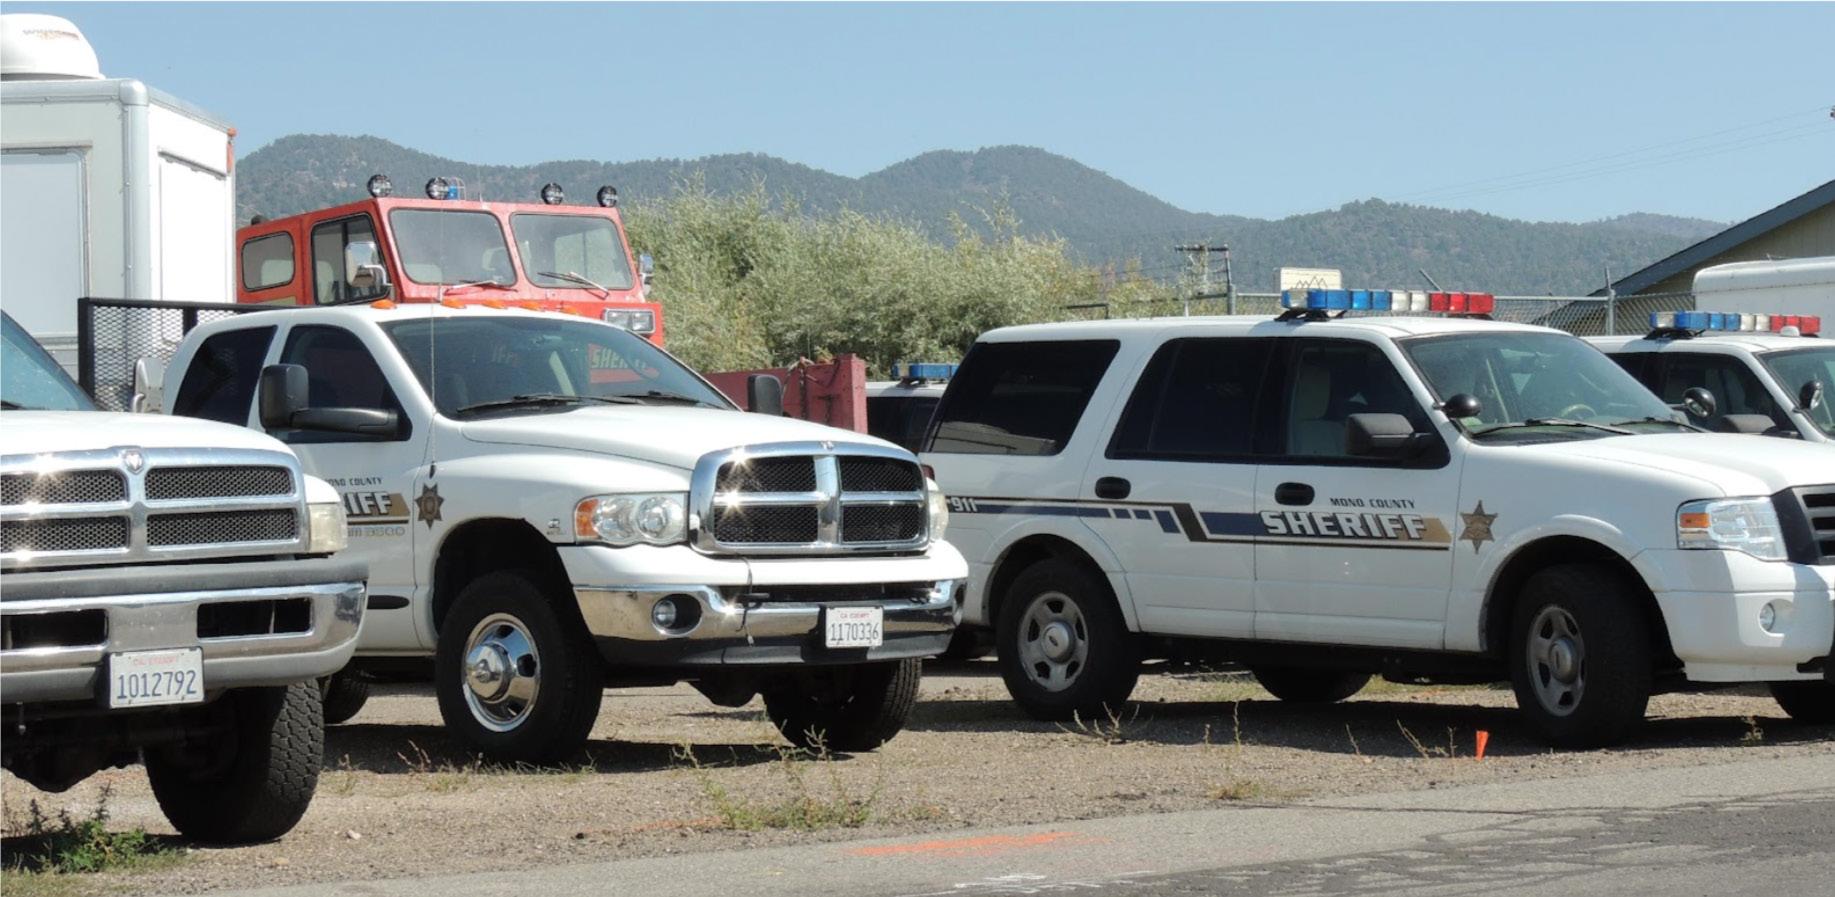
• Baseline GHG Inventory
• GHG Emissions Forecast
• County Projects
• Private Development Projects

unty to understand the local emissions profile of both the community and County government erations as well as the County ’s role in reducing statewide emissions consistent with the goals of the ifornia Global Warming Solutions Act of 2006 and the California Environmental Quality Act (CEQA) idelines. It also offers a forecast of emissions through 2050 and the methodology used to perform it.
r purposes of supporting the General Plan Environmental Impact Report (General Plan EIR) and mpliance with CEQA, the County must assess existing conditions using the most current information ailable. As a result, this memo includes the sources of data and the means by which estimates were ade when necessary.
This memo presents the technical process behind an update of Mono County’s Resource E iciency Plan. It consists of two baseline GHG emissions inventories: emissions in unincorporated Mono County (community inventory) and emissions for Mono County government operations (government operations inventory). It describes baseline emissions in the calendar year 2019 and provides a starting point for the County to understand the local emissions profile of both the community and County government operations as well as the County’s role in reducing statewide emissions consistent with the goals of the California Global Warming Solutions Act of 2006 and the California Environmental Quality Act (CEQA) Guidelines. It also o ers a forecast of emissions through 2050 and the methodology used to perform it.
ere is a set of established proto cols to assist communities in assessing GHG emissions from vernment operations and community activities. In California, many communities utilize the US mmunity Protocol for Accounting and Reporting of Greenhouse Gas Emissions, commonly referred to the US Community Protocol, to identify and assess community activities, and the California Air sources Board (CARB) Local Government Operations Pro tocol, commonly referred to as LGOP, to entify and assess GHG emissions from local government activities.
For purposes of supporting the General Plan Environmental Impact Report (General Plan EIR) and compliance with CEQA, the County must assess existing conditions using the most current information available. As a result, this memo includes the sources of data and the means by which estimates were made when necessary.
There is a set of established protocols to assist communities in assessing GHG emissions from government operations and community activities. In California, many communities utilize the US Community Protocol for Accounting and Reporting of Greenhouse Gas Emissions, commonly referred to as the US Community Protocol, to identify and assess community activities, and the California Air Resources Board (CARB) Local Government Operations Protocol, commonly referred to as LGOP, to identify and assess GHG emissions from local government activities.
hile these protocols are not regulatory, they identify relevant sources or activities, recommend ethods to estimate GHG emissions from each source, and provide consistency in the identification, sessment, and presentation of emissions results across multiple jurisdictions. The County governm ent erations and community inventories for Mono County are consistent with the US Community Protoco d LGOP and include the sources identified in Figure 1. For comparison purposes, the activities nsidered in the State of California’s GHG emissions inventory are also presented in Figure 1.
While these protocols are not regulatory, they identify relevant sources or activities, recommend methods to estimate GHG emissions from each source, and provide consistency in the identification, assessment, and presentation of emissions results across multiple jurisdictions. The County government operations and community inventories for Mono County are consistent with the US Community Protocol and LGOP and include the sources identified in Figure 1. For comparison purposes, the activities considered in the State of California’s GHG emissions inventory are also presented in Figure 1.
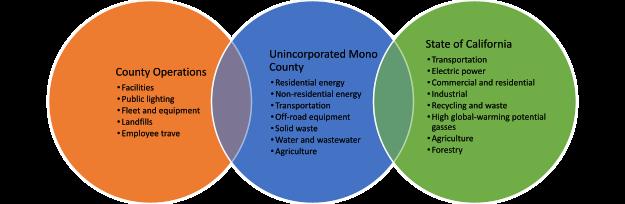
GHG emissions from Mono County government operations in 2019 totaled approximately 12,956 metric tons of carbon dioxide equivalent (MTCO2e) emissions, as shown in Table 1 and Figure 2. The landfills operated by the County, represented the largest source of emissions, accounting for 8,160 MTCO2e, or 63% of all County government operation emissions. The second largest source of emissions was the County’s vehicle fleet and equipment (2,090 MTCO2e, 16%), followed by emissions from employee travel (1,536 MTCO2e, 12%), and energy used at County facilities (1,140 MTCO2e, 9%). The remaining government operation emissions (30 MTCO2e, less than 1%) were attributed to public lighting, which includes streetlights owned or maintained by the County. Table 1 summarizes the government operations inventory results. A detailed description of how emissions were calculated for each activity is provided in the activity data and energy use methods section of this memo.
GHG emissions from Mono County government operations in 2019 totaled approximately 12,956 metric tons of carbon dioxide equivalent (MTCO2e) emissions, as shown in Table 1 and Figure 2 The landfills operated by the County, represented the largest source of emissions, accounting for 8,160 MTCO2e, or 63% of all County government operation emissions. The second largest source of emissio ns was the County ’s vehicle fleet and equipment (2,090 MTCO2e, 16%), followed by emissions from employee travel (1,536 MTCO2e, 12%), and energy used at County facilities (1,140 MTCO2e, 9%) The remaining government operation emissions (30 MTCO2e, less than 1%) were attributed to public lighting , which includes streetlights owned or maintained by the County. Table 1 summarizes the government operations inventory results. A detailed description of how emissions were calculated for each activity is provided in the activity data and energy use methods section of this memo
1: Emissions from Government Operations, 2019
GHG emissions from Mono County government operations in 2019 totaled approximately 12,956 metric tons of carbon dioxide equivalent (MTCO2e) emissions, as shown in Table 1 and Figure 2. The landfills operated by the County, represented the largest source of emissions, accounting for 8,160 MTCO2e, or 63% of all County government operation emissions. The second largest source of emissio ns was the County ’s vehicle fleet and equipment (2,090 MTCO2e, 16%), followed by emissions from employee travel (1,536 MTCO2e, 12%), and energy used at County facilities (1,140 MTCO2e, 9%). The remaining government operation emissions (30 MTCO2e, less than 1%) were attributed to public lighting , which includes streetlights owned or maintained by the County. Table 1 summarizes the government operations inventory results. A detailed description of how emissions were calculated for each activity is provided in the activity data and energy use methods section of this memo.
2: County Operations Emissions, 2019
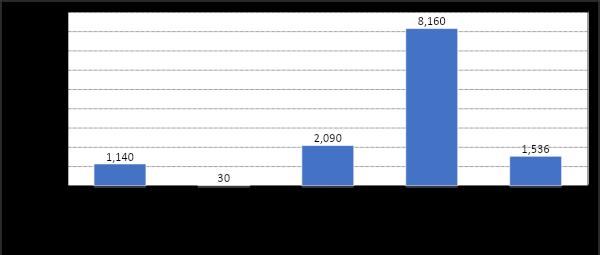
Similar to most California communities, transportation (on-road vehicles) was the largest source of emissions (268,290 MTCO2e, 76%) in Mono County in 20191, followed by residential energy use (29,240 MTCO2e, 8%)2 , nonresidential energy use (23,690 MTCO2e, 19%), and o -road equipment (10,030 MTCO2e, 3%). The remaining community emissions (20,963 MTCO2e, 6%) were attributed to solid waste, water and wastewater, and agriculture. Additionally, the landfill emission is imported from County Operations. Table 2 and Figure 3 summarize the community inventory results.
Similar to most California communities, transportation (on-road vehicles) was the largest source of emissions (268,290 MTCO2e, 76%) in Mono County in 20191, followed by residential energy use (29,240 MTCO2e, 8%)2, nonresidential energy use (23,690 MTCO2e, 19%), and off-road equipment (10,030 MTCO2e, 3%). The remaining community emissions (20,963 MTCO2e, 6%) were attributed to solid waste, water and wastewater, and agriculture. Additionally, the landfill emission is imported from County Operations. Table 2 and Figure 3 summarize the community inventory results.
Similar to most California communities, transportation (on-road vehicles) was the largest source of emissions (268,290 MTCO2e, 76%) in Mono County in 20191, followed by residential energy use (29,240 MTCO2e, 8%)2, nonresidential energy use (23,690 MTCO2e, 19%), and off-road equipment (10,030 MTCO2e, 3%) The remaining community emissions (20,963 MTCO2e, 6%) were attributed to solid waste, water and wastewater, and agriculture Additionally, the landfill emission is imported from County Operations Table 2 and Figure 3 summarize the community inventory results
County Ops)
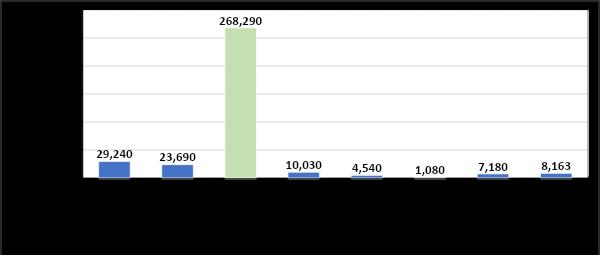
1 The methodology for measuring VMT changed from 2010 to 2019, pushing the value of VMT far higher than in the previous study.
1 The methodology for measuring VMT changed from 2010 to 2019, pushing the value of VMT far higher than in the previous study
2 Electricity usage came from the supplying utility, but for the year 2020 rather than 2019; this year was significantly impacted by the COVID-19 virus as many businesses employed work from home mandates, and some other retail-facing enterprises closed. This is likely part of the reason for the relative increase in residential energy use/emissions compared to nonresidential use/emissions.
2 Electricity usage came from the supplying utility, but for the year 2020 rather than 2019; this year was significantly impacted by the COVID-19 virus as many businesses employed work from home mandates, and some other retail-facing enterprises closed This is likely part of the reason for the relative increase in residential energy use/emissions compared to nonresidential use/emissions.
1 The methodology for measuring VMT changed from 2010 to 2019, pushing the value of VMT far higher than in the previous study
2 Electricity usage came from the supplying utility, but for the year 2020 rather than 2019; this year was significantly impacted by the COVID-19 virus as many businesses employed work from home mandates, and some other retail-facing enterprises closed. This is likely part of the reason for the relative increase in residential energy use/emissions compared to nonresidential use/emissions
g g
The California Global Warming Solutions Act of 2016 (SB 32) identifies a statewide goal to reduce emissions to 40% below 1990 levels by 2030. However, the availability of data can compromise a jurisdiction’s ability to accurately assess emissions generated from activities in the community in 1990. In lieu of 1990 emissions estimates, CARB recommends that jurisdictions assess emissions for a calendar year between 2005 and 2008 and determine an appropriate amount to reduce emissions by 2020. CARB’s AB 32 Climate Change Scoping Plan (2008) identifies a reduction of approximately 15% below 2005 emissions as equivalent to 1990 emissions. To maintain consistency with CARB guidance, the County has prepared a community inventory for 2005 to provide a basis to establish an appropriate emissions reduction target.
emissions to 40% below 1990 levels by 2030 However, the availability of data can compromise a jurisdiction’s ability to accurately assess emissions generated from activities in the community in 1990. In lieu of 1990 emissions estimates, CARB recommends that jurisdic tions assess emissions for a calendar year between 2005 and 2008 and determine an appropriate amount to reduce emissions by 2020. CARB’s AB 32 Climate Change Scoping Plan (2008) identifies a reduction of approximately 15% below 2005 emissions as equivalent to 1990 emissions. To maintain consistency with CARB guidance, the County has prepared a community inventory for 2005 to provide a basis to establi sh an appropriate emissions reduction target.
The California Global Warming Solutions Act of 2016 (SB 32) identifies a statewide goal to reduce emissions to 40% below 1990 levels by 2030 However, the availability of data can compromise a jurisdiction’s ability to accurately assess emissions generated from activities in the community in 1990. In lieu of 1990 emissions estimates, CARB recommends that jurisdic tions assess emissions for a calendar year between 2005 and 2008 and determine an appropriate amount to reduce emissions by 2020. CARB’s AB 32 Climate Change Scoping Plan (2008) identifies a reduction of approximately 15% below 2005 emissions as equivalent to 1990 emissions. To maintain consistency with CARB guidance, the County has prepared a community inventory for 2005 to provide a basis to establi sh an appropriate emissions reduction target.
GHG emissions from activities occurring in unincorporated portions of the county totaled approximately 359,755 MTCO2e in 2005 and 352,213 MTCO2e in 2019. Between 2005 and 2019 emissions fell approximately 3% (see Table 3). 3
GHG emissions from activities occurring in unincorporated portions of the county totaled approximately 359,755 MTCO2e in 2005 and 352,213 MTCO2e in 2019. Between 2005 and 2019 emissions fell approximately 3% (see Table 3). 3
GHG emissions from activities occurring in unincorporated portions of the county totaled approximately 359,755 MTCO2e in 2005 and 352,213 MTCO2e in 2019. Between 2005 and 2019 emissions fell approximately 3% (see Table 3). 3
To assist in comparing emissions with other jurisdictions or between years where population varies, these totals can also be presented as per-capita emissions, as shown in Table 4. Because Mono County emissions are heavily influenced by tourism, per-capita emissions can be calculated both for the permanent population and for the effective annual population (described below).
To assist in comparing emissions with other jurisdictions or between years where population varies, these totals can also be presented as per-capita emissions, as shown in Table 4. Because Mono County emissions are heavily influenced by tourism, percapita emissions can be calculated both for the permanent population and for the e ective annual population (described below).
To assist in comparing emissions with other jurisdictions or between years where population varies, these totals can also be presented as per-capita emissions, as shown in Table 4. Because Mono County emissions are heavily influenced by tourism, per-capita emissions can be calculated both for the permanent population and for the effective annual population (described below)
3 The increase in residential energy use in 2019 is due to the fact that 2020 data was used as a proxy for 2019 for this sector Residential energy use in 2020 was deeply affected by the COVID lock downs as commercial properties closed and is likely unusually high. The utility provided the County with electricity use figures for 2020.
3 The increase in residential energy use in 2019 is due to the fact that 2020 data was used as a proxy for 2019 for this sector. Residential energy use in 2020 was deeply a ected by the COVID lock downs as commercial properties closed and is likely unusually high. The utility provided the County with electricity use figures for 2020.
4 Due to the new methodology used in determining emissions from VTM in 2019, the 2005 values needed to be updated from the previous report to reflect the new methodology This table includes the updated values
4 Due to the new methodology used in determining emissions from VTM in 2019, the 2005 values needed to be updated from the previous report to reflect the new methodology. This table includes the updated values.
4 Due to the new methodology used in determining emissions from VTM in 2019, the 2005 values needed to be updated from the previous report to reflect the new methodology. This table includes the updated values.
3 The increase in residential energy use in 2019 is due to the fact that 2020 data was used as a proxy for 2019 for this sector. Residential energy use in 2020 was deeply affected by the COVID lock downs as commercial properties closed and is likely unusually high. The utility provided the County with electricity use figures for 2020. 4
The following section describes the sources, methods, and results for calculating emissions from each activity analyzed in the County government operations and Community (unincorporated Mono County) inventories.5 This information and activity data also provides the technical foundation for assessing the effectiveness of future policies and programs at reducing both GHG emissions and the consumption of resources.
The following section describes the sources, methods, and results for calculating emissions from each activity analyzed in the County government operations and Community (unincorporated Mono County) inventories5. This information and activity data also provides the technical foundation for assessing the e ectiveness of future policies and programs at reducing both GHG emissions and the consumption of resources.
The following section describes the sources, methods, and results for calculating emissions from each activity analyzed in the County government operations and Community (unincorporated Mono County) inventories.5 This information and activity data also provides the technical foundation for assessing the effectiveness of future policies and programs at reducing both GHG emissions and the consumption of resources.
In 20206, approximately 24,269,650 kilowatt hours (kWh) of electricity were consumed in unincorporated Mono County for residential use, while about 15,663,630 kWh were consumed for nonresidential uses (electricity consumed by commercial, industrial, and agricultural operations, as well as street lighting and institutional buildings such as schools and community facilities). Electricity in Mono County is currently supplied by two utility providers: Southern California Edison (SCE) and Liberty Utilities (formerly Sierra Pacific Power Company). Table 3 identifies total electricity use in 2020 by utility provider and use class.
In 20206, approximately 24,269,650 kilowatt hours (kWh) of electricity were consumed in unincorporated Mono County for residential use, while about 15,663,630 kWh were consumed for nonresidential uses (electricity consumed by commercial, industrial, and agricultural operations, as well as street lighting and institutional buildings such as school s and community facilities) Electricity in Mono County is currently supplied by two utility providers: Southern California Edison (SCE) and Liberty Utilities (formerly Sierra Pacific Power Company) Table 3 identifies total electricity use in 2020 by utility provider and use class.
SCE’s service territory covers the majority of Mono County, including the communities of Benton, Bridgeport, Chalfant, Crowley Lake, Crestview, June Lake, Lee Vining, Paradise, Pumice Valley, and Toms Place. SCE provides approximately 83% of the electricity used in the unincorporated county.
SCE’s ser vice territory covers the majority of Mono County, including the communities of Benton, Bridgeport, Chalfant, Crowley Lake, Crestview, June Lake, Lee Vining , Paradise, Pumice Valley, and Toms Place. SCE provides approximately 83% of the electricity used in the unincorporated county.
Beginning in 2011, Liberty Utilities assumed responsibility from Sierra Pacific Power Company to provide electricity service to the northern portion of Mono County, including the unincorporated communities of Coleville, Topaz, and Walker. Liberty Utilities provides approximately 17% of the electricity used in the unincorporated county.
Beginning in 2011, Liberty Utilities assumed responsibility from Sierra Pacific Power Company to provide electr icity ser vice to the northern portion of Mono County, including the unincorporated communities of Coleville, Topaz, and Walker. Liberty Utilities provides approximately 17% of the electricity used in the unincorporated county.
Electricity use provided by the Utilities in residential and nonresidential buildings, accounted for 7,870 MTCO2e (about 2% of total community emissions and included as a subset of the residential energy and nonresidential energy sectors in Table 2). Residential electricity use contributed 4,700 MTCO2e, or approximately 60% of electricity emissions, while electricity uses at nonresidential buildings emitted 3,170 MTCO2e (40%).
Electricity used to support government operations resulted in 200 MTCO2e in 2020. Electricity provided by SCE constituted 170 MTCO2e (85% of these emissions), while electricity service from Liberty Utilities accounted for the remaining 30 MTCO2e (15%).
Electricity use provided by the Utilities in residential and nonresidential buildings, accounted for 7,870 MTCO2e (about 2% of total community emissions and included as a subset of the residential energy and nonresidential energy sectors in Table 2). Residential electricity use contributed 4,700 MTCO2e, or approximately 60% of electricity emissions, while electricity uses at nonresidential buildings emitted 3,170 MTCO2e (40%).
Notes on electricity calculations. Electricity use from Liberty Utilities was inferred, as data was not made available. It was therefore based on a percentage of SCE electricity found in the 2015 REP. The emission factors used to calculate emissions from electricity were taken from the EPA’s eGrid website, unless otherwise available from a local source. The emission values applied for 2019 were 1.63E-04 MTCO2e/kWh for Liberty and 2.88E-04 MTCO2e/kWh for SCE.
6 Electricity figures are from 2020 and used as a proxy for 2019.
5 The full volume of emissions from County Operations is not added to the Community Emissions total. Only landfill emission totals are added. This avoids double counting of electricity use, electricity uses for water and wastewater, VMT, solid waste disposal, etc.
5 The full volume of emissions from County Operations is not added to the Community Emissions total. Only landfill emission totals are added This avoids double counting of electricity use, electricity uses for water and wastewater, VMT, solid waste disposal, etc. 5
6 Electricity figures are from 2020 and used as a proxy for 2019.
In more populated areas of California, heating for buildings is largely provided by natural gas, delivered through a network of pipelines. This service is not provided in unincorporated Mono County. Instead, wood and propane are the primary heating fuels, with small amounts of other sources, such as kerosene. Approximately 4.8 million gallons of propane were used in 2019. Propane is used in some residential (1.2 million gallons) and nonresidential buildings (3.57 million gallons). Wood is the other source of heating fuel emissions. Approximately 10,530 tons of wood were used to heat residential buildings in 2019. Table 4 summarizes the quantity of fuel used for residential and nonresidential purposes. Mono County government buildings and facilities relied mostly on propane, with limited diesel use for backup generators.
In more populated areas of California, heating for buildings is largely provided by natural gas, delivered through a network of pipelines. This ser vice is not provided in unincorporated Mono County. Instead, wood and propane are the primary heating fuels, with small amounts of other sources, such as kerosene. Approximately 4.8 million gallons of propane were used in 2019. Propane is used in some residential (1.2 million gallons) and nonresidential buildings (3.57 million gallons) . Wood is the other source of heating fuel emissions. Approximately 10,530 tons of wood were used to heat residential buildings in 2019. Table 4 summarizes the quantity of fuel used for residential and nonresidential purposes. Mono County government buildings and facilities relied mostly on propane, with limited diesel use for backup generators.
Table 5: Heating fuel source and emissions
In 2019, heating fuels contributed about 45,060 MTCO2e to the community inventory, counting both residential and nonresidential uses. Propane use accounted for the largest volume of emissions, 27,610 MTCO2e, which was 61% of heating fuel emissions. Wood burning accounted for the remaining 17,450 MTCO2e (39%). Emissions from fuels used for government operations totaled 960 MTCO2e in 2019, with 950 MTCO2e (99%) from propane use and 10 MTCO2e (1%) from diesel use.
In 2019, heating fuels contributed about 45,060 MTCO2e to the community inventory, counting both residential and nonresidential uses. Propane use accounted for the largest volume of emissions, 27,610 MTCO2e, which was 61% of heating fuel emissions. Wood burning accounted for the remaining 17,450 MTCO2e (39%). Emissions from fuels used for government operations totaled 960 MTCO2e in 2019, with 950 MTC O2e (99%) from propane use and 10 MTCO2e (1%) from diesel use.
In 2019, on-road vehicle-use in unincorporated Mono County resulted in approximately 468 million vehicle miles traveled (VMT), resulting in emissions of 268,290 MTCO2e (see Table 8). O ice of Planning and Research (OPR) guidance recommends trip-based VMT estimates be used over boundary-based VMT for estimating greenhouse gas emissions from on-road mobile sources. To determine the amount of VMT occurring outside Mono County from intercounty vehicle trips, Longitudinal Employment and Housing Dynamic (LEHD) journey-to-work data was used to estimate the weighted average trip length to each “gateway” into Mono County. (LEHD data is based on Block Groups of which there are a total of 17 of which six represent the City of Mammoth Lakes.) For a full overview of the VMT methodology please see the attached Memorandum on VMT.
In 2019, on-road vehicle-use in unincorporated Mono County resulted in approximately 468 million vehicle miles traveled (VMT), resulting in emissions of 268,290 MTCO2e (see Table 8). Office of Planning and Research (OPR) guidance recommends trip-based VMT estimates be used over boundary-based VMT for estimating gree nhouse gas emissions from on-road mobile sources. To determine the amount of VMT occurring outside Mono County from intercounty vehicle trips, Longitudinal Employment and Housing Dynamic (LEHD) journey-to-work data was used to estimate the weighted average trip length to each “gateway ” into Mono County (LEHD data is based on Block Groups of which there are a total of 17 of which six represent the City of Mammoth Lakes.) For a full over view of the VMT methodology please see the attached Memorandum on VMT
Note on VMT calculations. While the VMT totals were generated using a new methodology, the emissions from VMT followed EMFAC figures (and projections for the forecasts). EMFAC percentages of vehicle types were used to allocate miles traveled for each vehicle class. From EMFAC, emission factors for each vehicle class can also be generated. The following Table shows the vehicle classes, percentages applied, emission factors and total emissions for each class.
Note on VMT calculations. While the VMT totals were generated using a new methodology, the emissions from VMT followed EMFAC figures (and projections for the forecasts). EMFAC percentages of vehicle types were used to allocate miles traveled for each vehicle class From EMFAC, emission factors for each vehicle class can also be generated. The following Table shows the vehicle classes, percentages applied, emission factors and total emissions for each class.
Note on VMT calculations. While the VMT totals were generated using a new methodology, the emissions from VMT followed EMFAC figures (and projections for the forecasts). EMFAC percentages of vehicle types were used to allocate miles traveled for each vehicle class. From EMFAC, emission factors for each vehicle class can also be generated. The following Table shows the vehicle classes, percentages applied, emission factors and total emissions for each class.
The o -road equipment sector is made up of vehicles and machinery that consume gasoline or diesel fuels but do not travel on roads. There are nine categories of o -road equipment, consisting of agriculture, construction/mining equipment, industrial, boats, and o -road recreational vehicles, among others. In 2019, use of this equipment in the unincorporated county resulted in emissions of 10,030 MTCO2e, or 3% of community emissions. The two largest sources of o -road equipment emissions were Agriculture, which contributed 2,760 MTCO2e and pleasure craft (1,770 MTCO2e).
Vehicle use for government operations was divided into two categories: the County’s on-road vehicle fleet, and employee commute and travel using private vehicles or public transportation. In 2019, the County’s vehicle fleet (not counting fuel used for equipment) used 131,020 gallons of fuel, resulting in 1,270 MTCO2e of GHG emissions (800 MTCO2e from gasoline, 470 MTCO2e from diesel). County employee commutes and business travel accounted for 1,182 MTCO2e, while employee travel for business purposes emitted 355 MTCO2e.
The off-road equipment sector is made up of vehicles and machinery that consume gasoline or diesel fuels but do not travel on roads There are nine categories of off-road equipment, consisting of agriculture, construction/mining equipment, industrial, boats, and off-road recreational vehicles, among others In 2019, use of this equipment in the unincorporated county resulted in emissions of 10,030 MTCO2e, or 3% of community emissions. The two largest sources of off-road equipment emissions were Agriculture, which contributed 2,760 MTCO2e and pleasure craft (1,770 MTCO2e) 7
The off-road equipment sector is made up of vehicles and machinery that consume gasoline or diesel fuels but do not travel on roads. There are nine categories of off-road equipment, consisting of agriculture, construction/mining equipment, industrial, boats, and off-road recreational vehicles, among others. In 2019, use of this equipment in the unincorporated county resulted in emissions of 10,030 MTCO2e, or 3% of community emissions. The two largest sources of off-road equipment emissions were Agriculture, which contributed 2,760 MTCO2e and pleasure craft (1,770 MTCO2e). 7
7 Data source: CARB, EMFAC for o -road.
Vehicle use for government operations was divided into two categories: the County ’s on-road vehicle fleet, and employee commute and travel using private vehicles or public transportation. In 2019, the County ’s vehicle fleet (not counting fuel used for equipment) used 131,020 gallons of fuel, resulting in 1,270 MTCO2e of GHG emissions (800 MTCO2e from gasoline, 470 MTCO2e from diesel). County
Vehicle use for government operations was divided into two categories: the County ’s on-road vehicle fleet, and employee commute and travel using private vehicles or public transportation. In 2019, the County ’s vehicle fleet (not counting fuel used for equipment) used 131,020 gallons of fuel, resulting in 1,270 MTCO2e of GHG emissions (800 MTCO2e from gasoline, 470 MTCO2e from diesel). County
7 Data source: CARB, EMFAC for off-road
7 Data source: CARB, EMFAC for off-road
The County government also operates a variety of off-road equipment, including dump trucks, graders, and snowblowers. Off-road fuel totals for 2019 were extrapolated from 2010 fuel use based on County employees This process led to an imperceptible change since the employee count was virtually unchanged (from 330 employees in 2010 to 325 in 2019). Emissions for 2019 were calculated to be 810 MTCO 2e
The County government also operates a variety of o -road equipment, including dump trucks, graders, and snowblowers. Oroad fuel totals for 2019 were extrapolated from 2010 fuel use based on County employees. This process led to an imperceptible change since the employee count was virtually unchanged (from 330 employees in 2010 to 325 in 2019). Emissions for 2019 were calculated to be 810 MTCO2e.
Annual fuel use and GHG emissions from community off-road equipment use is provided at a countywide level by CARB. For agricultural equipment use and oil drilling , all equipment use is assumed to occur in unincorporated Mono County. For these reasons, the 810 MTCO2e of additional emissions is not added to the Community portion.
Annual fuel use and GHG emissions from community o -road equipment use is provided at a countywide level by CARB. For agricultural equipment use and oil drilling, all equipment use is assumed to occur in unincorporated Mono County. For these reasons, the 810 MTCO2e of additional emissions is not added to the Community portion.
The County government also operates a variety of off-road equipment, including dump trucks, graders, and snowblowers. Off-road fuel totals for 2019 were extrapolated from 2010 fuel use based on County employees. This process led to an imperceptible change since the employee count was virtually unchanged (from 330 employees in 2010 to 325 in 2019). Emissions for 2019 were calculated to be 810 MTCO 2e.
Annual fuel use and GHG emissions from community off-road equipment use is provided at a countywide level by CARB For agricultural equipment use and oil drilling , all equipment use is assumed to occur in unincorporated Mono County. For these reasons, the 810 MTCO2e of additional emissions is not added to the Community portion.
In 2019, residents, businesses, and visitors to the unincorporated areas of Mono County sent 6,900 tons of solid waste to landfills. Much of this material was sent to the Benton Crossing Landfill with smaller amounts to other facilities. To comply with state and federal standards, at the end of each operational day, landfills must cover disposed waste with tarps, soil, or other materials, known as alternative daily cover (ADC) to help reduce odor, control litter, deter insects, wildlife, or rodents, and protect public health. In 2019, 510 tons of ADC was also deposited at landfills, resulting in a total of 7,410 tons of waste placed in landfills in 2019. As waste decomposes over time in the oxygen-free environment of landfills, methane, a potent GHG, is produced. Emissions from the decomposition of landfilled materials deposited in landfills exclusively in 2019 accounted for 4,540 MTCO2e of community emissions.
In 2019, residents, businesses, and visitors to the unincorporated areas of Mono County sent 6,900 tons of solid waste to landfills. Much of this material was sent to the Benton Crossing Landfill with smaller amounts to other facilities. To comply with state and federal standards, at the end of each operational day, landfills must cover disposed waste with tarps, soil, or other materials, known as alternative daily cover (ADC) to help reduce odor, control litter, deter insects, wildlife, or rodents, and protect public health. In 2019, 510 tons of ADC was also deposited at landfills, resulting in a total of 7,410 tons of waste placed in landfills in 2019. As waste decomposes over time in the oxygen-free environment of landfills, methane, a potent GHG, is produced. Emissions from the decomposition of landfilled materials deposited in landfills exclusively in 201 9 accounted for 4,540 MTCO2e of community emissions.
In 2019, residents, businesses, and visitors to the unincorporated areas of Mono County sent 6,900 tons of solid waste to landfills. Much of this material was sent to the Benton Crossing Landfill with smaller amounts to other facilities. To comply with state and federal standards, at the end of each operational day, landfills must cover disposed waste with tarps, soil, or other materials, known as alternative daily cover (ADC) to help reduce odor, control litter, deter insects, wildlife, or rodents, and protect public health. In 2019, 510 tons of ADC was also deposited at landfills, resulting in a total of 7,410 tons of waste placed in landfills in 2019. As waste decomposes over time in the oxygen-free environment of landfills, methane, a potent GHG, is produced. Emissions from the decomposition of landfilled materials deposited in landfills exclusively in 201 9 accounted for 4,540 MTCO2e of community emissions.
Table 9: Waste disposal and emission
In 2019, refuse collected at County government facilities totaled approximately 970 tons of solid waste, based on employee estimates. The decomposition of this waste constituted 720 MTCO2e of the government operations inventory.
In addition to waste disposed in 2019, Mono County operates three active landfills: Benton Crossing, Pumice Valley, and Walker. Each landfill generates methane based on previous waste disposal. By 2019, approximately 827,000 tons of waste had been deposited at these three facilities since they were permitted in the early 1970s. The Benton Crossing Landfill is the primary disposal site for waste generated in Mono County and the Town of Mammoth Lakes, with 81% of the total deposits. About 75% of the materials deposited typically comes from the Town of Mammoth Lakes; however, the management of each landfill is the responsibility of the County, thus they are included in the County government operations inventory. The location of these landfills in unincorporated Mono County further warrants their inclusion in the community inventory as an activity. County landfills released methane equivalent to approximately 8,163 MTCO2e from decomposing materials.
The California Department of Resources Recycling and Recovery (CalRecycle) provides annual data describing the solid waste and ADC for all jurisdictions and landfills in the state. These disposal tonnage figures were converted into greenhouse gas emissions using CARB’s landfill modeling tool, which uses climate and waste composition data to calculate GHG emissions. While this method di ers from the US Community Protocol, it is considered more accurate and appropriate for use in California.
Emissions from water use is equivalent to the emissions from the electricity necessary to pump it, treat it, and distribute it. The analysis from 2019 showed that the unincorporated jurisdiction used 356 mega gallons and 652 MWh to pump, treat, and distribute it. Further, the 2019 per capita use rate was 95 gallons/person/day8, having fallen from 165 gallons/person/day in 20109 The reason for the decline was largely the decline in irrigation, according to County personnel. Regarding electricity use for water, it was assumed that there have not been significant e iciency gains in the amount of electricity required per gallon of use. Therefore, using the same kWh/gallon of use, at the reduced rate of usage, it was calculated that the jurisdiction used 652,495 kWh in water withdrawal, treatment, and distribution. These kilowatt hours were assigned the SCE emission factor of 2.06E-04 MTCO2e/kWh, listed above. Total emission for water use was 130 MTCO2e.
Wastewater treatment in the unincorporated areas of Mono County is provided by individual septic tanks or through small-scale community sewer treatment facilities. Septic tanks are used by approximately 65% of the population, while sewer treatment facilities accommodate the remaining 35%. No change from 2010 was assumed in the approximately 2,200 septic systems located in the unincorporated county, leaving approximately 1,110 sanitary sewer connections to the Bridgeport Public Utilities District (PUD), Hilton Creek Community Service District, June Lake PUD, and Lee Vining PUD.
Wastewater in a septic tank is decomposed by microorganisms, producing methane gas. In 2019, septic tanks located throughout unincorporated Mono County produced an estimated 944 MTCO2e of GHG emissions, the estimate based on the slight decline from 2010 coming from a change in e ective population. The sewer systems in the unincorporated county treat water using a trickling filter, which results in substantially lower emissions. In 2019, approximately 49 MG of unincorporated county water was treated through a sewer system, producing about 4 MTCO2e of GHG emissions. These systems require some electricity to operate, resulting in an additional 14 MTCO2e.
8 Mammoth Community Water District. 2020 Urban Water Management Plan. May 2021. P. 5.
9 County-wide 2015 data from USGS: http://waterdata.usgs.gov/ca/nwis/water_use/. Use-rates used as a proxy for unincorporated jurisdiction.
require some electricity to operate, resulting in an additional 14 MTCO2e.
Water use figures were provided by the US Geological Sur vey,10 while information on water sources was obtained from local water providers The California Energy Commission and the US Community Protocol provided data on emissions from different water sources and wastewater treatment systems. Emissions factors for electricity use were provided by eGrid
Water use figures were provided by the US Geological Survey10, while information on water sources was obtained from local water providers. The California Energy Commission and the US Community Protocol provided data on emissions from di erent water sources and wastewater treatment systems. Emissions factors for electricity use were provided by eGrid.
Water use figures were provided by the US Geological Sur vey,10 while information on water sources was obtained from local water providers. The California Energy Commission and the US Community Protocol provided data on emissions from different water sources and wastewater treatment systems. Emissions factors for electricity use were provided by eGrid.
Table 10: Water and Wastewater volumes and emissions for 2019
Table 10: Water and Wastewater volumes and emissions for 2019
Table 10: Water and Wastewater volumes and emissions for 2019
Emissions from agriculture amounted to an estimated 7,180 MTCO2e in 2019. The figure captures emissions fertilizers and livestock. Acreage data was provided by the County, and emissions calculations occurred in the model. As can be seen, there has been significant reduction in total farmed land, which resulted in a reduction in GHG for the sector.
Emissions from agriculture amounted to an estimated 7,180 MTCO2e in 2019. The figure captures emissions from fertilizers and livestock. Acreage data was provided by the County, and emissions calculations occurred in the model. As can be seen, there has been significant reduction in total farmed land, which resulted in a reduction in GHG for the sector.
Emissions from agriculture amounted to an estimated 7,180 MTCO2e in 2019. The figure captures emissions from fertilizers and livestock. Acreage data was provided by the County, and emissions calculations occurred in the model. As can be seen, there has been significant reduction in total farmed land, which resulted in a reduction in GHG for the sector.
Emissions from livestock are calculated by multiplying the population of the various breeds in the jurisdiction by the enteric fermentation emission factors for each breed. Livestock populations in the County have fallen since 2010, likely the result of a long drought in the region, which prevents the use of irrigation of rangeland (the same cause is likely behind much of the decline in per capita water use mentioned above).11
Emissions from livestock are calculated by multiplying the population of the various breeds in the jurisdiction by the enteric fermentation emission factors for each breed. Livestock populations in the County have fallen since 2010, likely the result of a long drought in the region, which prevents the use of irrigation of rangeland (the same cause is likely behind much of the decline in per capita water use
Emissions from livestock are calculated by multiplying the population of the various breeds in the jurisdiction by the enteric fermentation emission factors for each breed. Livestock populations in the County have fallen since 2010, likely the result of a long drought in the region, which prevents the use of irrigation of rangeland (the same cause is likely behind much of the decline in per capita water use
10 County-wide 2015 data from USGS: http://waterdata.usgs.gov/ca/nwis/water_use/.
11 Livestock values are approximate. According to County o icials, “Mono tends to host a significant number of cattle during the summer months. 10,000 cattle in inventory (rough estimate, as several large ranches run cattle 50% Mono 50% Inyo, and we have a few that do 40% Mono and the rest in other counties)”. Email received April 25, 2022.
10 County-wide 2015 data from USGS: http://waterdata.usgs.gov/ca/nwis/water_use/.
10 County-wide 2015 data from USGS: http://waterdata.usgs.gov/ca/nwis/water_use/.
The County provided overall livestock population figures for cattle; the sheep population was not included and was therefore considered the same as in the 2015 REP (sheep have a relatively small enteric fermentation emission factor, so a conservative approach, leaving the population unchanged, was taken). To calculate the MTCO2e totals in the final column, the population is multiplied by the emission factor to yield the CH4 per year in kilograms. The result is multiplied by the global warming potential (GWP) for methane (21) and then divided by 1000 to arrive at metric tons.
mentioned above).11 The County provided overall livestock population figures for cattle; the sheep population was not included and was therefore considered the same as in the 2015 REP (sheep have a relatively small enteric fermentation emission factor, so a conser vative approach, leaving the population unchanged, was taken). To calculate the MTCO2e totals in the final column, the population is multiplied by the emission factor to yield the CH4 per year in kilograms The result is multiplied by the global warming potential (GWP) for methane (21) and then divided by 1000 to arrive at metric tons.
*Assumes a seasonal adjustment factor of 50%.
*Assumes a seasonal adjustment factor of 50%
The following describes additional methods, metrics, and protocols used to quantify and estimate community and County government operation emissions.
The following describes additional methods, metrics, and protocols used to quantify and estimate community and County government operation emissions. Effective Annual Population
Several data items used to estimate GHG emissions from energy use and transportation occurring in Mono County are only available at the countywide level (i.e., include both unincorporated Mono County and the Town of Mammoth Lakes). While population and households are often appropriate metrics used to estimate emissions within a city or county, the heavy influence of visitors and tourism on the local economy in Mono County dictates the need for a modified approach that considers how tourism influences energy use, travel patterns, and resulting GHG emissions.
To ensure countywide emissions sources and activities are appropriately divided between the Town of Mammoth Lakes and unincorporated Mono County, e ective annual population metrics that account for both permanent residents and visitors have been identified for 2020 (see Table below). These metrics rely on 2020 US Census data for the permanent populations of the town and county, in addition to data from Mono County’s Economic Impact Visitor Profile Study (2008), the California Travel and Tourism Commission’s 2010 Annual Report on Travel Impacts by County (2011), and the Mammoth Community Water District’s Urban Water Management Plan (2011) to estimate annual visitors. This e ective annual population metric has been applied to propane use, water use, and on-road transportation to assign countywide results to the unincorporated county.
Several data items used to estimate GHG emissions from energy use and transportation occurring in Mono County are only available at the countywide level (i.e., include both unincorporated Mono County and the Town of Mammoth Lakes). While population and households are often appropriate metrics used to estimate emissions within a city or county, the heavy influence of visitors and tourism on the local economy in Mono County dictates the need for a modified approach that considers how tourism influences energy use, travel patterns, and resulting GHG emissions.
To ensure countywide emissions sources and activities are appropriately divided between the Town of Mammoth Lakes and unincorporated Mono County, effective annual population metrics that account for both permanent residents and visitors have been identified for 2020 (see Table below). These metrics rely on 2020 US Census data for the permanent populations of the town and county, in addition to data from Mono County ’s Economic Impact Visitor Profile Study (2008), the California Travel and Tourism Commission’s 2010 Annual Report on Travel Impacts by County (2011), and the Mammoth Community Water District ’s Urban Water Management Plan (2011) to estimate annual visitors. This effective annual population metric has been applied to propane use, water use, and on-road transportation to assign c ountywide results to the unincorporated county.
11 Livestock values are approximate According to County officials, “Mono tends to host a significant number of cattle during the summer months. 10,000 cattle in inventory (rough estimate, as several large ranches run cattle 50% Mono 50% Inyo, and we have a few that do 40% Mono and the rest in other counties)”. Email received April 25, 2022.
The unincorporated county e ective annual population uses countywide tourism for the e ective population for all of Mono County, then subtracts the e ective population of the Town of Mammoth Lakes. The number of average daily visitors rises from 2005 to 2020 despite the relatively stable resident population.
The unincorporated county effective annual population uses countywide tourism for the effective population for all of Mono County, then subtracts the effective population of the Town of Mammoth Lakes. The number of average daily visitors rises from 2005 to 2020 despite the relatively stable resid population.
The unincorporated county effective annual population uses countywide tourism for the effective population for all of Mono County, then subtracts the effective population of the Town of Mammoth Lakes The number of average daily visitors rises from 2005 to 2020 despite the relatively stable resident population.
These inventories were prepared using data collected by Mono County and from multiple external sources. Protocols identify the sources of emissions that should be included in an inventory and recommended methods to calculate the volume of emissions for each source. The community inventory was prepared in a manner consistent with the best practices and methods recommended by ICLEI’s US Community Protocol for Accounting and Reporting of Greenhouse Gas Emissions (2012). The US Community Protocol identifies specific sources of greenhouse gas emissions that should be included in a community inventory. Table 11 lists the required sources under the US Community Protocol and explains, when applicable, why a source has been excluded. This table does not list all sources included in the inventory, as some sources were not required for the inventory but were still included (e.g., agriculture).
These inventories were prepared using data collected by Mono County and from multiple external sources. Protocols identify the sources of emissions that should be included in an inventory and recommended methods to calculate the volume of emissions for each source The community inventory was prepared in a manner consistent with the best practices and methods recommended by ICLEI’s US Community Protocol for Accounting and Reporting of Greenhouse Gas Emissions (2012) The US Community Protocol identifies specific sources of greenhouse gas emissions that should be included in a community inventory. Table 11 lists the required sources under the US Community Protocol and explains, when applicable, why a source has been excluded. This table does not list all sources included in the inventory, as some sources were not required for the inventory but were still included (e. g., agriculture).
Table 11: Community Protocol Required Emissions Sources
These inventories were prepared using data collected by Mono County and from multiple external sources. Protocols identify the sources of emissions that should be included in an inventory and recommended methods to calculate the volume of emissions for each source. The community invent was prepared in a manner consistent with the best practices and methods recommended by ICLEI’s U Community Protocol for Accounting and Reporting of Greenhouse Gas Emissions (2012). The US Community Protocol identifies specific sources of greenhouse gas emissions that should be included community inventory. Table 11 lists the required sources under the US Community Protocol and expl when applicable, why a source has been excluded. This table does not list all sources included in the inventory, as some sources were not required for the inventory but were still included (e. g., agricultu
11: Community Protocol Required Emissions Sources
Source
Heating fuels, and other residential and commercial stationary fuel use Yes
Table 11: Community Protocol Required Emissions Sources
Use of electricity by the community
On-road passenger vehicles
Energy associated with water use
Source
Heating fuels, and other residential and commercial stationary fuel use
Energy associated with wastewater use
Use of electricity by the community
On-road passenger vehicles
Included in Community Inventory?
Yes
Reason for Exclusion
The government operations inventory was prepared in a manner consistent with the best practices and methods recommended by the CARB Local Government Operations Protocol (LGOP) (2010). LGOP identifies
Energy associated with wastewater
The government operations inventory was prepared in a manner consistent with the best practices and methods recommended by the CARB Local Government Operations Protocol (LGOP) (2010). LGOP identifies specific sources of GHG emissions that should be included in a government operations inventory. Table 12 lists the required sources under LGOP and explains, when applicable, why a source has been excluded. specific sources of GHG emissions that should be included in a government operations inventory. Table 12 lists the required sources under LGOP and explains, when applicable, why a source has been excluded.
Table 12: Emission Sources and Exclusions from County Operations
Table 12: Emission Sources and Exclusions from County Operations
Heating fuels and other stationary combustion Yes
Government electricity use
Government steam and districting heating /cooling use
On-road fleet vehicle and equipment use
Government-operated solid waste facilities
County government wastewater facilities
Refrigerant leaks from government equipment
Employee commute
Does not occur
Does not occur
Data not collected
When aggregating emissions, it is important to identify and avoid “double-counting” emissions whenever possible. Double-counting occurs when a single emissions source or activity is counted in multiple emissions categories (such as sectors) or in multiple jurisdictions. In the community inventory, double-counting is avoided, when possible, by reporting activities and sources as line items rather than as larger aggregated groups. Communities often aggregate sources and activities into sectors or other groups, due to a limited ability to disaggregate data, which can lead to double-counting.
When aggregating emissions, it is important to identify and avoid “double-counting ” emissions whenever possible. Double-counting occurs when a single emissions source or activity is counted in multiple emissions categories (such as sectors) or in multiple jurisdictions. In the community inventory, double-counting is avoided, when possible, by reporting activities and sources as line items rather than as larger aggregated groups. Communities often aggregate sources and activities into sectors or other groups, due to a limited ability to disaggregate data, which can lead to double-counting.
The County government operations inventory is intended to be a subset of the community emissions inventory, as most County government activities occur in the unincorporated county. For presentation purposes, the two inventories should not be added together. Rather, the County government operations inventory should be considered a portion of the community inventory. Therefore, the only category from Government Operations that has been added to the Community total is emissions from Landfill management.
Baseline year: Emissions are presented for the calendar year of 2019.
The County government operations inventory is intended to be a subset of the community emissions inventory, as most County government activities occur in the unincorporated county. For presentation purposes, the two inventories should not be added together. Rather, the County government operations inventory should be considered a portion of the community inventory. Therefore, the only category from Government Operations that has been added to the Community total is emissions from Landfill management.
Carbon dioxide equivalent (CO2e): The universal unit for representing the six di erent GHGs (see definition of greenhouse gas emissions) in one single unit by converting each gas into the equivalent potency of carbon dioxide. CO2e is commonly expressed in MTCO2e. A metric ton equals 2,205 pounds.
Baseline year: Emissions are presented for the calendar year of 2019
Carbon dioxide equivalent (CO₂e): The universal unit for representing the six different GHGs (see definition of greenhouse gas emissions) in one single unit by converting each gas into the equivalent potency of carbon dioxide. CO2e is commonly expressed in MTCO2e. A metric ton equals 2,205 pounds.
Greenhouse gas emissions (GHG): Gases that trap heat in the earth’s atmosphere are called greenhouse gases, or GHGs. GHGs include carbon dioxide (CO2), methane (CH4), nitrous oxide (N2O), hydrofluorocarbons (HFCs), perfluorocarbons (PFCs), and sulfur hexafluoride (SF6). While many of these gases occur naturally in the atmosphere, modern human activity has led to a steep increase in the amount of GHGs released into the atmosphere over the last 100 years. Collectively, these gases intensify the natural greenhouse e ect, thus causing global average surface temperatures to rise, which in turn a ects global climate patterns. GHGs are often quantified in terms of CO2 equivalent, or CO2e, a unit of measurement that equalizes the potency of GHGs.
Sector: Emissions are grouped by the type of activity that generates the emissions, such as on-road transportation, building energy use, solid waste, etc.
Greenhouse gas emissions (GHG): Gases that trap heat in the earth’s atmosphere are called greenhouse gases, or GHGs GHGs include carbon dioxide (CO2), methane (CH4), nitrous oxide (N2O), hydrofluorocarbons (HFCs), perfluorocarbons (PFCs), and sulfur hexafluoride (SF6). While many of these gases occur naturally in the atmosphere, modern human activity has led to a steep increase in the amount of GHGs released into the atmosphere over the last 100 years. Collectively, these gases intensify the natural greenhouse effect, thus causing global average surface temperatures to rise, which in turn affects global climate patterns. GHGs are often quantified in terms of CO₂ equivalent, or CO₂e, a unit of measurement that equalizes the potency of GHGs.
Sector: Emissions are grouped by the type of activity that generates the emissions, such as on-road transportation, building energy use, solid waste, etc
To evaluate Mono County ’s Resource Efficiency Plan (REP) forecasts of emissions have been generated in a bottom-up approach based on anticipated sector demand First, a business-as-usual (BAU) emission forecast estimates how emissions would grow over time if no action were taken at the federal, state, or local level to reduce them. A BAU forecast has been prepared for Mono County ’s government operations and community activities, assuming that 2019 energy consumption, waste disposal, and vehicle travel rates on a per person or per effective population rate remain constant. The 2019 emissions rates are combined with applicable growth indicators identified in the Growth Indicators and Forecast Methods section to determine the anticipated increase in em issions. An adjusted BAU (ABAU) forecast has also been prepared that incorporates State actions in the electricity sector, specifically the renewables portfolio mandate that electricity generation is zero carbon by 2045.
The BAU and ABAU forecasts address two years: 2035 and 2050, the 2035 forecast aligning with the Senate Bill (SB) 375 horizon. The Greenhouse Gas Emissions Forecast section identifies the anticipated growth in emissions by 2035 and 2050 based on the applicable growth indicators.
To evaluate Mono County’s Resource E iciency Plan (REP) forecasts of emissions have been generated in a bottom-up approach based on anticipated sector demand. First, a business-as-usual (BAU) emission forecast estimates how emissions would grow over time if no action were taken at the federal, state, or local level to reduce them. A BAU forecast has been prepared for Mono County’s government operations and community activities, assuming that 2019 energy consumption, waste disposal, and vehicle travel rates on a per person or per e ective population rate remain constant. The 2019 emissions rates are combined with applicable growth indicators identified in the Growth Indicators and Forecast Methods section to determine the anticipated increase in emissions. An adjusted BAU (ABAU) forecast has also been prepared that incorporates State actions in the electricity sector, specifically the renewables portfolio mandate that electricity generation is zero carbon by 2045.
The BAU and ABAU forecasts address two years: 2035 and 2050, the 2035 forecast aligning with the Senate Bill (SB) 375 horizon. The Greenhouse Gas Emissions Forecast section identifies the anticipated growth in emissions by 2035 and 2050 based on the applicable growth indicators.
Following completion of the greenhouse gas (GHG) emissions inventory and BAU/ABAU forecasts, the next step in the resource efficiency planning process is to evaluate GHG reduction target options and determine the appropriate level of emissions reductions that Mono County should strive to achieve in the Resource Efficiency Plan (REP) The Greenhouse Gas Reduction Targets section outlines considerations for setting a GHG reduction target, identifies different reduction targets the County could set for both County government and community activities, provides examples of GHG reduction targets set by similar jurisdictions, and recommends a preliminary GHG reduction target for the REP.
Following completion of the greenhouse gas (GHG) emissions inventory and BAU/ABAU forecasts, the next step in the resource e iciency planning process is to evaluate GHG reduction target options and determine the appropriate level of emissions reductions that Mono County should strive to achieve in the Resource E iciency Plan (REP). The Greenhouse Gas Reduction Targets section outlines considerations for setting a GHG reduction target, identifies di erent reduction targets the County could set for both County government and community activities, provides examples of GHG reduction targets set by similar jurisdictions, and recommends a preliminary GHG reduction target for the REP.
To forecast emissions to 2035 and 2050, a set of indicators determines the extent to which growth may occur and resulting emissions may change. The following growth indicators are essential components to estimating how the emissions in Mono County may increase over time.
To forecast emissions to 2035 and 2050, a set of indicators determines the extent to which growth may occur and resulting emissions may change. The following growth indicators are essential components to estimating how the emissions in Mono County may increase over time.
County government employee estimates were used to forecast most County government operations emissions for 2035 and 2050 (see Table 1); employee estimates were based on County population trends. Sta ing levels in 2019/2020 were 325. Based on this metric, the number of County employees is estimated to grow to 343 employees by 2035, and 360 by 2050. This results in a 10.7% net increase in the number of County employees between 2020 and 2050, which aligns with anticipated growth in the number of residents in Mono County over the same time frame.
County government employee estimates were used to forecast most County government operations emissions for 2035 and 2050 (see Table 1); employee estimates were based on County population trends Staffing levels in 2019/2020 were 325 Based on this metric, the number of County employees is estimated to grow to 343 employees by 2035, and 360 by 2050. This results in a 10.7% net increase in the number of County employees between 2020 and 2050, which aligns with anticipated growth in the number of residents in Mono County over the same time frame.
Table 13: County Government Employee Estimates
Source: Consultant Estimates
Emissions from County-operated landfills are forecast based on the amount of waste disposed at each landfill by the community (both unincorporated county areas and the Town of Mammoth Lakes). Therefore, emissions from these landfills are forecast using e ective countywide population. Landfill emissions forecasts also assume that the Benton Crossing Landfill will no longer accept additional waste after 2023. The waste sector forecasts assume that deposits that were taken by Benton Crossing would be exported, following that facility’s closure. As a result, the buildup of deposits in the County will decrease, though landfill emissions will continue.
Emissions from County-operated landfills are forecast based on the amount of waste disposed at each landfill by the community (both unincorporated county areas and the Town of Mammoth Lakes). Therefore, emissions from these landfills are forecast using effective countywide population. Landfill emissions forecasts also assume that the Benton Crossing Landfill will no longer accept additional waste afte r 2023. The waste sector forecasts assume that deposits that were taken by Benton Crossing would be exported, following that facility ’s closure. As a result, the buildup of deposits in the County will decrease, though landfill emissions will continue.
Community Growth Indicators and Methods
Community growth indicators were derived using a combination of sources, including the California Department of Finance (DOF), the US Census Bureau, the California Air Resources Board (CARB), Caltrans, and California’s Economic Development Department (EDD). Since these escalation factors are often different between agencies, the forecasts occasionally use a calculated growth indicator. Table 2 identifies growth indicators and sources used to forecast community emissions
Community growth indicators were derived using a combination of sources, including the California Department of Finance (DOF), the US Census Bureau, the California Air Resources Board (CARB), Caltrans, and California’s Economic Development Department (EDD). Since these escalation factors are often di erent between agencies, the forecasts occasionally use a calculated growth indicator. Table 2 identifies growth indicators and sources used to forecast community emissions.
Population. Resident population projections are prepared by the DOF for the state and apportioned to counties for the next 50 years based on birth rates, historic growth, and current economic trends. However, other government agencies use different growth rates in their analysis. For this forecast, a calculated growth rate, that is based on effective population historical growth and projected growth, was used. Historic growth rates show that since incorporation of the Town of Mammoth Lakes in 1984 through 2010, the town population increased at a rate more than 4 times that of the unincorporated county. Between 2010 and 2020, the total County population decreased at by 4%. Also, between 2010 and 2020, the unincorporated county population decreased by 6%. The California Department of Finance projects total County population to rise slightly between 2020 and 2032, before beginning a gradual decline The 2020 Mono County Water Plan adopts a constant growth rate of 0 23%, and calculations of effective population in the county yield a growth rate of 0 47%; it was this growth rate that was applied annually for projection purposes
Population. Resident population projections are prepared by the DOF for the state and apportioned to counties for the next 50 years based on birth rates, historic growth, and current economic trends. However, other government agencies use di erent growth rates in their analysis. For this forecast, a calculated growth rate, that is based on e ective population historical growth and projected growth, was used. Historic growth rates show that since incorporation of the Town of Mammoth Lakes in 1984 through 2010, the town population increased at a rate more than 4 times that of the unincorporated county. Between 2010 and 2020, the total County population decreased by 4%. Also, between 2010 and 2020, the unincorporated county population decreased by 6%. The California Department of Finance projects total County population to rise slightly between 2020 and 2032, before beginning a gradual decline. The 2020 Mono County Water Plan adopts a constant growth rate of 0.23%, and calculations of e ective population in the county yield a growth rate of 0.47%; it was this growth rate that was applied annually for projection purposes.
Annual e ective population estimates combine permanent resident population figures with a modest 0.4% increase in visitors per year to unincorporated Mono County, based on EDD projections describing average annual employment growth in the Leisure and Hospitality industry, and the proportion of Leisure and Hospitality jobs anticipated in the unincorporated county.
Households. The growth in the number of occupied households aligns with the anticipated growth in resident population, assuming that the average number of people per household based on 2020 Census data remains constant through the forecast period.
Annual effective population estimates combine permanent resident populati on figures with a modest 0.4% increase in visitors per year to unincorporated Mono County, based on EDD projections describing average annual employment growth in the Leisure and Hospitality industry, and the proportion of Leisure and Hospitality jobs anticipated in the unincorporated county
Households. The growth in the number of occupied households aligns with the anticipated growth in resident population, assuming that the average number of people per household based on 2020 Census data remains constant through the forecast period.
Transportation. Countywide growth estimates for vehicle miles traveled (VMT) were developed by DKS for the County. EMFAC projections then provided the percentage breakdowns of different types of on-road vehicles, and a baseline adoption rate for Electric Vehicles. This rate was considered too low given the new Executive Order that all new cars and passenger trucks sold in California be zero-emission vehicles by 2035.12 Therefore, the forecast assumes that the rate of EV adoption leads to a 3% annual emission savings in the on-road transportation sector.13
Transportation. Countywide growth estimates for vehicle miles traveled (VMT) were developed by DKS for the County. EMFAC projections then provided the percentage breakdowns of di erent types of on-road vehicles, and a baseline adoption rate for Electric Vehicles. This rate was considered too low given the new Executive Order that all new cars and passenger trucks sold in California be zero-emission vehicles by 203512 . Therefore, the forecast assumes that the rate of EV adoption leads to a 3% annual emission savings in the on-road transportation sector13.
Agriculture. Changes in population, employment, or other indicators that can be accurately forecast do not necessarily result in proportional changes in local agricultural activity. Due to the di iculties in predicting the nature of agricultural operations in the unincorporated areas of Mono County, activity in this sector is presumed to remain constant through 2020 and 2035. The resident population, e ective population, households, and job forecast indicators are applied to the baseline community GHG emissions inventory to determine the emissions growth by applying the growth rates of each indicator to the sectors identified in Table 3.
Agriculture Changes in population, employment, or other indicators that can be accurately forecast do not necessarily result in proportional changes in local agricultural activity Due to the difficulties in predicting the nature of agricultural operations in the unincorporated areas of Mono County, activity in this sector is presumed to remain constant through 2020 and 2035. The resident population, effective population, households, and job forecast indicators are applied to the baseline community GHG emissions inventory to determine the emissions growth by applying the growth rates of each indicator to the sectors identified in Table 3.
Table 15: Growth Indicators by Community Sector
Sector
Residential energy use
Nonresidential energy use
On-road passenger vehicles
Off-road activities
Solid waste
Water and Wastewater
Agriculture
Landfill and County Operations
Indicator/Method
Households
Population
Full trip length/Intercounty trips
EMFAC projection
Methane emission tool (CARB)
No forecasted change
No forecasted change
Population
An emission forecast estimates how emissions would grow over time if no actions were taken at the federal, state, or local level to reduce them. Emissions forecasts have been prepared for both Mono County’s government operations and unincorporated community activities, assuming that energy consumption, waste disposal, and energy e iciency rates remain constant using the forecast indicators described above.
An emission forecast estimates how emissions would grow over time if no actions were taken at the federal, state, or local level to reduce them. Emissions forecasts have been prepared for both Mono County ’s government operations and unincorporated community activities, assuming that energy consumption, waste disposal, and energy efficiency rates remain constant using the forecast indicators described above.
The County government operations emissions forecast estimates how emissions would grow if County government resource consumption rates remained constant at baseline levels, but the number of
The County government operations emissions forecast estimates how emissions would grow if County government resource consumption rates remained constant at baseline levels, but the number of employees and buildings increases to provide services and improved amenities to Mono County’s growing number of visitors and residents.
12 Office of Governor, Gavin Newsom 2021 Governor Newsom Announces California Will Phase Out Gasoline-Powered Cars & Drastically Reduce Demand for Fossil Fuel in California’s Fight Against Climate Change.
As shown in Table 12 and Figure 4, emissions from County operations grew from 2010 to 2019 by 11%. However, they are expected to decrease by 13% from 2020 to 2035, and then again by 24% by 2050. The largest emissions decrease comes in the area of employee travel as the expectation is that uptake of electric vehicles from the aforementioned Executive Order leads to a 3% year on year emissions reduction from that activity. Emissions from landfills also decrease significantly due to closure of Benton Crossing. All other government operations sectors are anticipated to fall, but less rapidly.
https://www gov ca gov/2020/09/23/governor-newsom-announces-california-will-phase-out-gasoline-powered-car s-drastically-reduce-demand-for-fossil-fuel-in-californias-fight-against-climate-change/.
13 ICLEI High Impact Action Vehicle Electrification webinar, slide 25 (Aug. 24, 2021). The Webinar offers a range of possible EV adoption rates, from 3% to 9%. An emission savings of 3% year over year, was adopted as a conservative approach based on current market trends.
12 O ice of Governor, Gavin Newsom. 2021. Governor Newsom Announces California Will Phase Out Gasoline-Powered Cars & Drastically Reduce Demand for Fossil Fuel in California’s Fight Against Climate Change. https://www.gov.ca.gov/2020/09/23/governor-newsom-announces-california-will-phase-out-gasoline-powered-cars-drastically-reduce-demand-forfossil-fuel-in-californias-fight-against-climate-change/.
13 ICLEI High Impact Action Vehicle Electrification webinar, slide 25 (Aug. 24, 2021). The Webinar o ers a range of possible EV adoption rates, from 3% to 9%. An emission savings of 3% year over year, was adopted as a conservative approach based on current market trends.
reduction from that activity Emissions from landfills also decrease significantly due to closure of Benton Crossing. All other government operations sectors are anticipated to fall, but less rapidly.
The solid waste sector includes methane generation from landfills operated by the County, including the Benton Crossing Landfill, which is expected to close in 2023. The life cycle of a landfill has a methane generation profile similar to that of a bell curve in that it typically peaks within a year or two after a landfill closes and then gradually declines over time As a result, annual emissions in Mono County ’s solid waste sector increase during the next five years, but then experience a decline following 2028.14
The solid waste sector includes methane generation from landfills operated by the County, including the Benton Crossing Landfill, which is expected to close in 2023. The life cycle of a landfill has a methane generation profile similar to that of a bell curve in that it typically peaks within a year or two after a landfill closes and then gradually declines over time. As a result, annual emissions in Mono County’s solid waste sector increase during the next five years, but then experience a decline following 2028.14
14 For the forecast, the modeling was accomplished using two models. The first was EPA’s LandGem, which allows for easier forecasting function than the CARB Landfill Gas model However, LandGem output is significantly lower than the CARB model, due to different base conditions To “true-up” the forecast to historical values, a delta was added to match the CARB output.
14 For the forecast, the modeling was accomplished using two models. The first was EPA’s LandGem, which allows for easier forecasting function than the CARB Landfill Gas model. However, LandGem output is significantly lower than the CARB model, due to di erent base conditions. To “true-up” the forecast to historical values, a delta was added to match the CARB output.
Figure 4: County Operations GHG Emissions by Category (2035 and 2050 are Forecasts)
Figure 4: County Operations GHG Emissions by Category (2035 and 2050 are Forecasts)
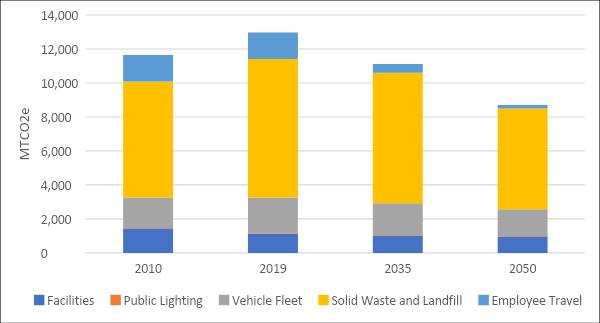
Community Emissions Forecast
The community emissions BAU forecast estimates how emissions would grow in the absence of renewable portfolio standards (RPS) or any County actions from the REP. Each sector ’s estimated change in emissions is identified in Table 17. Community-wide emissions are anticipated to decrease by 7% from 2020 levels by 2035 and by approximately 13% from 2010 levels by 2035 (see Figure 2). However, once State RPS have been applied, emissions levels fall more rapidly, as can be seen in Table 18 and Figure 6.
The community emissions BAU forecast estimates how emissions would grow in the absence of renewable portfolio standards (RPS) or any County actions from the REP. Each sector’s estimated change in emissions is identified in Table 17. Community-wide emissions are anticipated to decrease by 7% from 2020 levels by 2035 and by approximately 13% from 2010 levels by 2035 (see Figure 2). However, once State RPS have been applied, emissions levels fall more rapidly, as can be seen in Table 18 and Figure 6.
The community emissions BAU forecast estimates how emissions would grow in the absence of renewable portfolio standards (RPS) or any County actions from the REP. Each sector ’s estimated change in emissions is identified in Table 17. Community-wide emissions are anticipated to decrease by 7% from 2020 levels by 2035 and by approximately 13% from 2010 levels by 2035 (see Figure 2). However, once State RPS have been applied, emissions levels fall more rapidly, as can be seen in Table 18 and Figure 6.
Table 17: BAU Community emission forecast (MTCO2e/year)
The community emissions BAU forecast estimates how renewable portfolio standards (RPS) or any County ac in emissions is identified in Table 17. Community-wide 2020 levels by 2035 and by approximately 13% from 2 State RPS have been applied, emissions levels fall mor
Table 17: BAU Community emission forecast (MTCO2e/year)
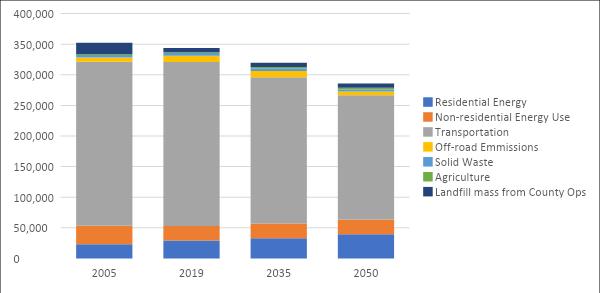
18: ABAU Emission forecasts including State RPS
15 The increase in emissions from water and wastewater in 2050 comes mostly from projected growth in septic systems
Figure 6: Components and Trend of Total Emissions, including State RPS (Adjusted BAU)
Figure 6: Components and Trend of Total Emissions, including State RPS (Adjusted BAU)
Figure 6: Components and Trend of Total Emissions, including State RPS (Adjusted BAU)
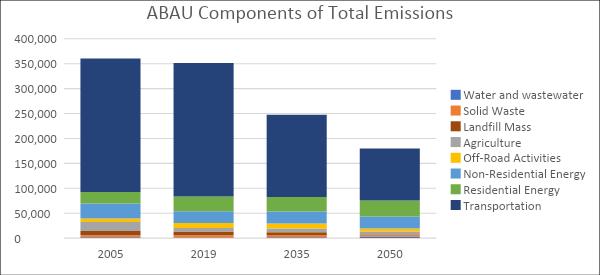
Many jurisdictions throughout California have considered reducing their community ’s GHG emissions by preparing a climate action plan, GHG reduction strategy, or resource efficiency plan. The preparation of these plans is typically motivated by the community ’s desire to develop comprehensive sustainability strategies and/or in response to AB 32, Executive Order S-3-05, SB 375 (see Figure 3), Attorney General comment letters on general plans, California Environmental Quality Act (CEQA) Guidelines, or air district guidance. This memo describes Mono County ’s authority as a CEQA lead agency to identify cumulative emissions thresholds supported by substantial evidence and guidance for assessing GHG impacts in a manner consistent with State CEQA Guid elines Section 15183.5(b).
Many jurisdictions throughout California have considered reducing their community ’s GHG emissions by preparing a climate action plan, GHG reduction strategy, or resource efficiency plan The preparation of these plans is typically motivated by the community ’s desire to develop comprehensive sustainability strategies and/or in response to AB 32, Executive Order S-3-05, SB 375 (see Figure 3), Attorney General comment letters on general plans, California Environmental Quality Act (CEQA) Guidelines, or air district guidance This memo describes Mono County ’s authority as a CEQA lead agency to identify cumulative emissions thresholds supported by substantial evidence and guidance for assessing GHG impacts in a manner consistent with State CEQA Guid elines Section 15183 5(b)
Many jurisdictions throughout California have considered reducing their community’s GHG emissions by preparing a climate action plan, GHG reduction strategy, or resource e iciency plan. The preparation of these plans is typically motivated by the community’s desire to develop comprehensive sustainability strategies and/or in response to AB 32, Executive Order S-3-05, SB 375 (see Figure 3), Attorney General comment letters on general plans, California Environmental Quality Act (CEQA) Guidelines, or air district guidance. This memo describes Mono County’s authority as a CEQA lead agency to identify cumulative emissions thresholds supported by substantial evidence and guidance for assessing GHG impacts in a manner consistent with State CEQA Guidelines Section 15183.5(b).
7: GHG Reduction Targets Legislative Context
7: GHG Reduction Targets Legislative Context
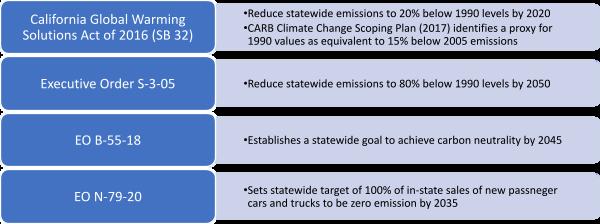
The County ’s approach to addressing GHG reductions within the Resource Efficiency Plan follows a process similar to many other California jurisdictions that includes:
The County ’s approach to addressing GHG reductions within the Resource Efficiency Plan follows a process similar to many other California jurisdictions that includes:
● Completing a baseline GHG emissions inventory and projecting future emission.
● Completing a baseline GHG emissions inventory and projecting future emission.
The County’s approach to addressing GHG reductions within the Resource E iciency Plan follows a process similar to many other California jurisdictions that includes:
• Completing a baseline GHG emissions inventory and projecting future emission.
• Identifying a community-wide GHG reduction target.
● Identifying a community-wide GHG reduction target.
• Preparing a GHG reduction strategy with policies to meet the reduction target.
● Preparing a GHG reduction strategy with policies to meet the reduction target.
● Integrating targets and resource efficiency policies into the General Plan
• Integrating targets and resource e iciency policies into the General Plan.
● Implementing policies and monitoring effectiveness.
• Implementing policies and monitoring e ectiveness.
Figure 8 o ers a projection based on this Resource E iciency Plan. First, the graphic shows a 2019 baseline, that allows for a comparison with current emissions. Second, it depicts an adjusted baseline that incorporates State mandates of renewable portfolio standards (and EV adoption rates of 3%). Third, it traces the County’s adopted targets of decreasing emissions, beginning with an emission level of 20% below 1990 by 2020, 40% below 1990 by 2030, and 80% by 205016. Finally, the figure illustrates the downward trend of County emissions after the implementation of this Resource E iciency Plan, on top of State actions. To reach these goals will require significant compliance with state pans of RPS and EV adoption.
Figure 8 offers a projection based on this Resource Efficiency Plan. First, the graphic shows a 2019 baseline, that allows for a comparison with current emissions Second, it depicts an adjusted baseline that incorporates State mandates of renewable portfolio standards (and EV adoption rates of 3%). Third, it traces the County ’s adopted targets of decreasing emissions, beginning with an emission level of 20% below 1990 by 2020, 40% below 1990 by 2030, and 80% by 2050. 16 Finally, the figure illustrates the downward trend of County emissions after the implementation of this Resource Efficiency Plan, on top of State actions To reach these goals will require significant compliance with state pans of RPS and EV adoption.
Figure 8: Projections of Community and County Ops Emissions, After Implementation of State and County Strategies, Compared to Baseline, ABAU, and Target
Figure 8: Projections of Community and County Ops Emissions, After Implementation of State and County Strategies, Compared to Baseline, ABAU, and Target
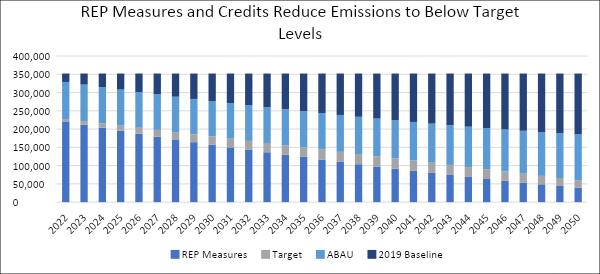
50,000 100,000 150,000 200,000 250,000 300,000 350,000 400,000
16 Due to data constraints for the year 1990, a proxy value of 15% below 2005 was substituted for 1990 emissions.
16 Due to data constraints for the year 1990, a proxy value of 15% below 2005 was substituted for 1990 emissions
Boswell, Greve, and Seale. 2012. Local Climate Action Planning. https://link.springer.com/book/10.5822/978-1-61091-201-3.
CalRecycle (California Department of Resources Recycling and Recovery). Disposal Reporting System. http://www.calrecycle. ca.gov/lgcentral/drs/
CARB (California Air Resources Board). 2004. Livestock Population Methodology (Cattle). https://ww3.arb.ca.gov/ei/areasrc/ fullpdf/full7-6.pdf.
———. 2021. EMFAC O Road Emissions. 2021, Version 2.0.1.2. https://arb.ca.gov/emfac/emissions-inventory.
———. 2021. EMFAC On Road Emissions. 2021, Version 1.0.1. https://arb.ca.gov/emfac/emissions-inventory.
———. 2021. EMFAC 2021 Volume III Technical Document. Version 1.0.1.
———.2017 Scoping Plan. Sacramento. https://ww2.arb.ca.gov/our-work/programs/ab-32-climate-change-scoping-plan/2017scoping-plan-documents.
———. 2019. Local Government Operations Protocol for the quantification and reporting of greenhouse gas emissions inventories, version 1.1.
———. 2022. ARB Landfill Emissions Tool. 2022, Version 1.3. https://ww2.arb.ca.gov/local-government-operations-protocolgreenhouse-gas-assessments
———. 2011. Documentation of California’s Greenhouse Gas Inventory: Agriculture, Forestry, and Other Land Use: Nitrogen applied in fertilizer – Synthetic fertilizers: Nitrous oxide (N2O). http://www.arb.ca.gov/cc/inventory/archive/doc90/docs3/3c4_ fertilizernitrogen_syntheticfertilizers_n2o_1990.htm.
———. 2020. Livestock Population Methodology (non-Cattle). https://ww3.arb.ca.gov/ei/areasrc/fullpdf/full7-6_noncattle.pdf.
Other Land Use: Nitrogen applied in fertilizer – Synthetic fertilizers: Nitrous oxide (N2O). http://www.arb.ca.gov/cc/inventory/ archive/doc90/docs3/3c4_fertilizernitrogen_syntheticfertilizers_n2o_1990.htm.
———. 2022. EMFAC2022. http://www.arb.ca.gov/msei/modeling.htm#emfac2022_web_based_data.
CEC (California Energy Commission). 2006. Refining Estimates of Water-Related Energy Use in California. http://www.energy. ca.gov/2006publications/CEC-500-2006-118/CEC-500-2006-118.PDF.
CTTC (California Travel and Tourism Commission). 2021. Economic Impact of Travel in California 2011-2020. https://industry. visitcalifornia.com/research/economic-impact?sort=county®ion=Mono.
DOF (California Department of Finance). 2021. E-4 Population Estimates for Cities, Counties, and the State, 2020 Census Counts. http://www.dof.ca.gov/research/demographic/reports/estimates/e-4/2001-10/.
———. 2013. Report P-1: Summary Population Projections by Race/Ethnicity and by Major Age Groups. http://www.dof.ca.gov/ research/demographic/reports/projections/p-1/
———. 2013. Table HC.1.11: Fuels Used and End Uses in Homes in West Region, Divisions, and States, 2009. http://www.eia.gov/ consumption/residential/data/2009/xls/HC1.11%20Fuels%20Used%20and%20End%20Uses%20in%20West%20Region.xls.
———. n.d. Table HC15.4: Space Heating Characteristics by Four Most Populated States, 2005.
http://www.eia.gov/consumption/residential/data/2005/hc/hc4spaceheating/excel/tablehc15.4.xls.
Energy Information Administration. 2022. Use of Energy Explained; Energy Use in Homes. https://www.eia.gov/energyexplained/ use-of-energy/homes.php.
Environmental Protection Agency (EPA). 2022. LandGEM Landfill model. https://www.epa.gov/air-emissions-factors-andquantification/emissions-estimation-tools.
Environmental Protection Agency (EPA). 2005. Landfill Gas Emissions Model (LandGEM) Users Guide. https://www3.epa.gov/ ttncatc1/dir1/landgem-v302-guide.pdf.
ICF International. 2016. 2016 Propane Market Outlook: Assessment of Key Market Trends, Threats, and Opportunities Facing the Propane Industry Through 2025. https://afdc.energy.gov/files/u/publication/2016_propane_market_outlook.pdf.
ICLEI (ICLEI-Local Governments for Sustainability). 2012. US Community Protocol for Accounting and Reporting of Greenhouse Gas Emissions, version 1.0.
———. Climate and Air Pollution Planning Assistant (CAPPA), version 1.5.
———. 2021. ICLEI High Impact Action Vehicle Electrification webinar, slide 25 (Aug. 24, 2021)
Mammoth Community Water District. 2020 Urban Water Management Plan. May 2021. P.5.
Mono County. 2009. The Economic and Fiscal Impacts and Visitor Profile of Mono County Tourism in 2008. https://www.monocounty.ca.gov/sites/default/files/fileattachments/economic_development/page/31221/ monocoeconomicimpactvisitorprofilestudy.pdf.
Mono County Local Agency Formation Commission. 2009. Municipal Service Review and Sphere of Influence Recommendation: Mammoth Community Water District. Mono County, CA. http://www.monocounty.ca.gov/sites/default/files/fileattachments/local_ agency_formation_commission_lafco/page/1058/hiltoncreekcommunityservicesdistrict_02.2009.pdf.
O ice of Governor, Gavin Newsome. 2021. Governor Newsom Announces California Will Phase Out Gasoline-Powered Cars & Drastically Reduce Demand for Fossil Fuel in California’s Fight Against Climate Change.
https://www.gov.ca.gov/2020/09/23/governor-newsom-announces-california-will-phase-out-gasoline-powered-cars-drasticallyreduce-demand-for-fossil-fuel-in-californias-fight-against-climate-change/.
SCE (Southern California Edison). 2020. Summary of Results (January 1, 2020–December 31, 2020), Unincorporated Mono County. US Census Bureau. 2020. American Community Survey 5-Year Estimates, House Heating Fuel.
USGS: http://waterdata.usgs.gov/ca/nwis/water_use/


A. GENERAL PROJECT INFORMATION:
Date:
Project name: Case No:
Project address, block, and lot:
Compliance Checklist Prepared By:
Brief Project Description:
Date:
B. COMPLIANCE CHECKLIST TABLE:
Instructions: Complete the following table by determining project compliance with the identified adopted regulations and providing project-level details in the “Remarks” column Projects that do not comply with a policy or regulation may be determined to be inconsistent with Mono County’s Resource Efficiency Plan. (See next page)
Table 1 Regulations Applicable to County/Public Projects1
Regulation or Policy Requirements
Energy Efficient Measures and Practices
Action CO 1 C i c
Conservation and Open Space Element Action
16.c.1.c.
Action CO 1 C i e
Conservation and Open Space Element Action
16 c 1 e
Action CO.1.C.i.f.
Conservation and Open Space Element Action
16.c.1.f.
Action CO 1 C ii b
Conservation and Open Space Element Action
16 C 2 b
Action CO 1 C ii c
Replace appliances and equipment in County-owned and leased buildings with energy-efficient models
Reduce energy demand in County-owned buildings by capturing “daylighting” opportunities.
Collaborate with owners of leased buildings to audit and benchmark energy use, retrofit for efficiency, and develop a preferred leasing agreement that incorporates energy-efficient practices
Ensure that HVAC and lighting systems in County-owned and -leased buildings are operating as designed and installed
Continue to use energy management software to
Mono County Resource Efficiency Plan
County General Plan
Mono County Resource Efficiency Plan
County General Plan
Mono County Resource Efficiency Plan
County General Plan
Project Complies
Not Applicable
Project Does Not Comply
Project Complies
Not Applicable
Project Does Not Comply
Project Complies
Not Applicable
Project Does Not Comply
Mono County Resource Efficiency Plan
County General Plan
Mono County Resource Efficiency Plan
Project Complies
Not Applicable
Project Does Not Comply
Project Complies
Not Applicable
Remarks
Regulation or Policy Requirements
Conservation and Open Space Element Action
16.C.2.c.
Action CO 1 C ii d
Conservation and Open Space Element Action
16 C 2 d
Action CO 1 C ii e
Conservation and Open Space Element Action
16 C 2 e
monitor real-time energy use in County-owned and -leased buildings to identify energy usage patterns and abnormalities.
Install motion sensors, photocells, and multi-level switches to control room lighting systems in County-owned and -leased buildings.
Encourage utility providers to install smart meters on County-owned buildings
Water Conservation Practices
Action CO 6 A i c
General Plan
Conservation and Open Space Element Action
3 C 1 c
Action CO.6.A.i.f.
Conservation and Open Space
Encourage new residential and commercial construction and new County facilities to exceed CALGreen water conservation requirements
Ensure applicable projects comply with the Water Efficient Landscape Ordinance
County General Plan
Project Does Not Comply
Mono County Resource
fficiency Plan
County General Plan
Mono County Resource Efficiency Plan
County General Plan
Project Complies
Not Applicable
Project Does Not Comply
Project Complies
Not Applicable
Project Does Not Comply
Mono County Resource
fficiency Plan
County General Plan
Mono County Resource Efficiency Plan
County General Plan
Project Complies
Not Applicable
Project Does Not Comply
Project Complies
Not Applicable
Project Does Not Comply
Regulation or Policy Requirements
Element Action
3 C 3 a
Green Building Practices
Conservation and Open Space Element Action
17.A.2.a.
Action CO 2 A ii b
Conservation and
Open Space Element Action
17 A 2 b
Building Efficiency Standards – Title 24, Part 1 and 6
Cal Green Building Standards Code –Title 24, Part 11
Renewable Energy
Consider certification by a third-party rater to ensure all new County facilities and renovations of existing facilities comply with green building standards.
Target meeting net-zero energy requirements or exceeding minimum Title 24 requirements for new County buildings and renovation of existing facilities
Complies with energy efficiency standards for residential, multifamily, and nonresidential buildings
Non-residential buildings comply with Chapter 5 –Nonresidential mandatory measures
County General Plan
Project Complies
Not Applicable
Project Does Not Comply
Mono County Resource Efficiency Plan
County General Plan
California Energy Commission
California Building Standards Commission
Project Complies
Not Applicable
Project Does Not Comply
Action CO 4 A i a Pursue installation of solar photovoltaic systems,
Mono County Resource Efficiency Plan
Project Complies
Not Applicable
Project Does Not Comply
Project Complies
Not Applicable
Project Does Not Comply
Project Complies
Regulation or Policy Requirements
Conservation and Open Space
Element Action
11 A 1 a power purchase agreements, or solar collective programs to meet all or part of the electrical energy requirements of County-owned or -leased buildings
Transportation
Action C 1 A i b
Regional Transportation Plan
Objective 4 A 2
Action C 1 A ii d
Regional Transportation Plan
Objective 4.B.4.
Provide bicycle access to transit services along transit corridors and other routes that may attract bicyclists, such as routes providing access to visitor-serving locations
When alternative-fuel infrastructure (such as electric vehicle charging stations) is installed for County government use, ensure public access and use is considered in the design and operation of such facilities
Action C.1.A.iii.c.
Regional Transportation Plan
Objective 4 C 4
Construct bicycle stations for employees that include bicycle storage, showers, and bicycle repair space
Mono County Resource Efficiency Plan
Not Applicable
Project Does Not Comply
Regional Transportation Plan ☐ Project Complies
Not Applicable
Project Does Not Comply
Mono County Resource Efficiency Plan
Regional Transportation Plan ☐ Project Complies
Not Applicable
Project Does Not Comply
Mono County Resource Efficiency Plan
Regional Transportation Plan
Regulation or Policy Requirements Source
Action C.1.A.iii.d.
Regional Transportation Plan
Objective 4 C 5
Action C.1.A.iv.b.
Regional Transportation Plan
Objective 4 D 2
Action C 1 A iv d
Regional Transportation Plan
Objective 4 D 5
Consolidate offices that community members often visit at the same time (such as building permitting and environmental health permitting)
Consider installation of electric vehicle charging stations at public facilities, such as at parking lots and airports, for community use
Encourage new commercial- and visitor-serving projects to include electric vehicle charging stations in parking areas.
Mono County Resource Efficiency Plan
Regional Transportation Plan
Mono County Resource Efficiency Plan
Regional Transportation Plan
Mono County Resource Efficiency Plan
Regional Transportation Plan
Project Complies
Not Applicable
Project Does Not Comply
Project Complies
Not Applicable
Project Does Not Comply
Project Complies
Not Applicable
Project Does Not Comply
Notes:
1 This table reflects General Plan policies, regulations, and standards applicable to greenhouse gas reduction at the time of the 2022 Resource Efficiency Plan Update This greenhouse gas checklist may be updated by the County in the future to reflect changes in ordinances, policies, or regulations that would reduce greenhouse gas emissions.
A. GENERAL PROJECT INFORMATION:
Date:
Project name: Case No:
Project address, block, and lot:
Compliance Checklist Prepared By:
Brief Project Description:
Date:
B. COMPLIANCE CHECKLIST TABLE:
Instructions: Complete the following table by determining project compliance with the identified adopted regulations and providing project-level details in the “Remarks” column. Projects that do not comply with a policy or regulation may be determined to be inconsistent with Mono County’s Resource Efficiency Plan, although compliance with most regulations is not optional (See next page)
Table 1 Regulations Applicable to Private Development Projects1
Regulation or Policy Requirements Source
Energy Efficient Measures and Practices
Action CO 1 B ii a
Conservation and Open Space Element Action
16 B 2 a
Action CO.1.B.ii.b.
Conservation and Open Space Element Action
16.B.2.b.
Action CO 1 B ii c
Conservation and Open Space Element Action
16 B 2 c
Promote installation of variable frequency drive water pumps to serve existing residential buildings
Encourage voluntary upgrades of residential and nonresidential HVAC systems
Encourage energy audits and voluntary retrofits for residential and nonresidential buildings at the time of sale or major renovation (>50% of building square footage, or addition of >500 square feet)
Water Conservation Practices
Policy CO.6.A.i.
Conservation and Open Space Element Action
3 C 1 b
Encourage reduced water consumption in residential and nonresidential properties
Mono County Resource E
ciency Plan
County General Plan ☐ Project Complies
Not Applicable
Project Does Not Comply
Mono County Resource Efficiency Plan
County General Plan ☐ Project Complies
Not Applicable
Project Does Not Comply
Mono County Resource
Efficiency Plan
County General Plan
☐ Project Complies
Not Applicable
Project Does Not Comply
Mono County Resource Efficiency Plan
County General Plan ☐ Project Complies
Not Applicable
Project Does Not Comply
Remarks
Regulation or Policy Requirements
Action CO.6.A.i.c.
General Plan
Conservation and Open Space Element Action
3 C 1 c
Action CO 6 A i f
Conservation and Open Space Element Action
3 C 3 a
Action CO 6 A ii a
Conservation and Open Space Element Action
Encourage new residential and commercial construction and new County facilities to exceed CALGreen water conservation requirements.
Mono County Resource
fficiency Plan
County General Plan
Does Not Comply
ciency Plan
County General Plan
Ensure applicable projects comply with the Water Efficient Landscape Ordinance Mono County Resource
4 A 8 a Promote low-impact development solutions (see General Plan Appendix B) for stormwater management on private property, such as rain gardens, green roofs, and detention ponds
Transportation
Action C.1.A.i.f.
Regional Transportation Plan
Objective 4 A 6
Encourage the installation of bicycle rack, showers, and/or other amenities as part of new commercial development projects to promote bicycle use by employees and residents.
Mono County Resource
ciency Plan
County General Plan
Mono County Resource Efficiency Plan
Mono County Regional Transportation Plan
Project Does Not Comply
Project Does Not Comply
Project Complies
Not Applicable
Project Does Not Comply
Regulation or Policy Requirements Source
Regional Transportation Plan
Objective 4 D 5
Wood Burning
Great Basin Unified Air Pollution Control District Rule 431
And General Plan Land Use Elementa Action 6.C.1.a.
Encourage new commercial and visitor-serving projects to include electric vehicle charging stations in parking areas
Wood burning fireplaces and other wood burning appliances are certified by the US Environmental Protection Agency Wood burning fireplaces not certified by USEPA are prohibited from being installed in Alpine, Mono and Inyo Counties after January 1, 2007
Require all woodstoves installed in the area to be certified EPA Phase II, in conformance to policies in the Conservation/Open Space Element.
Mono County Regional Transportation Plan
Project Complies
Not Applicable
Project Does Not Comply
Rule 430 Particulate Emissions Adopted 12/04/06
County General Plan adopted 2015
Project Complies
Not Applicable
Project Does Not Comply
Building Standards
Building Efficiency Standards – Title 24, Part 1 and 6
Complies with energy efficiency standards for
California Energy Commission
Project Complies
Not Applicable
Regulation or Policy Requirements
residential, multifamily, and nonresidential buildings
Cal Green Building Standards Code –
Title 24, Part 11
Residential buildings comply with Chapter 4 –Residential Mandatory Measures Non-residential buildings comply with Chapter 5 – Nonresidential mandatory measures California Building Standards Commission
Does Not Comply
Notes:
1 This table reflects General Plan policies, regulations, and standards applicable to greenhouse gas reduction at the time of the 2022 Resource Efficiency Plan Update This greenhouse gas checklist may be updated by the County in the future to reflect changes in ordinances, policies, or regulations that would reduce greenhouse gas emissions.