CLIMATE ACTION AND ADAPTATION PLAN


ACKNOWLEDGEMENTS
SUBCOMMITTEE:
Kim Bowman
Councilmember (2022-2024)
Terry Walker
Councilmember (2023-2024)
Rick Gunter
Councilmember (2022-2023)
Emily Stadnick
City of La Cañada Flintridge
Kenny Roberts
City of La Cañada Flintridge
Barbara Boliver La Cañada Unified School District
Diana Chen Jet Propulsion Laboratory
LETTER FROM THE MAYOR
It is my honor to present the La Cañada Flintridge Climate Action and Adaptation Plan (CAAP). This plan was built with contributions from the community and serves as a roadmap for our City operations and community to reduce greenhouse gas (GHG) emissions and build resilience to the impacts of climate change. As Mayor, I am committed to protecting our community. I recognize that climate change poses a real and urgent threat to our public health, safety, local economy, natural environment and overall quality of life which is why we must build upon the actions we have already taken to address climate change.
La Cañada Flintridge has made some progress in addressing climate change and promoting sustainability. But we need to do more. In this CAAP, we have identified the Top 10 Biggest Bang for your Buck strategies that, if accomplished, will lead us to a 50% GHG reduction by 2030 and carbon neutrality by no later than 2045. We need to stay focused on these strategies and regularly report progress to the City Council to ensure we stay on track.
Throughout the planning process of the CAAP, we actively engaged with members of the community from various sectors, seeking their expertise and incorporating their valuable input into our strategies. The La Cañada Flintridge community has come together to shape its vision for the future. While the City government can take the lead on certain initiatives, the success of many endeavors relies on the actions taken by individual residents. It is only through the collaborative efforts of both government and residents that we can accomplish the objectives outlined in this CAAP. Each of us has a role to play in building a vibrant, environmentally sustainable community that promotes well-being for all.
I extend my gratitude to all those who have contributed to the development of this plan and express my unwavering commitment to its implementation. Together, let us create a brighter future - one that prioritizes the health, well-being, and prosperity of our community, and the preservation of the beautiful natural resources that all help make La Cañada Flintridge a great place to live.
Sincerely,

EXECUTIVE SUMMARY
This Climate Action and Adaptation Plan (CAAP) provides a roadmap for La Cañada Flintridge to reduce its impact on the climate and identifies ways that the city can adapt to the changing climate.

EXECUTIVE SUMMARY
CALL TO ACTION
Climate change is a pressing global challenge that requires collective action and sustainable solutions to safeguard our planet's future. Greenhouse gas (GHG) emissions which are emitted from the cars we drive, the energy we consume, and the products we buy are having a harmful effect on our environment and are increasing temperatures at an unsustainable pace.
The next few years are critical in limiting global temperature to a 1.5°C increase and mitigating the most severe impacts of climate change. To do so, global emissions need to be halved by 2030, and net zero emissions must be achieved before 2050. According to the most recent report from the Intergovernmental Panel on Climate Change (IPCC), the Earth has warmed 1.09°C since 1850 and many changes such as sea-level rise and glacier and arctic ice melt are now irreversible. Global temperature rise is likely to reach 1.5°C by the mid-2040s which will further stress our environmental systems and, at a local level, will result in more frequent and intense heat waves, floods, drought, wildfire, and air pollution. As a global community, we are rushing to find ways to mitigate the worst of what is to come. As a local community, we are seeking ways to thrive despite the disruptions to our lives and well-being.
EXECUTIVE SUMMARY
PURPOSE
La Cañada Flintridge’s 2024 CAAP is meant to serve as a guiding document toward GHG reductions both in municipal operations and community-wide. It is designed as a comprehensive strategy to reduce emissions in a manner consistent with state guidelines and regulations, and to identify cost-effective opportunities for existing and future residents, businesses, and development projects for a more sustainable community. The CAAP is intentionally a living document that can be revised as needed with clear and transparent metrics by which progress can be both assessed and measured. Although the City will be flexible, it will remain steadfast to the objectives ahead.
La Cañada Flintridge is committing to the following emission targets:
• Reduce 40% of GHG emissions below 2007 levels by 2030
• Reduce 58% of GHG emissions below 2007 levels by 2035
• Carbon neutrality by 2045
There are 54 strategies with 105 associated actions outlined within the CAAP to provide a roadmap for implementation. Certain strategies within the CAAP have risen to the top as the most impactful climate action targets for both community and City operations that should be prioritized above the rest. They are listed as the “Top 10 Biggest Bang for your Buck''.
TARGET
1. Transition to 100% renewable energy by 2050
2. Increase EV infrastructure and adoption community-wide to reduce combustion engine VMT by 25% by 2040; Accelerate the transition to EVs in the community
3. Promote natural gas alternatives to commercial and residential customers using a Heat Pump Promotional Campaign
4. Complete an community-wide building electrification study and establish a long-term implementation plan (Phase 1 and Phase 2)
5. Consider a residential and commercial “Bulk Purchasing” solar agreement to bring upfront costs down. Campaign: Solarize LCF (Partner with the school district)
6. Encourage all appropriate new construction be designed for net-zero energy
7. Achieve 15% reduction in residential and commercial energy use by 2035 from 2007
8. Incorporate climate action and adaptation into city policy, budget, planning, and internal standards
9. Join the Clean Power Alliance
10. Appoint a Commission on the Environment
FOUNDATIONAL: TOP 10 BIGGEST BANG FOR YOUR BUCK
EXECUTIVE SUMMARY
PURPOSE CONTINUED
Outlined in Figure A, the project team analyzed the long-term GHG emissions reduction potential of strategies 1-7 and adjusted the percentages (i.e. 50% reduction in GHG emissions by 2030) to ensure that the City could reach net zero by 2045 if they achieve these 7 targets. (The City will consider carbon sequestration if any residual emissions remain in 2050.) Our methodology included running the City’s 2019 GHG emissions inventory through the Local Governments for Sustainability’s model, ICLEI ClearPath, and then forecasting those emissions out to 2045 using escalation factors for projected population growth, national transportation emission requirements, and the utility commitments towards net zero carbon emissions. The ICLEI Clearpath model bases the emission reductions on the unique usage data and emission factors specific to La Cañada Flintridge. The model has the capability of running different emission reduction scenarios based on the percentage of expected emissions reduced.
Strategies 8-10 are not specific to GHG emission reduction. Instead, these strategies serve as guiding governance frameworks. Integration of climate action and adaptation should be woven into planning discussion and budget setting. There is already a commitment to research the possibility of joining the Clean Power Alliance with a Feasibility Study underway. In summary, a focus on the TOP 10 strategies will enable the City to be prepared for climate change.
In addition to the Top 10 goals, strategies, and additional actions are further developed throughout the CAAP in the following sectors: Transportation, Built Environment, Energy, Resource Conservation, Green Community and Resilient Community. These sectors clearly map a qualitative and quantitative approach to actionable solutions that the City can take.
ere is already a commitment to research the
possibility of joining the Clean Power Alliance with a Feasibility Study underway In summary, a focus of the TOP 10 strategies will enable the City to be prepared for climate change.
possibility of joining the Clean Power Alliance with a Feasibility Study underway In summary, a focus of the TOP 10 strategies will enable the City to be prepared for climate change.
h a Feasibility Study underway In summary, a
into planning discussion and budget setting There is already a commitment to research the possibility of joining the Clean Power Alliance with a Feasibility Study underway In summary, a focus of the TOP 10 strategies will enable the City to be prepared for climate change
y to be prepared for climate change.
ctions are further developed throughout the CAP ironment, Energy, Resource Conservation, Green ors clearly map a qualitative and quantitative n take.
EXECUTIVE SUMMARY
In addition to the Top 10, goals, strategies, and actions are further developed throughout the CAP in the following sectors: Transportation, Built Environment, Energy, Resource Conservation, Green Community and Resilient Community. These sectors clearly map a qualitative and quantitative approach to actionable solutions that the City can take.
In addition to the Top 10, goals, strategies, and actions are further developed throughout the CAP in the following sectors: Transportation, Built Environment, Energy, Resource Conservation, Green Community and Resilient Community These sectors clearly map a qualitative and quantitative approach to actionable solutions that the City can take.
In addition to the Top 10, goals, strategies, and actions are further developed throughout the CAP in the following sectors: Transportation, Built Environment, Energy, Resource Conservation, Green Community and Resilient Community. These sectors clearly map a qualitative and quantitative approach to actionable solutions that the City can take
possibility of joining the Clean Power Alliance with a Feasibility Study underway In summary, focus of the TOP 10 strategies will enable the City to be prepared for climate change.
In addition to the Top 10, goals, strategies, and actions are further developed throughout the CAP in the following sectors: Transportation, Built Environment, Energy, Resource Conservation, Green Community and Resilient Community. These sectors clearly map a qualitative and quantitative approach to actionable solutions that the City can take
In addition to the Top 10, goals, strategies, and actions are further developed throughout the CAP in the following sectors: Transportation, Built Environment, Energy, Resource Conservation, Green Community and Resilient Community These sectors clearly map a qualitative and quantitative approach to actionable solutions that the City can take.
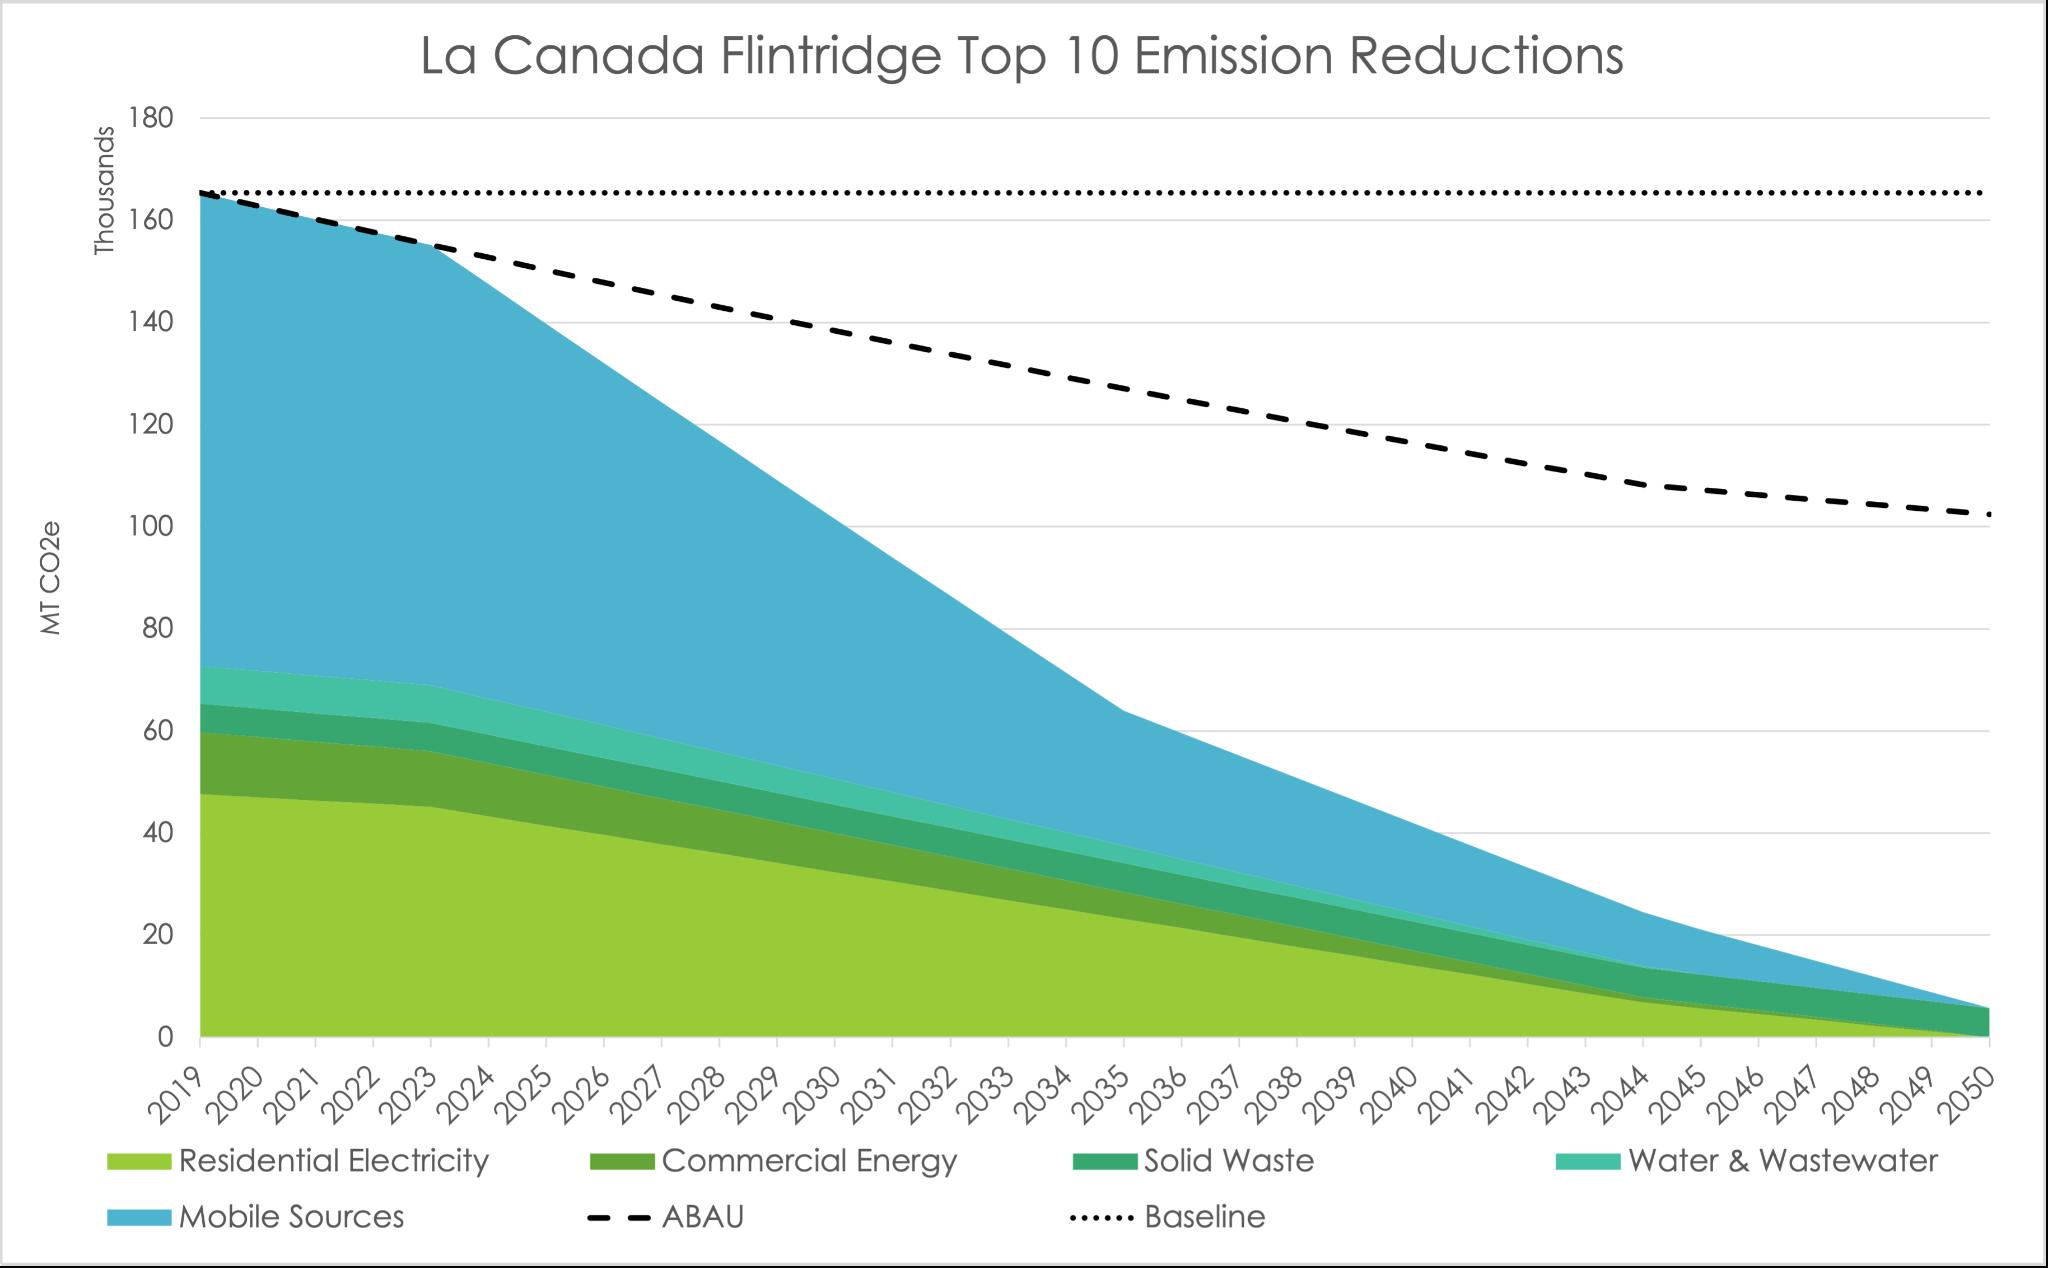
Figure A depicts emissions reduced as a result of all Top 10 commitments Please see Appendix B for more information on the methodology
In addition to the Top 10, goals, strategies, and actions are further developed throughout the in the following sectors: Transportation, Built Environment, Energy, Resource Conservation, G Community and Resilient Community These sectors clearly map a qualitative and quantitativ approach to actionable solutions that the City can take.
In addition to the Top 10, goals, strategies, and actions are further developed throughout the in the following sectors: Transportation, Built Environment, Energy, Resource Conservation, G Community and Resilient Community. These sectors clearly map a qualitative and quantitativ approach to actionable solutions that the City can take
educed as a result of all Top 10 commitments. Please see Appendix B for more information on the methodology
educed as a result of all Top 10 commitments Please see Appendix B for more information on the methodology.
reduced as a result of all Top 10 commitments Please see Appendix B for more information on the methodology.
reduced as a result of all Top 10 commitments. Please see Appendix B for more information on the methodology
f all Top 10 commitments. Please see Appendix B
Vulnerability Assessment
Figure A depicts emissions reduced as a result of all Top 10 commitments. Please see Appendix B for more information on the methodology.
Vulnerability Assessment
Vulnerability Assessment
A Vulnerability Assessment was conducted to determine the threats that La Cañada Flintridge could face from the changing climate, along with evaluating the city's readiness and capabilities to respond to these threats. Despite being shielded from some climate change aspects due to its non-coastal position, La Cañada Flintridge is poised to encounter amplified heat extremes, degraded air quality from external wildfires, heightened seasonal storms, and potential pressures on its energy grid and water supply, due to wider regional climatic shifts While the City exhibits preparedness thanks to previous experiences with drought and pandemics, the escalating climate change scale presents fresh challenges. The full Vulnerability Assessment is available in Appendix A possibility of joining the Clean Power Alliance with a Feasibility Study underway. In summary, a focus of the TOP 10 strategies will enable the City to be prepared for climate change
missions reduced as a result of all Top 10 commitments. Please see Appen for more information on the methodology
Vulnerability Assessment
Vulnerability Assessment
Vulnerability Assessment
A Vulnerability Assessment was conducted to determine the threats that La Cañada Flintridge could face from the changing climate, along with evaluating the city's readiness and capabilities to respond to these threats Despite being shielded from some climate change aspects due to its non-coastal position, La Cañada Flintridge is poised to encounter amplified heat extremes, degraded air quality from external wildfires, heightened seasonal storms, and potential pressures on its energy grid and water supply, due to wider regional climatic shifts While the City exhibits preparedness thanks to previous experiences with drought and pandemics, the escalating climate change scale presents fresh challenges The full Vulnerability Assessment is available in Appendix A
Vulnerability Assessment
VULNERABILITY ASSESSMENT
termine the threats that La Cañada Flintridge evaluating the city's readiness and capabilities ed from some climate change aspects due to its ed to encounter amplified heat extremes, htened seasonal storms, and potential pressures regional climatic shifts While the City exhibits th drought and pandemics, the escalating The full Vulnerability Assessment is available in
A Vulnerability Assessment was conducted to determine the threats that La Cañada Flintridge could face from the changing climate, along with evaluating the city's readiness and capabilities to respond to these threats. Despite being shielded from some climate change aspects due to its non-coastal position, La Cañada Flintridge is poised to encounter amplified heat extremes, degraded air quality from external wildfires, heightened seasonal storms, and potential pressures on its energy grid and water supply, due to wider regional climatic shifts. While the City exhibits preparedness thanks to previous experiences with drought and pandemics, the escalating climate change scale presents fresh challenges The full Vulnerability Assessment is available in Appendix A.
A Vulnerability Assessment was conducted to determine the threats that La Cañada Flintridge could face from the changing climate, along with evaluating the city's readiness and capabilities to respond to these threats. Despite being shielded from some climate change aspects due to its non-coastal position, La Cañada Flintridge is poised to encounter amplified heat extremes, degraded air quality from external wildfires, heightened seasonal storms, and potential pressures on its energy grid and water supply, due to wider regional climatic shifts While the City exhibits preparedness thanks to previous experiences with drought and pandemics, the escalating climate change scale presents fresh challenges. The full Vulnerability Assessment is available in Appendix A possibility of joining the Clean Power Alliance with a Feasibility Study underway. In summary, a focus of the TOP 10 strategies will enable the City to be prepared for climate change
missions reduced as a result of all Top 10 commitments Please see Appen for more information on the methodology.
A Vulnerability Assessment was conducted to determine the threats that La Cañada Flintridge could face from the changing climate, along with evaluating the city's readiness and capabilities to respond to these threats. Despite being shielded from some climate change aspects due to its non-coastal position, La Cañada Flintridge is poised to encounter amplified heat extremes, degraded air quality from external wildfires, heightened seasonal storms, and potential pressures on its energy grid and water supply, due to wider regional climatic shifts. While the City exhibits preparedness thanks to previous experiences with drought and pandemics, the escalating climate change scale presents fresh challenges The full Vulnerability Assessment is available in Appendix A.
A Vulnerability Assessment was conducted to determine the threats that La Cañada Flintridge could face from the changing climate, along with evaluating the city's readiness and capabilities to respond to these threats. Despite being shielded from some climate change aspects due to its non-coastal position, La Cañada Flintridge is poised to encounter amplified heat extremes, degraded air quality from external wildfires, heightened seasonal storms, and potential pressures on its energy grid and water supply, due to wider regional climatic shifts. While the City exhibits preparedness thanks to previous experiences with drought and pandemics, the escalating climate change scale presents fresh challenges. The full Vulnerability Assessment is available in Appendix A.
A Vulnerability Assessment was conducted to determine the threats that La Cañada Flintridg could face from the changing climate, along with evaluating the city's readiness and capabili to respond to these threats. Despite being shielded from some climate change aspects due non-coastal position, La Cañada Flintridge is poised to encounter amplified heat extremes, degraded air quality from external wildfires, heightened seasonal storms, and potential press on its energy grid and water supply, due to wider regional climatic shifts While the City exhib preparedness thanks to previous experiences with drought and pandemics, the escalating climate change scale presents fresh challenges. The full Vulnerability Assessment is availabl
A Vulnerability Assessment was conducted to determine the threats that La Cañada Flintridg could face from the changing climate, along with evaluating the city's readiness and capabili to respond to these threats. Despite being shielded from some climate change aspects due non-coastal position, La Cañada Flintridge is poised to encounter amplified heat extremes, degraded air quality from external wildfires, heightened seasonal storms, and potential press on its energy grid and water supply, due to wider regional climatic shifts. While the City exhib preparedness thanks to previous experiences with drought and pandemics, the escalating climate change scale presents fresh challenges The full Vulnerability Assessment is availabl
Appendix A.
Appendix A possibility of joining the Clean Power Alliance with a Feasibility Study underway. In summary focus of the TOP 10 strategies will enable the City to be prepared for climate change
EXECUTIVE SUMMARY
STAKEHOLDER ENGAGEMENT
Community engagement was a critical component of La Cañada Flintridge’s CAAP planning process. Community members are the ones that experience the effects of its plan, projects and policies. In the process of creating the CAAP, the City worked (and will continue to collaborate) with existing organizations, small businesses, and public and private stakeholders in and around LA County. The City’s stakeholder engagement events have included survey reports, focus group discussions, and public progress reports. Participants' comments and suggestions have been integrated into the CAAP to the best of the project team’s abilities. As this CAAP is implemented, collaboration between the City and these stakeholders will remain essential because they are, as members of the community, best equipped to inform the CAAP team of challenges the community faces. A Stakeholder Report is Appendix B of this plan.
COST AND IMPLEMENTATION
TIMELINE
Efficiently allocating resources and funds is a cornerstone of the CAAP for La Cañada Flintridge. Structured by year and specific focus area, the budget section presents a clear trajectory of expenditures and investments to facilitate the city's vision of a sustainable future. An overview of the funding plan is provided in the core body of the CAAP, providing a breakdown of the estimated costs associated with each strategy. The implementation year for each strategy was selected based on its priority score and alignment with the Top 10 Bang for Your Buck. Strategies set for immediate rollout have a higher priority score, whereas those with a later implementation year indicate a lower priority score. To further clarify, there is a funding plan that itemizes each strategy's estimated cost, the proposed implementation year, and possible funding source(s), a table detailing possible funding mechanisms and a detailed implementation plan specifies each strategy's projected rollout timeline, primary implementation lead, tracking milestones and the potential impact on GHG reduction.
It should be emphasized that a critical first step in implementing this CAAP will be to establish a Commission on the Environment to ensure there is a dedicated group of people thinking about climate issues and regularly pushing policy recommendations to the City Council. The Commission will be appointed by the City Council and work directly with a city-appointed Chief Sustainability Officer. The commission can recommend task forces that include broader coalitions of community members and partners to work on specific projects and can be a general depository for community engagement.
EXECUTIVE SUMMARY
CONCLUSION
While the proposed CAAP actions can be daunting, the cost of inaction is much higher. Investments now will substantially reduce long-term operation costs, reduce recovery costs from climate-related disasters, and promote growth in local jobs and the economy. The goals are ambitious, but achievable. There will undoubtedly be twists and turns on this path, and we will need to stay flexible and adapt along the way. But if we can achieve these goals, we’ll have a community that is healthy, connected, and vibrant. We encourage everyone to embrace and fully participate in implementing this CAAP.
INTRODUCTION BACKGROUND
INTRODUCTION BACKGROUND
BACKGROUND
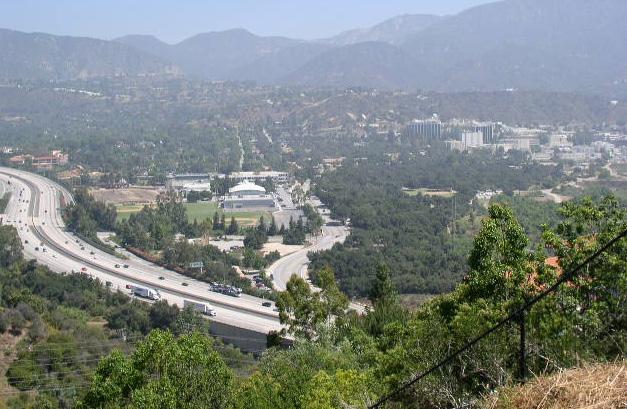
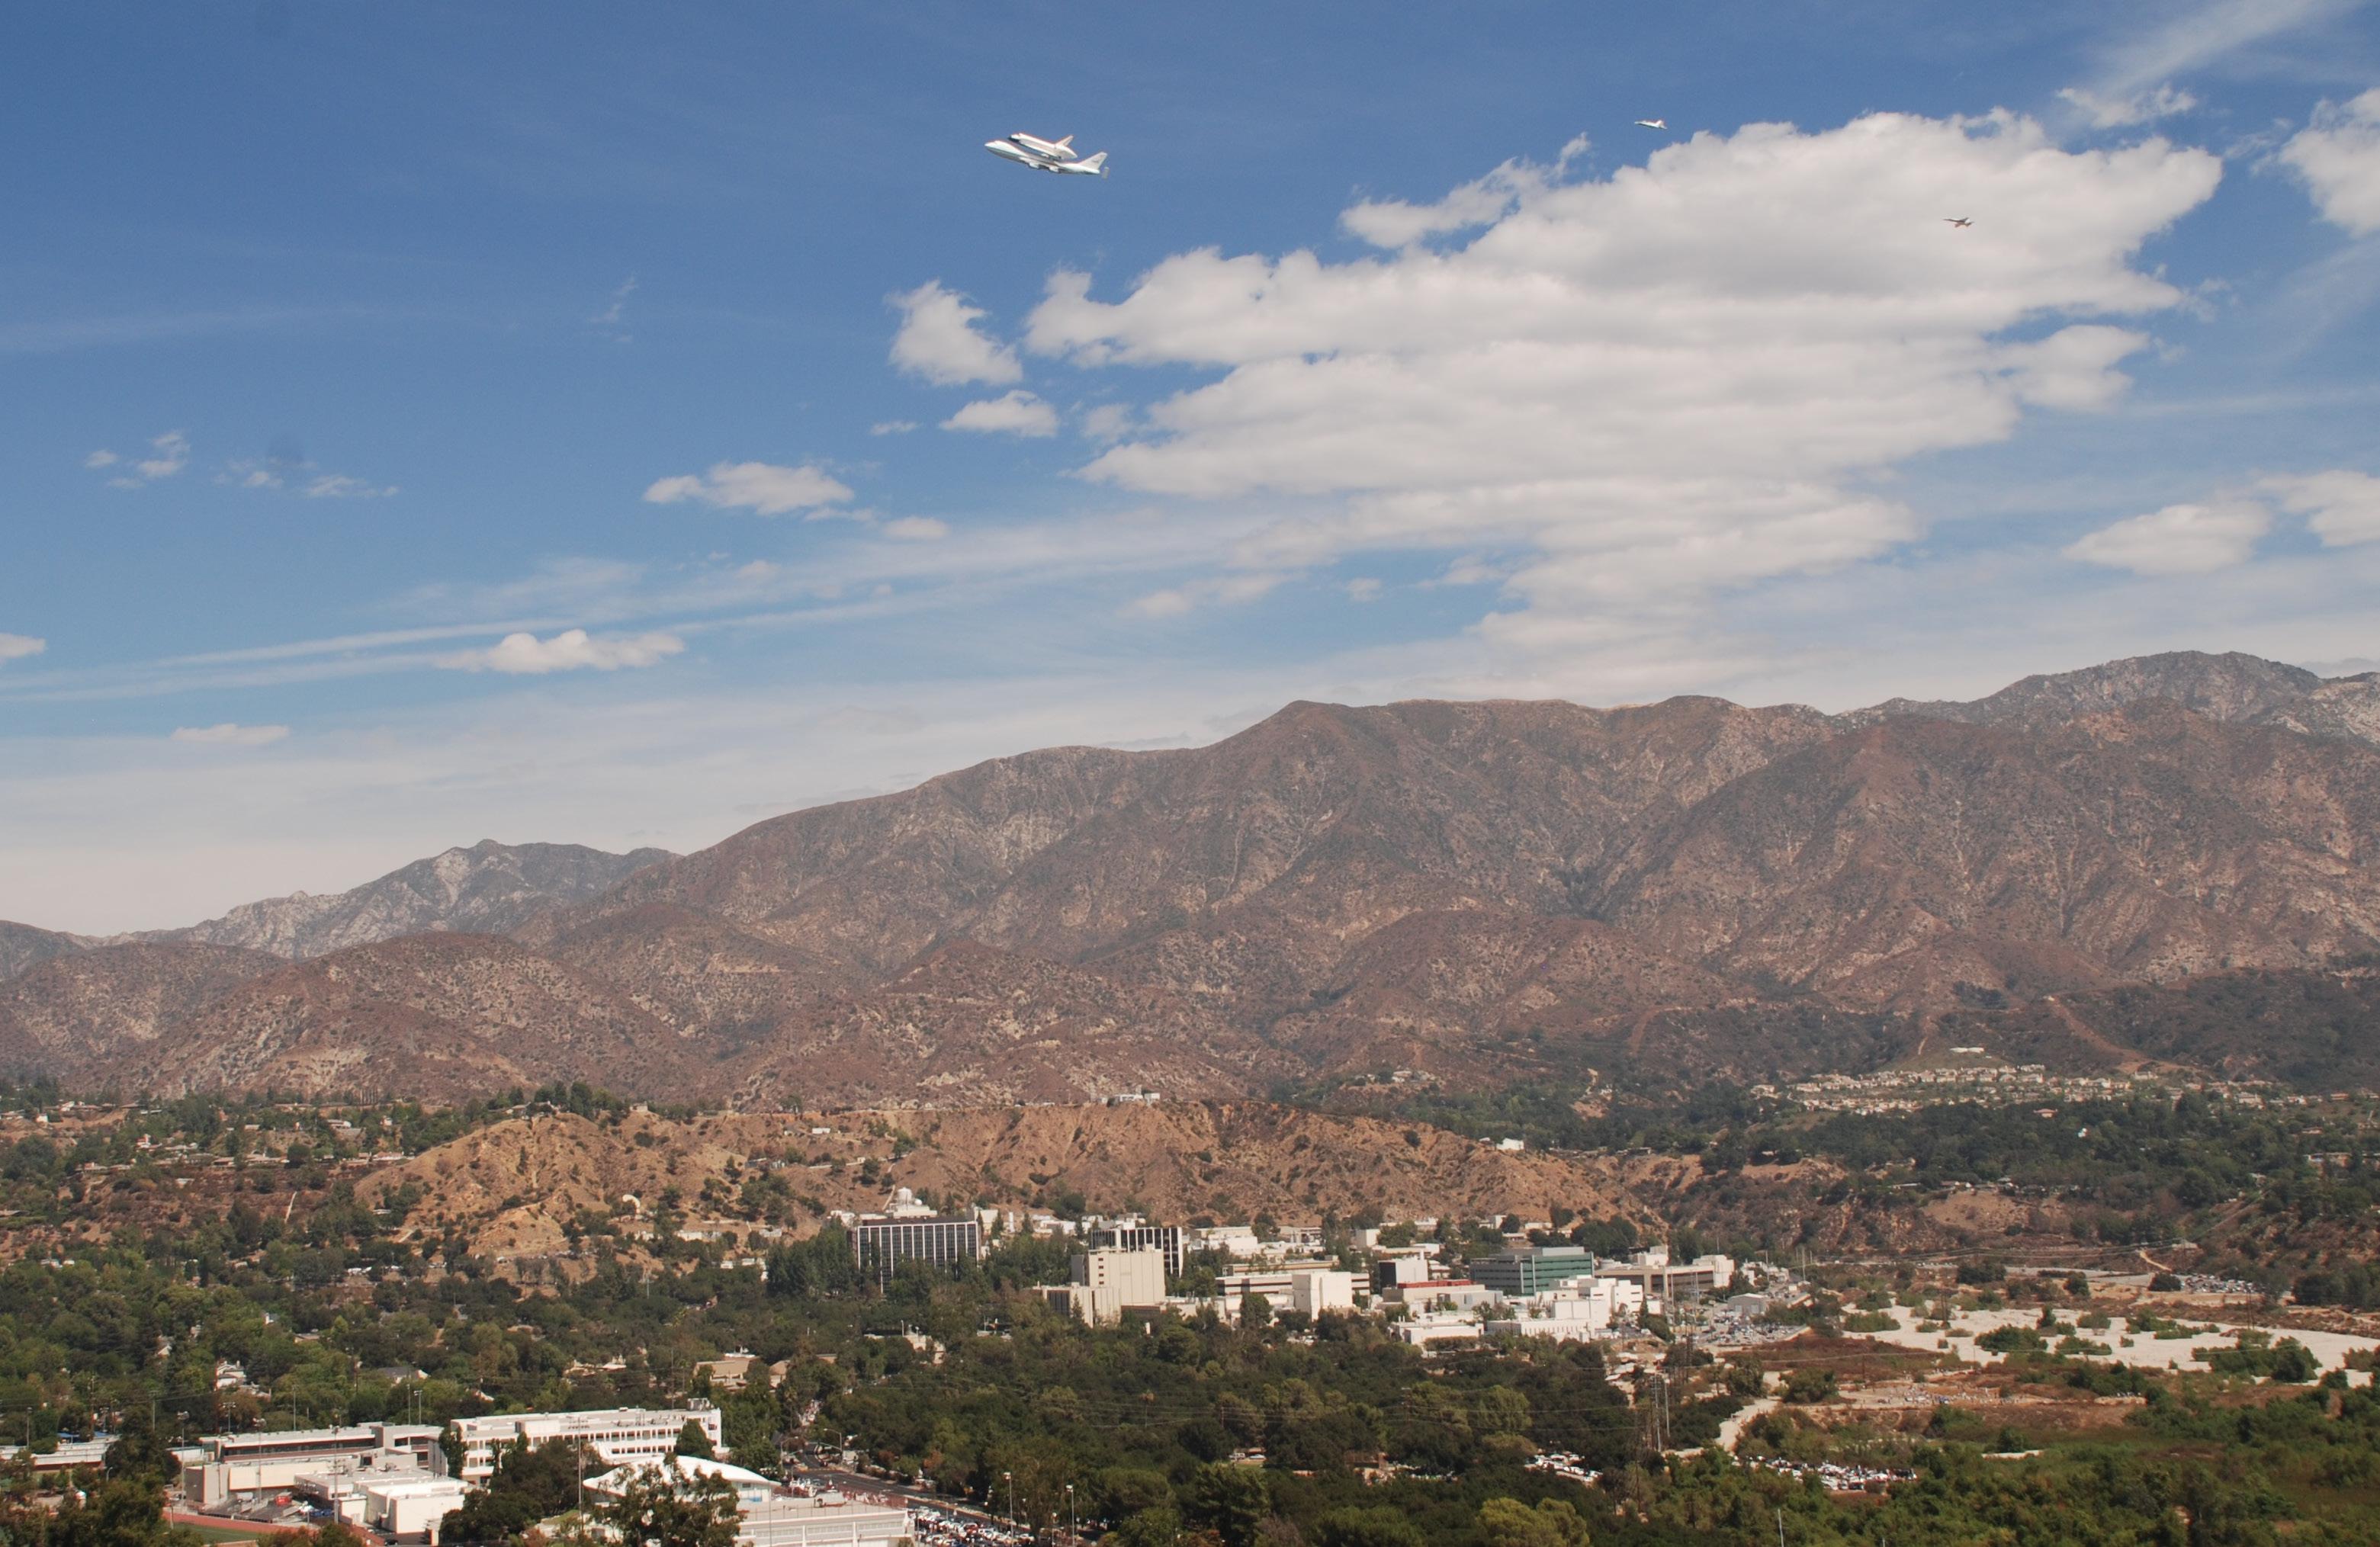
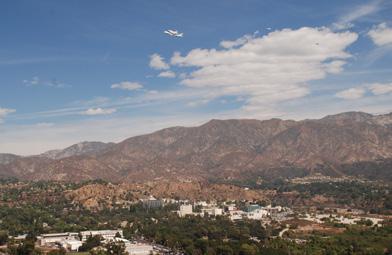
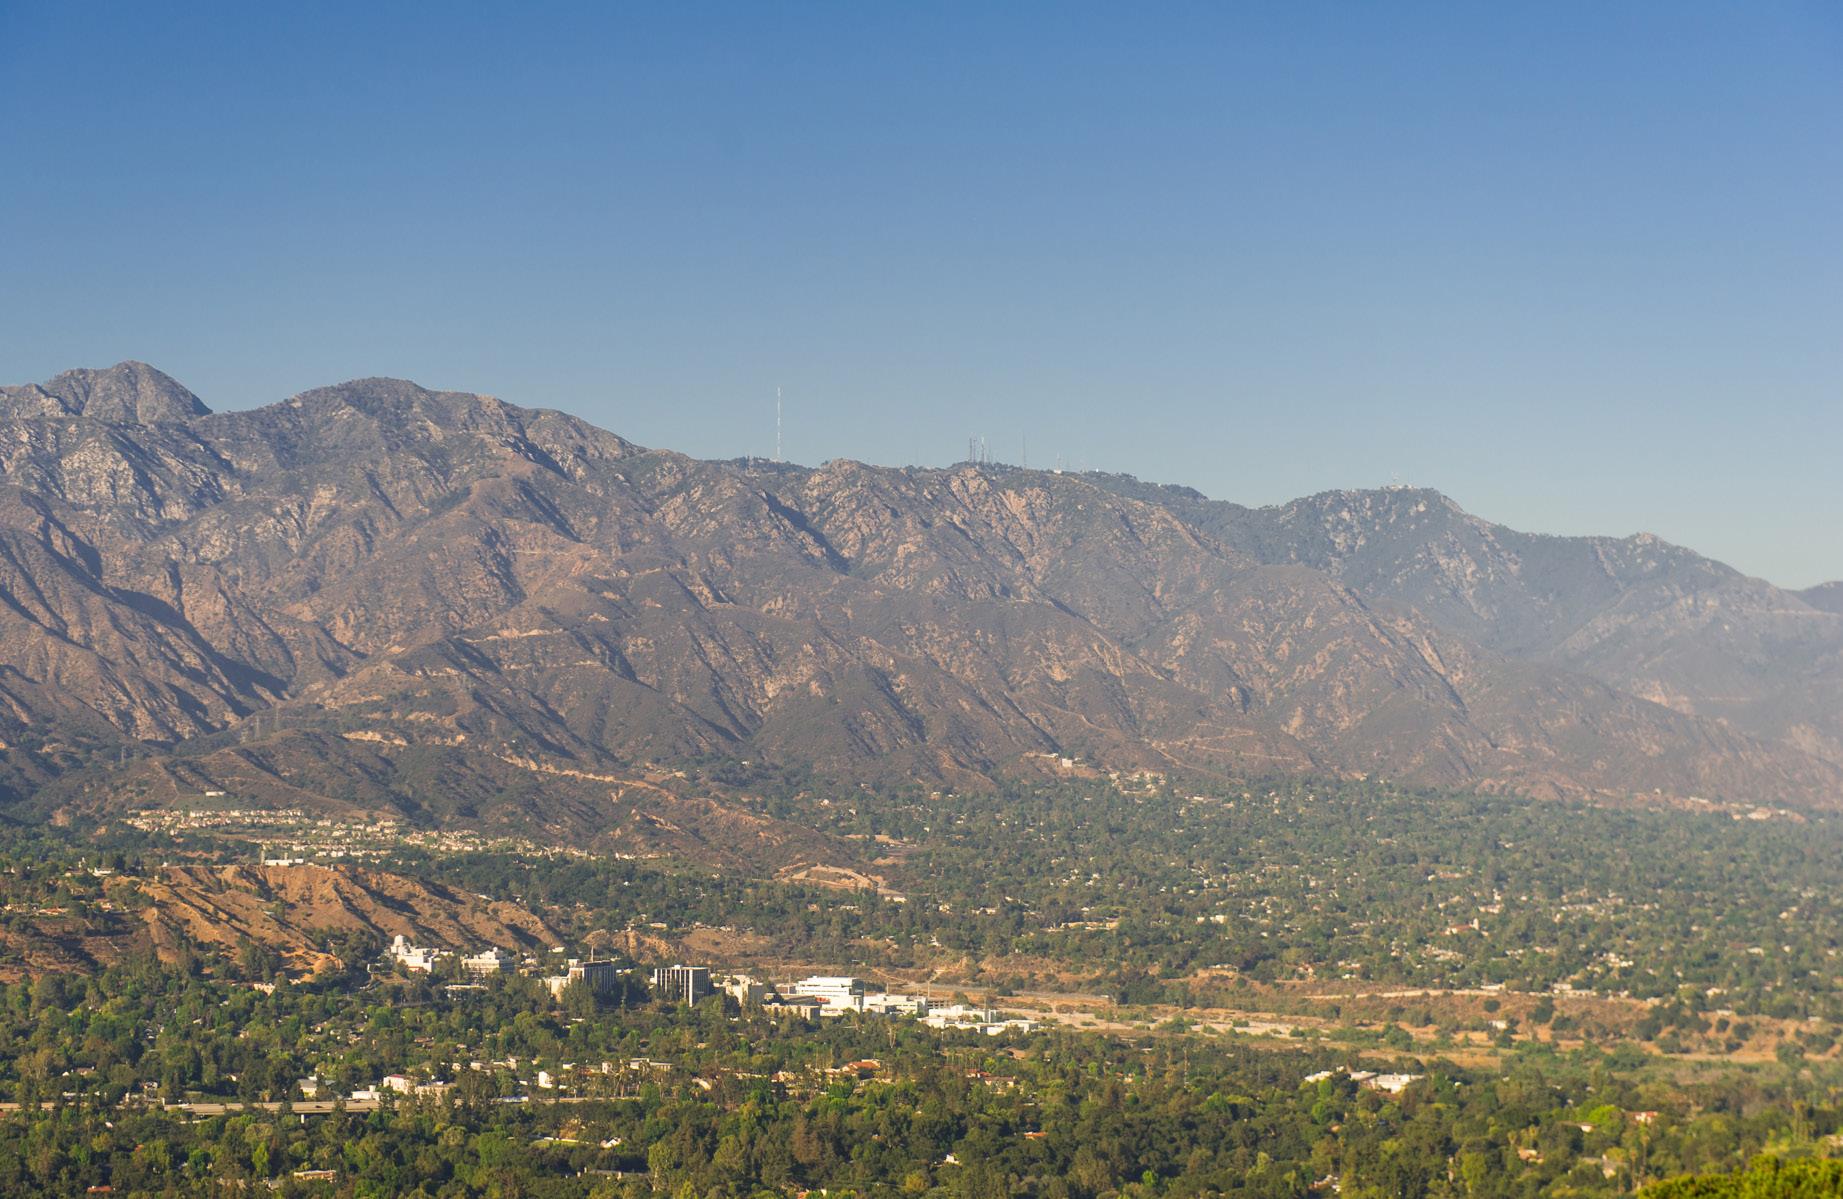
The City of La Cañada Flintridge is approximately 8.5 square miles in area and is bordered by the Angeles National Forest on the north, and the cities of Pasadena on the east and Glendale on the west. The foundation of the City was established in the early 1920s when developers began to subdivide the area to attract buyers with scenic views. In 1976, the two communities of La Cañada and Flintridge joined to become one incorporated city, called La Cañada Flintridge. The City operates under the Council Manager form of government. The City has a population of 20,588 and is primarily a bedroom community consisting largely of owneroccupied single-family homes. La Cañada Flintridge enjoys a semi-rural character and a small-town atmosphere while maintaining a proximity to the downtown Los Angeles urban center. Commercial development in the City is almost exclusively limited to frontage along Foothill Boulevard, the main thoroughfare. The Jet Propulsion Laboratory (JPL) is within the eastern city limits.
ALIGNMENT WITH STATE POLICIES
California has been a global leader in developing policies and programs that address climate change. Since 2005, California has been passing legislation that seeks to control emissions of gasses that contribute to global warming. These have included regulatory approaches, such as mandatory reporting for significant sources of GHG emissions and caps on emission levels, as well as market-based mechanisms, such as market-based Cap-and-Trade.
Some regulations apply at the state level, but others are state-imposed mandates that are applicable at the municipal level and are required of local agencies and jurisdictions. AB 32 directs the state to reduce statewide GHG emissions to 1990 levels by 2020, while SB 32 deepens that commitment to 40 percent below 1990 levels by 2030. To achieve these reductions, the California Air Resources Board (CARB) and the state Office of Planning and Research recommend that local governments develop community-wide targets that are consistent with these statewide targets. As such, this CAAP sets a 2045 community-wide GHG target for the City consistent with state recommendations, and it outlines the strategies and actions the City will take to reduce GHG emissions and track progress toward reaching that target.
INTRODUCTION BACKGROUND
ALIGNMENT WITH STATE POLICIES CONTINUED
California SB 379 requires each city and county to address climate change in the safety element of its general plan and/or in its local hazard mitigation plan. The bill requires the updated plan to include climate adaptation and resiliency strategies based on a vulnerability assessment that is specific to the local geography. La Cañada Flintridge’s Vulnerability Assessment can be found in Appendix A.
In September 2022, the State of California adopted Assembly Bill 1279 (AB 1279), which creates a legally binding goal that the state achieve carbon neutrality — meaning the state either eliminates or captures all of its GHG emissions — by no later than 2045. CARB has been entrusted with leading the statewide planning effort to achieve this long-term target, and the plan was published to chart a comprehensive path for the State of California to attain carbon neutrality by 2045.
ALIGNMENT WITH CITY PLANS AND POLICIES
The CAAP was designed to be consistent with the City’s General Plan and other relevant planning documents, including the Energy Action Plan, Trails Master Plan and Local Hazard Mitigation Plan. As part of its 2013 General Plan Update, the City committed to preparing a 2016 Climate Action Plan that focused on reducing community and municipal emissions by at least 15% by 2020 compared to the 2007 baseline inventory. Table A identifies progress made since 2016. The City has noted a need for additional staff to help capture continued progress over time. More information on the City’s approach to staffing can be found in the Management Approach section.
Recognizing the need for urgent and ambitious climate action based on public concern and scientific evidence, La Cañada Flintridge saw the imperative to systemize and accelerate efforts. Therefore, this 2024 CAAP represents the next step, unifying existing climate work under one strategic umbrella to transition the city to a low-carbon, climate-resilient community. The CAAP builds off of previous city planning documents and will be updated every five years to remain consistent with updates to the City’s General Plan Elements.
INTRODUCTION BACKGROUND
OUR PROGRESS
2016 CAP GOALS
Achieve community and municipal emissions by at least 15% by 2020 compared to the 2007 baseline inventory.
Achieve 20% reduction in municipal energy use by 2035 using 2016 baseline
Achieve 15% reduction in residential and commercial energy use by 2035 using 2014 baseline
Achieve installation of 250 KWh of solar installation
ENERGY
2024
PROGRESS TO DATE
Reduced 43% compared to the 2007 baseline inventory, as of 2019 inventory
13% reduction in municipal energy use over the past five years
12% decrease in residential and commercial energy use over the past five years
4,200+ kW of residential solar installed
RESOURCE CONSERVATION
Achieve 50% reduction in water use by 2035. GHG Reduction Potential using 2014 baseline
Achieve 100% of new development implementing water efficient measures by 2035
Achieve 20% of water supply sourced from recycled water by 2035
Achieve 85% diversion rate by 2035 using a 2014 baseline
Achieve diversion of 90% of construction and demolition waste by 2035
Convert 15% of heavy-duty vehicles to CNG by 2035
16% reduction in municipal water use
25% of new residential development with water efficient features
No progress
75% city-generated solid waste diversion rate from facilities
95% diversion of construction & demolition waste
TRANSPORTATION
40% reduction in Municipal fleet emissions;
Achieve installation of six new EV charging stations 3 new charging stations installed
Increase use of low emissions vehicles by 2035
Plant 250 new trees by 2035
Increase green space by 10 acres by 2035
All three city vehicles (2 cars, 1 truck) are hybrid. Replacing the truck with a fully electric vehicle approved 2023
GREEN COMMUNITY
345+ community trees planted
Ongoing
CLIMATE RESILIENCE
Conduct a climate change vulnerability assessment of vulnerable populations, structures, and functions
Review the findings of the climate change vulnerability assessment with relevant City departments
Incorporate newly identified adaptation measures into planning documents
Hold public outreach events including public workshops and climate change preparedness fairs
Complete
Complete
Complete
Complete
Table A: Progress since 2016 Climate Action Plan
OUR IMPACT
An updated GHG Emission Inventory was conducted as part of this CAAP planning process in order to understand the present state of environmental impacts and to establish a baseline for the forecasting of future emissions.
COMMUNITY INVENTORY RESULTS
In 2019, the La Cañada Flintridge community produced a total of 164,353 metric tons of carbon dioxide equivalent emissions (MT CO2e). As illustrated in the figure below, the greatest percentage of emissions was from transportation and mobile service at 57%, or 92,720 MT CO2e. Energy use (which includes electricity and natural gas) in residential buildings represents the next largest source at 29%, and energy from commercial use followed, contributing 7%. In terms of total amounts, residential energy produced 47,691 MT CO2e, commercial energy resulted in 12,065 MT CO2e. The remainder of the community inventory includes solid waste with 3% or 5,578 MT CO2e, water and wastewater with 4% or 6,182 MT CO2e, and fugitive emissions with 118 MT CO2e.
Figure 1 La Cañada Flintridge 2019 community inventory by sector
LA CAÑADA FLINTRIDGE COMMUNITY INVENTORY
CITY OPERATIONS INVENTORY RESULTS
City operations GHG emissions were also analyzed. La Cañada Flintridge government operations were responsible for 226 MT CO2e. The largest emission sources were employee commuting at 36% (80 MT CO2e) and City Facilities at 28% (64 MT CO2e). The Public Lighting sector contributed 22%, with 64 MT CO2e. Finally, the city’s operational water supply contributed 14% of emissions, or 32 MT CO2e.
VMT ANALYSIS
Origin-destination-based VMT was estimated using the Southern California Association of Governments’ (SCAG) Activity-Based Model from the agency’s 2020 Regional Transportation Plan/Sustainable Communities Strategy (RTP/SCS). Such models are developed and periodically updated, calibrated, and validated for use in long-range infrastructure planning, environmental impact assessments, and air quality conformity analysis by local and regional agencies. Trip-based travel forecasting models generate daily vehicle trips for each traffic analysis zone (TAZ) across various trip purposes based on inputs such as the transportation network and socioeconomic data (population, household, and employment). SCAG’s 2020 model is validated to the base year 2016, and it forecasts conditions out to 2045 for different scenarios of future regional travel patterns. Appendix E and F outline the methodology of calculated VMT for the City and the expected emission reductions from Implementation of the CAAP.
Figure 2 La Cañada Flintridge 2019 municipal emissions by sector
LA CAÑADA FLINTRIDGE CITY OPERATIONS INVENTORY
LOOKING TO 2045
LOOKING TO 2045
EMISSIONS FORECAST
To determine what the City’s emissions might look like in 2045, a series of emissions forecasts were developed. First a Business-As-Usual (BAU) forecast was developed to estimate the City’s emissions without any additional action from Federal, State, or local governments. The City’s Business As-Usual emissions are expected to increase from 164,353 metric tons in 2019 to 172,506 metric tons in 2045.
To project the City’s emissions in 2045 including the expected impacts of State and local actions, an Adjusted Business-As-Usual (ABAU) forecast was developed which includes expected increases to National Corporate Average Fuel Economy standards, and the local energy providers renewable energy grid mix. This forecast shows that, with the inclusion of these additional factors, the City’s emissions are expected to decline from 164,353 metric tons in 2019 to 107,228 metric tons in 2045.
Based on the current and forecasted greenhouse gas emissions, implementation of La Cañada Flintridge’ 2016 Climate Action Plan, and guidance from City government and the community, the CAAP is based on pursuing a goal of Carbon Neutrality by 2045. Reducing as many GHG emissions produced by the City and its residents as possible and sequestering the remaining emissions through nature-based solutions, and local carbon offsets to reach Carbon Neutrality by 2045.
La Cañada Flintridge will need to reduce its net emissions by an additional 119,400 metric tons by 2030 and a further 94,602 metric tons by 2035 to reach our carbon neutrality goal.
EMISSIONS TIMELINE BY SCENARIO (MTCO2 e )
Table B: Executive Summary Emissions Timeline by Scenario
STRATEGIC ROADMAP
STRATEGIC ROADMAP
DEVELOPMENT AND METHODOLOGY
Through quantitative and qualitative analysis, goals, strategies, and actions were identified to enable the City to form a clear path toward implementation. Some of the strategies were derived from existing programs and policies within local and regional planning documents, while others emerged as new strategies drawn from the stakeholder process.
CAAP STRATEGY DEVELOPMENT
DEVELOPMENT PROCESS:
Preliminary quantitative and qualitative strategies identified and agreed upon
Development of “Long List” of CAAP actions to implement each strategy
Community and stakeholder feedback
Further refine into a “Short List” of CAAP actions
Quantify emission reductions from actions
DEVELOPMENT TOOLS
The Climate Action Tracker is being used to track annual progress of the CAAP. The Tracker acts as an internal tracking system for staff roles and responsibilities, timelines and funding approaches. The Climate Action Tracker combines stakeholder feedback with strategy development to determine and clearly identify what additional gaps in data or funding is needed. The Tracker functions like a workbook and serves as the single point for planning, reporting and ongoing performance monitoring. The Tracker: (1) establishes a “starting point” for future comparisons; (2) tracks strategies and actions identified in the CAAP; (3) ensures contributions and actions of multiple City leaders; and (4) summarizes results and impacts. The Climate Action Tracker can be used to assign various action and reporting requirements to key departments responsible for reporting.
CLIMATE ACTION TRACKER
Transition to 100% renewable energy by 2050 24.5 MT CO2e
Continue energy conservation measures in municipal operations 84.55 MT CO2e
Heat Pump Promotional Campaign: A city campaign involving rebates and financing programs could encourage adoption of ground- and air-source heat pump systems for space and water heating in both residential and commercial settings
96153.48 MT CO2
Complete an community-wide electrification study and establish a long-term implementation plan (Phase 1 and Phase 2) 15,674 MT CO2e
Consider a residential and commercial “Bulk Purchasing” solar agreement to bring upfront costs down. Campaign: Solarize LCF (Partner with the school district)
Join the Clean Power Alliance
Encourage all appropriate new construction be designed for net-zero energy
Reduce city-wide VMT by 25% by 2040
22,104.36 MT CO2e
5,157 MT CO2
8,697 MT CO2e
236,106,270.05 MT CO2
Cumulative reductions to meet 50% of total emissions by 2030
50% Facilities Decarbonization by 2030
Cumulative reductions to meet 50% of total emissions by 2030 50% Water & Streetlight Decarbonization by 2030
Cumulative reductions to meet 10% of housholds renovated by 2030 using US Community Protocol guidlines for heat pump replacements 10% of household renovated by 2030
Cumulative reductions of attempting to electrify 10% of all natural gas emissions in LCF by 2035 10% of housing Natural Gas to transtion by 2035
Cumulative reductions until 2030 using US Community protocol for reduction of mmbtu per kwh solar added.
Cumulative carbon emissions reduction with a 30% emissions reduction in electricity by 2030
Cumulative embodied carbon saved by 2050 for residential building based on average construction and average home size multiplied by average embodied carbon of 150 kg CO2e per m3
Cumulative carbon emissions reduction of a 1.47% reduction per year from a 2023 Baseline by 2040
Integrate Climate Action and Adaptation into City Functions Dependant on long term goals
Be prepared for climate change
Community-wide emissions goals
Reduce 40% of GHG emissions below 2007 levels by 2030
Reduce 58% of GHG emissions below 2007 levels by 2035
Carbon neutrality by 2045
Average size of systems are 4kWh, with a goal of getting 10% of housing solarized by 2030
On average communities reduce electricity emissions by 30% by 2030 by joining the Clean Power Alliance
All new buildings reduce their embodied carbon to zero
25% reduction of Fehr and Peers calculations
STRATEGIC ROADMAP
PRIORITIZATION
The Climate Action Tracker provides initial priority rankings and timelines for each CAAP strategy. As a primary step, each strategy is ranked by its potential impact on GHG emission reductions: Tier 1 Foundational, Tier 2 Supportive, and Tier 3 Complementary. Foundational strategies will be key to GHG emission reductions and are drawn out as immediate priorities, regardless of funding available or political will. Supportive strategies are ranked next in line and indicate strategies that have less of a GHG reduction potential but are still critical elements in reducing the environmental impacts. Complementary strategies are focused on educational strategies that are a cornerstone to the CAAP’s ability to succeed.
A second step is to assign co-benefits which help us understand the feasibility and effectiveness of each strategy. Four of the co-benefits are given a numerical score of 1 and ranked based on the high/medium/low impacts that each brings. The GHG reduction is weighted higher, at 1.25%, to indicate further emphasis on these environmental impacts. The numerical scores are combined into a Priority Score which is highlighted after each strategy.
Greenhouse Gas Reduction potential (High, medium, and low)
GHG REDUCTION COSTEFFECTIVENESS
COMMUNITY BENEFITS
Cost-Effectiveness (Net present value, impact versus dollar spent)
Community Benefits (Clean air, livable community, resiliency, etc.)
EFFECTS ON THE ECONOMY
ALIGNMENT WITH STATE/LOCAL POLICIES
Effects on the Economy (Impacts on workforce, broad economy)
Alignment with State and Local Policies (SB 32, SB 379 & AB 1279)
GOALS AN D S TRATEGIES
SCOPE S 1&2
CLIMATE RESILIENCE
GREEN COMMUNITY
S C O P E 3 COMMUNICATIONS
RESOURCE CONSERVATION
ENERGY
TRANSPORTATION
BUILT ENVIRONMENT
GOVERNANCE
STRATEGIC ROADMAP
As part of this process, the City reviewed current policies and programs and produced a comprehensive, annotated list of high-impact strategies that could be analyzed and prioritized based on feasibility, financial considerations, health benefits, and equity. In addition, many opportunities and barriers were considered as part of this process. Table C offers a summary of the different Sectors and specific strategies associated with each.
FOCUS AREA STRATEGIES
FOUNDATIONAL
STRATEGIC ROADMAP
STRATEGIES
BY FOCUS AREA
E 1.1 Compile a list of funding sources that local residents, businesses or the City could potentially access to fund energy audits
E 2.1 Continue energy conservation measures in municipal operations; Revisit 2013 Energy Action Plan
E 2.3 Retrofit existing lighting fixtures with energy-efficient bulbs, such as LEDs, and sensory controls in 100% of municipal buildings by 2035
E 3.2 Consider a residential and commercial “Bulk Purchasing” solar agreement to bring upfront costs down. Campaign: Solarize LCF (Partner with the school district)
E 3.4 Join the Clean Power Alliance
E 3.6 Promote the Property Assessed Clean Energy Program to residents which is an innovative mechanism for financing energy efficiency and renewable energy improvements on private property
SUPPORTIVE
E 2.2 Invest in the latest BEMS technology, upgrading 20% municipal buildings annually with advanced energy monitoring, control, and optimization features by 2035
E 3.1 Explore onsite renewable energy and battery storage for City facilities
E 3.3 Continue to provide expedited permitting for installation of residential PV solar panels and solar water heaters
E 3.5 Ban gas powered lawn equipment community-wide
COMPLEMENTARY
E 1.2 Partner with energy service providers to host energy efficiency fairs, workshops, and demonstrations*
FOUNDATIONAL
T 2.1 Accelerate the transition to EVs in the community, focusing on reducing costs and making charging more accessible
SUPPORTIVE
T 1.1 Work with La Cañada Flintridge schools and Jet Propulsion Laboratory to develop and implement Transportation Demand Management programs for students and employees*
T 1.2 Improve connectivity of transportation network to encourage more high-occupancy trips*
T 1.3 Require new non-residential developments greater than 10,000 square feet or anticipated to include businesses with more than 50 employees to reduce VMT through TDM programs
T 1.4 Reduce other sources of citywide vehicle miles traveled (VMT)
COMPLEMENTARY
T 3.1 Develop pilot program for anti-idling battery packs in sheriff vehicles and explore opportunities for similar initiatives in city vehicles*
T 3.2 Develop educational programs to raise public awareness about the benefits of anti-idling practices and their role in reducing greenhouse gas emissions
STRATEGIC ROADMAP
STRATEGIES BY FOCUS AREA
FOCUS AREA STRATEGIES
FOUNDATIONAL
BE 2.1 Heat Pump Promotional Campaign: A city campaign involving rebates and financing programs could encourage adoption of ground- and air-source heat pump systems for space and water heating in both residential and commercial settings
BE 2.2 Complete a community-wide electrification study and establish a longterm implementation plan (Phase 1 and Phase 2)
SUPPORTIVE
BE 1.1 Adopt an ordinance requiring energy benchmarking and/or energyrelated improvements at time of lease or sale, or under other appropriate conditions of commercial sector buildings by a certain date
BE 1.2 Adopt an ordinance requiring new commercial or mixed-use developments over 5,000 square feet meet a minimum LEED standard
BE 1.3 Pass an ordinance to require all appropriate new construction be designed for net-zero energy
BE 1.4 Require pre-wiring for future solar photovoltaics and other renewable on-site power generation systems in new home construction
BE 2.3 Incorporate advanced energy design features where possible and practical, including daylighting, passive solar heating and shading, natural ventilation in all new construction
COMPLEMENTARY
BE 2.4 Develop a Green Revolving Fund to establish a baseline of savings across municipal operations
SUPPORTIVE
RC 2.1 Initiate Low flow infrastructure policy in all new construction
RC 2.2 Initiate native landscaping policy in all new construction
RC 3.1 Require irrigation with recycled water for common landscaping in singlefamily developments.
RC 4.1 Expand low flow infrastructure in all city-owned buildings
RC 4.2 Implement city-wide water efficiency measures in municipal buildings
RC 4.3 Upgrade city landscaping to reduce water usage
RC 7.1 Transition at least one purchased product annually to a more sustainable option until 2028
COMPLEMENTARY
RC 3.2 Assess recycled water infrastructure
RC 5.1 Adopt a program or ordinance to encourage or require waste audits and waste reduction plans for existing and/ or new commercial developments (including JPL and La Cañada School District facilities)
RC 5.3 Require recycling at special events, such as through special event permit conditions
RC 6.1 Work with La Cañada Unified School District to implement food waste recycling and composting programs for all facilities and consider incorporating them into the educational curriculum.*
RC 6.2 Educate private property owners about mandatory organic collection
FOCUS AREA STRATEGIES
FOUNDATIONAL
STRATEGIC ROADMAP
STRATEGIES BY FOCUS AREA
GC 3.1 Appoint a Commission on the Environment
GC 3.2 Strengthen Interdepartmental Collaboration and Communication
GC 5.1 Incorporate climate action and adaptation into city policy, budget, planning, & internal standards
SUPPORTIVE
GC 4.1 Develop a Green Business Program that begins with easy, lowcost initiatives to get businesses invested, such as a food recovery program.
COMPLEMENTARY
GC 1.1 Write a Stormwater Management Plan in partnership with the County*
GC 1.2 Replace turf in street medians with native plants
GC 2.1 Increase green space owned by the City by 3 acres by 2035
GC 2.2 Implement programs to preserve existing green spaces
GC 2.3 Enhance biodiversity in existing green spaces
GC 4.2 Utilize community support and incentives to motivate businesses to join the green business program, understanding that businesses may be hesitant due to current financial struggles
GC 4.3 Support networking sessions and resources to help businesses share best practices
SUPPORTIVE
CR 1.1 Update the local Hazard Mitigation Plan every five years per state requirements
CR 2.1 Consider heat as a primary risk to the City
CR 3.1 Create a "Fire Ready" program to help residents understand how to create defensible space on their property*
* These strategies will run into regulatory issues and will require collaboration with regional partners and neighboring jurisdictions.
Table C: Executive Summary Strategies by Focus Area
ENERGY
Reducing energy translates into an immediate reduction of GHG emissions. The faster the community can avoid using energy, the less GHG emissions have to be tackled over time. The City plans to revisit the 2013 Energy Action Plan to determine progress made and address the remaining unfunded energy efficient projects outlined in the plan. New approaches to funding and implementation will need to be discussed, such as the role of the Clean Power Alliance and partnerships with Energy Service Companies (ESCOs). The City will also better support residential and commercial customers by increasing educational resources on energy efficiency and renewable energy programs.

STRATEGIC ROADMAP
ENERGY
GOAL E 1
ACHIEVE 15% REDUCTION IN RESIDENTIAL AND COMMERCIAL ENERGY USE BY 2035 FROM 2007
E 1.1
Compile a list of funding sources that local residents, businesses or the City could potentially access to fund energy audits STRATEGY
TIER 1: FOUNDATIONAL
PRIORITY SCORE: 4.25
CO-BENEFITS:
E 1.1.1
Add funding list to the city’s website
E 1.1.2
Promote the availability of the funding sources through targeted outreach campaigns and community engagement
E 1.2
Partner with energy service providers to host energy efficiency fairs, workshops, and demonstrations
TIER 3: COMPLEMENTARY
PRIORITY SCORE: 2.63
CO-BENEFITS:
E 1.2.1
Promote through targeted outreach campaigns such as the Farmer’s Market (s)
E 1.2.2
Contact local utilities to include promotion in the utility’s monthly billing communication
E 1.2.3
Include flier through the School District parent communications
STRATEGIC ROADMAP
ENERGY
GOAL E 2
ACHIEVE 20% REDUCTION IN MUNICIPAL ENERGY USE BY 2035 FROM 2007

STRATEGY
E 2.1
Continue energy conservation measures in municipal operations; Revisit 2013 Energy Action Plan
TIER 1: FOUNDATIONAL PRIORITY SCORE: 2.25
CO-BENEFITS:
E 2.1.1
Expand funding for energy efficiency improvement projects and programs; Consider Energy Service Companies (ESCOs)
E 2.1.2
Require the most energy-efficient equipment when replacing chillers, boilers, and other large energy-consuming equipment. Take into account lifecycle costs, not only initial capital costs of equipment
E 2.1.3
Confirm that all near-term city government energy efficiency projects within the Energy Action Plan have been completed; Conduct a progress report and include strategies into the CAAP that have not achieved full potential
E 2.1.4
Increase number of power strips; create a power down plan for unessential city owned computers
STRATEGY
E 2.2
Invest in the latest Building Energy Management Systems (BEMS) technology, upgrading 20% of municipal buildings annually with advanced energy monitoring, control, and optimization features by 2035
TIER 2: SUPPORTIVE PRIORITY SCORE: 1.13
CO-BENEFITS:
E 2.2.1
Assess the current BEMS to identify areas for improvement and determine the necessary upgrades
STRATEGIC ROADMAP
ENERGY
STRATEGY ACTION
E 2.3
Retrofit existing lighting fixtures with energy-efficient bulbs, such as LEDs, and sensory controls in 100% of municipal buildings by 2035
TIER 1: FOUNDATIONAL
PRIORITY SCORE: 2.25
CO-BENEFITS:
E 2.3.1
Implement daylight harvesting systems in two percent of municipal buildings annually to automatically adjust lighting levels based on available natural light
STRATEGIC ROADMAP
ENERGY
GOAL E 3
TRANSITION TO 100% RENEWABLE ENERGY BY 2050
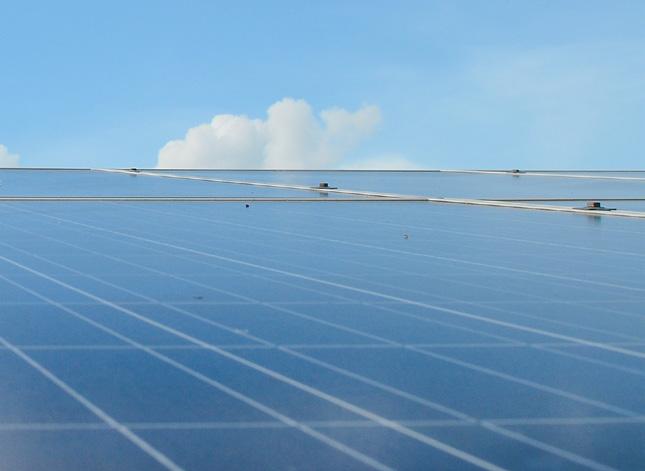
E 3.1
Explore onsite renewable energy and battery storage for City facilities STRATEGY
TIER 2: SUPPORTIVE
PRIORITY SCORE: 2.25
CO-BENEFITS:
E 3.2
Consider a residential and commercial “Bulk Purchasing” solar agreement to bring upfront costs down. Campaign: Solarize LCF (Partner with the school district)
TIER 1: FOUNDATIONAL
PRIORITY SCORE: 4.25
CO-BENEFITS:
E 3.3
Continue to provide expedited permitting for installation of residential PV solar panels and solar water heaters
TIER 2: SUPPORTIVE
SCORE: 2.63
CO-BENEFITS:
E 3.1.1
Complete feasibility analysis, procure and install additional on-site carport and/ or ground mount solar projects at 1-5 locations
E 3.1.2
Consider Town Center as initial location for a Resilience Hub (i.e. locations which are able to generate power in the wake of a power outage, distribute emergency supplies, and coordinate communication in the time of climate disaster)
E 3.1.3
Research Power Purchase agreement (PPA) pricing and Inflation Reduction Act (IRA) funding for a battery storage unit for the Town Center
E 3.2.1
Partner with solar vendors and installers to host events where residents and business owners can directly sign up to receive analyses of their homes’ solar potential
E 3.2.2
Use Solar Crowd Source to launch Solarize La Cañada Flintridge campaign
E 3.3.1
Work with City’s Building and Safety Division
STRATEGIC ROADMAP
ENERGY
STRATEGY ACTION
E 3.4
Join the Clean Power Alliance
TIER 1: FOUNDATIONAL
PRIORITY SCORE: 4.25
CO-BENEFITS:
E 3.4.1
Complete a feasibility assessment to better understand the positive impacts that this Alliance would have on local renewable energy generation
STRATEGY ACTION
E 3.5
Ban gas powered lawn equipment community-wide
TIER 2: SUPPORTIVE
PRIORITY SCORE: 1.00
CO-BENEFITS:
E 3.5.1
Coordinate an exchange program for gas powered landscaping equipment with all electric
E 3.5.2
Apply for grants that could offer subsidies for exchanging gas to all electric landscaping equipment
STRATEGY ACTION
E 3.6
Promote the Property Assessed Clean Energy Program to residents which is an innovative mechanism for financing energy efficiency and renewable energy improvements on private property
TIER 1: FOUNDATIONAL
PRIORITY SCORE: 3.75
CO-BENEFITS:
E 3.6.1
Promote through City's website
TRANSPORTATION
Transportation is the largest source of emissions within La Cañada Flintridge, with 57% of all community emissions coming from vehicle miles traveled (VMT) and 36% of municipal emissions coming from employee commutes; therefore, reducing fossil fuel vehicle travel is imperative. The strategies and actions in this section are designed to make alternatives to single-occupant, fossil fuel trips easy, convenient, and attractive to residents and visitors.
Reducing VMT in La Cañada Flintridge is difficult due to its location in the County and due to the share of trips that start or end outside the City. Much can be done to reduce short trips within the City, by encouraging walking, biking, and transit for local needs. For longer trips that contribute heavily to the total VMT inventory, but are more difficult to shift away from driving, the biggest opportunity for emissions reductions is through transitioning to Zero Emissions Vehicles (ZEVs) as quickly as possible.

STRATEGIC ROADMAP
TRANSPORTATION
GREEN BOX STRATEGIES
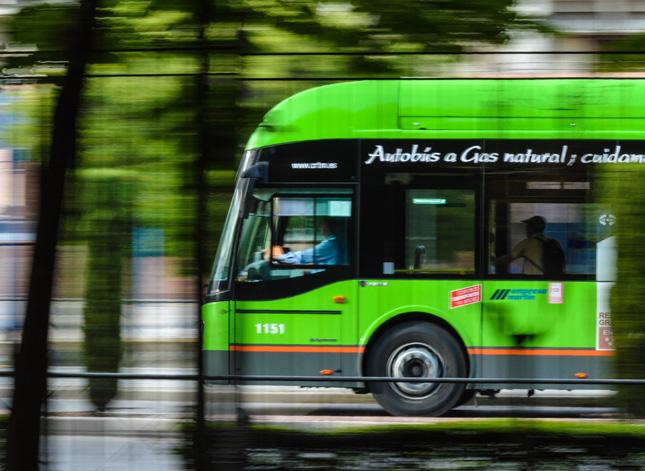
GOAL T 1
REDUCE CITY-WIDE VMT BY 1.22% BY 2040
STRATEGY ACTION
T 1.1
Work with La Cañada Flintridge schools and Jet Propulsion Laboratory to develop and implement Transportation Demand Management programs (TDM) for students and employees
TIER 2: SUPPORTIVE
PRIORITY SCORE: 2.63
CO-BENEFITS:
T 1.1.1
Encourage partnerships with private schools to develop and implement school bus programs that reduce school-related single occupancy vehicle commutes
T 1.1.2
Work with schools to encourage EV shuttle service for students living >1 mile from their neighborhood schools.
STRATEGY ACTION
T 1.2
Improve connectivity of transportation network to encourage more high-occupancy trips
TIER 2: SUPPORTIVE PRIORITY SCORE: 2.63
CO-BENEFITS:
T 1.2.1
Expand the frequency and hours of service of the LCF Shuttle
T 1.2.2
Work with LA County to develop rideshare options to LAX airport, similar to the beach bus
T 1.2.3
Assess and promote Park-n-Ride options for commuters outside of the City
VMT is only counted if the vehicle begins or ends a trip in the City. Cars and trucks passing through on the highway, who do not stop, are not part of the VMT or the City’s GHG inventory.
STRATEGIC ROADMAP
TRANSPORTATION
STRATEGY ACTION
T 1.3
Require new non-residential developments greater than 10,000 square feet or anticipated to include businesses with more than 50 employees to reduce VMT through TDM programs
TIER 2: SUPPORTIVE
PRIORITY SCORE: 2.63
CO-BENEFITS:
T 1.3.1
Work with Metro to offer an annual bus pass to all new employees who express interest
T 1.3.2
Encourage employers to provide opportunities for flex hours, compressed work week and telecommuting schedules to reduce VMT and reintroduce transportation reduction programs
STRATEGY ACTION
T 1.4
Reduce other sources of citywide vehicle miles traveled (VMT)
TIER 2: SUPPORTIVE
PRIORITY SCORE: 4.25
CO-BENEFITS:
T 1.4.1
Support Transit-Oriented Development
T 1.4.2
Promote Work-From-Home policies and infrastructure
STRATEGIC ROADMAP
GOALS AND STRATEGIES
TRANSPORTATION
GREEN BOX STRATEGIES
GOAL T 2
INCREASE EV INFRASTRUCTURE AND ADOPTION
COMMUNITY-WIDE TO REDUCE COMBUSTION
ENGINE VMT BY 25% BY 2040
T 2.1
Accelerate the transition to EVs in the community, focusing on education and making charging more accessible STRATEGY
TIER 1: FOUNDATIONAL
PRIORITY SCORE: 4.25
CO-BENEFITS:
ACTION
T 2.1.1
Determine locations for additional EV charging stations in high traffic areas around the city
T 2.1.2
Actively promote EV adoption and require EV-only parking
T 2.1.3
All new construction should have a 240-volt plug in garage or carport for level 2 charging of EVs.
STRATEGIC ROADMAP
STRATEGY ACTION GOALS AND STRATEGIES
TRANSPORTATION
GOAL T 3 PROMOTE A NO IDLING CAMPAIGN

T 3.1
Develop pilot program for anti-idling battery packs in sheriff vehicles and explore opportunities for similar initiatives in city vehicles
TIER 3: COMPLEMENTARY
PRIORITY SCORE: 1.00
CO-BENEFITS:
T 3.1.1
Extend anti-idling battery pack usage to county vehicles by 2030
T 3.1.2
Assess the feasibility of this program for other types of city vehicles
STRATEGY ACTION
T 3.2
Develop educational programs to raise public awareness about the benefits of anti-idling practices and their role in reducing greenhouse gas emissions
TIER 3: COMPLEMENTARY
PRIORITY SCORE: 1.00
CO-BENEFITS:
T 3.2.1
Launch a public education campaign on anti-idling practices by 2030
T 3.2.2
Coordinate with the schools to target pick-up lines
BUILT ENVIRONMENT
Following transportation, the City’s 295 commercial buildings contribute the second highest emission generator. Buildings offer a unique opportunity to transition to a low carbon future. Buildings can reduce emissions in two ways. First, the energy efficiency of buildings can be improved. This reduces the need for carbon emitting energy from both electricity and natural gas. Second, gas-use equipment can be switched to electrical in both commercial and residential buildings. As utilities transition to 100% carbon-free renewable energy sources, building energy use will gradually become carbon free as a result.
To effectively manage this transition, some considerations should be kept in mind. For example, as the City and community transition their vehicles from internal combustion to all electric (EVs), EV charging stations may create spikes in energy usage for commercial and residential buildings. A concerted effort will need to be made on both the supply and demand side to ensure the transition to renewables is happening in a balanced way.

STRATEGIC ROADMAP
BUILT ENVIRONMENT
GOAL BE 1
IMPROVE ENERGY BENCHMARKING OF ALL NEW AND EXISTING BUILDINGS IN THE CITY
STRATEGY ACTION
BE 1.1
Adopt an ordinance requiring energy benchmarking and/or energy-related improvements at time of lease or sale, or under other appropriate conditions of commercial sector buildings by a certain date
TIER 2: SUPPORTIVE PRIORITY SCORE: 3.75
CO-BENEFITS:
BE 1.1.1
Conduct a comprehensive analysis of existing commercial retrofit programs to determine best practices and feasibility for LCF
BE 1.1.2
Collaborate with local businesses and property owners to gain their support and participation in the program
BE 1.1.3
Develop an outreach and education program to promote the benefits of energy benchmarking and energy-efficient improvements
STRATEGY ACTION
BE 1.2
Adopt an ordinance requiring new commercial or mixed-use developments over 5,000 square feet meet a minimum LEED Neighborhood Development standard
TIER 2: SUPPORTIVE PRIORITY SCORE: 1.63
CO-BENEFITS:
BE 1.2.1
Develop a partnership with a certified LEED consultant to provide training and resources to local developers
BE 1.2.2
Establish a recognition program for developments that meet or exceed the minimum LEED standard
STRATEGIC ROADMAP
BE 1.3
BUILT ENVIRONMENT
Pass an ordinance to require all appropriate new construction be designed for net-zero energy
TIER 2: SUPPORTIVE PRIORITY SCORE: 3.25
CO-BENEFITS:
BE 1.3.1
Launch a public awareness campaign to promote the benefits and feasibility of net-zero energy buildings
STRATEGY ACTION
BE 1.4
Require pre-wiring for future solar photovoltaics and other renewable on-site power generation systems in new home construction
TIER 2: SUPPORTIVE PRIORITY SCORE: 3.13
CO-BENEFITS:
BE 1.4.1
Collaborate with local solar and renewable energy companies to provide resources and assistance to homeowners; pre-approve vendors
BE 1.4.2
Promote induction stovetops
BE 1.4.3
Offer incentives or rebates for homeowners who install renewable energy systems in their homes
STRATEGIC ROADMAP
BUILT ENVIRONMENT
GREEN BOX STRATEGIES
GOAL BE 2
PROMOTE NATURAL GAS ALTERNATIVES TO COMMERCIAL AND RESIDENTIAL CUSTOMERS USING A HEAT PUMP PROMOTIONAL CAMPAIGN

BE 2.1
Promote rebates and financing programs which would encourage adoption of ground- and air-source heat pump systems for space and water heating in both residential and commercial settings
TIER 1: FOUNDATIONAL
PRIORITY SCORE: 4.25
CO-BENEFITS:
BE 2.2
Complete a community-wide building electrification study and establish a long-term implementation plan (Phase 1 and Phase 2) STRATEGY
TIER 1: FOUNDATIONAL
PRIORITY SCORE: 4.25
CO-BENEFITS:
BE 2.1.1
Partner with the Climate Coalition to promote campaign
BE 2.1.2
Publicize on City’s website and social media accounts
BE 2.1.3
Incentivize with reduced permit fees
BE 2.2.1
Replace natural gas system during building retrofit projects and at equipment failure
BE 2.2.2
As outdated electronic appliances and office equipment are phased out of City facilities, replace them with energy-efficient models
STRATEGIC ROADMAP
BUILT ENVIRONMENT
STRATEGY ACTION
BE 2.3
Incorporate advanced energy design features where possible and practical, including daylighting, passive solar heating and shading, natural ventilation in all new construction
TIER 2: SUPPORTIVE
PRIORITY SCORE: 3.13
CO-BENEFITS:
BE 2.3.1
Follow the Passive House standards
BE 2.3.2
Incentivize with reduced permit fees
STRATEGY ACTION
BE 2.4
Develop a Green Revolving Fund to establish a baseline of savings across municipal operations
TIER 3: COMPLEMENTARY PRIORITY SCORE: 1.00
CO-BENEFITS:
BE 2.4.1
Track energy efficiency savings and reinvest those savings into new energy efficiency projects
RESOURCE CONSERVATION
While waste disposal, water use, and consumption are all essential activities in the community, disposing of natural resources generates community GHG emissions, albeit a small amount. The effects of these activities can be reduced by diverting waste from the landfill, conserving water, and promoting sustainable consumption patterns.
La Cañada Flintridge has access to many resources to better support a circular economy. The overarching approach to resource conservation is to create a consistent framework of outreach resources and developing public private partnerships to disseminate those resources. Conservation measures are about changing community habits and connecting them with the right solutions.
CO-BENEFITS
STRATEGIC ROADMAP
RESOURCE CONSERVATION
GOAL RC 1 TRANSITION LANDSCAPING TO DROUGHT TOLERANT SOLUTIONS

STRATEGY ACTION
RC 1.1
Implement water usage restrictions during drought periods
TIER 2: SUPPORTIVE PRIORITY SCORE: 2.00
CO-BENEFITS:
RC 1.1.1
Introduce a citywide ordinance by 2028, limiting residential water use during declared drought months
RC 1.1.2
Increase education and awareness of water efficiency programs through Calwater and other organizations
RC 1.2
Promote the conversion of grass lawns to drought-resistant landscaping STRATEGY ACTION
TIER 2: SUPPORTIVE PRIORITY SCORE: 2.00
CO-BENEFITS:
RC 1.2.1
Increase education and awareness of water efficiency programs through Calwater and other organizations
RC 1.2.2
Develop a local program modeled on LA County's Cash for Grass Rebate Program
RC 1.2.3
Launch an educational campaign to promote the benefits of drought-resistant landscaping
STRATEGIC ROADMAP
RESOURCE CONSERVATION
GOAL RC 2
IMPLEMENT WATER EFFICIENT MEASURES IN ALL NEW CONSTRUCTION BY 2035.

RC 2.1
Initiate low-flow infrastructure policy in all new construction STRATEGY ACTION
TIER 2: SUPPORTIVE
PRIORITY SCORE: 1.00
CO-BENEFITS:
RC 2.1.1
Monitor as part of building enforcement
RC 2.2
Initiate native landscaping policy in all new construction STRATEGY ACTION
TIER 2: SUPPORTIVE PRIORITY SCORE: 1.50
CO-BENEFITS:
RC 2.2.1
Monitor as part of building zoning code enforcement
STRATEGIC ROADMAP
RESOURCE CONSERVATION
GOAL RC 3
ACHIEVE 20% OF WATER SUPPLY SOURCED FROM RECYCLED WATER BY 2035 FROM A 2019 BASELINE

STRATEGY ACTION
RC 3.1
Require irrigation with recycled water for common landscaping in single-family developments
TIER 2: SUPPORTIVE
PRIORITY SCORE: 1.50
CO-BENEFITS:
RC 3.1.1
Promote California Water Board's Water Recycling Funding Program
STRATEGY ACTION
RC 3.2
Assess recycled water infrastructure
TIER 3: COMPLEMENTARY PRIORITY SCORE: .50
CO-BENEFITS:
RC 3.2.1
Collaborate with local water utilities to support the use of recycled water
STRATEGIC ROADMAP
RESOURCE CONSERVATION
GOAL RC 4
ACHIEVE 50% REDUCTION IN CITY WATER USAGE BY 2035 FROM 2019 BASELINE.

RC 4.1
Expand low flow and motion sensor infrastructure in all city-owned buildings STRATEGY ACTION
TIER 2: SUPPORTIVE PRIORITY SCORE: .50
CO-BENEFITS:
RC 4.1.1
Research the cost and requirements for implementing low-flow and motion sensor infrastructure in city-owned buildings
RC 4.1.2
Conduct a comprehensive audit of water fixtures in city-owned buildings to identify those that can be replaced with low-flow and motion sensor alternatives
RC 4.2
Implement city-wide water efficiency measures in municipal buildings STRATEGY ACTION
TIER 2: SUPPORTIVE
PRIORITY SCORE: .50
CO-BENEFITS:
RC 4.2.1
Conduct a comprehensive water audit of municipal buildings to identify areas of high water usage and inefficiency
RC 4.2.2
Implement regular maintenance checks to ensure that water-saving appliances and fixtures are functioning optimally and leaks are quickly repaired
STRATEGY ACTION
RC 4.3
Upgrade the City's landscaping to reduce water usage
TIER 2: SUPPORTIVE PRIORITY SCORE: .50
CO-BENEFITS:
RC 4.3.1
Retrofit all city-owned irrigation systems with water-saving technology, such as drip irrigation and rain sensors
STRATEGIC ROADMAP
RESOURCE CONSERVATION
GOAL RC 5
AUTHOR A FRANCHISE AGREEMENT FOR THE ENTIRE CITY AND INCLUDE IDENTIFIED ACTIONS AS PART OF THE CONTRACT REQUIREMENTS

STRATEGY ACTION
RC 5.1
Adopt a program or ordinance to encourage or require waste audits and waste reduction plans for existing and/ or new commercial developments (including JPL and La Cañada School District facilities)
TIER 3: COMPLEMENTARY
PRIORITY SCORE: 1.00
CO-BENEFITS:
RC 5.1.1
Build into waste hauler agreement a stipulation that requires them to support commercial outreach
STRATEGY ACTION
RC 5.2
Require recycling at special events, adding language in special event permit
TIER 3: COMPLEMENTARY
PRIORITY SCORE: 1.00
CO-BENEFITS:
RC 5.2.1
Work with Administration Department
STRATEGIC ROADMAP
RESOURCE CONSERVATION
GOAL RC 6
UPHOLD THE STATE MANDATE SB 1383 REQUIREMENTS AROUND FOOD WASTE AND FOOD RECOVERY PROGRAMS

STRATEGY ACTION
RC 6.1
Work with La Cañada Unified School District to implement food waste recycling and composting programs for all facilities and consider incorporating them into the educational curriculum
TIER 3: COMPLEMENTARY
PRIORITY SCORE: 1.00
CO-BENEFITS:
RC 6.1.1
Form a collaborative task force with representatives from the City and the school district to plan and implement food waste recycling and composting programs
RC 6.1.2
Build into new waste hauler Franchise Agreement
STRATEGY ACTION
RC 6.2
Educate private property owners about mandatory organic collection
TIER 3: COMPLEMENTARY
PRIORITY SCORE: 1.00
CO-BENEFITS:
RC 6.2.1
Partner with waste hauler and write CalRecycle grants to provide seed funding for collection buckets and backyard composting infrastructure
RC 6.2.2
Organize regular composting workshops, in collaboration with waste hauler, to provide hands-on training and technical assistance to residents
RC 6.2.3
Lunch a city-wide campaign promoting home composting, highlighting available resources, and celebrating the efforts of residents who have successfully started composting
STRATEGIC ROADMAP
RESOURCE CONSERVATION
GOAL RC 7
REDUCE CITY GENERATED LANDFILL WASTE 90% BY 2035; 95% FOR CONSTRUCTION AND DEMOLITION MATERIALS

STRATEGY ACTION
RC 7.1
Transition at least one purchased product annually to a more sustainable option until 2035
TIER 2: SUPPORTIVE PRIORITY SCORE: .50
CO-BENEFITS:
RC 7.1.1
Use the information from the pre waste audit to identify one item
GREEN COMMUNITY
Living in a green community contributes to an improved quality of life by providing a range of benefits for residents, including improved health and wellbeing, increased morale, and cleaner air. There is a mental health aspect to walking the streets lined with old growth trees and having access to a connectivity of open space. Climate change has refocused our attention on providing a way of living that places people’s long term needs as a core value. These projects also indirectly reduce GHG emissions. While the measures and actions in this focus area identify only minor direct emissions reductions, they support the reduced energy or fuel consumption goals underlying numerous other CAAP strategies.

CO-BENEFITS KEY
STRATEGIC ROADMAP
GREEN COMMUNITY
GOAL GC 1
ENHANCE CITYWIDE STORMWATER MANAGEMENT AND URBAN GREENING EFFORTS
STRATEGY ACTION
GC 1.1
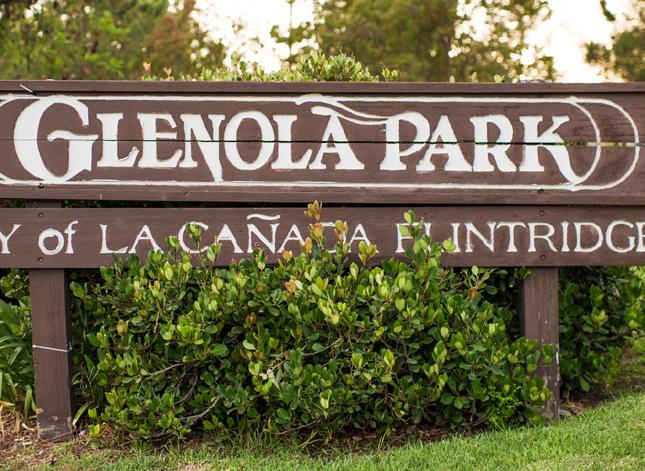
Write a Stormwater Management Plan in partnership with LA County
TIER 3: COMPLEMENTARY
PRIORITY SCORE: 1.50
CO-BENEFITS:
GC 1.1.1
Establish a working group composed of city and county representatives to guide the development of the Stormwater Management Plan
GC 1.1.2
Complete a comprehensive assessment of the City's current stormwater infrastructure, vulnerabilities, and opportunities for improvement
GC 1.1.3
Finalize and adopt the Stormwater Management Plan, including clear strategies, timelines, and responsibilities for implementation
STRATEGY ACTION
GC 1.2
Replace turf in street medians with native plants
TIER 3: COMPLEMENTARY
PRIORITY SCORE: .50
CO-BENEFITS:
GC 1.2.1
Conduct an assessment of all city medians to determine suitability for conversion to native plants
GC 1.2.2
Develop a phased plan for the replacement of turf with native plants, considering factors like traffic safety, maintenance needs, and plant availability
GC 1.2.3
Begin the implementation of the phased plan, replacing turf with native plants in selected medians, and monitor the effectiveness of these conversions in improving stormwater management
STRATEGIC ROADMAP
GREEN COMMUNITY
GOAL GC 2
PRESERVE, ENHANCE, AND ACQUIRE
ADDITIONAL GREENSPACE
STRATEGY ACTION
GC 2.1
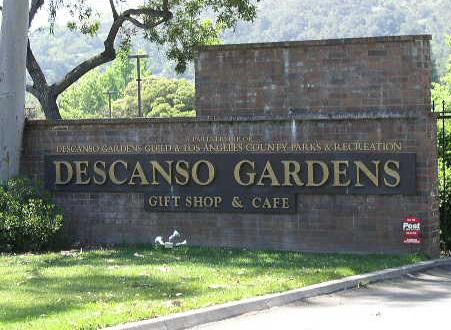
Increase green space owned by the City by 3 acres by 2035
TIER 3: COMPLEMENTARY
PRIORITY SCORE: 1.50
CO-BENEFITS:
GC 2.1.1
Conduct a comprehensive survey to identify potential areas for green space expansion
GC 2.1.2
Develop and implement a phased plan for green space expansion
GC 2.1.3
Investigate funding mechanisms such as impact fees
STRATEGY ACTION
GC 2.2
Implement programs to preserve existing green spaces
TIER 3: COMPLEMENTARY PRIORITY SCORE: 1.50
CO-BENEFITS:
GC 2.2.1
Develop a Green Space Preservation Plan, outlining policies and regulations to prevent the degradation or loss of existing green spaces
GC 2.2.2
Set up routine maintenance schedules and assign responsibilities to ensure the healthy upkeep of current green spaces
GC 2.2.3
Continue to prioritize tree planting
STRATEGY ACTION
GC 2.3
Enhance biodiversity in existing green spaces
TIER 3: COMPLEMENTARY PRIORITY SCORE: 1.50
CO-BENEFITS:
GC 2.3.1
Work with the Arroyos and Foothill Conservancy to create a Biodiversity Enhancement Plan; discuss location of Pollinator Garden
STRATEGIC ROADMAP
GREEN COMMUNITY
GOAL GC 3
ENHANCE THE CITY'S CAPACITY TO IMPLEMENT, MONITOR, AND UPDATE THE CAAP

STRATEGY ACTION
GC 3.1
Appoint a Commission on the Environment
TIER 1: FOUNDATIONAL
PRIORITY SCORE: 5.25
CO-BENEFITS:
GC 3.1.1
Develop a detailed job description for the CAAP Coordinator position
GC 3.1.2
Appoint five qualified community members to the Commission and a Sustainability Officer to work with City staff
GC 3.1.3
Conduct interviews and launch Commission
STRATEGY ACTION
GC 3.2
Strengthen Interdepartmental Collaboration and Communication
TIER 1: FOUNDATIONAL
PRIORITY SCORE: 5.25
CO-BENEFITS:
GC 3.2.1
Building on the existing CAP subcommittee, establish a CAAP Task Force consisting of representatives from relevant city departments, JPL and the School District, to support the Commission
GC 3.2.2
Create a regular meeting schedule for the Task Force to ensure coordination and information sharing
GC 3.2.3
Use the Climate Action Tracker for internal tracking, sharing, and reporting on progress across different departments
STRATEGIC ROADMAP
GREEN COMMUNITY
GOAL GC 4
FOSTER GREEN BUSINESS PRACTICES
STRATEGY ACTION
GC 4.1
Develop a Green Business Program that begins with easy, low-cost initiatives to get businesses invested, such as a food recovery program
TIER 2: SUPPORTIVE PRIORITY SCORE: 3.13
CO-BENEFITS:
GC 4.1.1
Work with the Chamber of Commerce to develop a Green Business Program starting with low-cost initiatives by 2027
GC 4.1.2
Organize an annual event to recognize green businesses in the City
GC 4.1.3
In concert with the Chamber of Commerce, host quarterly workshops, providing Best Practices that will help businesses transition to greener practices
STRATEGY ACTION
GC 4.2
Utilize community support and incentives to motivate businesses to join the Green Business Program, understanding that businesses may be hesitant due to existing cost barriers
TIER 3: COMPLEMENTARY PRIORITY SCORE: 3.13
CO-BENEFITS:
GC 4.2.1
Work with the Chamber of Commerce to develop a marketing campaign to recruit ten new businesses to the Green Business Program each year beginning in 2027
GC 4.2.2
Establish a mentorship program where existing members help new businesses transition
GC 4.2.3
Offer incentives for businesses that join the Green Business Program
STRATEGY ACTION
GC 4.3
Support networking sessions and resources to help businesses share best practices
TIER 3: COMPLEMENTARY PRIORITY SCORE: 3.13
CO-BENEFITS:
GC 4.3.1
Partner with the Chamber of Commerce to host quarterly networking sessions for businesses to share best practices each year
GC 4.3.2
Develop a digital platform for green businesses to connect and share resources
GC 4.3.3
Highlight success stories of green businesses in the City's official communications
STRATEGIC ROADMAP
GREEN COMMUNITY
GREEN BOX STRATEGIES
GOAL GC 5
INTEGRATE CLIMATE ACTION AND ADAPTATION INTO CITY FUNCTIONS
STRATEGY ACTION
GC 5.1
Incorporate climate action and adaptation into city policy, budget, planning, and internal standards
TIER 1: FOUNDATIONAL
PRIORITY SCORE: 5.25
CO-BENEFITS:
GC 5.1.1
Consider GHG emission impacts in all new city projects
GC 5.1.2
Incorporate climate preparedness into city programs, operations, and maintenance protocols
GC 5.1.3
Integrate CAAP goals into city projects as an order of business
CLIMATE RESILIENCE
From a climate change perspective, natural variability in the climate and weather produce extreme events like droughts, wildfires, and floods over long time periods. While natural, living systems respond to and even rely on these phenomena, our dense settlement and production of greenhouse gas emissions have greatly changed climate hazards and their impacts.
From a resilient community perspective, climate impacts will not be felt equally. Some populations are more vulnerable to climate events because there is a lack of the physical or mental ability to adapt to changing conditions. Isolated individuals have a more difficult time receiving warnings and emergency services and may depend on sources of food, water, and energy that are more subject to interruption. In addition, residents with physical limitations may need extra time and/ or assistance to react.

CO-BENEFITS KEY
STRATEGIC ROADMAP
CLIMATE RESILIENCE
GREEN BOX STRATEGIES
GOAL CR 1
BE PREPARED FOR CLIMATE CHANGE
STRATEGY
CR 1.1
Update the local Hazard Mitigation Plan every five years per state requirements
TIER 2: SUPPORTIVE PRIORITY SCORE: 3.13
CO-BENEFITS:
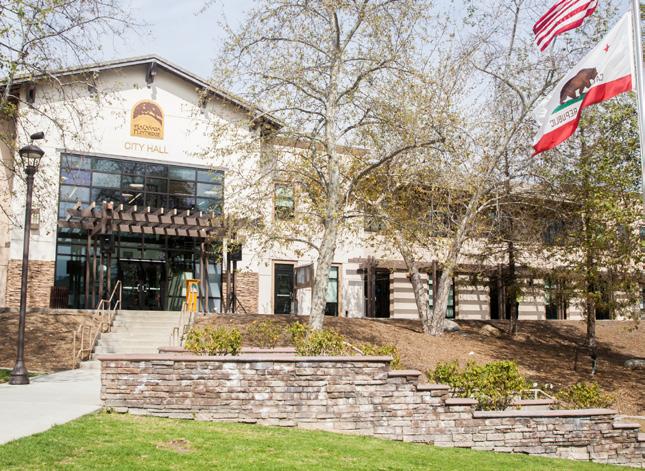
ACTION
CR 1.2.1
Implement data collection mechanisms
CR 1.2.2
Write and disseminate the local Hazard Mitigation Plan to relevant stakeholders, including local government, community groups, and the public, and make it accessible online for transparency and awareness
STRATEGIC ROADMAP
CLIMATE RESILIENCE
GREEN BOX STRATEGIES
GOAL CR 2
UNDERSTAND AND REDUCE PHYSICAL RISK

STRATEGY ACTION
CR 2.1
Consider heat as a primary risk to the City
TIER 2: SUPPORTIVE PRIORITY SCORE: 3.13
CO-BENEFITS:
CR 2.1.1
Conduct heat study/mapping to identify areas that would be considered Urban Heat Islands
CR 2.1.2
Enact reflectivity standards for asphalt and ground level surfaces; enact reflectivity/green roof standards for roofs
STRATEGIC ROADMAP
CLIMATE RESILIENCE
GREEN BOX STRATEGIES
GOAL CR 3
EDUCATE AND PROTECT
RESIDENTS
STRATEGY ACTION
CR 3.1
Create a "Fire Ready" program to help residents understand how to create defensible space on their property
TIER 2: SUPPORTIVE PRIORITY SCORE: 3.13
CO-BENEFITS:
CR 3.1.1
Work with LA County Fire Department to facilitate this program
CR 3.1.2
Develop and launch the "Fire Ready" program with community outreach and initial workshops
IMPLEMENTING THE CAAP
Sustainability is inherently wide-ranging and not every action can be implemented at once. Many of the actions will be dependent upon the allocation of staff time and resources, and budget prioritization. The Climate Action tracker identifies a responsible department for each strategy and offers timeframes and relative costs associated with each policy. Not everything will necessarily be easy or work perfectly the first time, and perseverance will be important. It will also be important to maintain flexibility in implementing the CAAP. As technologies, business models, and political agendas across all levels of government evolve, La Cañada Flintridge will need to remain flexible in “when” and “how” it implements the actions in this plan. As costs and feasibility change, the City will periodically evaluate and adjust course as necessary. Similarly, as progress towards key targets is tracked, the City may need to scale up or down its efforts, depending on the results observed. The City should update the CAAP in 2029 and 2034, and report every year on progress towards their goals.
IMPLEMENTING THE CAAP
MANAGEMENT APPROACH
A Commission for the Environment will be appointed by the City Council to act as a citizen advisory board and be the oversight committee for the CAAP’s implementation. Modeled on the City's Investment & Financing Advisory Committee and City Treasurer position, it will be composed of five appointed community members and led by an appointed Sustainability Officer who works with the City's CAAP Coordinator (employee or consultant). The Commission for the Environment will also initiate a Task Force composed of department and facility managers who are instrumental in transitioning policies and programs that better support the CAAP.
This Sustainability Officer will be paid a stipend and will ensure that the CAAP remains on time and on budget. The Sustainability Officer will work closely with the CAAP Coordinator to monitor implementation progress using the Climate Action Tracker and will report to the City Council on a monthly progress. As part of monthly progress reports, the Commission for the Environment will evaluate the effectiveness of each strategy to ensure that anticipated emissions reductions are occurring. In the event that reductions do not occur as expected, the Commission for the Environment, Sustainability Officer, and CAAP Coordinator can modify and add policies or actions to ensure the target is achieved.
BUDGET
Securing the necessary funding to effectively execute the CAAP demands a diverse range of funding strategies and avenues. An integral facet of this financial approach is identifying potential external funding sources, particularly for actions that require additional support. Recognizing that certain strategies might surpass the City's current resources, tapping into external funding becomes essential. Within this framework, specific funding sources are identified where known.
The implementation year for each strategy is selected based on the prioritization score, as well as the Top 10 commitments, as introduced in the CAAP’s Executive Summary. An imminent implementation year signifies a high prioritization score for that strategy, while a later year means a comparatively lower score.
The table below (D) outlines the financial blueprint for the CAAP. The cost estimates are indicative only; they are based on preliminary assessments, comparisons with similar programs, and expert input and are meant to provide a rough order of magnitude evaluation. For example, several of the strategies involve efforts of Ciy staff. In these cases a percentage of a staff’s time, reflected as a portion of a “full time equivalent” has been estimated. In other cases, estimated costs of newly purchased goods and services are used.1
1 The full description for all costs has been provided to the City, in a Climate Action Tracker, which accompanied this CAAP, and is available upon request.
E 1.1 Compile a list of funding sources that local residents, businesses or the City could potentially access to fund energy audits
E 3.2 Consider a residential and commercial “Bulk Purchasing” solar agreement to bring upfront costs down. Campaign: Solarize LCF (Partner with the school district)
E 3.4 Join the Clean Power Alliance
T 2.1 Accelerate the transition to EVs in the community, focusing on reducing costs and making charging more accessible
T 1.4 Reduce other sources of citywide vehicle miles traveled (VMT)
BE 2.2 Complete a building community-wide electrification study and establish a long-term implementation plan (Phase 1 and Phase 2)
GC 3.1 Appoint a Commission on the Environment
GC 3.2 Strengthen Interdepartmental Collaboration and Communication
E 3.6 Promote the Property Assessed Clean Energy Program to residents
BE 1.1 Adopt an ordinance requiring energy benchmarking and/or energy-related improvements at time of lease or sale, or under other appropriate conditions of commercial sector buildings by a certain date
BE 1.3 Pass an ordinance to require all appropriate new construction be designed for net-zero energy
and Capital Budgets
U.S. DOE Programs
California Public Utilities Commission (CPUC) Programs
U.S. Department of Energy (DOE) Programs
California Energy Commission (CEC) Programs State or Federal Grants
and Capital Budgets
and
California Energy Commission (CEC) Programs
U.S. Department of Energy (DOE) Programs
U.S. Environmental Protection Agency (EPA) Programs
Other State and Federal Grants
Operating and Capital budgets
Operating and Capital budgets
State or Federal Grants
BE 1.4 Require pre-wiring for future solar photovoltaics and other renewable on-site power generation systems in new home construction
BE 2.1 Promote natural gas alternatives to commercial and residential customers using a Heat Pump Promotional Campaign
GC 4.1 Develop a Green Business Program that begins with easy, low-cost initiatives to get businesses invested, such as a food recovery program.
GC 4.2 Utilize community support and incentives to motivate businesses to join the green business program, understanding that businesses may be hesitant due to current financial struggles.
GC 4.3 Support networking sessions and resources to help businesses share best practices
CR 1.1 Update the local Hazard Mitigation Plan every five years per state requirements
CR 2.1 Consider heat as a primary risk to the City
CR 3.1 Create a "Fire Ready" program to help residents understand how to create defensible space on their property
BE 2.3 Incorporate advanced energy design features where possible and practical, including daylighting, passive solar heating and shading, natural ventilation in all new construction
California Public Utilities Commission (CPUC) Programs
U.S. Department of Energy (DOE) Programs
California Energy Commission (CEC) Programs
State or Federal Grants
Public Utilities Commission (CPUC) Programs
Operating and Capital budgets
California Green Business Network (CAGBN) Funding
and Capital budgets
and Capital budgets
and Capital budgets
and Capital budgets
E 1.2 Partner with energy service providers to host energy efficiency fairs, workshops, and demonstrations
E 2.1 Continue energy conservation measures in municipal operations; Revisit 2013 Energy Action Plan
T 1.1 Work with La Cañada Flintridge schools and JPL to develop and implement Transportation Demand Management (TDM) programs for students and employees
T 1.2 Improve connectivity of transportation network to encourage more high-occupancy trips
T 1.3 Require new non-residential developments greater than 10,000 square feet or anticipated to include businesses with more than 50 employees to reduce VMT through TDM programs
E 2.3 Retrofit existing lighting fixtures with energy-efficient bulbs, such as LEDs, and sensory controls in 100% of municipal buildings by 2035
E 3.1 Explore onsite renewable energy and battery storage for city facilities
Southern California Edison Rebates
California Public Utilities Commission (CPUC) Programs
Green Revolving Funds
U.S. Department of Energy (DOE) Programs
State and Federal Grants
South Coast Air Quality Management District Programs
California Department of Transportation (Caltrans) Programs
Los Angeles County Metropolitan Transportation Authority Programs
California State Transportation Agency (CalSTA) Programs
California Department of Transportation (Caltrans) Program
and Capital budgets
California Energy Commission (CEC) Programs
U.S. Department of Energy (DOE) Programs
U.S. Environmental Protection Agency (EPA) Programs
Other State and Federal Grants
California Energy Commission (CEC) Programs
California Office of Emergency Services (CalOES) Programs
Explore FEMA grants Programs
Operating and Capital budgets
U.S. Department of Energy (DOE) Programs
Other State and Federal Grants
E 3.3 Continue to provide expedited permitting for installation of residential PV solar panels and solar water heaters
BE 1.2 Adopt an ordinance requiring new commercial or mixeduse developments over 5,000 square feet meet a minimum LEED Neighborhood Development standard
RC 1.1 Implement water usage restrictions during drought periods
RC 1.2 Promote the conversion of grass lawns to droughtresistant landscaping
RC 2.2 Initiate native landscaping policy in all new construction
RC 3.1 Require irrigation with recycled water for common landscaping in single-family developments
GC 1.1 Write a Stormwater Management Plan in partnership with the County
GC 2.1 Increase green space owned by the City by 3 acres by 2035
IMPLEMENTING THE CAAP
and
and Capital budgets
and Capital budgets
GC 2.2 Implement programs to preserve existing green spaces
GC 2.3 Enhance biodiversity in existing green spaces
$75,000 California Natural Resources Agency (CNRA) Programs
United States Environmental Protection Agency (EPA) Programs
Other state and federal programs
California Natural Resources Agency (CNRA) Programs
United States Environmental Protection Agency (EPA) Programs
Other state and federal programs
California Natural Resources Agency (CNRA) Programs
Operating and Capital budgets
Other state and federal programs
E 2.2 Invest in the latest BEMS technology, upgrading 20% municipal buildings annually with advanced energy monitoring, control, and optimization features by 2029
T 3.1 Develop pilot program for anti-idling battery packs in sheriff vehicles and explore opportunities for similar initiatives in city vehicles
T 3.2 Develop educational programs to raise public awareness about the benefits of anti-idling practices and their role in reducing greenhouse gas emissions
BE 2.4 Continue with energy efficiency & establish baseline of savings across municipal operations (GRF)
E 3.5 Ban gas powered lawn equipment
RC 2.1 Initiate Low flow infrastructure policy in all new construction
RC 5.3 Require recycling at special events, such as through special event permit conditions
IMPLEMENTING THE CAAP
$25,000
$15,000
$10,000
RC 6.1 Work with La Cañada Unified School District to implement food waste recycling and composting programs for all facilities and consider incorporating them into the educational curriculum. 2030 $100,000
RC 6.2 Educate private property owners about mandatory organic collection
Commission (CEC) Programs
State and Federal Grants
and
$20,000
and Capital budgets
U.S. Department of Energy (DOE) Programs
California Energy Commission (CEC) Programs
State or Federal Grants
South Coast Air Quality Management District Rebates Operating and Capital budgets
and Capital budgets
and Capital budgets
California Department of Resources Recycling and Recovery (CalRecycle) Programs
California Climate Investments (CCI) Programs
U.S. Environmental Protection Agency (EPA) Programs
U.S. Composting and Food Waste Reduction (CFWR) Programs
Other State and federal grants
California Department of Resources Recycling and Recovery (CalRecycle) Programs
California Climate Investments (CCI) Programs
Operating and Capital budgets
RC 3.2 Assess recycled water infrastructure
IMPLEMENTING THE CAAP
RC 4.1 Expand low flow infrastructure in all city-owned buildings
RC 4.2 Implement city-wide water efficiency measures in municipal buildings
RC 4.3 Upgrade city landscaping to reduce water usage
RC 5.1 Adopt a program or ordinance to encourage or require waste audits and waste reduction plans for existing and/ or new commercial developments (including JPL and La Cañada School District facilities)
RC 7.1 Transition at least one purchased product annually to a more sustainable option until 2028
$100,000
California Department of Water Resources (DWR) Programs
California State Water Resources Control Board Programs
United States Environmental Protection Agency (EPA) Programs
Operating and Capital budgets
California Department of Water Resources (DWR) Programs
United States Environmental Protection Agency (EPA) Programs
Operating and Capital budgets
California Department of Water Resources (DWR) Programs
United States Environmental Protection Agency (EPA) Programs
Other state or federal grants
Operating and Capital budgets
California Department of Water Resources (DWR) Programs
United States Environmental Protection Agency (EPA) Programs
Operating and Capital budgets
$10,000 Operating and Capital budgets
GC 1.2 Replace turf in street medians with native plants 2031 $70,000
Table D: Funding Plan
California Natural Resources Agency (CNRA) Programs
United States Environmental Protection Agency (EPA) Programs
Other state and federal programs
Type of
Taxes
Fees
Funds
IMPLEMENTING THE CAAP
FUNDING
Funding is available and can be obtained from local taxes and fees, utility fees, and regional, State, and federal grants. Table E describes several sources of funding that La Cañada Flintridge has the prerogative to create or adjust. INTERNAL FUNDING MECHANISMS
Funding
Bonds
Examples
Open Space Preservation Tax
Property Tax Increment
Utility User Tax
Community Services/Facilities
District Special Taxes
Parking Fee
Development Fee
Impact Fees
Congestion Pricing
Enterprise Fund
Green Revolving Fund
Green Bond
Description
Tax on properties for preserving city open spaces and green areas
Incremental property tax revenue allocated for development projects
City tax on utility service consumption such as natural gas
Levied on property owners to fund neighborhood enhancements
User fee for City-owned parking facilities
Fee paid by developers for funding City infrastructure
Paid by property owners who are seeking building permits.
User fee to reduce traffic congestion and raise funds
Self-sustaining funds generated from City-owned enterprises
An internal fund where savings from efficiency projects are reinvested in future green initiatives.
Bonds for capital improvements with an environmental focus
Type of Funding
Grants
Loans
Tax credits & deductions
IMPLEMENTING THE CAAP
GOVERNMENT PROGRAMS
Examples
Various State and Federal Grants, like CalRecycle, Caltrans, U.S. DOE Grants, U.S. EPA Grants, U.S. DOT Grants
Energy Efficiency Loans
179D for energy efficiency initiatives
Inflation Reduction Act
Rebates
Energy-Efficiency Rebates, Renewable Energy Rebates, Water-Saving Rebates, Transportation Rebates, Landscaping Rebates, Building Retrofits, Small Business Rebates
Description
Grants available for specific projects, often requiring matching funds or in-kind contributions
Low-interest loans provided by state or federal agencies for energy-efficiency or renewable energy projects
Provides a tax deduction for building owners or designers who implement energy-efficient improvements in commercial buildings. Non-profit universities can claim a deduction of up to $1.88 per square foot for improvements
Comprehensive set of financial incentives to accelerate the transition to clean energy. Includes Investment and Production Tax Credits, as well as credits for clean vehicles and alternative fueling infrastructure
Rebates from state and federal agencies incentivize sustainable and energy-efficient practices, such as the use of energy-efficient appliances or renewable energy systems. These rebates typically offset the initial cost of the product or service, making them more accessible
Type of Funding
IMPLEMENTING THE CAAP
THIRD PARTY SOLUTIONS
Examples
Energy Performance Contracts (EPC) Energy Efficiency Agreement
Public-Private Partnerships (PPP) Renewable Energy Partnership
Infrastructure as a Service (IAAS) Energy Infrastructure Lease
Description
Contracts for energy upgrades in exchange for cash flows from a portion of savings
City partnerships with private companies for energy projects
Leasing energy infrastructure from private entities for funds
On-bill financing
Comfortably CA, SoCalGas On-Bill Financing Program, etc.
Utilities in California offer on-bill financing for certain energy efficiency and renewable energy projects. These programs enable residential and commercial customers to finance improvements and repay the loan through their monthly utility bill
Table E: Possible Funding Mechanisms
CONCLUSION
The goals of this plan are to set the City on a path towards carbon neutrality and climate resilience. The goals are ambitious, but ones that we believe we can achieve. If we achieve these goals—carbon neutrality, equity, sustainability, resilience—we will create a community that is healthy, connected, and vibrant. Please fully participate in implementing this CAAP, and see Appendix C presenting personal actions, entitled “What Can I Do Now?" to find suggestions for simple actions each individual can take to help.
IMPLEMENTING THE CAAP
ACRONYMS
ABAU: adjusted business-as-usual
BAU: business-as-usual
Btu: British thermal unit
CAFE Standards: Corporate Average Fuel Economy Standards
CARB: California Air Resources Board
CAP: Climate Action Plan
C&D: construction and demolition
CFI: Charging and fueling infrastructure
CH4: methane
CO2: carbon dioxide
CO2e: carbon dioxide equivalent
DEQ: Department of Environmental Quality
DERA: Diesel Emissions Reduction Act
DOT: Department of Transportation
DOE: Department of Energy
EIA: Energy Information Administration
EIE: Environmental Insights Explorer
EILP: Energy Improvement Loan Program
EPC: Energy Performance Contracts
ERA: Energy Improvements in Rural or Remote Areas
ESCO: Energy Service Company
EV: electric vehicle
GHG: greenhouse gas
GI: green infrastructure
GWP: global warming potential
HB: House Bill
HVAC: heating, ventilation, & air conditioning
ICLEI: International Council for Local Environmental Initiatives
IPCC: Intergovernmental Panel on Climate Change
IRA: Inflation Reduction Act
ITC: Investment Tax Credit
kg N: kilograms of nitrogen
kW: kilowatt
kWh: kilowatt hours
LEED: Leadership in Energy and Environmental Design
LMI: low-to-moderate income
LPG: Liquid Petroleum Gas
MMBtu: one million British thermal units
MSW: municipal solid waste
MTCO2e: metric tons carbon dioxide equivalent
MW: megawatt
MWH: megawatt hours
N2O: Nitrous oxide
PACE: Property Assessed Clean Energy
PFCs: Perfluorocarbons
PPP: public-private partnerships
PTA: Parent-Teacher Association
PTC: Production Tax Credit
RAISE: Rebuilding American Infrastructure with Sustainability and Equity
RECs: Renewable Energy Certificates
RFP: request for proposals
RSPC: Renewable Energy Special Projects Committee
SF6: Sulfur hexafluoride
SFC: specific fuel consumption
TDM: transportation demand management
USI: Utility Savings Initiative
VMT: vehicle miles traveled

APPENDICES
APPENDIX A: Vulnerability Assessment
Prepared by:
1. Executive Summary
The City of La Cañada Flintridge (La Cañada) is located in the Crescenta Valley, extending up the slopes of the San Rafael Hills on its western side and the foothills of the San Gabriel mountains on its eastern side Roughly 25 miles east-northeast from the Pacific Ocean, its inland location with summertime temperatures already hotter than other areas of Los Angeles means it will be more vulnerable to extreme heat, as global temperatures continue to rise. Likewise, its geography means that it will continue to be vulnerable to wildfires at higher elevations and flooding and mudslides at lower elevations. Air pollution from wildfire smoke will likely be an increasing climate risk.
La Cañada has already undertaken efforts to reduce these risks, including through projects outlined in the 2019 Local Hazard Plan Update However, plans and actions to date have not considered the changing frequency and severity of climate risks This Vulnerability Assessment is intended to assist La Cañada in understanding how climate hazards it faces will change under future emissions scenarios and how those changes will impact the community sectors - built and natural assets, people, economy - that make La Cañada what it is The Vulnerability Assessment will help inform adaptation strategies developed as part of the larger Climate Action and Adaptation Plan. The Vulnerability Assessment is an appendix to the CAAP. The documents should be read together.
In keeping with California Senate Bill 379, the assessment relies on resources provided by the California Governor’s Office of Emergency Services (OES) including Cal-Adapt and the California Adaptation Planning Guide to describe how the frequency and intensity of climate hazards are changing
Purpose of SB 379
Senate Bill No. 379 of the California Legislature requires local jurisdictions to address climate adaptation and resiliency strategies in either the local hazard mitigation plan or an update to the safety element of a jurisdiction’s General Plan, depending on the date of adoption of a local hazard mitigation plan The update includes a climate vulnerability assessment “identifying the risks that climate change poses and the geographic areas at risk,” along with a set of goals and strategies to address those risks
2. Introduction
Natural variability in the climate and weather produce extreme events like droughts, wildfires, and floods over long time periods While natural, living systems respond to and even rely on these phenomena, our dense settlement and production of greenhouse gas emissions have greatly changed climate hazards and their impacts
Increased capture of solar radiation from GHG emissions, generally referred to as global warming or climate change, is having massive and long-term effects on climatic conditions and global energy systems like the water cycle, jet stream and ocean currents. Generally, the oceans are rising and temperatures are increasing. Disruptions in jet stream patterns have caused highly “unseasonal” weather. Some climatic changes like average annual maximum temperatures will be felt on a gradual, generational time scale. For the purposes of this assessment, discussion will focus on changes in climate-related hazardous events. Naturally occurring hazards are expected to occur more frequently and with greater intensity, putting our infrastructure, environment, housing, and populations at greater risk
Indicators of Climate Change in California, a report prepared by the Office of Environmental Health Hazard Assessment, describes the rapidity with which climate change has impacted the state so far Included in that report are the following statements1
● Average temperatures have increased by 2.5° Fahrenheit since 1895
● Eight of the ten warmest years on record occurred between 2012 and 2022
● The 2012 to 2016 drought was the most extreme since instrumental records began, producing a moisture deficit not seen in the last 1,200 years. It is consistent with a trend of California becoming increasingly dry.
● The unprecedented scale of tree deaths in California forests has increased fuel loads, increasing the risk of large, severe wildfires
● Ten of the 20 largest wildfires since 1950 burned in 2020 and 2021
As intense as these climate indicators are, models developed by the scientific community and recommended by the California Governor’s Office of Emergency Services (OES) indicate that climate hazards are expected to grow more severe. The State Hazard Mitigation Plan lists fire, flood, mudslide (and earthquake) as the primary hazards based on number of events, deaths, and cost. Climate change, it says, will result in “more frequent incidence of severe events, such as extreme rainfall, wind, wildfire, extreme heat, and extended drought.”2
These models provide the technical underpinning for understanding La Cañada’ climate risk and are described in greater detail in later sections Unfortunately, because the sources of emissions are global , the negative impacts of climate change are expected to continue, even as California and La Cañada reduce their respective emissions The global backdrop of continuing GHG emissions is the imperative for La Cañada to consider the changes to its climate risks on the local level, in accordance with SB 379
1 Office of Environmental Health Hazard Assessment, California Environmental Protection Agency (2022) Indicators of Climate Change in California Sacramento, California
2 California State Hazard Mitigation Plan, California Office of Emergency Services, 2018, Section 4 3 – p 129
3. Background
California has been divided into 16 different climate zones based on shared climate characteristics within each zone. The California Energy Commission developed this climate geography to develop appropriate efficiency standards and to help builders and building officials understand the energy needs for heating and cooling throughout the year in those zones3.
La Cañada is part of climate Zone 9, an inland valley It is described by Pacific Gas & Electric as being “famous for growing citrus because the summers are hot and winters never frost ” According to an undated PG&E document, Zone 9 has as many heating degree days as cooling degree days 4
Separated from the tempering influence of the ocean by the Santa Monica Mountains, the Verdugo Mountains, and the San Rafael Hills, La Cañada has historically had hot summers (highs of 90℉ and wintertime lows in the low 40s F. Santa Ana winds bring particularly hot dry air into La Cañada in summer and fall. In the winter, atmospheric rivers can soak the foothills and higher elevations of the San Gabriel mountains, causing downstream flooding and landslides.
3.1 Climate Hazard History in La Cañada
Climate hazards are caused from a complex interaction of atmospheric phenomena and on-the-ground conditions. This is described succinctly in La Cañada’s Safety Element of the General Plan.
The combination of southern California’s Mediterranean climate, with its winter and spring rainfall and hot dry summers, a preponderance of highly flammable vegetation within and adjacent to La Cañada Flintridge, the steep topography within the City, and the frequency of high wind velocity from the Santa Ana winds creates optimum conditions for wildfires and debris flows 5
In other words: climate, terrain, vegetation, and short-term weather all influence the type and intensity of climate hazards La Cañada has experienced many climate hazards over its recorded history starting most famously with the Crescenta Valley New Years Day flood of 1934 which jump-started flood control projects in the area, including the Verdugo Wash.
The frequency of these hazards provides a baseline for considering future hazards, even if La Cañada continues to change and the rate of climate change is increasing. Greenhouse gas emissions will change the frequency and intensity of experienced climate hazards but will mostly not introduce new hazards altogether.
Many of these experienced hazards are enumerated in Table 1, Governor-proclaimed disasters Table 1 indicates the relative prevalence of climate hazards over the past 30 years - typically considered a climate period - that reach the level of disaster declaration
3 EZ Building Climate Zone Finder, accessed November 22, 2022 https://caenergy maps arcgis com/apps/webappviewer/index html?id=5cfefd9798214bea91cc4fddaa7e643f
4 California Climate Zone 9, accessed Nov 22, 2022, https://www.pge.com/includes/docs/pdfs/about/edusafety/training/pec/toolbox/arch/climate/california_climate_zone_09.pdf
5 La Cañada General Plan, Chapter 5: Safety Element, Section 5 2 Setting
Table 1. Governor Proclaimed Disasters in Los Angeles County, 1991-2022
Table 1. Governor Proclaimed Disasters in Los Angeles County, 1991-2022
Disaster Type6
Disaster Type6
Drought
Drought
Disaster Description
Disaster Description
Drought
Drought
Drought
Drought
Winter Storms
Winter Storms
Late Winter Storms
Late Winter Storms
Severe Winter Storms
Severe Winter Storms
Late Winter Storms
Late Winter Storms
El Niño
El Niño
Flash flooding
Flash flooding
Winter Storms
Winter Storms
Storm, Flood, and Landslide
Storm, Flood, and Landslide
Severe rainstorms
Severe rainstorms
Winter storms
Winter storms
Winter storms
Winter storms
Rainstorms
Rainstorms
Rainstorms
Rainstorms
Storm System
Storm System
Winter storms
Winter storms
Winter Storms
Winter Storms
Tropical Storm Kay
Tropical Storm Kay
Wildfire (Firestorms)
Wildfire (Firestorms)
Wildfire (Firestorms)
Wildfire (Firestorms)
Wildfires
Wildfires
Wildfires
Wildfires
Wildfires
Wildfires
Wildfires
Wildfires
Wildfires
Wildfires
Wildfire (Powerhouse Fire)
Wildfire (Powerhouse Fire)
Wildfires
Wildfires
Wildfire
Wildfire (Sand Fire)
Wildfire (Sand Fire)
Wildfire (La Tuna Fire)
Wildfire (La Tuna Fire)
Wildfires (Creek and Rye Fires)
Wildfires (Creek and Rye Fires)
Wildfire (Hill & Woolsey Fires)
Wildfire (Hill & Woolsey Fires)
Wildfire (Saddleridge Fire)
Wildfire (Saddleridge Fire)
Wildfires (Kincade and Tick Fires)
Wildfires (Kincade and Tick Fires)
Wildfire (High winds and wildfires)
Wildfire (High winds and wildfires)
Wildfire
Wildfire
Wildfire (Slater, Bobcat, and Oak Fires)
Wildfire (Slater, Bobcat, and Oak Fires)
Date
Date
January 1, 2014
January 1, 2014
October 1, 2021
October 1, 2021
February 1, 1992
February 1, 1992
December 1, 1992
December 1, 1992
January 1, 1995
January 1, 1995
February 1, 1995
February 1, 1995
February 2, 1998
February 2, 1998
November 12, 2003
November 12, 2003
January 1, 2005
January 1, 2005
March 1, 2005
March 1, 2005
January 17-21, 2010
January 17-21, 2010
December, 2010 – January, 2011
December, 2010 – January, 2011
July 18, 2015
July 18, 2015
October 1, 2015
October 1, 2015
January 1, 2017
January 1, 2017
January-February, 2019
January-February, 2019
December 1, 2021
December 1, 2021
September 9, 2022
September 9, 2022
October 27 & 28, 1993
October 27 & 28, 1993
October 1, 1996
October 1, 1996
October – November, 2003
October – November, 2003
October 21, 2007
October 21, 2007
October 1, 2008
October 1, 2008
November 1, 2008
November 1, 2008
August – September, 2009
August – September, 2009
May 30-June 11, 2013
May 30-June 11, 2013
June-July, 2015
June-July, 2015
July 22, 2016
July 22, 2016
September 1, 2017
September 1, 2017
December 1, 2017
December 1, 2017
November 1, 2018
November 1, 2018
October 10, 2019
October 10, 2019
October 25, 2019
October 25, 2019
October 27, 2019
October 27, 2019
August 1, 2020
August 1, 2020
September 1, 2020
September 1, 2020
Over the past 30 years, wildfires have been the most frequent climate events, followed by storms and landslides. Since the Governor declares disasters at a county-wide scale and since La Cañada is less than 1% of the area of LA County, it is difficult to ascertain from this data set alone what disasters have impacted La Cañada
Over the past 30 years, wildfires have been the most frequent climate events, followed by storms and landslides. Since the Governor declares disasters at a county-wide scale and since La Cañada is less than 1% of the area of LA County, it is difficult to ascertain from this data set alone what disasters have impacted La Cañada
6 Chronological list of governor-proclaimed disasters for property tax purposes (since October 20, 1991), https://www boe ca gov/proptaxes/disaster-list htm Note that the list excludes two climate disasters (wind, freeze) each with only one occurrence and unrelated disasters like civil disorders, industrial disasters, etc
6 Chronological list of governor-proclaimed disasters for property tax purposes (since October 20, 1991), https://www boe ca gov/proptaxes/disaster-list htm Note that the list excludes two climate disasters (wind, freeze) each with only one occurrence and unrelated disasters like civil disorders, industrial disasters, etc
Wildfire
Also notably absent from the table or poorly captured by the date column are several multi-year droughts. As of this writing (winter 2022), California see-sawed from experiencing persistent severe drought to record snowfalls. If the frequency and severity of hazards affecting La Cañada may be difficult to ascertain from the list, the list nevertheless provides a baseline of hazard types in the area
Based on this history and Cal-Adapt’s projections described later, this vulnerability assessment has been framed around three climate-related groups of hazards:
1 Temperature, Extreme Heat & Drought
2. Precipitation, Flooding, & Landslides
3. Wildfires & Air Pollution
Reports produced by other jurisdictions may include different climate variables and climate hazards or categorize the variables and hazards differently based on their climate conditions. Landslides particularly are influenced by a “cascade” of previous events: drought, wildfire, and rain storm
3.2 Temperature, Extreme Heat & Drought
Climate hazards like droughts, heat waves, and air pollution are stressors that are usually less dynamic than floods or wildfires. Droughts occur on a slower timeline and can last longer than other climate hazards. Droughts may not cause a loss of property or impair infrastructure like other hazards, but prolonged droughts impact the environment, the economy, and residents’ quality of life The La Cañada Local Hazard Mitigation Plan declares:
Historical drought data regarding La Cañada indicate four significant droughts over the last 50 years, with drought occurring in 16 of those 50 years Based on risk factors and this history, droughts likely will continue to occur in the La Cañada area. Moreover, as temperatures increase, the probability of future droughts will likely increase as well Therefore, droughts likely will occur in La Cañada at varied severities in the future, even after the conclusion of the [2012-2016] drought.7
Similarly, across La Cañada, several extreme heat events were experienced in the past 20 years, including the past seven years being more than one degree celsius over the preindustrial average.8 These hot temperatures have yet to declare a federal disaster. Heat waves have become stronger across the region, including mid-summer night-time heat waves and increases in day-time heat waves. Though heat waves are invisible, they can have great impacts on human health, particularly for vulnerable populations.
3.3 Precipitation, Flooding, & Landslides
La Cañada is the Spanish name for “the canyon” or the “ravine ” The city varies in elevation from about 970 feet to about 2,400 feet at the highest neighborhood, along the mountain front, east of Pickens Canyon. Many residents live in steep terrain areas in this “urban interface”. According to the FEMA 2016 Flood Insurance Study for Los Angeles County, which specifically included La Cañada Flintridge, the city has a lower risk of flooding than other cities but has a higher risk for
7 City of La Cañada Flintridge ” Local Hazard Mitigation Plan, 19 July 2019, pg 157
8 Kaplan, Sarah, and John Muyskens “The Past Seven Years Have Been the Hottest in Recorded History, New Data Shows ” The Washington Post, WP Company, 13 Jan 2022, https://www.washingtonpost.com/climate-environment/2022/01/13/global-temperature-record-climate-change
mudflow 9 There was a large flood in 1934 but civil engineers built large drainage systems to move the excess water safely through the valley Although this has been helpful, there is concern that after periods of drought and vegetation die-off, flash flooding and mudslides may overwhelm and clog the drainage system.
Flooding and mudslides not only can cause loss of life but also can result in damages to buildings, landscapes and roads. La Cañada Flintridge has a high density population with lots of vegetation and this “debris” can be very damaging when sweeping down the steep slopes and through the city. Preparations for flooding, evacuations, and clean-ups are all made more difficult by these circumstances. With 2,341.8 inhabitants per square mile it can cause very crowded evacuation routes People living closer to the mountains and away from the main highways are also included in the flash flood zone 10 More than 20,000 people with only two main highways creates a cause for concern that people would not have time to evacuate Special attention should also be placed on the elderly populations to ensure that they understand evacuation plans and have proper transportation available to them
The steep canyons and ravines are the most susceptible for mudflow. All residents living in those areas could be considered vulnerable. There are 798 properties in La Cañada that have greater than a 26% chance of being severely affected by flooding over the next 30 years, according to Risk Factor, a webtool created by the nonprofit First Street Foundation.11
La Cañada has experienced numerous severe winter storms that have caused flooding. Floods are caused by the duration, intensity, and spatial distribution of precipitation interacting with terrain and land use characteristics like ground cover In other words, floods are not exclusively a climate hazard They are the result of a climate phenomenon in interaction with physical conditions These local conditions that influence flooding range from short-term characteristics such as vegetation cover and soil moisture to long-standing features like the size of storm sewers. Similarly, the impact of floods depends on what is flooded: The storms of 1934 caused flooding of properties and damaging structures in La Cañada, causing $5,000,000 worth of damages to the town devastating buildings, citrus groves, villages and highways beyond repair.12 Since it started participating in the National Flood Insurance Program (NFIP) in 1978, 40 claims have been submitted totaling $1,500,107 worth of damages.13
The main issue with the flooding in this particular valley is the heavy and erosive debris that comes with it Mudslides occur when tons of dirt and sand mix with the excess water and create a landslide of debris Between 1971 and 2010 La Cañada experienced 13 major landslides, each causing an average of $417,112,474 dollars of damage 14 As a result of the canyons surrounding La Cañada it puts them at very high risk of floods resulting in mudslides
9 “City of La Cañada Flintridge ” Local Hazard Mitigation Plan, Section 8 2 2 2 pg 81 https://cityoflcf org/wp-content/uploads/2019/08/LHMP Final 8-7-19 pdf
10 U S Census Bureau Quickfacts: La Cañada Flintridge City, California https://www census gov/quickfacts/fact/table/lacanadaflintridgecitycalifornia/PST045221
11 “Find Your Property's Climate Risks in La Cañada.” Risk Factor, https://riskfactor.com
12 TROXELL , HAROLD C, and JOHN Q PETERSON. FLOOD IN LA CANADA VALLEY CALIFORNIA. 1 Jan. 1934
13 City of La Cañada Flintridge Local Hazard Mitigation Plan, 19 July 2019, pg 86, 87 section 8 4 2 2 & 8 4 2 3
14Ibid
3.4 Wildfires & Air Pollution
Wildfires are very familiar to La Cañada. The 2009 Station Fire which started just north of the City ultimately spared it, but forced evacuations and significant disruptions to daily life.15 The entire City is in a Very High Fire Severity Zone.16
The Local Hazard Mitigation Plan describes the City’s threat from wildfires: One challenge Southern California faces regarding the wildfire hazard is from the increasing number of houses being built on the wildland-urban interface Every year the growing population has expanded further and further into the hills and mountains, including forest lands The increased "interface" between urban and suburban areas and the open spaces created by this expansion has produced a significant increase in threats to life and property from fires and has pushed existing fire protection systems beyond original or current design and capability Property owners in the interface are not aware of the problems and threats they face. Therefore, many owners have done very little to manage or offset fire hazards or risks on their own property Furthermore, human activities increase the incidence of fire ignition and potential damage 17
Of course, wildfires can start from any number of human sources and not only during dry weather. Like floods, wildfires present the greatest risk to life and property when they cross the wildland urban interface into developed areas. However, the spread and duration of wildfires is less predictable than floods. Wildfires are most likely to spread through embers directed by wind and the air currents of the fire itself.
These air currents can bring particulate matter hundreds of miles from the fire Summer can already produce poor air quality due to photochemical (sunlight) smog and the long-term suspension of particulate matter that rain in the winter and spring dissolves Pollution is classically trapped in valleys during high pressure These periods of air pollution increase the health risk for people with pre-existing respiratory conditions and/or who experience occupational hazards through outdoor work.
According to the California Office of Environmental Health Hazard Assessment (OEHHA), “Particulate Matter 2.5…can have adverse effects on the heart and lungs, including lung irritation, exacerbation of existing respiratory disease, and cardiovascular effects. The International Agency for Research on Cancer (IARC) determined PM to be carcinogenic to humans and causally associated with lung cancer ”18 The US EPA has set a relatively new standard for PM2 5 of 12 μg/m3, down from 15 μg/m3, however OEHHA reports that “adverse health effects are seen at concentrations below the US EPA’s current standard” 19 Data from La Cañada (collected between 2015 and 2017) indicates PM2 5 between 11 µg/m3 and 12 µg/m3 - healthy according to the EPA, but worse than the average for California Given that baseline air quality is only slightly better
15 Sara Cardine & Andy Nguyen, 10 Years On, Station Fire Remains Burned into Minds of Locals and Fire Officials, August 21, 2019, https://www latimes com/socal/la-canada-valley-sun/news/story/2019-08-21/10-years-on-station-fire-still-burned-into-min ds-of-locals-fire-officials
16 La Cañada Flintridge - Osfm fire ca gov https://osfm fire ca gov/media/5826/la canada flintridge pdf
17 2019 City of La Cañada Flintridge Local Hazard Mitigation Plan, p. 121
18 CalEnviro Screen 4.0, https://oehha ca gov/media/downloads/calenviroscreen/report/calenviroscreen40reportf2021 pdf, p 38
19 ibid
than the EPA standard, added pollution from wildfires even far from La Cañada can easily create unhealthy levels of PM2 5 20
3.5 Risk Matrix
The following risk matrix provides a qualitative assessment of risks specific to La Cañada based on their frequency and impact. Based on this assessment, the threat posing the greatest hazard to the City is the threat of Wildfire & Air Pollution
4. Future Changes to Climate Hazards
There are several sources of information about future climate hazards and their impact on La Cañada. Described below is information from several State, County, and local documents and tools. These sources are not exhaustive, nor are they entirely in agreement, however, together they provide a helpful composite.
4.1
California’s Fourth Climate Change Assessment
– Los Angeles Region Report
California’s fourth climate change assessment was produced in 2018 Given the size and physical diversity of California, the assessment was divided into region-specific reports. The Los Angeles Region report reveals that temperatures in the area rose by approximately 2°F between 1950 and 2005. However, the expected temperature rise by mid-century has been revised. Current projections suggest that temperatures in the Los Angeles region could increase by as much as 4.5°F by mid-century if emissions continue. Furthermore, if emissions persist until the end of the century, the temperature rise could reach a significant 5.8°F.21 It's important to note the projections show spatial patterns, with coastal regions experiencing relatively lower warming due to the buffering effect of the ocean, while interior regions are projected to experience the highest increases Extreme heat events are also expected to become more intense and frequent, with hotter days and an increase in the number of extremely hot days projected
20 Office of Environmental Health Hazard Assessment, Cal EnviroScreen 4 0 PM 2 5 Indicator Map, https://oehha.ca.gov/calenviroscreen/indicator/air-quality-pm25 accessed Dec 17, 2022
21 California’s Fourth Climate Change Assessment 2018 Los Angeles Region Report
Figure 1. Risk Matrix
According to the report, despite small changes in average precipitation, dry and wet extremes are both expected to increase By the late 21st century, the wettest day of the year is expected to increase across most of the LA region, with some locations experiencing 25-30% increases under representative concentration pathway (RCP) 8 5 Increased frequency and severity of atmospheric river events are also projected to occur for this region.
Sea levels are projected to continue to rise in the future, but there is a large range based on emissions scenarios and uncertainty in feedbacks in the climate system Roughly 1-2 feet of sea level rise is projected by the mid-century, and the most extreme projections lead to 8-10 feet of sea level rise by the end of the century
Wildfires in the Los Angeles region are influenced by multiple factors, including the area's dry and warm climate, periodic Santa Ana winds, vegetation distribution, topography, urban-wildland interfaces, fire suppression efforts, and human activities. The majority of wildfires occur during the summer and fall, with a significant portion happening during Santa Ana wind events. While historical trends show no significant changes in Santa Ana-driven fires, the average size of non-Santa Ana fires during the summer has increased. Future projections suggest a potential increase in the number and size of wildfires, with over 60% more burned area expected for Santa Ana-driven fires and over 75% more for non-Santa Ana fires by the mid-21st century. However, there are uncertainties in current wildfire models, and further research is needed to improve accuracy and understanding
4.2 LA County Climate Vulnerability Assessment
4.2.1 Temperature, Extreme Heat & Drought
Extreme heat is a growing concern in Los Angeles County, with rising temperatures projected to increase in frequency, severity, and duration. Heat waves have become more frequent, longer, and more severe, impacting the region significantly By mid-century, the county is expected to experience a tenfold increase in the number of heat waves The countywide daily maximum temperature is also projected to rise by an average of 5 4°F, reaching a mid-century average of 98 6°F Additionally, drought poses a significant hazard, leading to water shortages, increased wildfires, and impacts on air quality Climate change increases the likelihood of severe and prolonged droughts across the southwestern United States, with climate models projecting more than a 6.5% increase in the occurrence of megadroughts between the mid and end of the century. These climate hazards exacerbate environmental conditions, driving further impacts on human and natural systems, highlighting the need for increased preparedness and adaptation efforts.
4.2.2 Precipitation, Flooding, & Landslides
Inland flooding, extreme precipitation, coastal flooding, mudslides, and landslides are significant climate hazards in Los Angeles County. Inland flooding occurs due to heavy precipitation events that overwhelm natural waterways and stormwater infrastructure Climate projections for inland flooding and extreme precipitation are limited, highlighting the need for further understanding of future flood risks Coastal flooding poses a risk to low-lying areas, with sea-level rise exacerbating inundation during high tides and storms By mid-century, all of LA County's coastline is projected to experience at least moderate exposure to coastal flooding The State of California projects sea-level rise to reach approximately 2.5 feet by mid-century and 6.6 feet by the end of the century, further amplifying the coastal flooding risk. Mudslides and landslides, often triggered by extreme precipitation following wildfires, pose risks in the mountainous areas of the county. Future changes in precipitation patterns, including more severe periods of high-volume rainfall, are projected to increase the risk of inland flooding. These climate hazards necessitate the prioritization of climate-resilient development strategies and further investigation for a comprehensive understanding of vulnerability in LA County.
4.2.3 Wildfires & Air Pollution
Climate change poses significant challenges to both wildfire risk and air quality in the Los Angeles region The combination of hot and dry weather, low moisture levels, and strong winds during fall and winter create ideal conditions for severe wildfires Particularly vulnerable is the San Gabriel Mountains, including the Angeles National Forest, which are projected to experience a substantial increase in the area burned by wildfires. An Additional 2.2 hectares of LA County land is projected to burn each year by mid-century. These wildfires contribute to higher levels of particulate matter (PM), including PM 2.5, which has detrimental effects on air quality. Moreover, extreme heat speeds up the production of ground-level ozone and increases the release of volatile organic compounds (VOCs), further compromising air quality. Climate-related factors such as extreme precipitation, flooding, drought, and elevated dust levels also contribute to worsened outdoor and indoor air quality, potentially leading to respiratory illnesses Addressing these challenges is crucial to protect public health and mitigate the impact of climate change on the region's air quality
4.3 Local Hazard Mitigation Plan
4.3.1 Temperature, Extreme Heat & Drought
The California State Hazard Mitigation Plan says drought “can affect people’s health and safety including health problems related to low water flows, poor water quality, or dust.”22 Industries that depended on water sources may be affected. No structures will be directly affected by drought conditions, though some structures may become vulnerable to wildfires, which are more likely following years of drought Environmental losses consist of damage to plants, animals, wildlife habitat, and air and water quality This causes forest and range fires which degrades the landscape quality The loss of biodiversity and soil erosion quickly follow
Heat is a huge factor in the amount of water in the ground and according to the LHMP “power outages or roaming blackouts may occur as a result of extreme heat events that strain and overheat circuits. During a blackout, all critical facilities and infrastructure that are reliant upon electricity for power will be severely impacted unless they are connected to a backup power source.” This targets many vulnerable populations or anyone who depends on electricity.
4.3.2 Precipitation, Flooding, & Landslides
The largest impact on communities from flood events is the loss of life and property Populations can be affected by unsafe food, contaminated drinking and washing water and poor sanitation, mosquitoes and animals, molds and mildews, hazards when re-entering and cleaning flooded homes and buildings as well as the mental stress and fatigue that comes from flooding. There is a long-term concern among the affected populations that their homes can be flooded again in the future. Planning has been put in place involving “building codes, zoning codes, and various planning strategies to address the goals that aim to restrict development in areas of known hazards and applying the appropriate safeguards.” Flooding can also affect the economy. Many businesses have to close meaning people aren’t buying things and many are out of work while many structures have damage in need of repair Critical Facilities that are vital to the health and safety of the City are the ones that must stay open before, during and after an emergency Water treatment and infrastructure that help remove run-off are important facilities to mitigate against floods Crescent Valley Water District, La Cañada Irrigation District, Mesa Crest Water Company, and the Valley Water Company work together to provide water for the City of La Cañada Flintridge citizens. When these districts don’t work together it can have an adverse impact on the environment. Pollution in the water can later affect agriculture. Developing dams can affect the path in which water flows naturally. The amount of property in the floodplain, as well as the type and value of structures on those properties, should be calculated to provide a working estimate for potential flood losses.
4.3.3 Wildfires & Air Pollution
With 21,000 people at risk, wildfires should be taken as a serious matter The entire City of La Cañada has been identified as a high risk area for brush fires because of its steep hillsides and gradual slopes Many of the homes are nestled into thick forests with many trees The scenic roads and winding driveways make La Cañada a very difficult place to evacuate and leave combustible elements of houses right in the path of destruction Since the City is primarily residential structures, it puts the economic impact in this jurisdiction in the “tens of millions ”23 Water availability is a problem because of the lack of fire hydrants found in neighborhoods. With no water, vegetation and structures fuel a fire that can be very unpredictable. It is hard to anticipate where the fire will go because of diversity in building materials and accessibility to fire breaks and space for firefighters to do their jobs. With fires causing a direct effect on the number of homes left in the city, air pollution starts causing an effect on vulnerable populations and the entire community’s quality of life. Heavy smoke is not easily dissipated because of the valley in which La Cañada sits Heavier smoke tends to sink into the lower parts of elevation and can cause outside activities to be much more difficult
4.4 Cal-Adapt & Adaptation Planning in California
The OES issued the California Adaptation Planning Guide (APG) to help municipalities and all stakeholders involved in the vulnerability assessment process with recommendations and tools to develop a scientifically grounded, relevant, and actionable adaptation plan.
One of the public resources provided by OES to be used in consultation with the (APG) is a web-based climate projection tool called Cal-Adapt Cal-Adapt provides historical and projected climate information, including “local snapshots” of several different climate phenomena under different emissions scenarios through 2100. The global climate models selected by OES are particularly well matched to California’s climate
Cal-Adapt was used for this vulnerability assessment to predict what future temperature and precipitation La Cañada will experience based on scenarios of future global emissions or RCP 4.5 and RCP 8.5, adopted by the International Panel on Climate Change. These emissions scenarios are based on models of population growth, economic growth, food production, technological advancement, political activities to curb greenhouse gas emissions and other factors. RCP 2.6 represents a “very stringent” pathway, in which emissions start declining by 2020 and go to zero by 2100 It is not included in Cal-Adapt RCP 4 5 represents a global growth scenario in which emissions continue to 2040 and then decline RCP 8 5 represents a “business as usual” scenario in which emissions continue unabated Because these scenarios and models are global, they do not consider how La Cañada reduces its emissions
Cal-Adapt plugs these global emissions scenarios into global climate models (GCMs) to produce local information about areas in California, including La Cañada. Cal-Adapt describes the process on its Guidance on Using Climate Projections webpage24, from which the text below is reproduced.
Climate scientists create projections of future climate using powerful tools called global climate models Global climate models are complex pieces of computer software that crunch through thousands of mathematical equations representing the scientific theory of how the climate system works They can be used to simulate climate over past periods, or to run experiments in which scientists impose certain conditions on the model to see how the climate system responds A future climate projection is the product of global climate model experiments in which scientists impose upon the model some scenario of the future atmospheric concentration of greenhouse gases [eg. RCP 4.5 and RCP 8.5].
When climate scientists run a climate model, they divide the area of study into a grid, and the model performs calculations for each individual cell within the grid. The output from those calculations can then be visualized on a map, similar to the visualizations in Cal-Adapt [shown in Figures 3-9] In climate model projections, for any given snapshot in time, each grid cell is represented by a single value for temperature, precipitation, or other climate variable of interest
The grid cells in most global climate models are very large from 100 to 600 kilometers [roughly 100 to 375 miles] squared. This coarse resolution is OK when scientists are studying climate on the global scale, but it is not very useful when we are trying to understand climate change on smaller scales. We know that present-day climate varies greatly from region to region in California, and so we expect future climate to vary accordingly. But that detail is lost in the global climate models, in which all of California may be represented by just a few grid cells To be able to plan for the future, we need to produce higher-resolution projections of future climate Climate scientists do just that by using various techniques to "downscale" global climate model output to finer spatial scales The data in Cal-Adapt is taken from a selection of global climate models and downscaled to about 7-kilometer [roughly 4 5 mile] resolution
24 https://v2.cal-adapt.org/resources/using-climate-projections/
Understanding Cal-Adapt Graphs
The Cal-Adapt graphs presented in this Vulnerability Assessment display several data types that demonstrate the anticipated changes in variables such as temperature, extreme heat, drought, precipitation, and wildfire as climate change progresses. types of data illustrating how variables like temperature, extreme heat, drought, precipitation, and wildfire are expected to change as climate change continues. In this section, we will explain how the information is displayed on the La Cañada graphs (refer to Figure 2, 3, 4)
The historical observed values for each year, depicted by the gray line on figure 2, represent the natural climate variation Despite the long-term warming trend, certain years may still be cooler or warmer than others
In Figure 3, the dark blue line represents the most likely outcome for whatever variable or the depicted variable. It is derived from averaging multiple climate models, smoothing out the year-to-year variability predicted by each model. However, this line does not suggest the elimination of year-to-year variability. The shaded blue area surrounding the line represents the complete range of climate projections across all models for that variable. If one model predicts a high value while another predicts a low value, this information is reflected in the shaded area. To summarize, under a medium emissions scenario, La Cañada could experience any value within the shaded blue area but is most likely to align with the value on the blue line
The same explanation for the image holds true under a high emissions scenario, shown in light purple (Figure 4) The colored areas around lines represent projections under different emissions scenarios, RCP 4 5, displayed in a light blue color, represents continued global emissions until 2040 (medium emissions scenario) and RCP 8.5, shown in a light purple color, represents continued global emissions throughout the century (high emissions scenario). The purple line represents the most likely outcome for the variable, and the shaded area around the line represents the full range of climate projections for the variable across all models.
When both emissions scenarios are graphed (Figure 4), the darker purple-gray area represents the possible values which are projected in both medium emissions and high emissions scenarios For some climate variables like temperature, the distinction between emissions scenarios becomes more apparent as the century progresses, with less overlap between the blue and purple shaded areas This indicates that reducing emissions will result in lower temperature increases However, for other variables such as precipitation, there is no significant visual difference between the blue and purple shaded areas, suggesting that the range of precipitation values remains relatively consistent regardless of the emissions scenario.
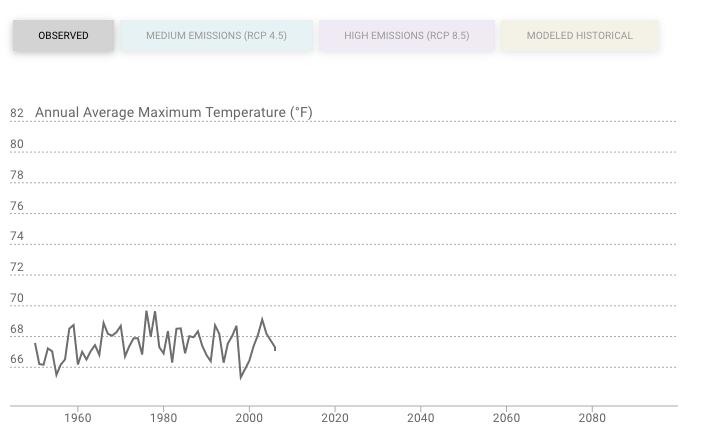
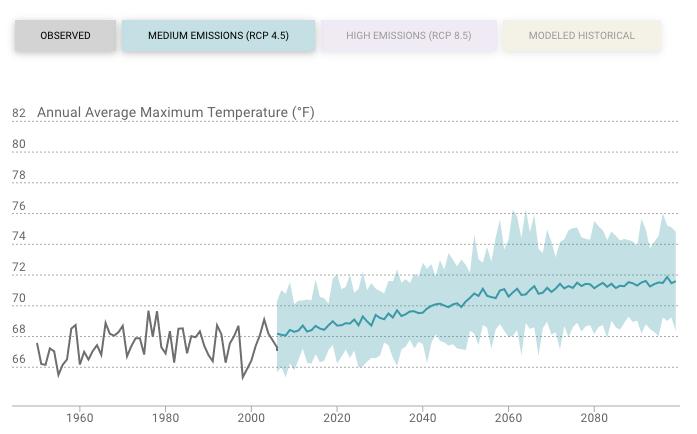
Figure 2 - Historical Trends
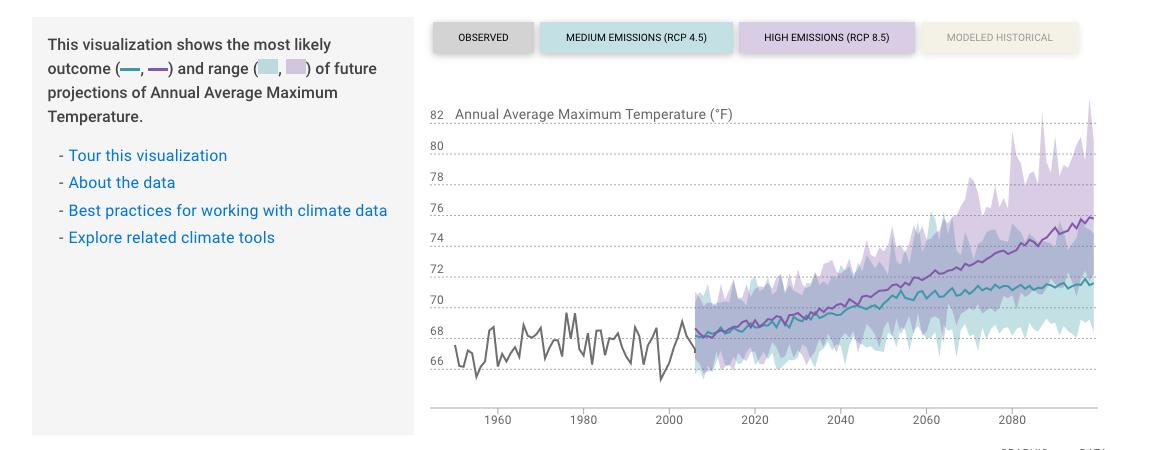
3 - Projections under
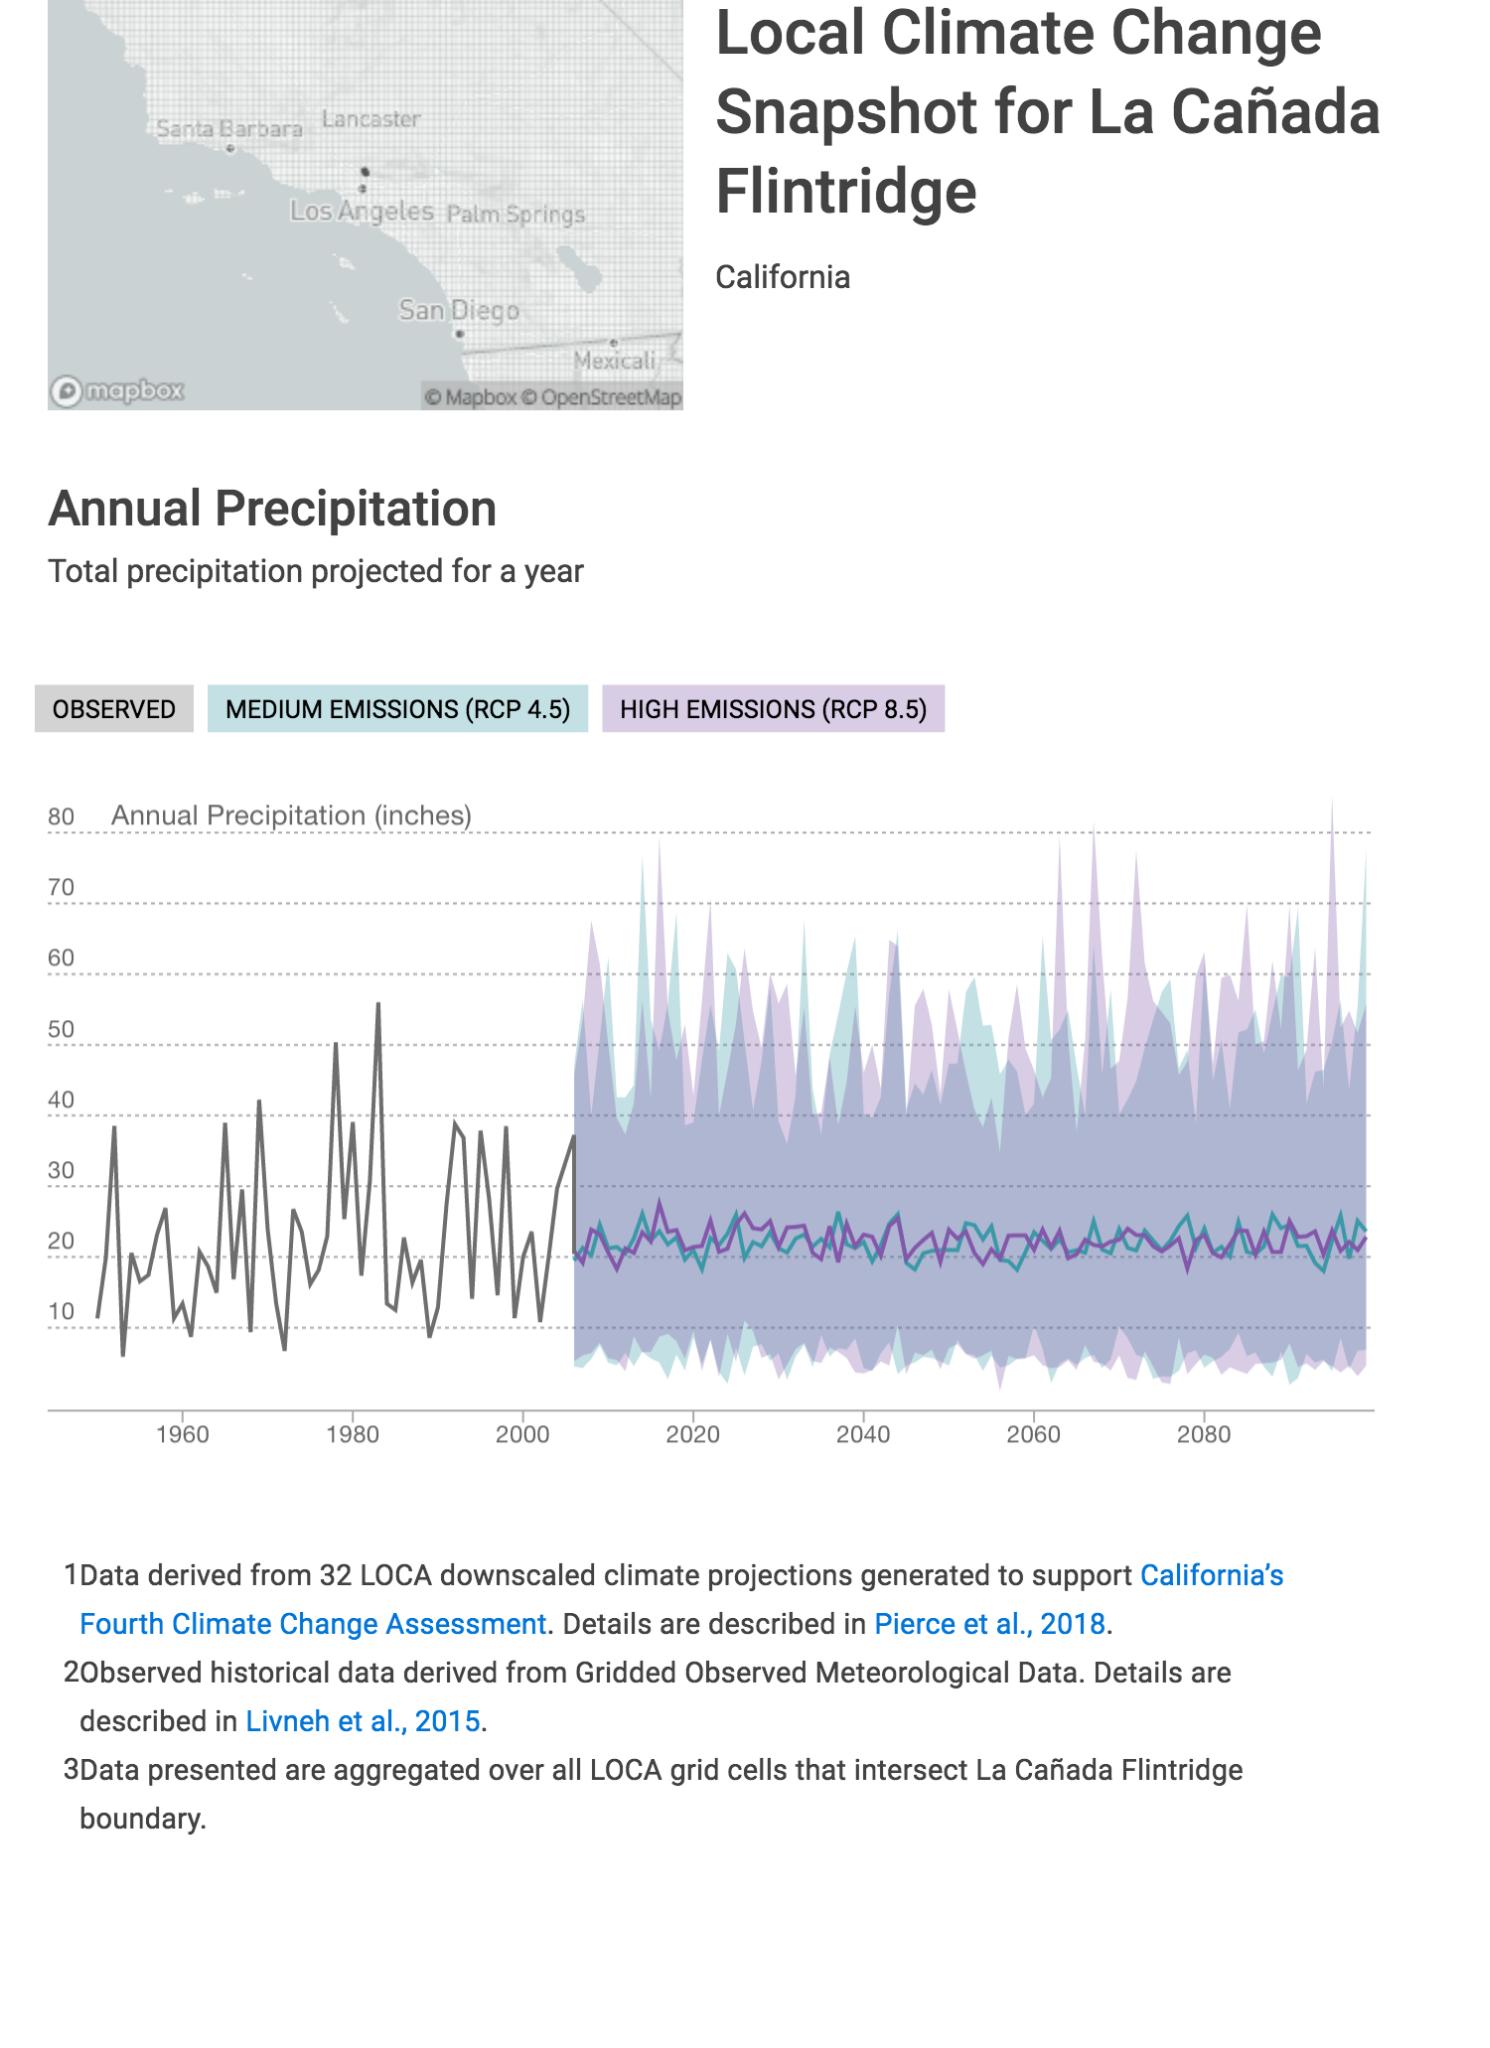
Mid-Century 2035-2064
End-Century
(RCP 4 5) 21 8 16 9-28 3 inches
4 5)
Table 2: Annual total precipitation, observed and projected under medium and high emissions scenarios over 30-year periods according to Cal-Adapt. The numbers in the average column represent the averages of the most likely outcome over the 30-year periods. The numbers in the range of averages column represents the averages from all climate models over the 30-year periods The range of averages is generally greater in the high emissions scenario, indicating the greater uncertainty under high emissions, especially by the end of the century
Even if annual precipitation is expected to remain consistent as an annual average, the timing of rainfall is expected to vary from the existing seasons Winters may be wetter and spring and autumn may be drier The variability may include more intense, infrequent rainfall causing flooding and landslides, preceded and followed by longer dry spells without any precipitation. The maximum 1-day precipitation event is expected to increase marginally.
Flooding is likely to increase as a result of an increased number of days with extreme rainfall events. That increased risk may be compounded with an increase in the number of wildfires in the San Gabriel and San Rafael Mountains that reduce the ability of plants and soils to absorb rainfall Conversely, back-to-back extreme rainfall events in late winter may fall on areas already saturated and unable to absorb rainfall The result in either case is a change in the intensity and pattern of flooding Determining flood risk requires hydrologic and hydraulic analyses that are outside the scope of this assessment - FEMA produced 100-year and 500-year flood maps for La Cañada in 1987 and updated them in 2008, however these maps are not considered current or comprehensive25
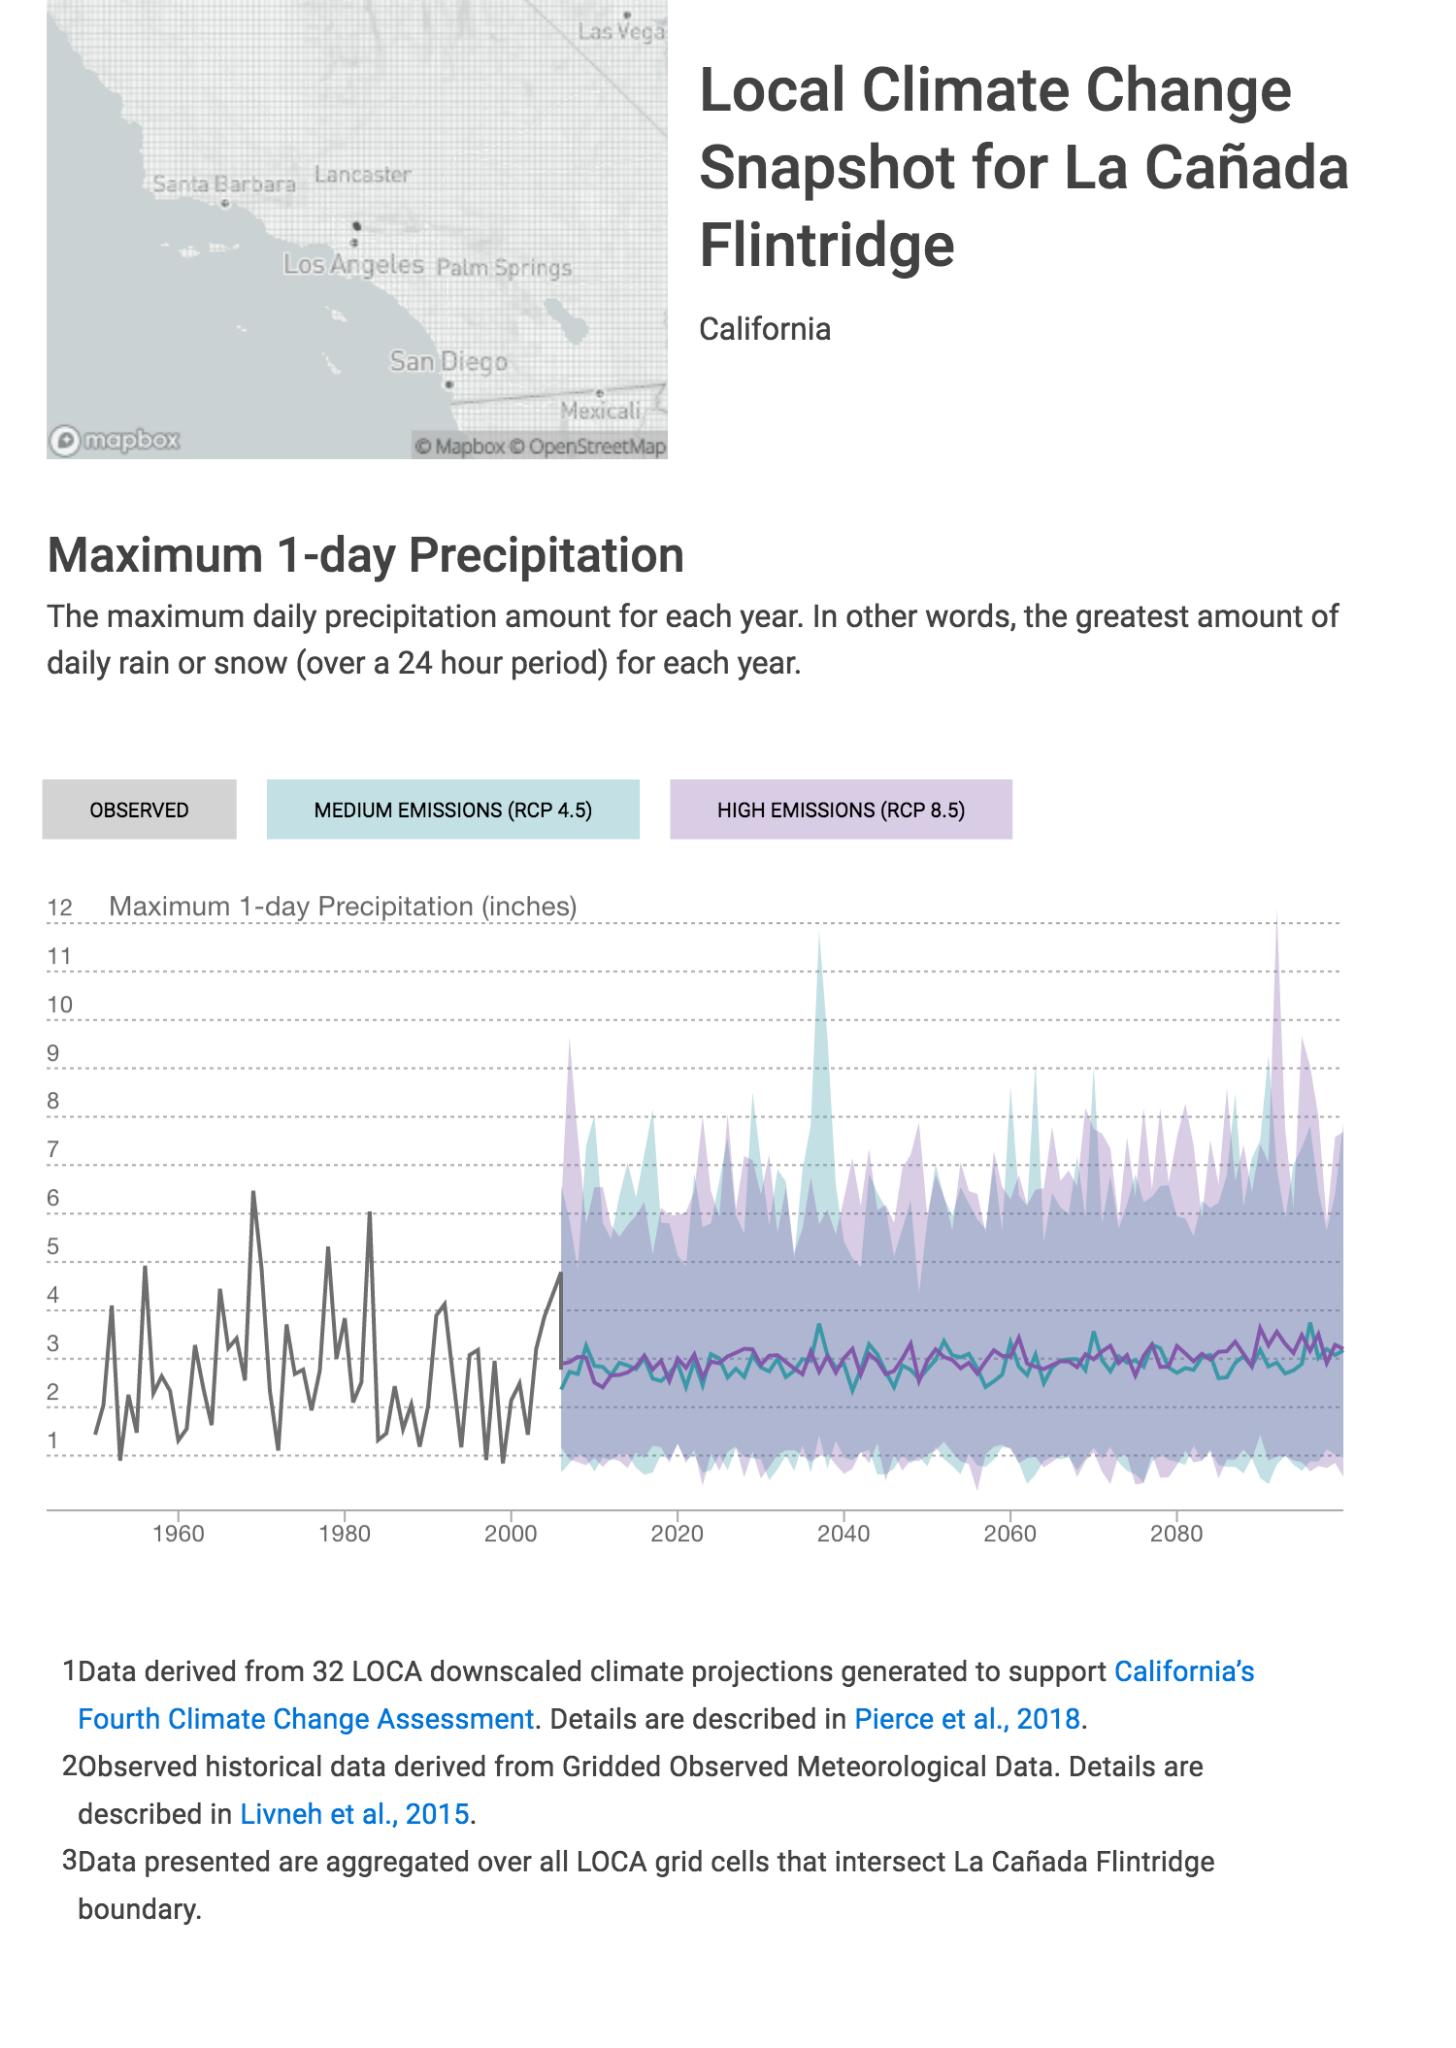
um and high
nd high on totals in each uced using rages Units inches inches inches
nd high on totals in each uced using rages Units inches inches
pitation totals in each s Produced using
Mid-Century 2035-2064
Table 3: Maximum 1-day precipitation, observed and projected under medium and high emissions scenarios over 30-year periods according to Cal-Adapt The numbers in the average column represent the averages of the most likely outcome over the 30-year periods The numbers in the range of averages column represents the averages from all climate models over the 30-year periods
Table 3: Maximum 1-day precipitation, observed and projected under medium and high emissions scenarios over 30-year periods according to Cal-Adapt. The numbers in the average column represent the averages of the most likely outcome over the 30-year periods. The numbers in the range of averages column represents the averages from all climate models over the 30-year periods.
Table 3: Maximum 1-day precipitation, observed and projected under medium and high emissions scenarios over 30-year periods according to Cal-Adapt. The numbers in the average column represent the averages of the most likely outcome over the 30-year periods. The numbers in the range of averages column represents the averages from all climate models over the 30-year periods
For the area including La Canada, the California Dept. of Transportation (Caltrans) uses a slightly different indicator of extreme precipitation, the 1-100 year or 1% annual storm. A 2019 analysis by Caltrans predicts a 5%-10% increase in maximum amount of rainfall under a high emissions scenario.25
For the area including La Canada, the California Dept of Transportation (Caltrans) uses a slightly different indicator of extreme precipitation, the 1-100 year or 1% annual storm A 2019 analysis by Caltrans predicts a 5%-10% increase in maximum amount of rainfall under a high emissions scenario 26
For the area including La Canada, the California Dept. of Transportation (Caltrans) uses a slightly different indicator of extreme precipitation, the 1-100 year or 1% annual storm. A 2019 analysis by Caltrans predicts a 5%-10% increase in maximum amount of rainfall under a high emissions scenario 25
25 2019 Climate Change Vulnerability Assessments, District 7: Los Angeles and Ventura Counties https://dot ca gov/programs/transportation-planning/division-of-transportation-planning/air-quality-and-climate-change/ 2019-climate-change-vulnerability-assessments
26 2019 Climate Change Vulnerability Assessments, District 7: Los Angeles and Ventura Counties https://dot ca gov/programs/transportation-planning/division-of-transportation-planning/air-quality-and-climate-change/ 2019-climate-change-vulnerability-assessments
25 2019 Climate Change Vulnerability Assessments, District 7: Los Angeles and Ventura Counties https://dot ca gov/programs/transportation-planning/division-of-transportation-planning/air-quality-and-climate-change/ 2019-climate-change-vulnerability-assessments
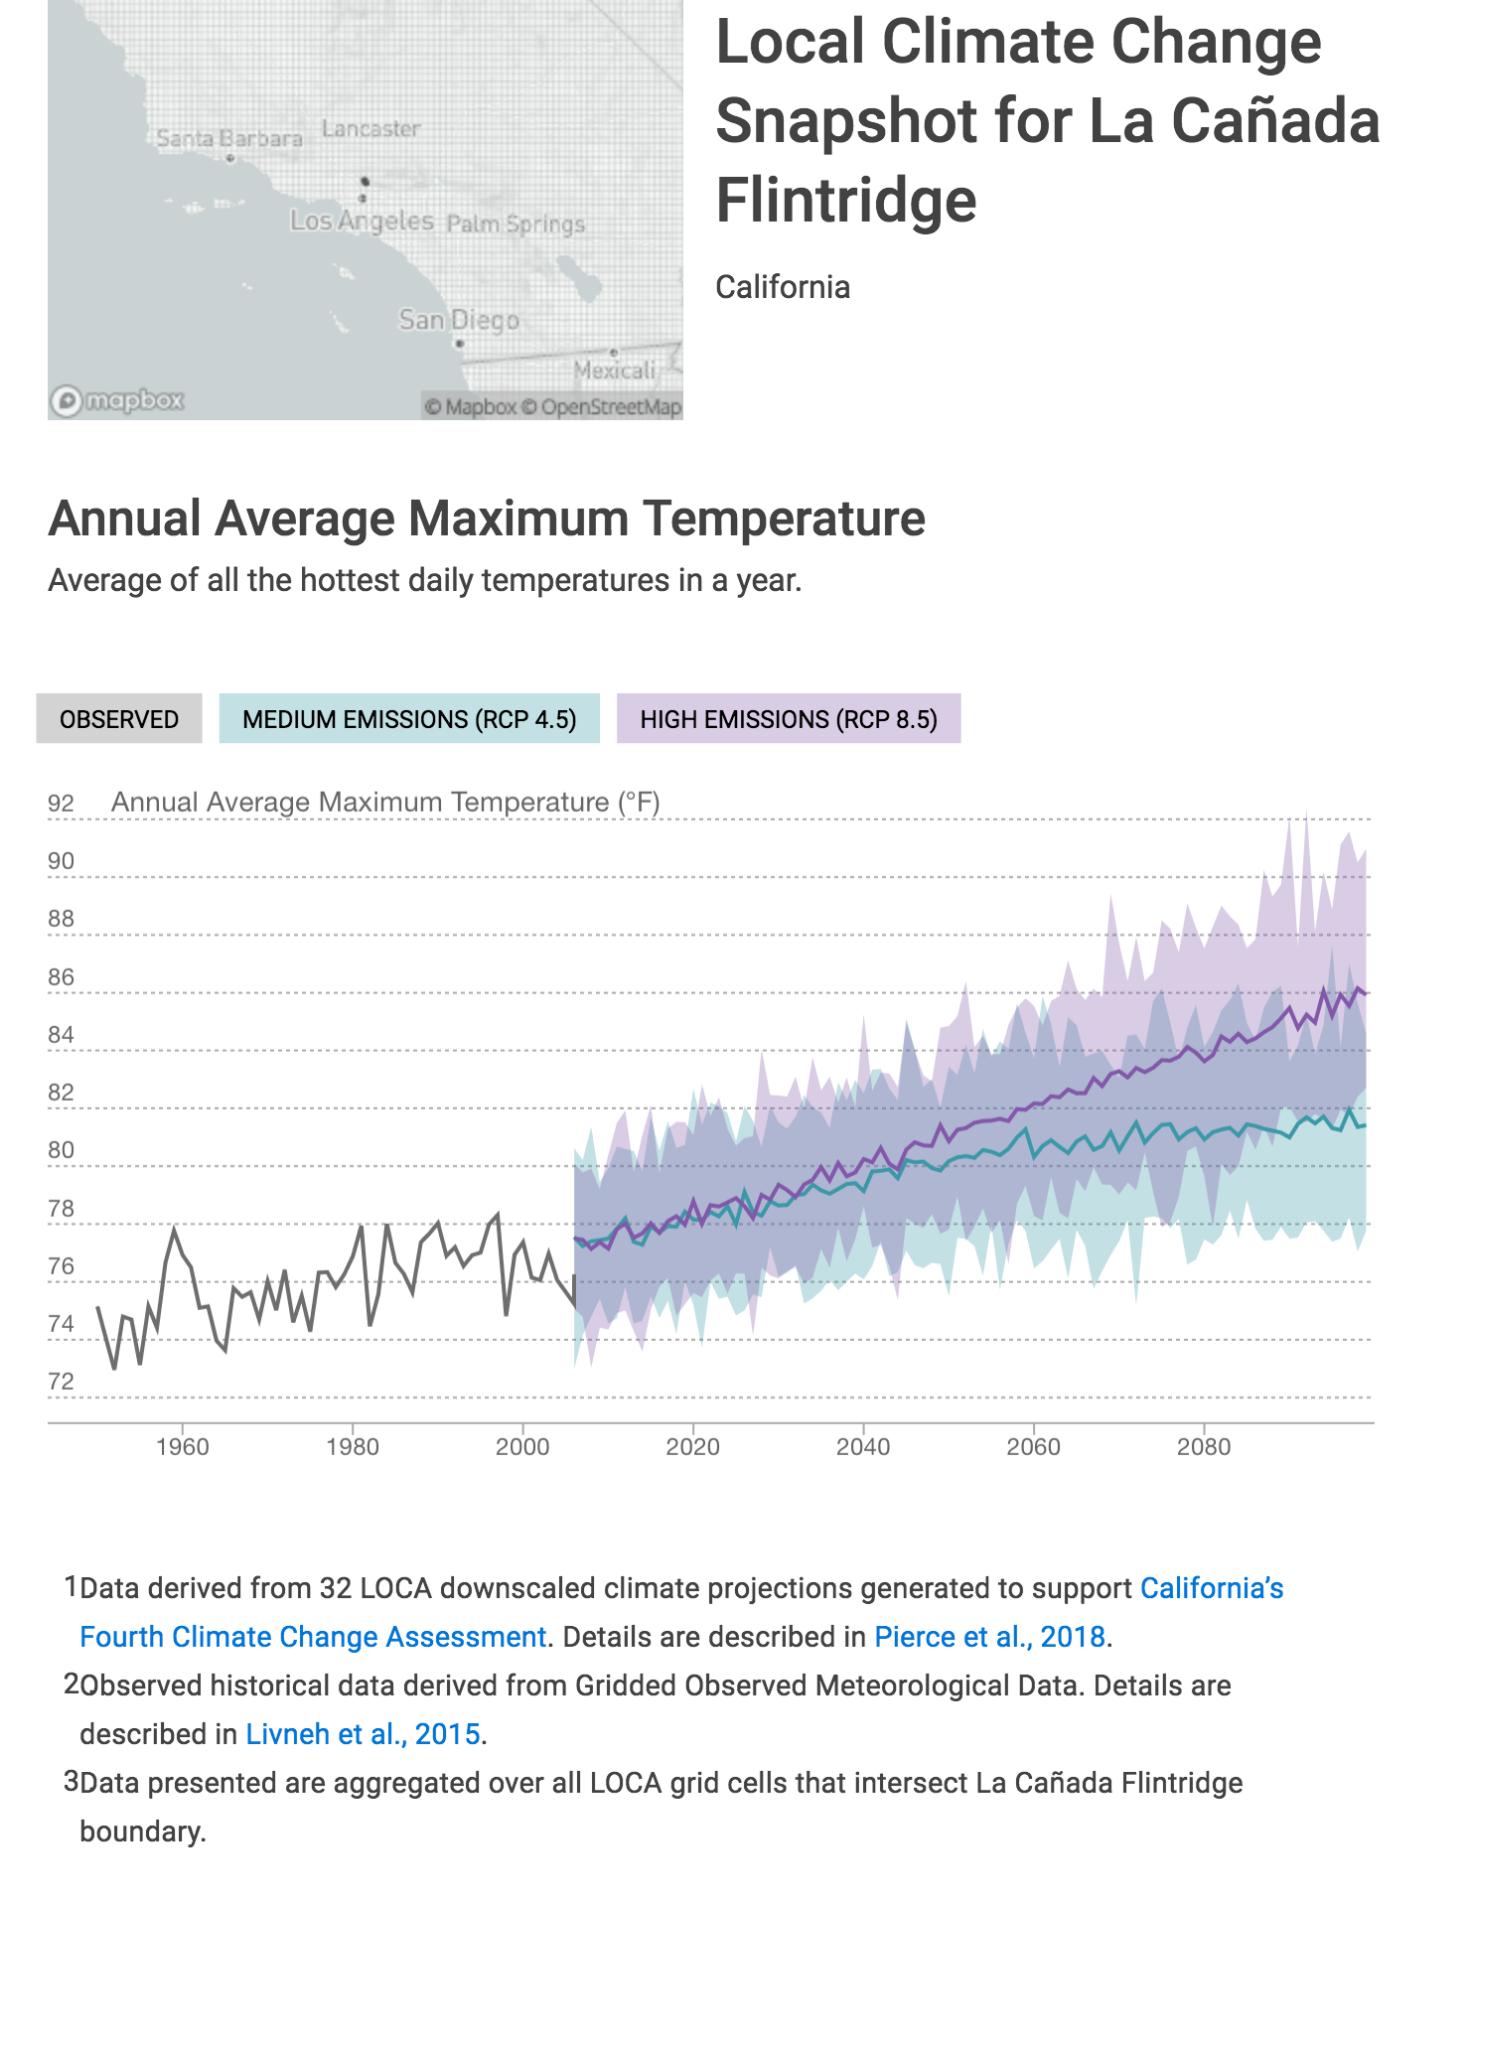
Table 4: Annual Average Maximum Temperature, observed and projected under medium and high emissions scenarios over 30-year periods according to Cal-Adapt. The numbers in the average column represent the averages of the most likely outcome over the 30-year periods. The numbers in the range of averages column represents the averages from all climate models over the 30-year periods.
Table 4: Annual Average Maximum Temperature, observed and projected under medium and high emissions scenarios over 30-year periods according to Cal-Adapt The numbers in the average column represent the averages of the most likely outcome over the 30-year periods The numbers in the range of averages column represents the averages from all climate models over the 30-year periods.
Table 4: Annual Average Maximum Temperature, observed and projected under medium and high emissions scenarios over 30-year periods according to Cal-Adapt The numbers in the average column represent the averages of the most likely outcome over the 30-year periods The numbers in the range of averages column represents the averages from all climate models over the 30-year periods
Table 4: Annual Average Maximum Temperature, observed and projected under medium and high emissions scenarios over 30-year periods according to Cal-Adapt The numbers in the average column represent the averages of the most likely outcome over the 30-year periods The numbers in the range of averages column represents the averages from all climate models over the 30-year periods.
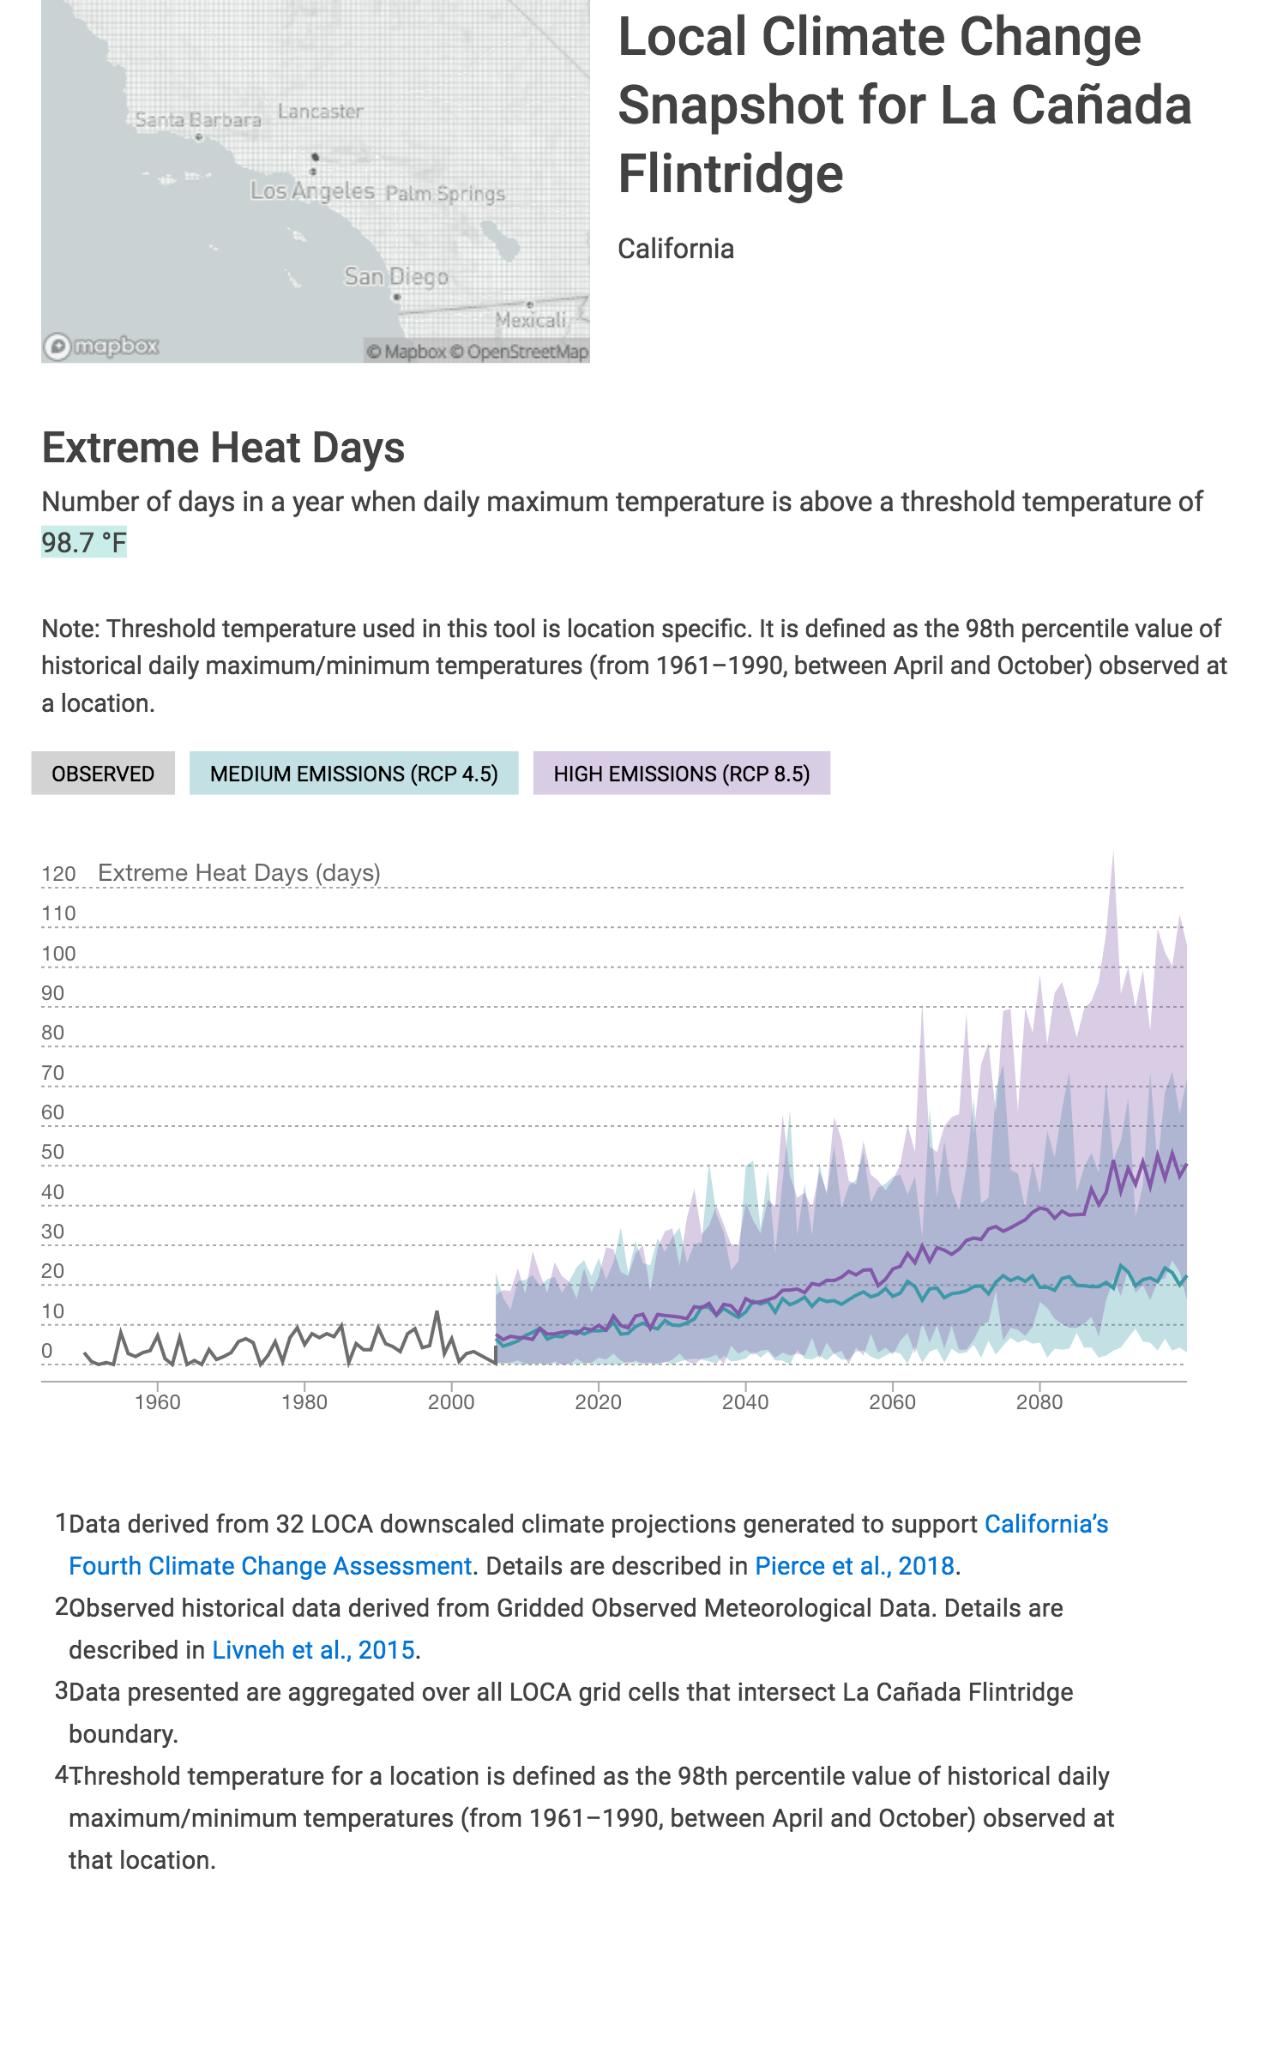
ter
nd
ing ntial water st by ystem and on.
t
ays in
-Adapt high me heat heat days in
Period Years Emissions Scenario Average Range of Averages Units
Baseline 1961-1990 Modeled Historical 3 2-4 days
Mid-Century 2035-2064 Medium (RCP 4 5) 16 9-38 days
End-Century 2070-2099 Medium (RCP 4 5) 21 14-55 days
Mid-Century 2035-2064 High (RCP 8.5) 20 13-41 days
End-Century 2070-2099 High (RCP 8 5) 41 28-88 days
Table 5: Number of extreme heat days, observed and projected under medium and high emissions scenarios over 30-year periods according to Cal-Adapt. The numbers in the average column represent the averages of the most likely outcome over the 30-year periods. The numbers in the range of averages column represents the averages from all climate models over the 30-year periods
As shown in Figure 9, the number of extreme heat days (defined as days with high temperatures above 98 7F for La Cañada) is expected to increase dramatically by mid-century By the end of the century, Cal Adapt projects as many as 10 times as many extreme heat days, extending over a months’ worth of days.
As dramatic as the expected increase in high temperatures and the number of extreme heat days is the expected increase in the number of warm nights. Cool nights provide natural relief from heat for humans, animals, and plants. Warm nights compound the problem of high daytime temperatures, particularly for the elderly and people living with medical conditions. They also expand La Cañada’s total energy demand measured in cooling degree days
F erved and p e range o likely t Units nights nights nights nights days
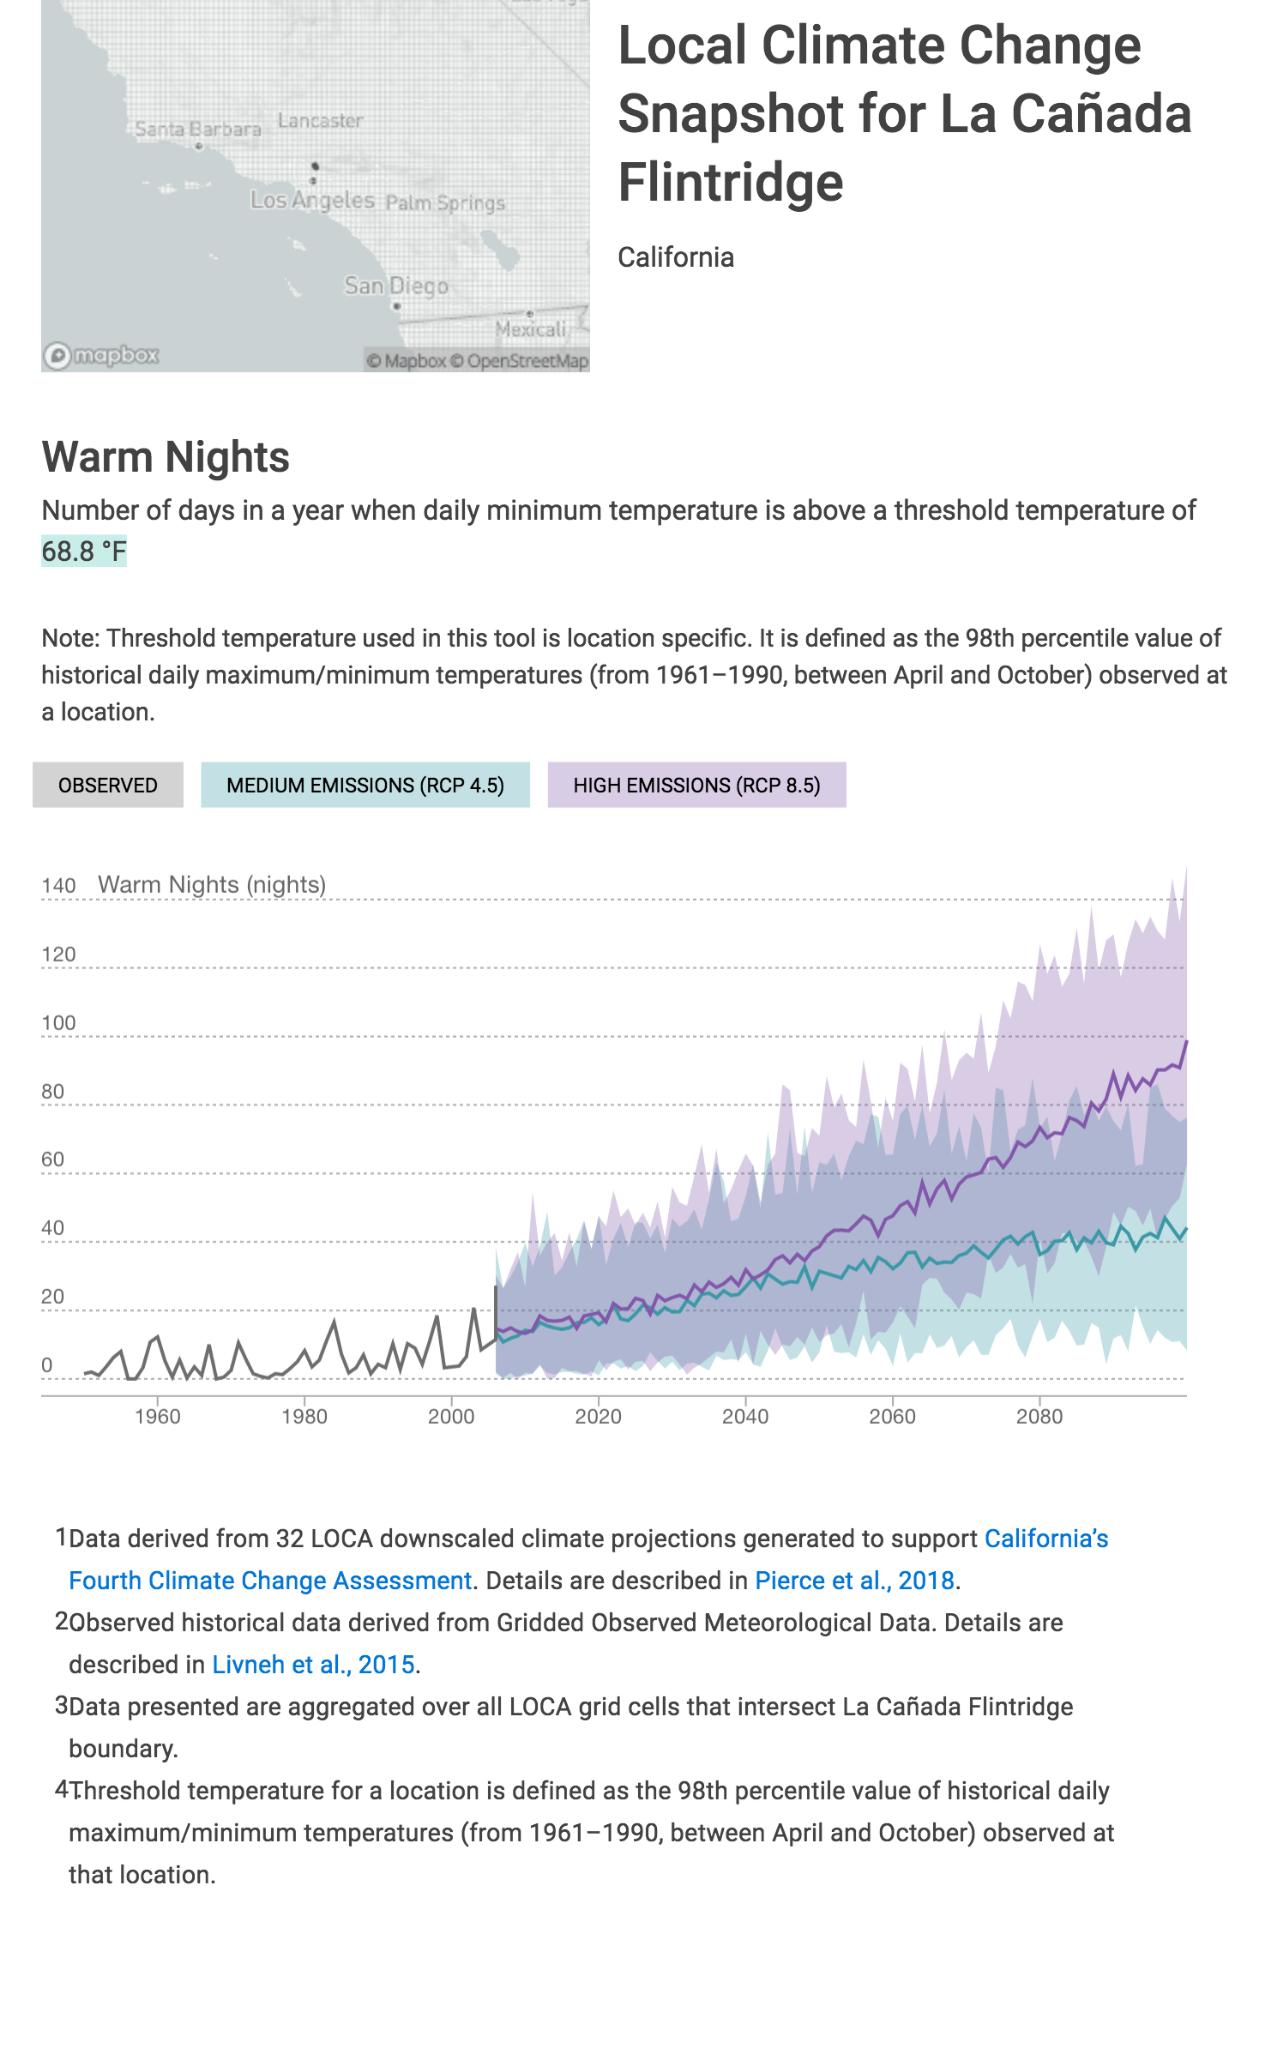
Table 6: From an observed baseline of 4 nights a year, La Cañada is expected to experience a 10-fold increase of warm nights, with 30 warm nights in the near term and the possibility of more than two months worth of warm nights in the long term
4.4.3 Wildfires
Remarkably, given the expected increases in average and extreme temperatures, the annual average area of La Cañada burned by wildfires is projected to remain roughly the same (approximately 115 acres/year) or decrease by the end of the century according to Cal-Adapt. y years will er access and ses
Drought
I dfire impact
( f precipitation ( ater (6 inches)
r sk is extreme. and high ys in each io. Produced
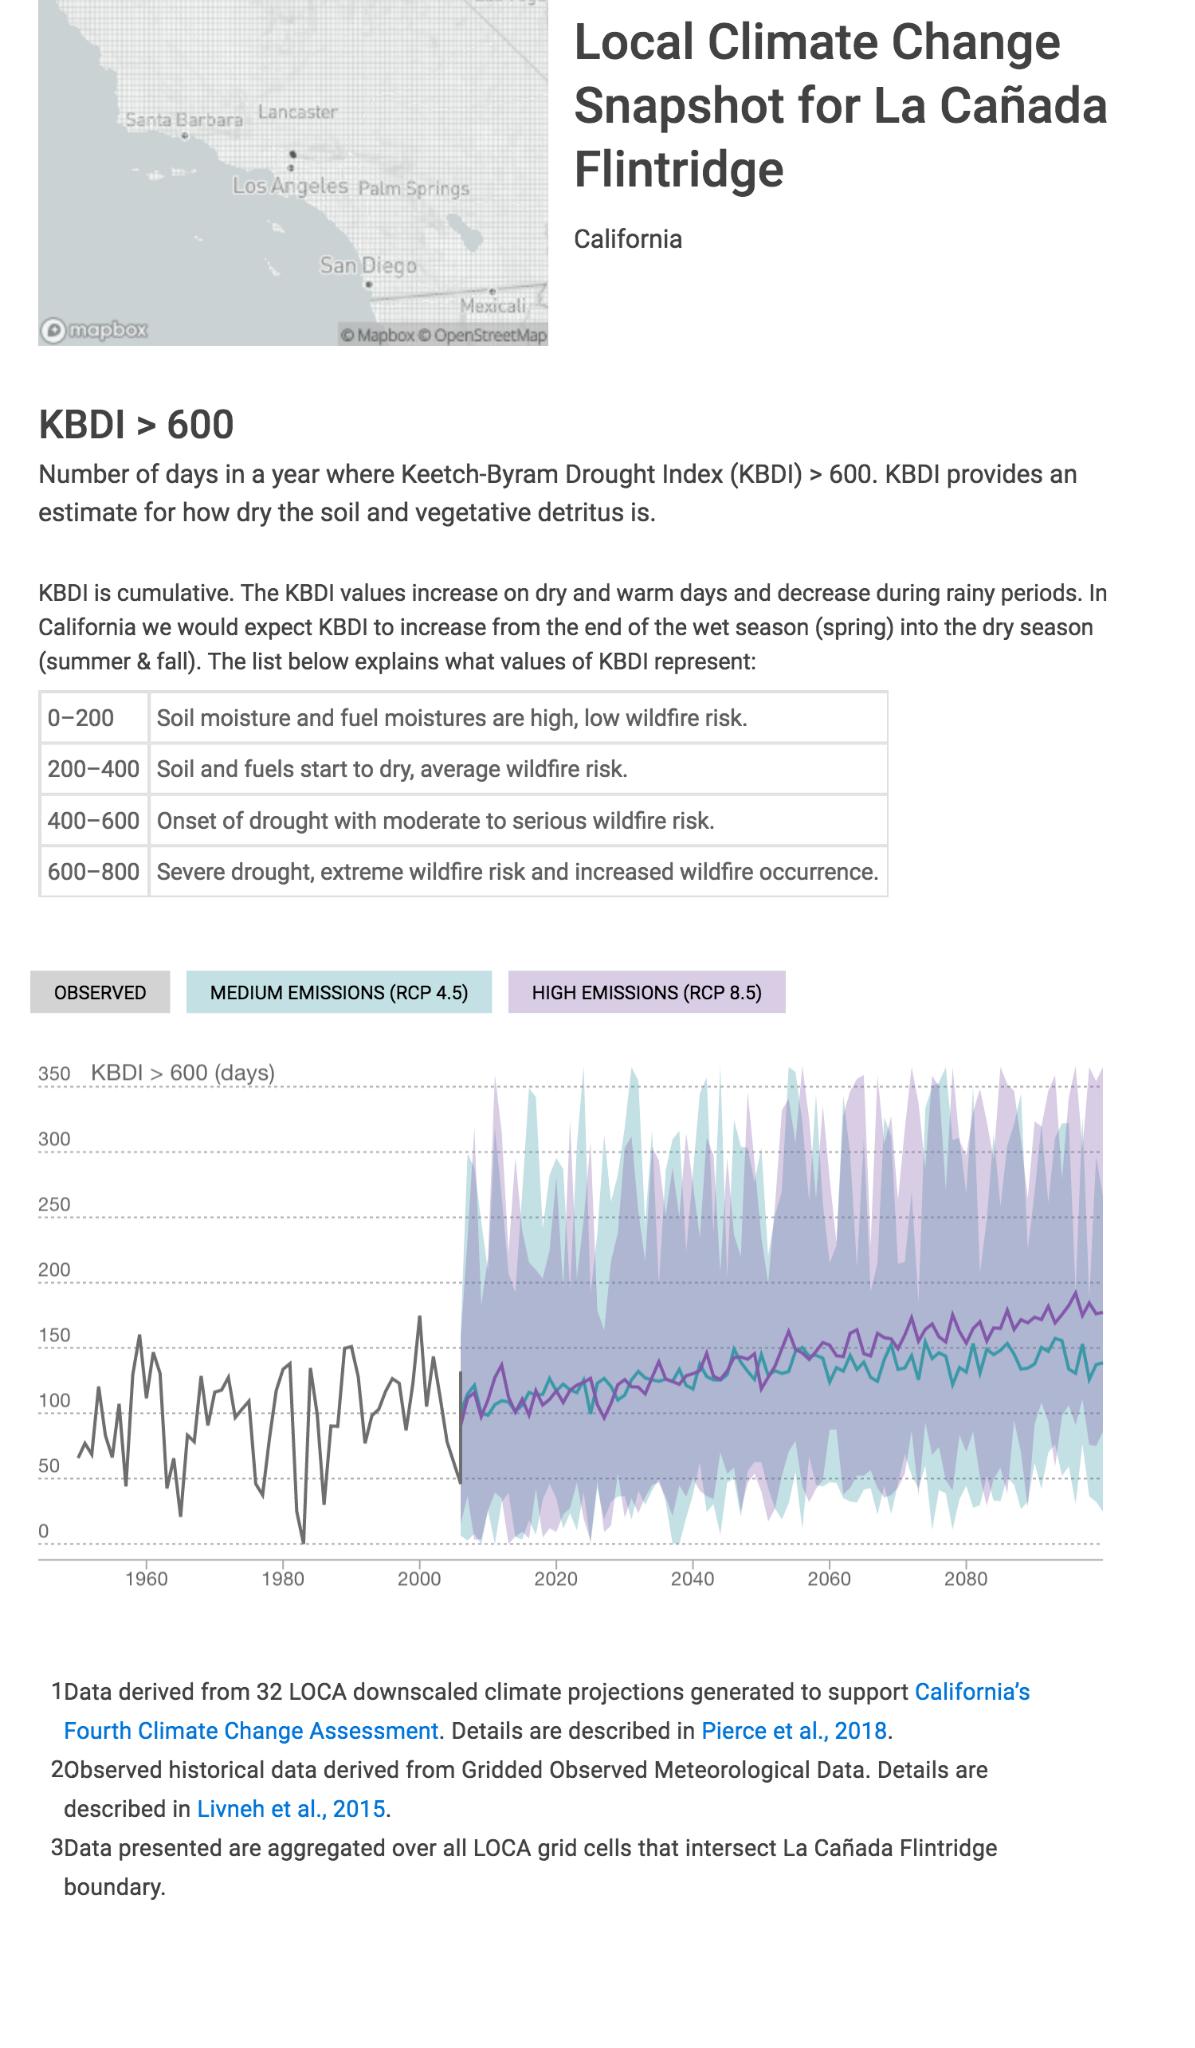
Period Years Emissions Scenario Average Range of Averages Units
Baseline 1961-1990 93 days
Mid-Century 2035-2064 Medium (RCP 4.5) 134 100-175 days
End-Century 2070-2099 Medium (RCP 4.5) 141 90-174 days
Mid-Century 2035-2064 High (RCP 8 5) 140 104-177 days
End-Century 2070-2099 High (RCP 8 5) 169 128-202 days
Table 7: Number of days with KBDI above 600 projected under medium and high emissions scenarios over 30-year periods The average number of days above 600 is expected to increase under both medium emissions and high emissions scenarios
4.3.4 Air Pollution/Air Quality
The Los Angeles County Climate Vulnerability Assessment describes a projected increase of wildfire burn area in the San Gabriel Mountains as high as 50 percent by the end of the century under a high emissions scenario.27 “Areas particularly exposed include the mountainous band of LA County near the Angeles National Forest.” Even if this increase in wildfires in the mountains does not translate to a 1:1 increase in wildfires in La Canada, wildfires are likely to become a greater part of daily life as smoke from these wildfires impacts air quality. Wildfires produce high concentrations of particulate matter, and other harmful air pollutants like nitrogen oxides, Volatile Organic Compounds (VOCs), carbon monoxide, and ozone
The Los Angeles County Climate Vulnerability Assessment projects that climate change will “exacerbate poor air quality in the region, which already experiences some of the worst air quality [levels of particulate matter and ozone] in the country”28
27 Los Angeles County Climate Vulnerability Assessment, p 28
28 ibid, p 32
5. Impacts on La Cañada Assets/Community Sectors
5. Impacts on La Cañada Assets/Community Sectors
Information about the impacts of climate hazards was supplemented by a series of public meetings, and through an internal review process. Specifically, the CAAP Task Force was asked to rank what natural and built assets and facilities and what sectors of the economy were most important to La Cañada’ quality of life. Results receiving 40% or more are shown below.
5.1 Natural Environment
Information about the impacts of climate hazards was supplemented by a series of public meetings, and through an internal review process Specifically, the CAAP Task Force was asked to rank what natural and built assets and facilities and what sectors of the economy were most important to La Cañada’ quality of life. Results receiving 40% or more are shown below.
5.1 Natural Environment
5.1.1 Local Assets
5.1.1 Local Assets
Hundreds of miles long and crossing from ocean to desert, California has always been known for its diverse plants and animals La Cañada in particular has had many species introduced, but has many native plants and animals that thrive throughout the city Some of these include the Great-tailed Grackle, Fuschia Flower Gooseberry, Pineapple-weed, the Glossy Pillar and the California Peony.29 These have been able to thrive because of the amount of open space around La Cañada. Approximately 819 acres of land are owned by the federal government, state, county or the Los Angeles Flood Control District and provide space for plants and animals to live. There is a 24 mile trail system and 5 city parks for public use.30 Providing green spaces is not only good for the ecosystem, but is also good for public health and helps the city maintain visual pleasure.
Hundreds of miles long and crossing from ocean to desert, California has always been known for its diverse plants and animals La Cañada in particular has had many species introduced, but has many native plants and animals that thrive throughout the city Some of these include the Great-tailed Grackle, Fuschia Flower Gooseberry, Pineapple-weed, the Glossy Pillar and the California Peony 29 These have been able to thrive because of the amount of open space around La Cañada Approximately 819 acres of land are owned by the federal government, state, county or the Los Angeles Flood Control District and provide space for plants and animals to live There is a 24 mile trail system and 5 city parks for public use.30 Providing green spaces is not only good for the ecosystem, but is also good for public health and helps the city maintain visual pleasure.
5.1.2
Description of Impacts & Sensitivities
5.1.2
Temperature, Extreme Heat & Drought
Description of Impacts & Sensitivities
Temperature, Extreme Heat & Drought
One impact of extreme temperatures and extended heat waves on the natural environment will be heat stress on plants with the potential for slow native species die-out and replacement by non-native species These tipping points will depend on many factors including species and age Average temperatures and the number of extreme heat days are projected to increase throughout the century, according to Cal-Adapt Higher temperatures combined with less consistent rain will impact both water supply and outdoor water demand Managed landscapes will require greater care and watering Home gardeners and city staff may find formerly tried and true ornamental plants less reliable – or untenable due to new ordinances or demand management measures. The capacity of native, non-native, and ornamental plants to survive in a hotter, drier climate is not known.
Precipitation
One impact of extreme temperatures and extended heat waves on the natural environment will be heat stress on plants with the potential for slow native species die-out and replacement by non-native species. These tipping points will depend on many factors including species and age. Average temperatures and the number of extreme heat days are projected to increase throughout the century, according to Cal-Adapt Higher temperatures combined with less consistent rain will impact both water supply and outdoor water demand Managed landscapes will require greater care and watering Home gardeners and city staff may find formerly tried and true ornamental plants less reliable – or untenable due to new ordinances or demand management measures The capacity of native, non-native, and ornamental plants to survive in a hotter, drier climate is not known
& Flooding
Precipitation & Flooding
Located at the foot of the San Gabriel Mountains, La Cañada Flintridge is exposed to the effects of increased precipitation and resultant flooding, which can considerably impact its rich natural environment Heavy rainfall can cause the city's streams to rapidly overflow, leading to substantial disruptions in the local ecosystem populated by diverse native and non-native species These events can lead to widespread soil erosion, displacing plant life, upsetting animal habitats, and potentially shifting non-native species to new regions, thus destabilizing the ecological balance. Downed trees may be more common as trees rooted in soils saturated from previous storm events contend with heavy winds. The city's cherished green spaces and hiking trails, central to the local environment and recreational life, can sustain severe damage due to heavy rainfall and flooding. This could necessitate closures for repair, depriving residents of their favorite outdoor activities and impacting the city's aesthetic charm Flooding can also cause damage to the city's
Located at the foot of the San Gabriel Mountains, La Cañada Flintridge is exposed to the effects of increased precipitation and resultant flooding, which can considerably impact its rich natural environment Heavy rainfall can cause the city's streams to rapidly overflow, leading to substantial disruptions in the local ecosystem populated by diverse native and non-native species These events can lead to widespread soil erosion, displacing plant life, upsetting animal habitats, and potentially shifting non-native species to new regions, thus destabilizing the ecological balance Downed trees may be more common as trees rooted in soils saturated from previous storm events contend with heavy winds. The city's cherished green spaces and hiking trails, central to the local environment and recreational life, can sustain severe damage due to heavy rainfall and flooding. This could necessitate closures for repair, depriving residents of their favorite outdoor activities and impacting the city's aesthetic charm. Flooding can also cause damage to the city's
public parks, leading to losses of trees and other plant life and requiring substantial restoration efforts.
29 “Observations ” INaturalist, https://www inaturalist org/observations?place id=4290&view=species
30 Open Space and Recreation Element - La Cañada Flintridge, California
Wildfires & Air Pollution
https://cityoflcf org/wp-content/uploads/2019/09/General Plan Open-Space Recreation pdf
29 “Observations ” INaturalist, https://www inaturalist org/observations?place id=4290&view=species
30 Open Space and Recreation Element - La Cañada Flintridge, California https://cityoflcf.org/wp-content/uploads/2019/09/General Plan Open-Space Recreation.pdf
According to the City’s Local Hazard Mitigation Plan, La Cañada Flintridge has been designated as being completely in a very high fire hazard severity zone The surrounding San Gabriel Mountains to the North and San Rafael Hills to the South are considered to be interface areas, presenting great potential for wildfires within La Canada Flintridge, as well as the potential to create unhealthy levels of air pollution within City limits.
public parks, leading to losses of trees and other plant life and requiring substantial restoration efforts.
Wildfires & Air Pollution
public parks, leading to losses of trees and other plant life and requiring substantial restoration efforts.
Wild
fi
res & Air Pollution
According to the City’s Local Hazard Mitigation Plan, La Cañada Flintridge has been designated as being completely in a very high fire hazard severity zone. The surrounding San Gabriel Mountains to the North and San Rafael Hills to the South are considered to be interface areas, presenting great potential for wildfires within La Canada Flintridge, as well as the potential to create unhealthy levels of air pollution within City limits.
5.2 Built Environment
According to the City’s Local Hazard Mitigation Plan, La Cañada Flintridge has been designated as being completely in a very high fire hazard severity zone. The surrounding San Gabriel Mountains to the North and San Rafael Hills to the South are considered to be interface areas, presenting great potential for wildfires within La Canada Flintridge, as well as the potential to create unhealthy levels of air pollution within City limits.
5.2.1 Local Assets
5.2 Built Environment
Buildings
5.2.1
Local Assets
Buildings
La Cañada is a vibrant city in L A County with a total of 6,750 homes, ranking it 79th in the county The majority of these homes, 80%, are owned outright, indicating a strong sense of stability within the community The city features essential amenities such as schools, a library, a community center, city hall, fire stations, a sheriff station, a post office, and a hospital La Cañada's buildings, including critical response buildings, can serve as vital resources for shelter, commerce, and daily life during emergencies. Additionally, the city offers a variety of shops and restaurants along Foothill Boulevard, contributing to its unique character. Moreover, La Cañada is home to the Jet Propulsion Laboratory, further highlighting its significance.
Infrastructure
La Cañada is a vibrant city in L A County with a total of 6,750 homes, ranking it 79th in the county The majority of these homes, 80%, are owned outright, indicating a strong sense of stability within the community The city features essential amenities such as schools, a library, a community center, city hall, fire stations, a sheriff station, a post office, and a hospital La Cañada's buildings, including critical response buildings, can serve as vital resources for shelter, commerce, and daily life during emergencies. Additionally, the city offers a variety of shops and restaurants along Foothill Boulevard, contributing to its unique character. Moreover, La Cañada is home to the Jet Propulsion Laboratory, further highlighting its significance.
Infrastructure
Infrastructure is very important for evacuation and keeping the necessary systems running before, during and after a hazard event. Freeways, streets and bridges provide adequate evacuation routes and transportation throughout the city. Highway 210 runs northwest and southeast while Highway 2 runs northeast providing access to the mountains and south towards Glendale. There are 38 bridges in La Cañada, most of which were built in the 1970’s. 95.6% of them are in satisfactory condition or better.31 The nearest airport to La Cañada is Hollywood Burbank Airport which is 16 miles from downtown, or a 17 minute drive. The larger Los Angeles International Airport is located 32 miles away, or roughly 45 minutes Only costing $1 75 with student and senior discounts available, public transportation is a very economic and environmentally friendly way to get around 32 However, access from La Cañada is limited, as rail lines do not extend to the city
Infrastructure is very important for evacuation and keeping the necessary systems running before, during and after a hazard event. Freeways, streets and bridges provide adequate evacuation routes and transportation throughout the city. Highway 210 runs northwest and southeast while Highway 2 runs northeast providing access to the mountains and south towards Glendale. There are 38 bridges in La Cañada, most of which were built in the 1970’s. 95.6% of them are in satisfactory condition or better.31 The nearest airport to La Cañada is Hollywood Burbank Airport which is 16 miles from downtown, or a 17 minute drive The larger Los Angeles International Airport is located 32 miles away, or roughly 45 minutes Only costing $1 75 with student and senior discounts available, public transportation is a very economic and environmentally friendly way to get around 32 However, access from La Cañada is limited, as rail lines do not extend to the city
There are three waste disposal services in La Cañada that provide trash, recycling, compost pickup, and street sweeping. There are four water companies and facilities that help treat water and manage our most important resource. The same companies provide sewage collection and irrigation throughout the city. Private water and utility facilities are also included in this category because they function in a public capacity.
There are three waste disposal services in La Cañada that provide trash, recycling, compost pickup, and street sweeping. There are four water companies and facilities that help treat water and manage our most important resource. The same companies provide sewage collection and irrigation throughout the city. Private water and utility facilities are also included in this category because they function in a public capacity.
31 “Bridge Statistics for La Canada Flintridge, California (Ca)Condition, Traffic, Stress, Structural Evaluation, Project Costs.” Bridge Statistics for La Canada Flintridge, California (CA) - Condition, Traffic, Stress, Structural Evaluation, Project Costs, http://www city-data com/bridges/bridges-La-Canada-Flintridge-California html
32 “Metro: Bus, Rail, Subway, Bike & Micro in Los Angeles ” LA Metro, 1 Dec 2022, https://www metro net
31 “Bridge Statistics for La Canada Flintridge, California (Ca)Condition, Traffic, Stress, Structural Evaluation, Project Costs.” Bridge Statistics for La Canada Flintridge, California (CA) - Condition, Traffic, Stress, Structural Evaluation, Project Costs, http://www city-data com/bridges/bridges-La-Canada-Flintridge-California html
32 “Metro: Bus, Rail, Subway, Bike & Micro in Los Angeles ” LA Metro, 1 Dec 2022, https://www metro net
The Everbridge emergency notification system allows Crescenta Valley Water District (CVWD) to instantly send critical messages to residents and businesses across multiple communication devices and help educate communities on their water use and emergency information
The Southern California Edison company is the main source of electricity in the whole city Mainly helping provide electricity to residential homes, many businesses and commercial buildings use electricity from the same company La Cañada’s cost for electricity is 87% higher than the rest of the country.33 The electricity companies say using more solar power would reduce the cost. The SoCal gas company is the only company that provides gas to La Cañada and is located in Monterey Park, CA.
There are 6 cell towers in La Cañada that provide cell service and wifi to the city and surrounding areas. AT&T has the best service to access the internet and has been rated number one in best wifi for that area 34 Having these systems work together helps a city mitigate hazards by allowing communication, transportation and access to electricity and water during and after an emergency
5.2.2 Description of Impacts & Sensitivities
Temperature, Extreme Heat & Drought
Increases in temperature and extended heat waves will change the cooling needs of all building types and may tax the energy grid. Pacific Gas & Electric’s Public Safety Power Shutoffs (PSPS) to reduce wildfire risks during heat waves will require alternative and off-grid energy sources to cool residential, commercial, and government buildings.
In general, homeowners in La Cañada have the financial resources to adopt new technologies to manage heat and produce and store renewable energy. Fixed income homeowners and renters have less of an adaptive capacity
Most transportation infrastructure will be unaffected by extreme heat and drought Risk of asphalt softening is limited to extended temperatures above 100°F Safety power shut offs and brownouts caused by heat can cause outages of traffic signals and street lights Extreme heat will increase use of private vehicles at the expense of walking, biking, and taking public transit
Temperature changes and extreme heat throughout the region will impact the availability of the water supply. Today, over 90% of the water consumed is imported from the Colorado River and the State Water Project in Northern California. If the La Cañada Suburban District is partially protected from the risk of decreased snowpack in the Sierra Nevada mountains, supply is projected to decrease by 48-65% by 2100.35 The projected decrease underscores how many of the critical systems and natural resources of La Cañada extend beyond its borders where climate change may produce more extreme impacts
33 “Residential Services ” City of La Cañada Flintridge, 6 May 2022, https://cityoflcf org/public-works/residential-services
34 “Top 7 Internet Providers in La Canada Flintridge, CA.” BroadbandNow, 11 Jan. 2023, https://broadbandnow com/California/La-Canada-Flintridge
35 “Water ” La Cañada Irrigation District, 1 Feb 2019, https://www.lacanadaid.org/water/#:~:text=Today%2C%20over%2090%25%20of%20the,Project%20(Northern%20Calif ornia)%20waters
Water supply issues are heavily regulated and very much in the public eye, in contrast to the climate risk of extreme heat To a degree, water suppliers are already preparing for climate change CalWater is developing new water supplies to improve reliability, including fresh water pumps to fill the delta with fresh water and keep the rising salt water out of it The impacts from climate change to La Cañada water availability may come indirectly through external adaptive measures like increased regulations, including updates to the State’s Model Water Efficient Landscape Ordinance, prohibitions, price increase from their already high water payments and demand management measures, rather than severe restrictions.36
Safety power shut offs and brownouts caused by heat can disrupt pumps in the water supply and wastewater systems.
Precipitation & Flooding
Severe precipitation and repeated flooding may increase stream bank erosion and flooding, causing scour under the numerous bridges and creek crossings. Buried pipes may be exposed and/or damaged. Storm sewers may get backed up and cause localized flooding. With multiple heavy storms occurring yearly by the end of the century, wear and tear on roads and within pipes may require repair and replacement more frequently than planned for.
La Cañada has experienced limited flooding of homes or structures, although there are many buildings that have a 0 2 percent annual chance of flooding, according to FEMA flood maps Hydrologic and hydraulic modeling outside of this report scope would be needed to understand how the risk of flooding in specific areas may increase in the future
Wildfires & Air Pollution
Wildfires pose a greater hazard to structures, including homes, and above ground assets than to underground assets Air pollution from wildfires outside of La Cañada does not have a significant impact on buildings and infrastructure, simply requiring changing filters on buildings and vehicle fleets more frequently
5.3 Economy
The impact of climate hazards on the economy are hard to predict Climate extremes will generally cause more wear and tear of physical assets, leading to shorter lifespans and faster replacement cycles for buildings and infrastructure Increased spending on maintenance will be needed Disasters cause a drop and then rise in expenditures, following Federal assistance and insurance payouts, though in sum disasters produce both environmental and economic losses
36 California, State of “Climate Change and Water ” Department of Water Resources, https://water ca gov/Programs/All-Programs/Climate-Change-Program/Climate-Change-and-Water
5.3.1
Description of Local Assets
La Cañada is known for being a very wealthy city Only 3 3% of the population is in poverty 80% of homes are owned. Currently there are 48 homes for sale ranging from a one acre plot of land going for $699k to a 5 bedroom home costing $11M. The median home price is $2.4M. Property taxes only take 2% of homes total value. Beyond housing, living in La Cañada is expensive: the average cost of living for a family of four is $4,454 per month.37 39.1% of the population works in finance and insurance, scientific and technical services or in educational services, all earning around $100k/year.38 This can be compared to the 20.7% of people employed nationally who work in those well paying fields La Cañada has more people in those industries per capita The average household income is $258,391 La Cañada collects the highest legal local sales tax at 9 5% which provides adequate funds to the city The city has many fees that one may encounter while living there including renting city facilities, paying for building and photography permits, false alarm police response fees and licenses for tobacco and alcohol sales 39 This money not only provides funds to keep the city’s infrastructure intact and keep classroom sizes small, but also provides small businesses grants to help them through tough times like pandemics. Overall La Cañada is ranked the best place in California to raise a family because of how well the city takes care of itself, due to its tax base and natural advantages.40
5.3.2 Description of Impacts & Sensitivities
Temperature, Extreme Heat & Drought
Temperature, extreme heat, and drought are most likely to cause a negative effect on the economy as residents and businesses spend more on air conditioning (and California-wide on food) to maintain the same quality of life Outdoor living is important to quality of life and outdoor comfort is an important free asset for restaurants and retail businesses However, temperature increases and more extreme weather may impact quality of life for residents of La Cañada
Decreasing comfort negatively impacts worker productivity and may disrupt outdoor businesses like landscaping and construction. Temperature-related mortality is also a projected loss. Power outages and brownouts caused by extreme heat will also negatively impact the economy through everything from loss of perishable items to adding uncertainty to business operations. Expensive solutions for managing electricity unreliability like diesel generators add negative environmental externalities. At the same time, the COVID-19 pandemic has been longer lasting and more far reaching than most of the direct climate hazards of the near future.
Precipitation & Flooding
Property damage and temporary disruption of utilities and infrastructure can create temporary or extended loss of operations for businesses, particularly for businesses with non-durable goods. Even perceptions of flood risk and flood safety can influence the housing market.
37 “La Canada Flintridge, CA: Cost of Living, Salaries, Prices ” Livingcost org, 7 Aug 2022, https://livingcost org/cost/united-states/ca/la-canada-flintridge
38 “POPULATION BY OCCUPATION ” Economy in La Canada Flintridge, California, https://www bestplaces net/economy/city/california/la canada flintridge
39 “Master Fee Schedule ” City of La Cañada Flintridge, 3 Oct 2022, https://cityoflcf org/masterfeeschedule/
40 Wire, Stacker via Nexstar Media “Study Ranks the Best Places to Raise a Family in California ” KTLA, KTLA, 13 Aug 2022
Wildfires & Air Pollution
Temporary disruption of utilities and infrastructure from wildfire-related PSPS can create temporary or extended loss of operations When poor air quality keeps people in their home, they are less likely to spend in La Cañada’s stores and restaurants.
5.4 Vulnerable Populations
5.4.1
Description of Local Populations
La Cañada Flintridge, a city with a population of 20,114,41 offers its residents a high standard of living characterized by a high income level and quality of life Comprising merely 0 52% of Los Angeles's size,42 La Cañada maintains a low-density residential structure, with most of its land divided into large plots for single-family homes The backbone of the community is the 59% of people over the age of 35. Throughout the past few years the demographic trends towards an older and more diverse community. Many of these people are commuting because of the type of work that pays enough to live in LA County. There is evidence of economic growth when the number of commuters, home prices and employment increase. Although 26% of the community is above the age of 55, La Cañada has held a high standard of public health.43 According to City-Data.com, “58% of La Canada Flintridge residents report that their diet is generally healthy.”44 This could be due to the fact that not many people work outside With 11 2% of the population being executives and supervisors and 8 7% of the population being lawyers, surgeons and physicians, many people have good health insurance and do not have to work outside in the elements Therefore the population has been staying steady The infrastructure itself has a lot to do with what kind of population is attracted to the area With 62 golf courses within twenty miles of the area,45 La Cañada attracts a more leisurely lifestyle According to Google there are 54 gyms including yoga and martial art studios, workout facilities and private training centers. The population has a very low obesity rate. There are 10 hospitals within 10 miles of the city making sure everyone is safe and healthy. There are no homeless shelters so the one community center provides shelter during emergencies.
41 U S Census Bureau Quickfacts: La Cañada Flintridge City, California www census gov/quickfacts/lacanadaflintridgecitycalifornia
42 Curtis, Hon. Jonathan. Profile of the City of La Canada Flintridge. Southern California Association of Governments (SCAG) Regional Council, May 2019
43 “Health and Nutrition of La Canada Flintridge, CA Residents ” Health and Nutrition of La Canada Flintridge, CA Residents: Sexual Behavior, Medical Conditions, Reproductive Health, Mental Health, Consumer Behavior, Physical Activity, Oral Health, Taste & Smell, Audiometry, Diet Behavior & Nutrition, and More, http://www city-data com/health-nutrition/La-Canada-Flintridge-California html
44 “La Cañada Flintridge, California.” La Canada Flintridge, California (CA 91103) Profile: Population, Maps, Real Estate, Averages, Homes, Statistics, Relocation, Travel, Jobs, Hospitals, Schools, Crime, Moving, Houses, News, Sex Offenders, http://www city-data com/city/La-Canada-Flintridge-California html
45 “La Canada, California Golf Courses ” Golf Link, https://www golflink com/golf-courses/ca/la-canada
5.4.2 Description of Impacts & Sensitivities
Temperature, Extreme Heat & Drought
Projected temperature changes will impact the seasonality and frequency of outdoor recreation, biking and walking, and even passive enjoyment of the outdoors. Outdoor comfort will increase in winter, spring, and fall and decrease in summer. Parks, yards, and other outdoor areas will become undesirable during heat waves, and parking lots and streets may become dangerous to certain populations during extreme heat.
From medical and sociological research, we know that certain populations are more vulnerable to extreme heat However, not all of these populations exist in La Cañada Based on the City’s Local Hazard Mitigation Plan, the vulnerable populations present in La Cañada include the elderly, youth, and the economically disadvantaged Only a small percentage of the City’s population is considered economically disadvantaged Other populations that could be considered disadvantaged include people with chronic or pre-existing medical conditions, people with disabilities, and people with limited English proficiency. If projected temperature changes are experienced, incidences of heat stroke, hospitalization, and heat-related mortality will increase first and foremost within these groups.
Day laborers in landscaping and construction are a vulnerable population who may commute into La Cañada to work outdoors La Cañada does not have experience providing services or communications to this population, so managing their health risk will be a challenge
Precipitation, Flooding, & Landslides
In La Cañada Flintridge, extreme precipitation, flooding, and landslides could significantly impact the city's vulnerable populations. The elderly residents, making up 26% of the population might be at a greater risk due to potential mobility limitations and the physical stress associated with such events Similarly, the community's youth could face amplified safety risks during these extreme weather scenarios The small number of economically disadvantaged portion of the city's population, along with commuting day laborers engaged in outdoor work, could confront severe hardships due to potential loss of property or work, and may lack the resources to recover quickly
The city's infrastructure plays a role in its vulnerability to these hazards as well. Damage to roads and public transportation routes could disrupt the lives of all residents, particularly those relying on public transportation. The community center, the only emergency shelter in the city, could be overwhelmed in large-scale flooding or landslide events, making the lack of alternative shelter options a critical concern. Moreover, residents with chronic or pre-existing medical conditions, disabilities, and those with limited English proficiency may encounter additional challenges during these extreme weather events, from comprehending emergency notifications to accessing necessary medical care, further emphasizing the need for proactive and inclusive emergency planning
Wildfires & Air Pollution
La Cañada Flintridge, with its close proximity to expansive forests, vast vegetation areas, and mountainous terrain, is particularly susceptible to the threat of wildfires. This risk is heightened for residents living near mountains where large trees and dense brush are present The region's drought conditions add to this risk, drying out the vegetation and enabling fires to climb swiftly up canyons, thereby increasing the vulnerability of nearby homes Preparing for, evacuating from, and recovering after wildfires can pose distinct challenges for the city's vulnerable populations These groups include people with limited mobility or functionality, those with chronic or pre-existing medical conditions which could be worsened by poor air quality, and individuals with limited financial resources. Additional vulnerable groups include children, seniors, those with limited access to public transportation, and individuals for whom English is a second language.
The lack of wildfire insurance and inadequate knowledge of the need to regularly reassess the value of homes can leave families unable to rebuild after a fire. Even within affluent La Cañada, some residents may be asset-rich but cash-poor or lack funds necessary for fire mitigation in their tree-dense yards Air pollution, exacerbated by local and distant wildfires, can significantly impact the city's residents, particularly those with respiratory conditions and those who work outdoors However, familiarity with N-95 masks due to the Covid-19 pandemic may provide a degree of protection Looking ahead, the General Plan Safety Element Assessment created in 2020 with the Board of Forestry and Fire Protection and the California Department of Forestry and Fire Protection will be crucial in planning for future risks, emphasizing community education, infrastructure resilience, and environmental stewardship.
6. Summary
La Cañada appears better off than many other areas in California with regards to climate change. La Cañada is not directly coastal so it will not experience the impacts of sea level rise, but its relative proximity to the Pacific Ocean should temper climate extremes somewhat in the near term Earthquakes are projected to be a relatively more common and more damaging hazard than any single climate hazard
Many of the impacts of climate change on La Cañada will not be direct but instead reverberations from nearby La Cañada depends on the natural environment, the water supply system, and the energy grid outside of its borders. So the availability and affordability of water and energy within La Cañada are likely to be jeopardized by climate change across the Bay Area and California as a whole.
Within La Cañada itself, by mid-century particularly under a high emissions scenario, the number of extreme heat days are projected to increase substantially. Heat and poor air quality from wildfires outside of La Cañada are most likely to impact the quality of life, particularly for vulnerable populations, and increase energy demands for additional building air cooling/filtering Extreme heat, poor air quality, and blackouts or PSPS that occur simultaneously will present novel emergency situations that have the potential to strain or overwhelm City resources
Similarly and more uncertain will be the resilience of La Cañada natural and maintained landscapes. The annual precipitation amounts in La Cañada are not likely to change, but will become less consistent and in combination with expected temperature increases will in turn increase the amount of water that plants need. Considering pressure on the shared water supply system which La Cañada relies on, it is likely that water customers will face financial incentives and regulatory pressure to reduce daily water use.
In the winter and spring, seasonal storms which La Cañada has experienced in the past are likely to continue Rainfall amounts that used to occur once every several years are projected to occur multiple times a year by the end of the century, increasing the need for maintenance and repair of stormwater infrastructure on building sites and across the city
La Cañada government, residents, and businesses are somewhat prepared after living through years of drought and the Covid-19 pandemic. The scale of climate change and the need to reach new vulnerable populations during heat waves may be challenging.
APPENDIX B: CAAP Stakeholder Report
Prepared by:

CAAP Stakeholder Report
Stakeholder Workshops
May 18, 6:00 – 8:00 p m
May 20, 1:00 – 3:00 p m
Attendance
Roughly 25 people per event
A list of names is on the last page of this report.
Location
City Council Chambers
Approach
As the City of La Canada Flintridge moves into the strategy development phase of the CAAP, the city conducted two workshops to better understand the high-level priorities of the community The goal of these stakeholder events was to provide a discussion forum on a range of issues relating to the development and implementation of new and expanded environmental goals and strategies
Kristin Cushman, CEO of Blue Strike Environmental facilitated the discussion, along with Ben Fordham with Blue Strike and Eleni Getachew with Impact Sciences. Emily Stadnicki, city staff, was in attendance.
Blue Strike presented the stakeholders with strategies that are considered best practices in the climate industry, organized into four sectors: Transportation, Energy, Resource Conser vation, and the Green Community As each best practice was introduced, the conversation revealed how relevant each was to the city and uncovered existing gaps and opportunities worth discussing
In the gap analysis section of this report, each best practice is listed, followed by baseline findings and reactions as well as gaps that need to be further addressed From this baseline and gap analysis, we created a first draft of preliminary recommended strategies that we might want to further vet as a CAAP Committee
In the TOP 10 “Bang for your Buck'' section, we have compiled a list of the one thing that each stakeholder would hope to see enacted in the CAAP Each stakeholder was asked “What one thing would be on your wishlist that you would like to see in the CAAP? ” and “What is one thing that you think is realistic that you hope to see in the CAAP? ” .
GAP Analysis
Transportation
GAP Analysis
Initiate a car free day for the school district
Baseline
ol district of students live outside of the city limits. Many parents shuttle their would like to have another option. Kids use the public transit after d. bus system. ons for transporting kids to private school.
● A large percentage of students live outside of the city limits. Many parents shuttle their kids to school but would like to have another option. Kids use the public transit after school to get around.
Gaps
● There is no school bus system.
● There are no solutions for transporting kids to private school.
Recommendation
● Revisit initiating a school bus route.
● Expand and promote car sharing programs.
● Im prove safety by adding more sidewalks around town
Improve connectivity of transportation network
chool bus route.
Baseline
te car sharing programs. adding more sidewalks around town.
● There is an existing cross-town shuttle but it is not electric
● People did not think a Scooter program would make sense along Foothill
● An estimated 15% of students live outside of the district
Gaps
ation network
● There was concern that the bus was not frequent enough; the website is not reliable
● The bus route does not expand into the neighborhoods; concern about the steep h ills.
cross-town shuttle but it is not electric. k a Scooter program would make sense along Foothill. of students live outside of the district.
● As school lets out, it is often that the buses are so crowded that students can’t get on.
● There are no easy transit options to move people beyond the city.
● Need more reliable links to get to the Metro.
● Cost Recommendation
● Expand and promote car sharing programs.
● Expand transit route and frequency;
● Estimated 20-30 minute wait between pick up times.
that the bus was not frequent enough; the website is not reliable. not expand into the neighborhoods; concern about the steep h ills. t is often that the buses are so crowded that students can’t get on. ransit options to move people beyond the city. links to get to the Metro.
● Transition bus and/to all electric.
● Consider rideshare options to LAX, similar to the beach bus.
● Assess and promote Park- n- Ride options for commuters outside of the city.
● Consider an eBike sharing program in and around the city
● Consider hybrid schedules for people who work in and out of the city
te car sharing programs. e and frequency; inute wait between pick up times. to all electric.
options to LAX, similar to the beach bus.
e Park- n- Ride options for commuters outside of the city. sharing program in and around the city. hedules for people who work in and out of the city.
Explore preferred EV-only parking spaces in high traffic areas
Baseline
● There was a lot of interest in better supporting EV parking in town; by a show of hands, roughly 90% of the people owned EVs
Gaps
● Although people liked the idea of preferred parking spaces, they all charge at home so didn’t feel the need to add charging stations.
● Two EV charging stations not working
Recommendation
● Conduct an assessment to understand if current EV charging infrastructure is suffici ent for visitors.
● Consider high traffic areas where preferred parking could be implemented (grocery stores, Town Center, etc.)
● Consider an anti-idling campaign.
Set goal of all new City vehicle purchases as EVs by 2030
Baseline
● There are three city-owned vehicles
● Overall discussion on how small the city ’s emissions will be; a large focus of the CAAP should be around residential behavior change programs and incentives
Gaps
● None
Recommendation
● Establish a “purchasing standard” that requires the city to transition vehicles to all electric as new vehicles are purchased
Incorporate a bike lane through town
Baseline
● There was little interest in biking; a few raised their hands and said they would bike more often if there was a bike route within the city.
● The streets are wide enough to earmark space for a bike lane along Foothill and in the neighborhoods.
Gaps
● The steep hills were a primary deterrent to biking.
● Crossing the bridge i nto town across 210 is not safe for walking or biking.
● The physical layout of the city makes walking and biking challenging.
● No organized bike parking infrastructure.
Recommendation
● Write a Bicycle and Pedestrian Plan
Energy
Consider renewable natural gas programs
Baseline
● Eliminating natural gas in residential homes was not well received.
● We spoke about some renewable natural gas programs that could be an option, but most were skeptical.
● Other REACH codes were discussed, and people seemed more interested in energy efficiency and solar.
● We discussed the commercial Green Business Program and how that could be transitioned into a residential program.
● Discussed long term conce pts around creating a city run “virtual power plant ” , similar to the city of Lancaster
Gaps
● There is no city staff dedicated to educating residents on where to find resources or to answer questions; need staff rather than another resource page on the website
● Residential solar seems to have challenges due to the large number of trees
● There are no incentive programs within the city to subsidize the cost of energy efficiency
Recommendation
● Consider joining the Clean Power Alliance that would build revenue that could be reinvested in city projects and incentive programs.
● Promote the Green Business Program to commercial businesses.
● Consider possible local-level initiatives to implement city policies or incentives to reduce natural gas use
Mandate energy retrofits at the time of property resale
Baseline
● People felt that education was a better approach than making a requirement (i.e. All remodels are required to transition to a ll electric).
Gaps
● Assess the need.
● Learn about CPACE which is a funding mechanism assigning retrofit cost to the value of your home.
Recommendation
● Establish REACH code: Upgrade electrical panel with sufficient capacity to ser ve electrical equipment and appliances, and electric vehicle
● Offer a fast track permitting process for residential energy upgrades
Ban gas-powered lawn equipment
Baseline
● It was clear that this was a hot topic By a show of hands, 90% of the people expressed anger around this topic
● We discussed the recent vote by the City Council to not approve this ban
● GHG emission inventory includes yard equipment and construction vehicles
Gaps
● Need a better understanding of why this ban got voted down.
Recommendation
● Ban gas-powered lawn equipment.
Explore renewable energy and battery storage for City facilities
Baseline
● People liked this idea and suggested the City Hall building , High School, or Library Gaps
● There are no emergency shelters with the ability to maintain power during a climate crisis.
● There is a need for a list of solar installers in the area, similar to the Tree Arborist list.
● Elementary school is going through renovation, but plans do not include solar.
● Need to prepare for Public Power Shut off events Recommendation
● Write a formal Emergency Preparedness Plan
● Communicate how to access this plan across all demographics within the city
● Consider a residential and commercial “Bulk Purchasing ” solar agreement to bring upfront costs down Campaign: Solarize LCF
Resource Conser vation
Require water-saving landscaping in all new construction
Baseline
● La Canada has a lot of land covered by residential lawns. By a show of hands, 50% said they would give up thei r lawns for more native plants. Gaps
● No education around the state’s native plant incentive programs.
● No control of the water companies Recommendation
● Establish REACH code: Require irrigation with recycled water for common landscaping in single-family developments.
● Limit residential water use during drought months; establish enforcement strategies
Establish franchise agreement for waste hauling
Baseline
● There are multiple waste haulers which makes recycling programs confusing They each have different recycling guidelines. Gaps
● No Consistency
● Not enough education
● There is no focus on SB 1383 food waste and recovery ordinance.
● Schools offer a great opportunity to launch zero waste programs and education; start young.
● City trash cans not labeled; no recycling at City Hall. What about across town? Recommendation
● Author a Franchise Agreement for the entire city.
● Expand diversion policies according to state mandated SB 1383 food recovery networks.
● Partner with the High School Environmental Club to pilot a zero-waste program.
● Partner with waste haulers to bring zero waste programs to all city sponsored community events
● Consider a publicly accessible Reuse, Repair, Recovery, and Refurbishment outlet (partner with a local non-profit)
● Pair all city owned trash cans with a recycle bin
Design a Train the Trainer campaign to disseminate information around waste and energy initiatives
Baseline
● There fractured communication structures within waste, water, and energy utilities Gaps
● There is no formal structure for disseminating information beyond city channels
● Need more consistent marketing
Recommendation
● Establish Neighborhood Watch programs to create stronger, more mobilized communities
● Create a database of resources and incenti ves to promote through city and community channels
▪ Partner with nonprofits such as the Climate Coalition and the High School’s Environmental Club
Green Community
Create guidelines for improved stormwater management and thermal comfort in new construction
Baseline
● There was concern about the lack of planning around stormwater capture. Gaps
● Need a formal plan.
Recommendation
● Write a Stormwater Management Plan in partnership with the County
Improve the use of su stainable materials in new construction
Baseline
● The city is replacing median strips with native plants. People like this. Gaps
● Sug gest a ban on plastic grass.
● Is there a city policy to use reflective materials when replacing a roof?
Recommendation
● Explore Passive House standards.
● Increase the number of LEED certified buildings
● Continue to expand the replacement of median strips with native plants
Identify areas of town that could be targeted for community gat hering places
Baseline
● Consider tearing down one of the gas stations on Foothill for more green space
● Sug gested a Pollinator Garden on Edison Row or Fourth and Olive
● Sug gested space near the high school administrative office
● There is no need for community gardens given the large properties Are schools an opportunity?
Gaps
● The city still uses insecticides.
● Green space has decreased in recent years.
Recommendation
● Target Section 5 as a Sustainability Commons a rea to create a best practice and showcase for the CAAP.
● Designate 10% percent of land as green space.
* The one area that was not brought up is Housing or food
● Tie climate resilience into city general planning
● Identify locations for emergency locations
* The one area that was not brought up is Housing or food
Climate Resilience
● Tie climate resilience into city general planning
● Identify locations for emergency locations
- Make sure these locations have microgrids
TOP 10 “Bang for your Buck” List
TOP 10 “Bang for your Buck” List
thing that you think is realistic that you hope to see in the
What is one thing that you think is realistic that you hope to see in the CAAP?
ty charging stations.
More community charging stations.
Route 33 and 3 buses have very low ridership
buses have very low ridership. at restaurants
Better disposal at restaurants
Ban gas powered lawn equipment and subsidize the transition to electric
ed lawn equipment and subsidize the transition to electric.
CAAP?
Reach out to the Arroyos and Foothill Conser vancy about native habitat in open spaces
e Arroyos and Foothill Conser vancy about native habitat in open spaces. ation on the cost savings of electric powered lawn versus gas powered equipment.
Provide information on the cost savings of electric powered lawn versus gas powered equipment
Ban astroturf
Offer the schools more solar powered resources
Promote water reclamation
ls more solar powered resources reclamation.
Don’t waste money on bike lanes We are not going to bike our way out of climate change
Need a stormwater plan implemented before next rainy season
Put recycling bins next to all trash cans.
oney on bike lanes. We are not going to bike our way out of climate change. ater plan implemented before next rainy season.
Promote induction stovetops.
Manage tree trimmings so that existing trees provide shade over streets.
ns next to all trash cans.
Provide trolleys on the hillsides.
ion stovetops
Join the Clean Power Alliance.
mmings so that existing trees provide shade over streets. on the hillsides.
Buy out the gas station on Angeles Crest and put in an EV Center.
Ban gas powered lawn blowers.
Power Alliance.
Create an LLC to join a CCA.
Create a pollinator garden on the Edison right-of-way behind Armstrong Nursery.
station on Angeles Crest and put in an EV Center. ed lawn blowers
Add 20 more EV charging stations.
More CAAP outreach from the city and its consultants.
o join a CCA.
tor garden on the Edison right-of-way behind Armstrong Nursery.
V charging stations.
What one thing would be on your wishlist that you would like to see in the CAAP?
reach from the city and its consultants.
Phase out natural gas
No free parking
hing would be on your wishlist that you
Don’t reinvent the wheel; work with similar sized cities to brainstorm
Pass all electric building & Renovation codes
o see in the CAAP?
ral gas
Solar panels on schools
Go all electric and hydrogen from renewable sources
Solar panels on every roof
Make LCF safe for pedestrians and bikes all over town
Capture runoff water
. the wheel; work with similar sized cities to brainstorm. building & Renovation codes. schools.
Make people want to move to LCF for our schools and our green community.
Can we transform Kinetic energy from our cars into energy?
nd hydrogen from renewable sources every roof.
Install enough solar + storage to power 100% of our electrical needs.
Finish sewer projects.
Sidewalks.
or pedestrians and bikes all over town. water.
More meetings to inform us of changes and what else is needed?
Require Passive House building standards.
ant to move to LCF for our schools and our green community.
Join the Clean Power Alliance.
rm Kinetic energy from our cars into energy?
olar + storage to power 100% of our electrical needs. ojects.
to inform us of changes and what else is needed?
Attendees
NAME ORGANIZATION
Dana Coyle LCF Resident
Mike Leininger Chamber of Commerce, Community Center
Sue Dieta Homeowner
David Kangritsch LCF Resident
Judith Trumbo LCF Climate Coalition
Hailey Chee LCHS
Ron Dietel Homeowner
Kim Bowman City Council
Alex Koleda LCHS
Charlotte Koleda LCHS
Carol Caley Climate Action Committee
Stephanie Tona Community member
Yves Baetslé
Mia Alva Outlook Valley Sun
Julie Kane-Ritsch LCF Climate Coalition
Mary Nelson LCF Climate Coalition
Steven Berard LCHS
Melid Li LCHS
Kioni Baetsle UC Berkeley
Karen Wong LCF Climate Coalition
Margo Kidushin
Nalini Lasiewicz Lasiewicz Foundation
Anna Zueva
Emilie Watts
Rhiannon Liewer
Mooria Greenwood
Senir A Wong
Linnea Lourenco TLC
Jeff Booth
Nina Jazmadarian FMWD
Katie Poole
Rody Stepherson SRLF
John Hale LCFCC
Thomas Shier Citizen
Jacob Harp LCHS
Elisa Booth LCF Climate Coalition/LCHS
Hilam Petrizzo Resident
Michael Gips Resident
Julie Townsend Resident
Ben Davis LCHS/LCFCC
Max Smith LCHS
Sur vey Results
Sur vey Results
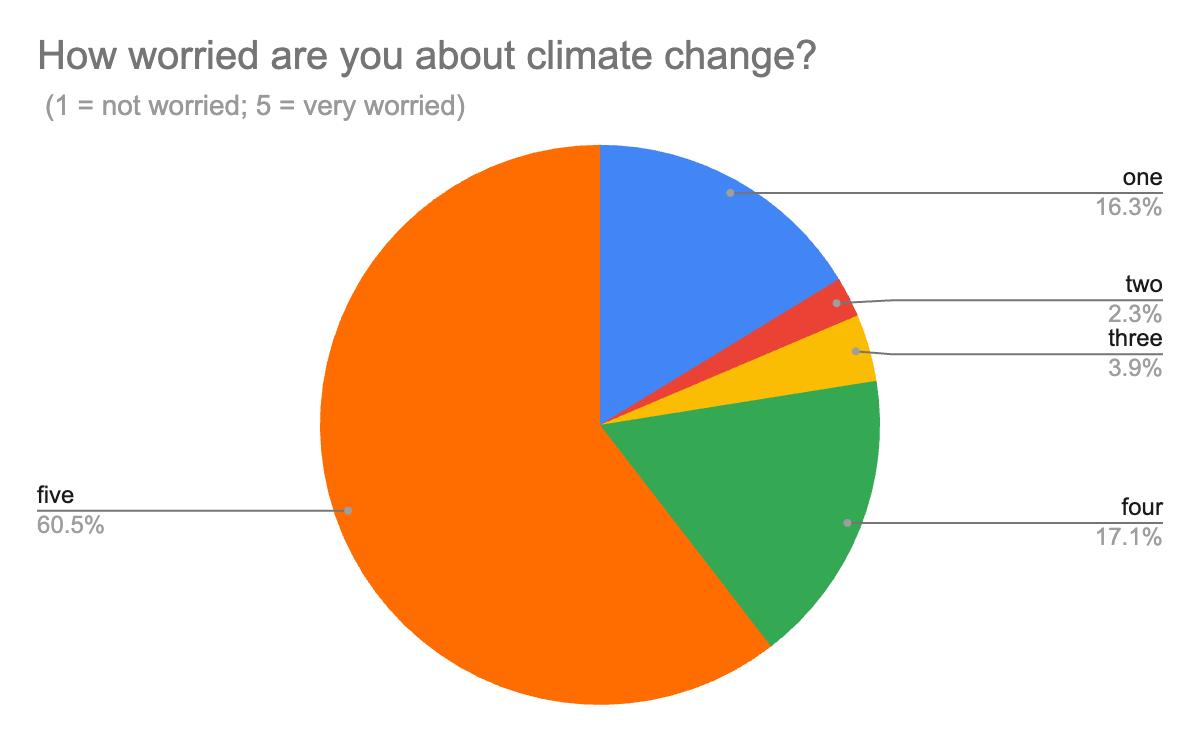
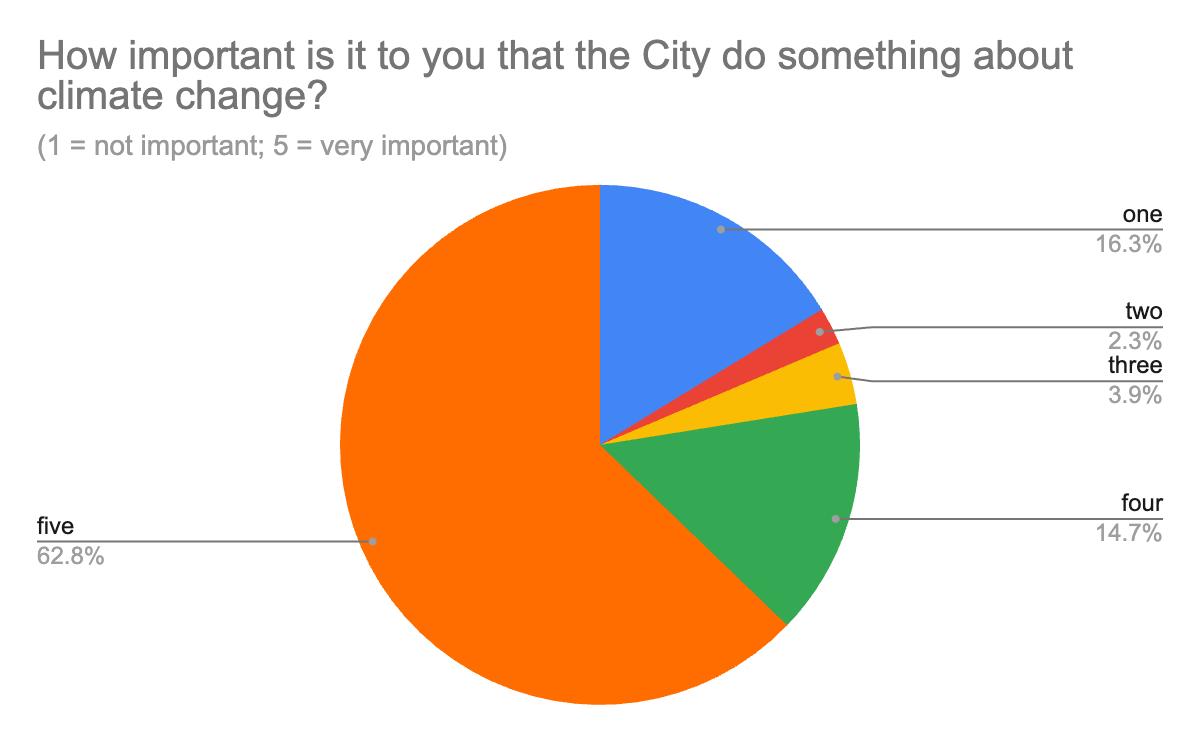
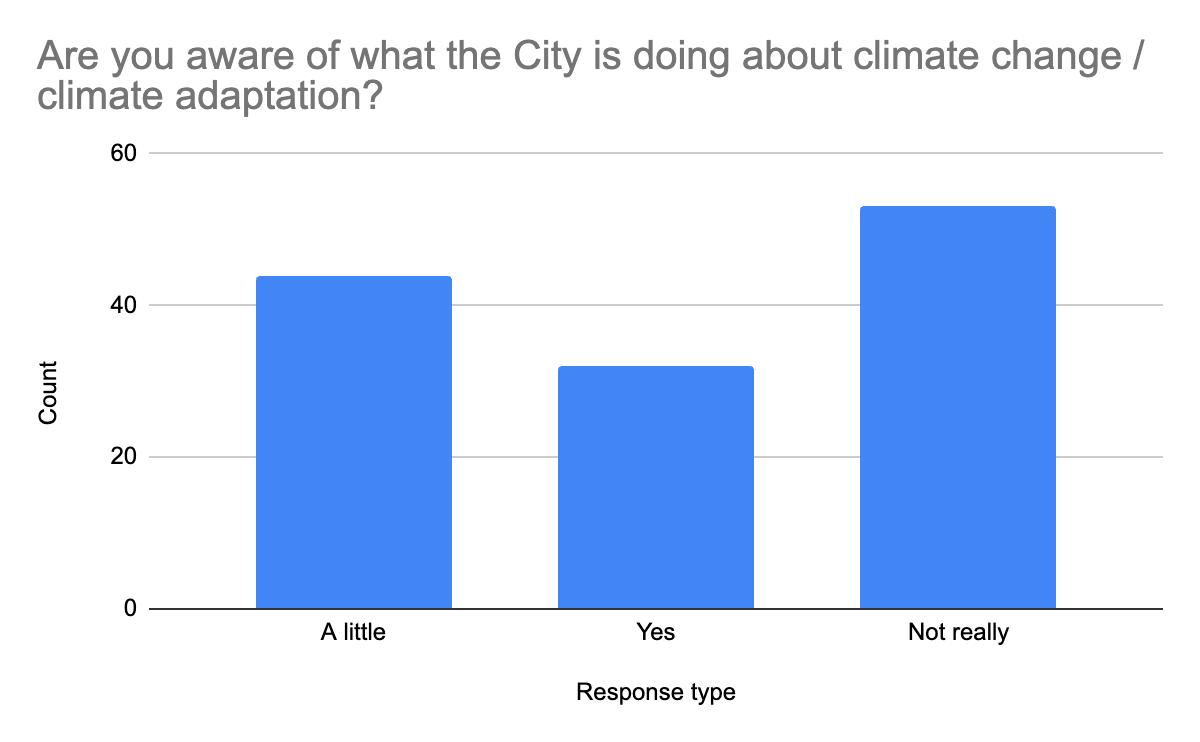
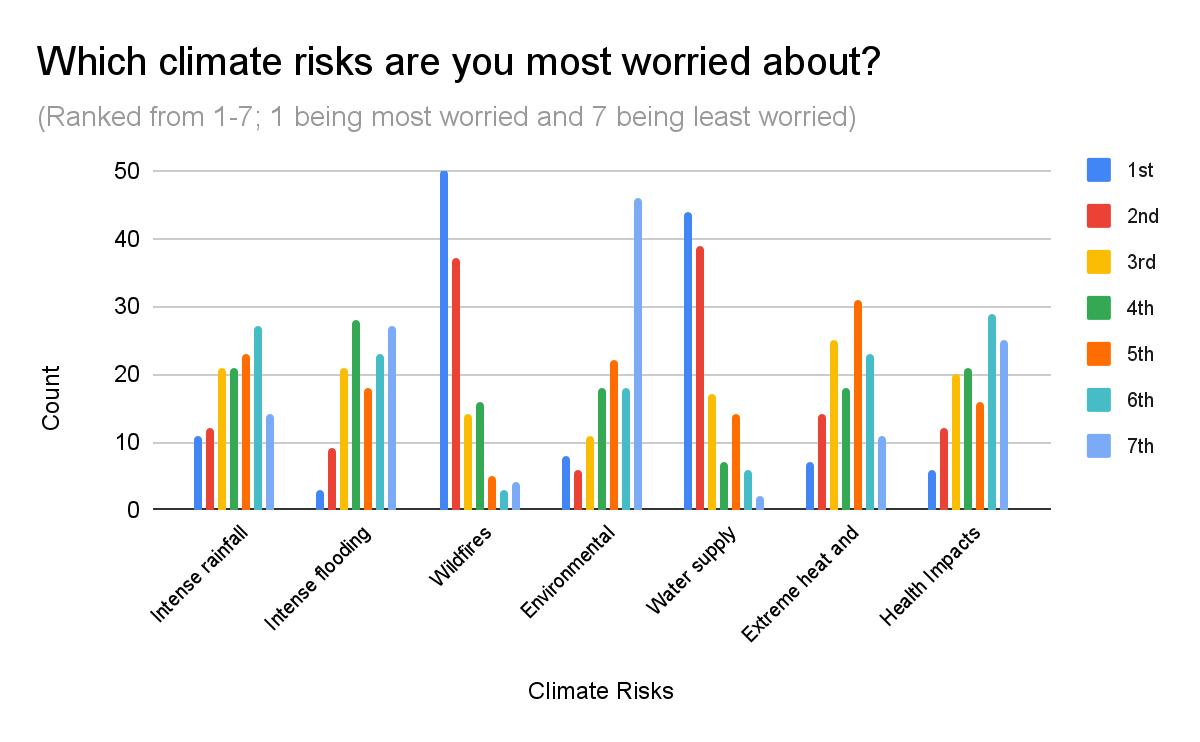
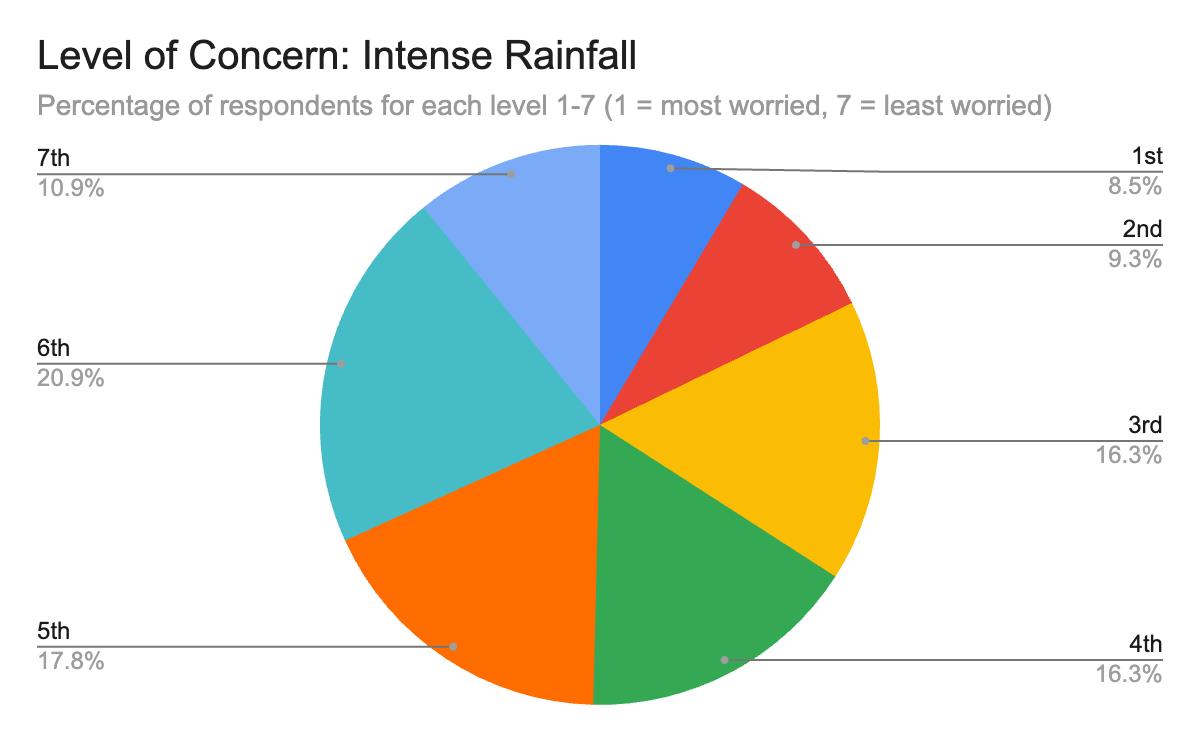
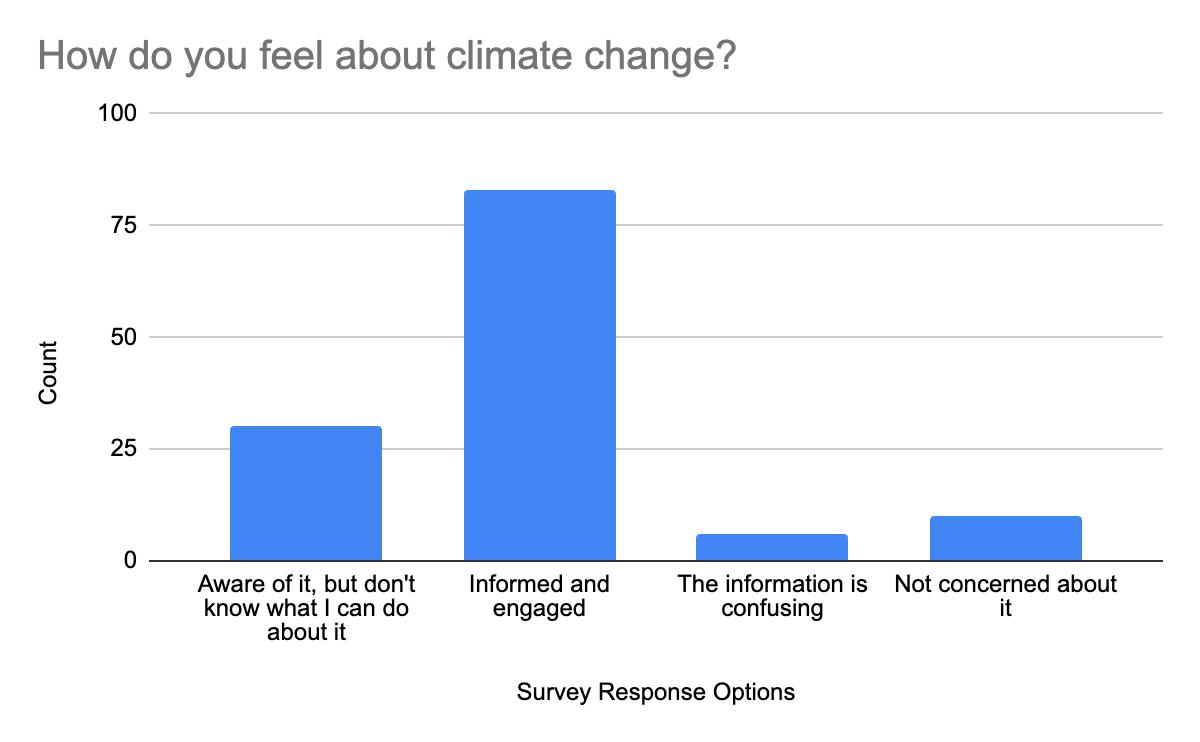
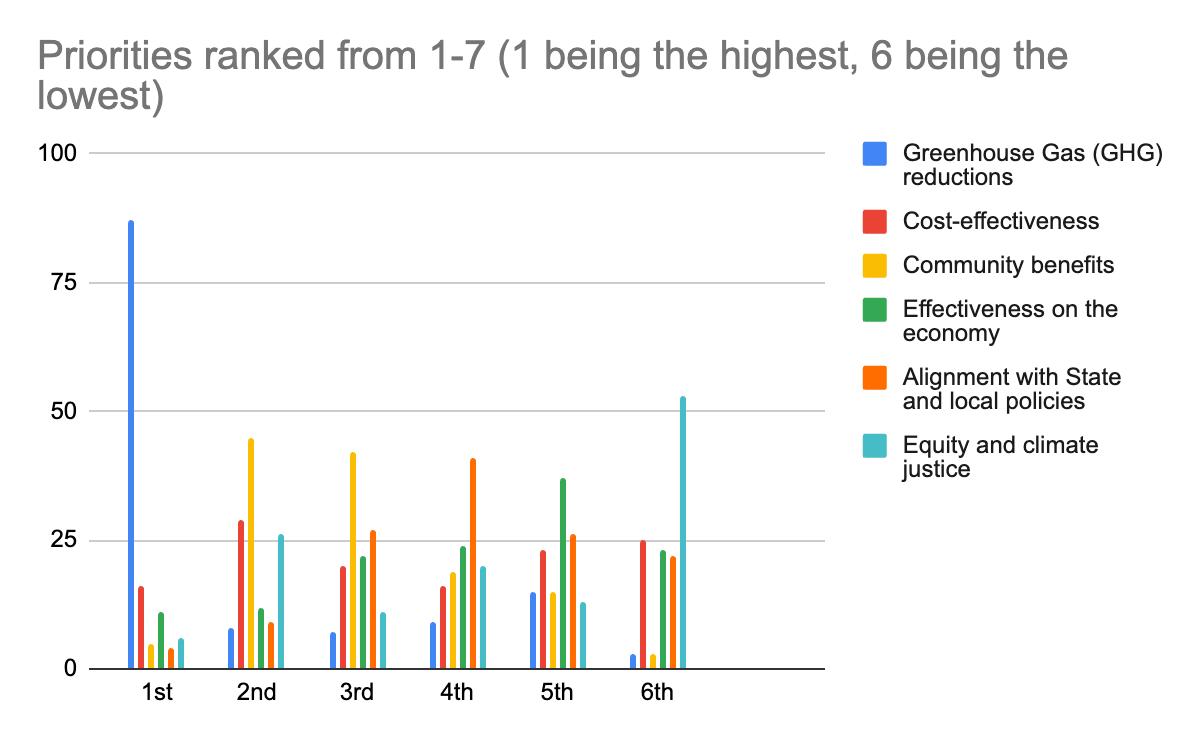
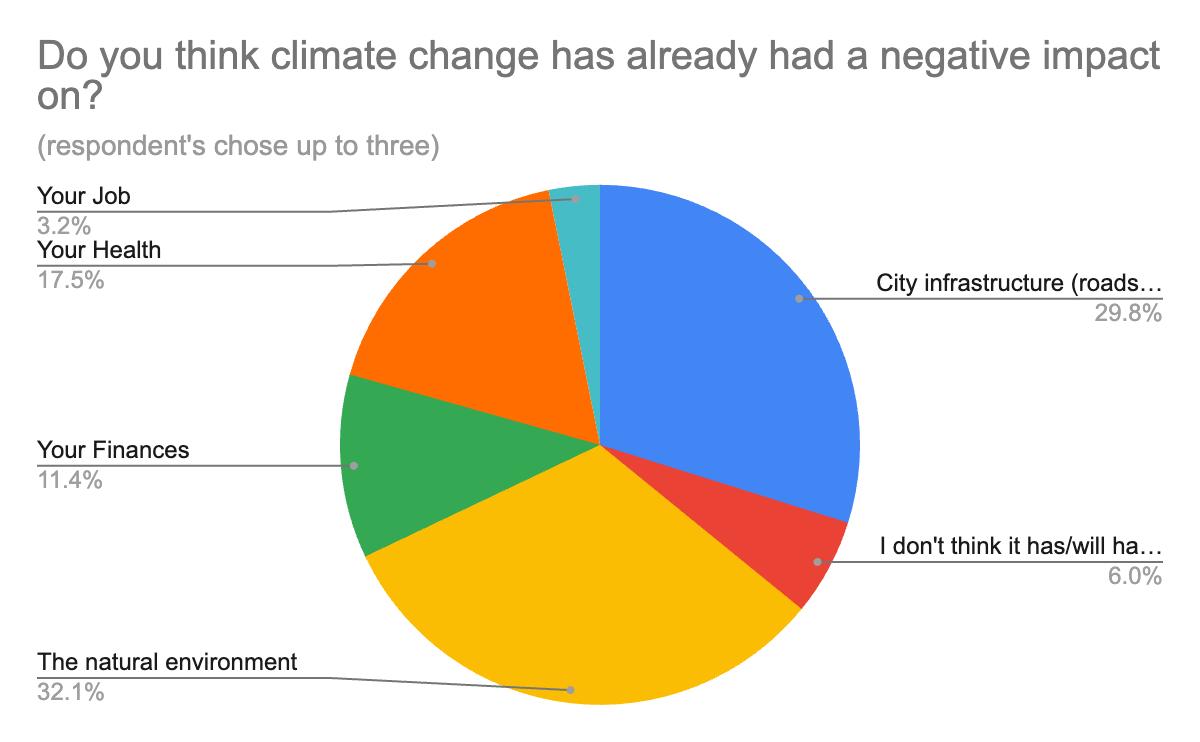
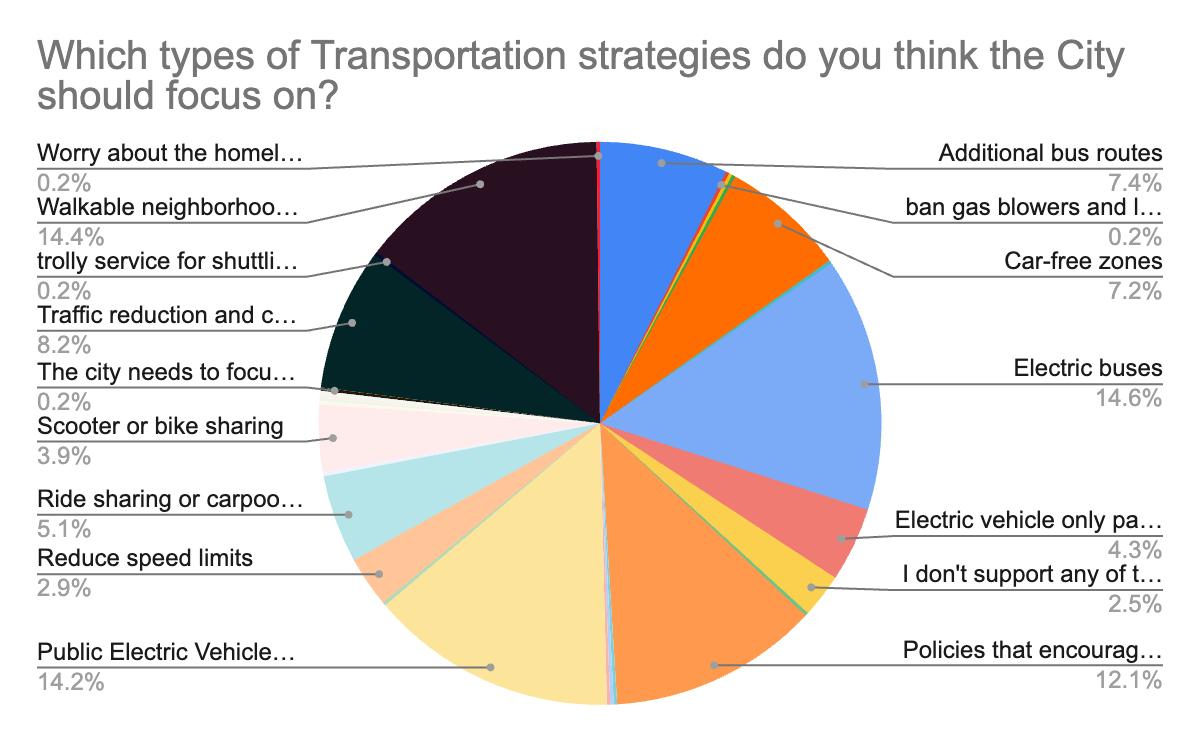
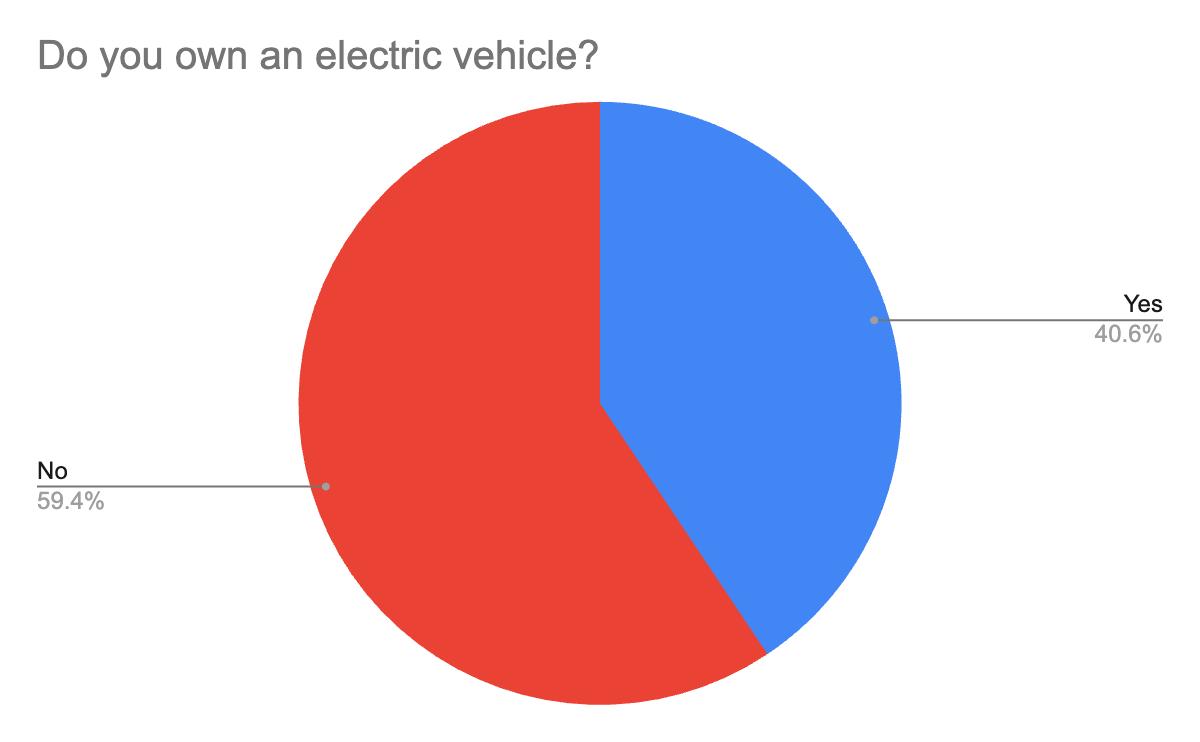
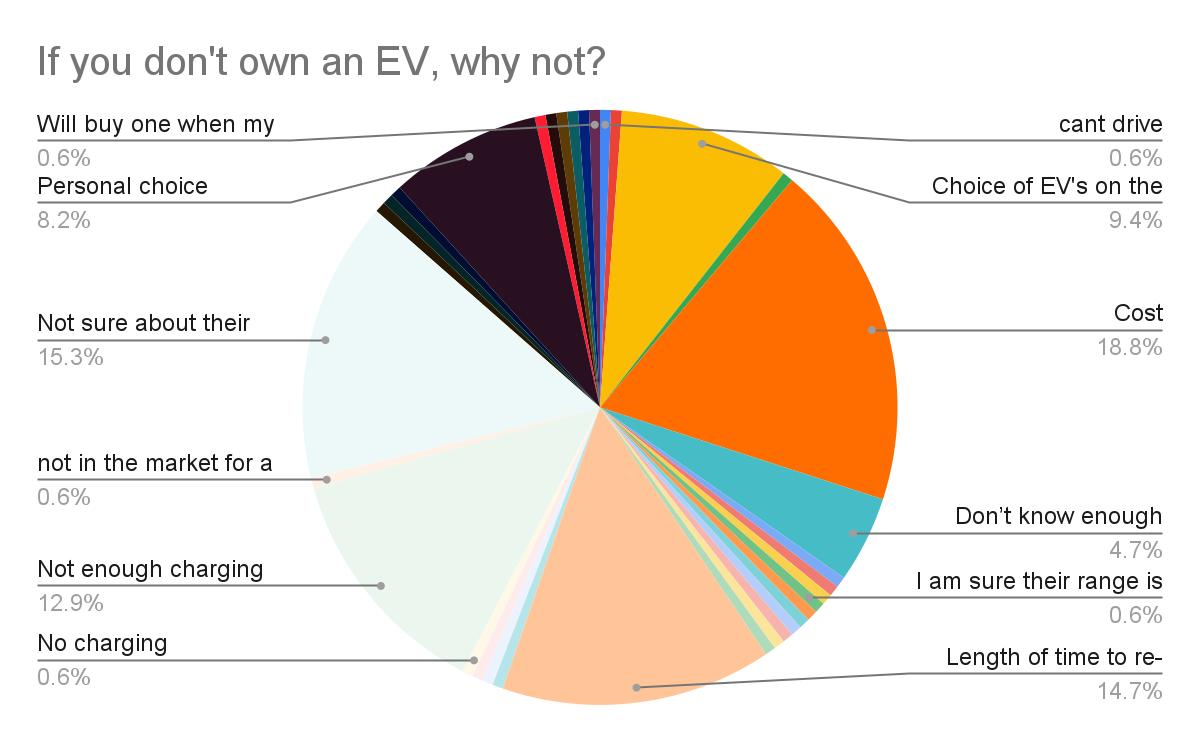
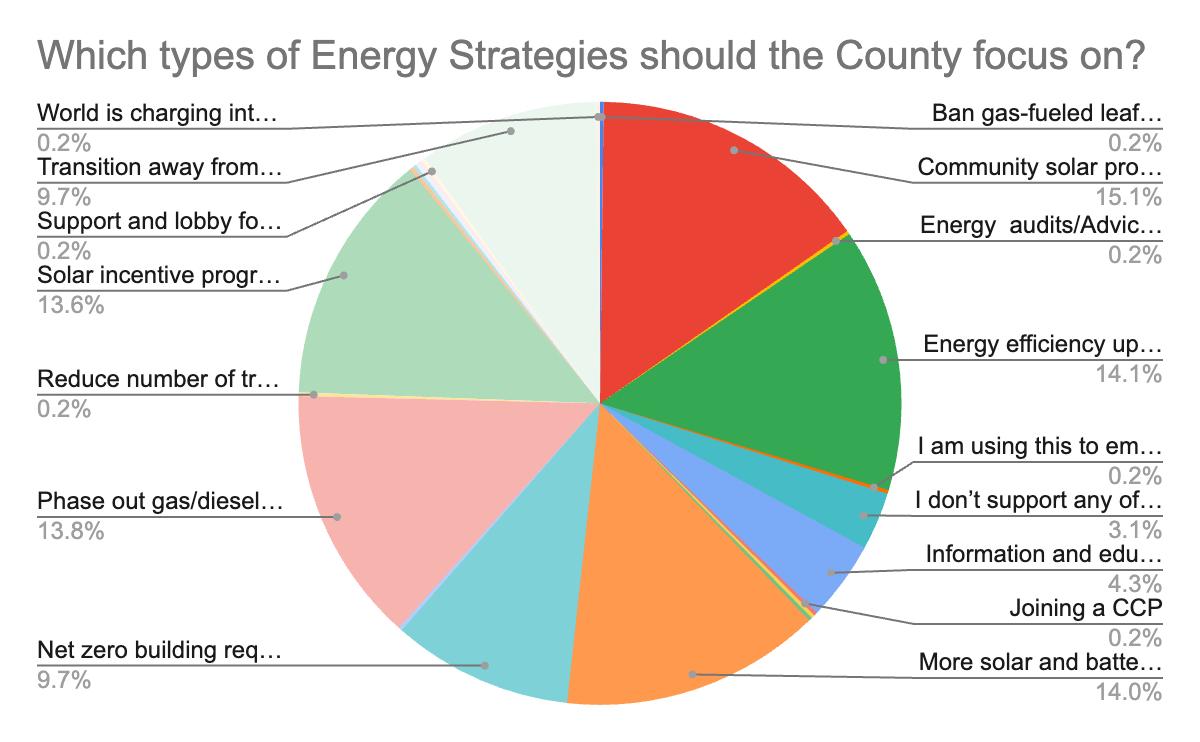
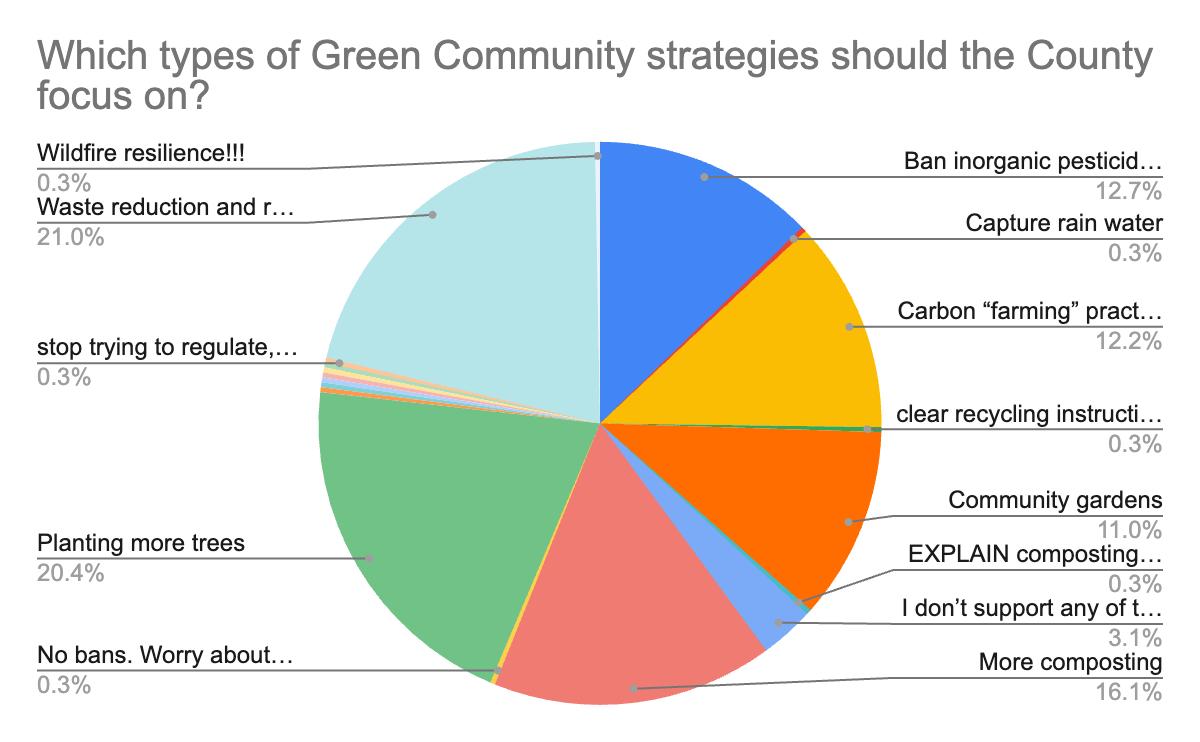
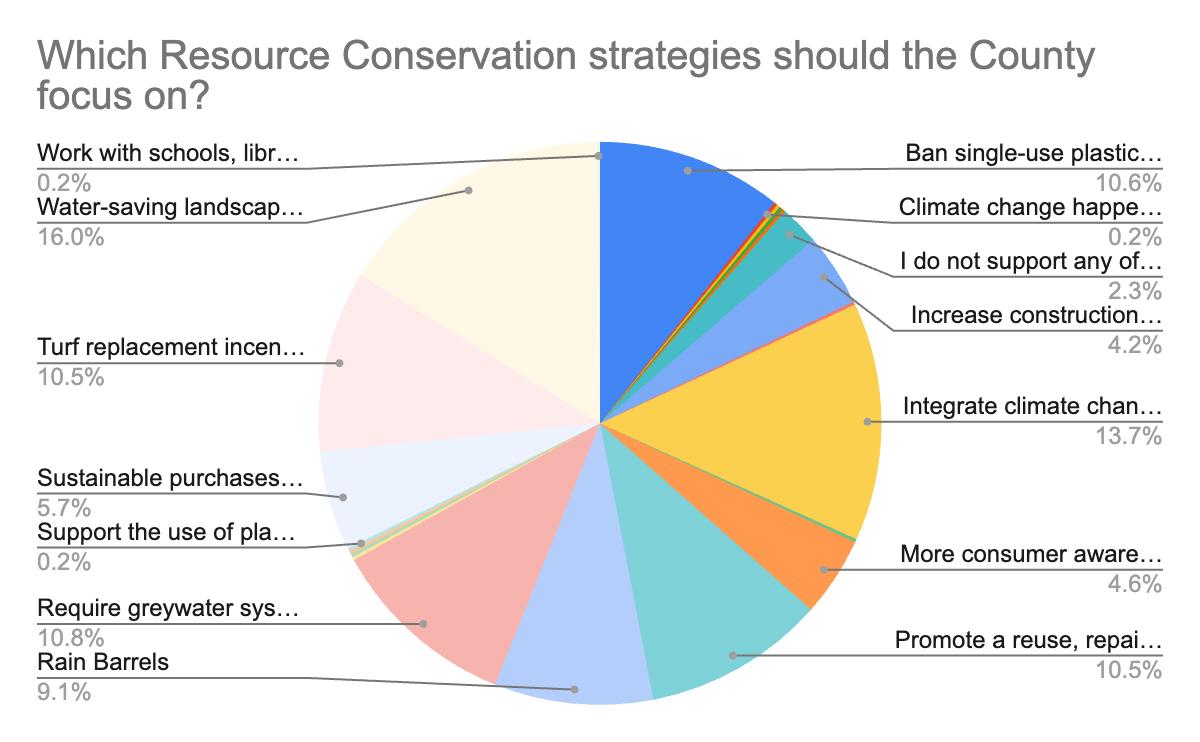
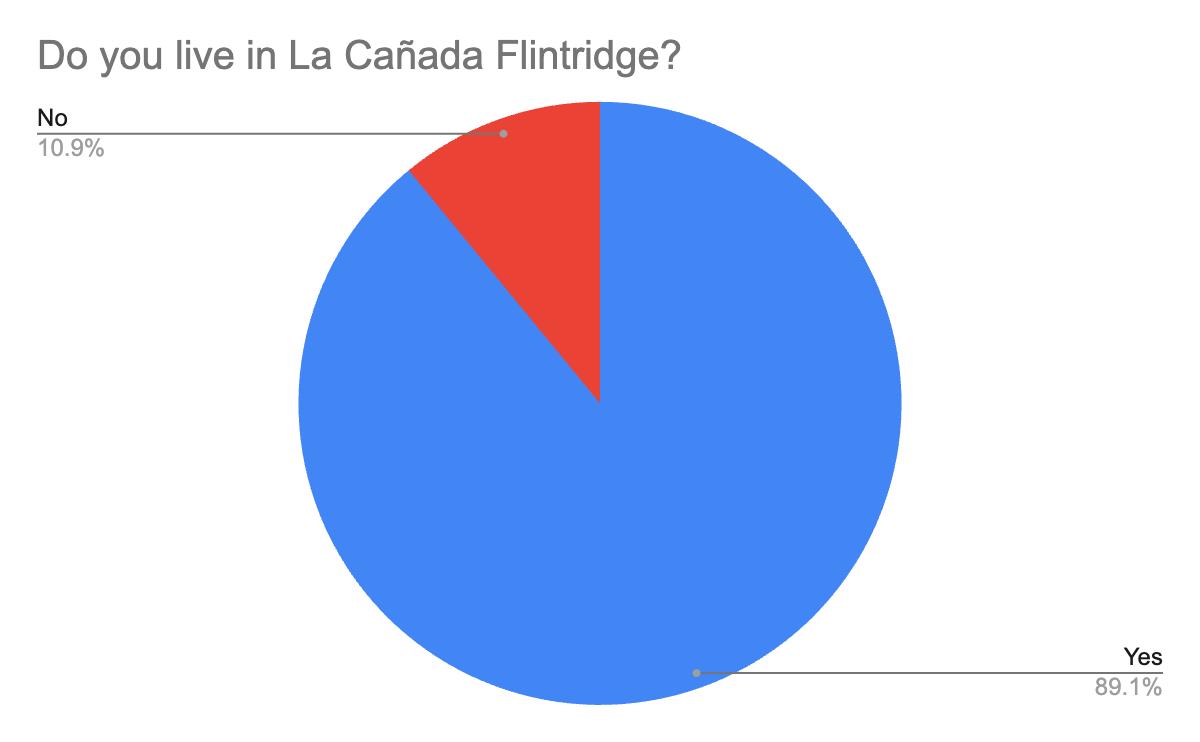
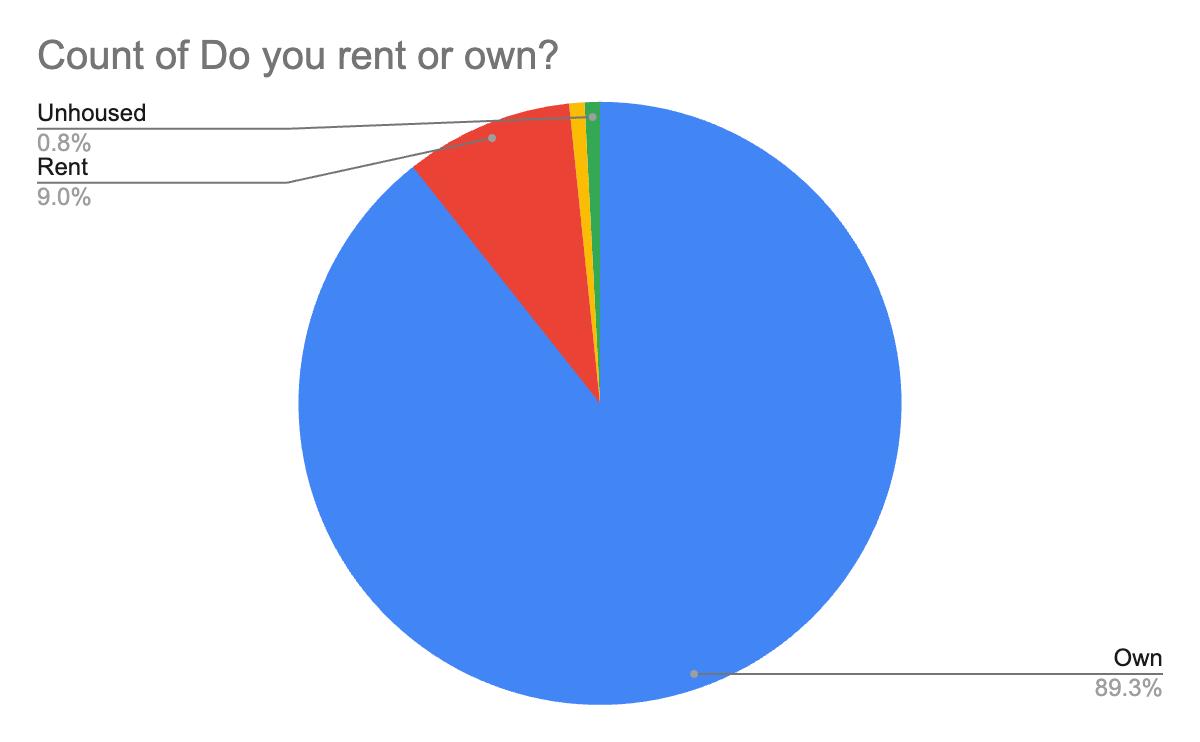
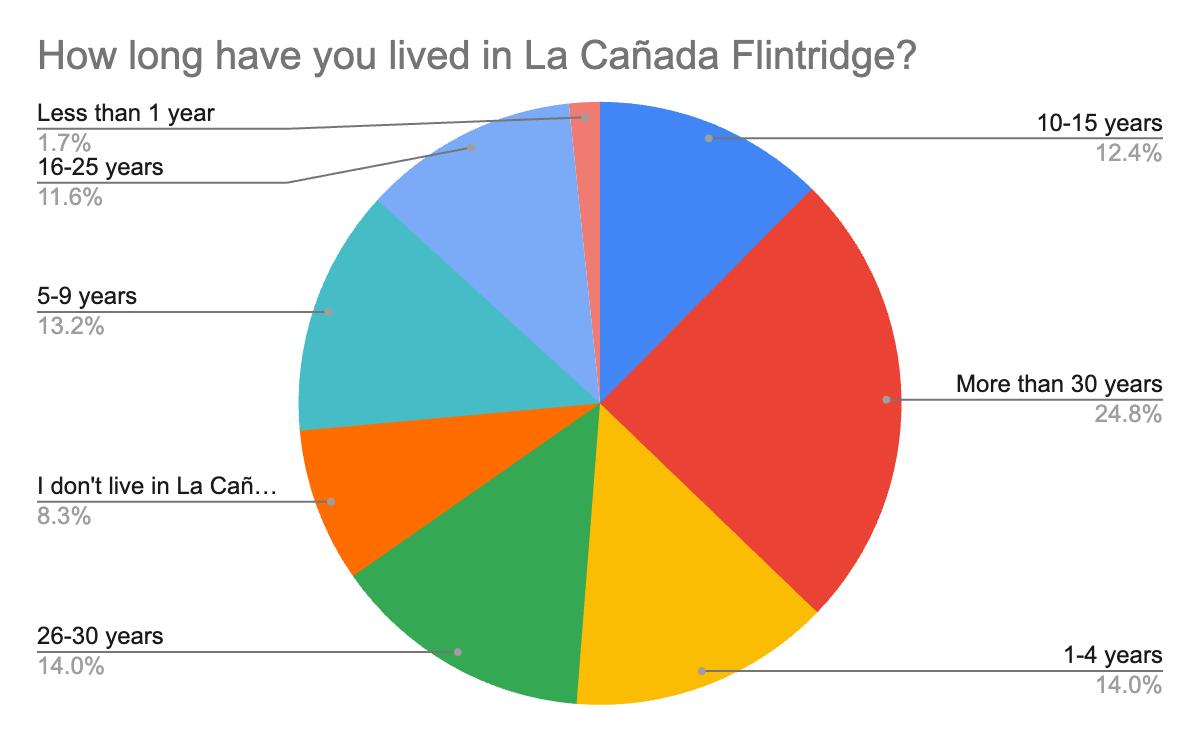
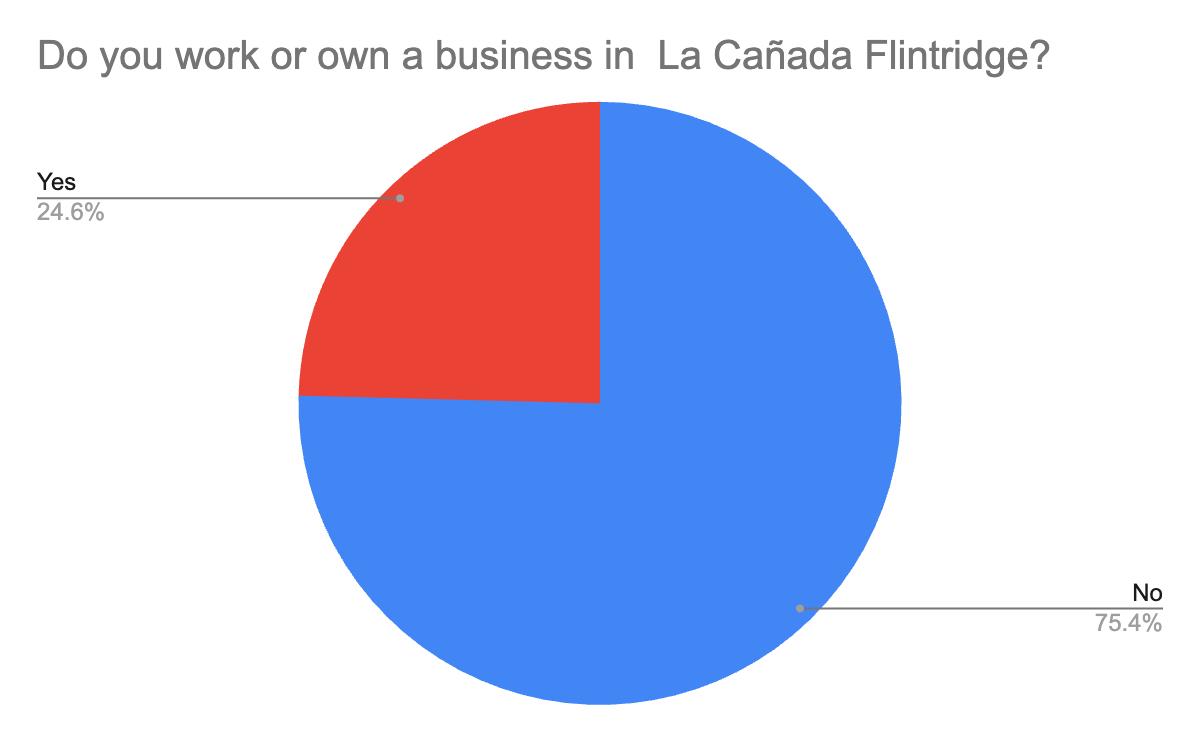
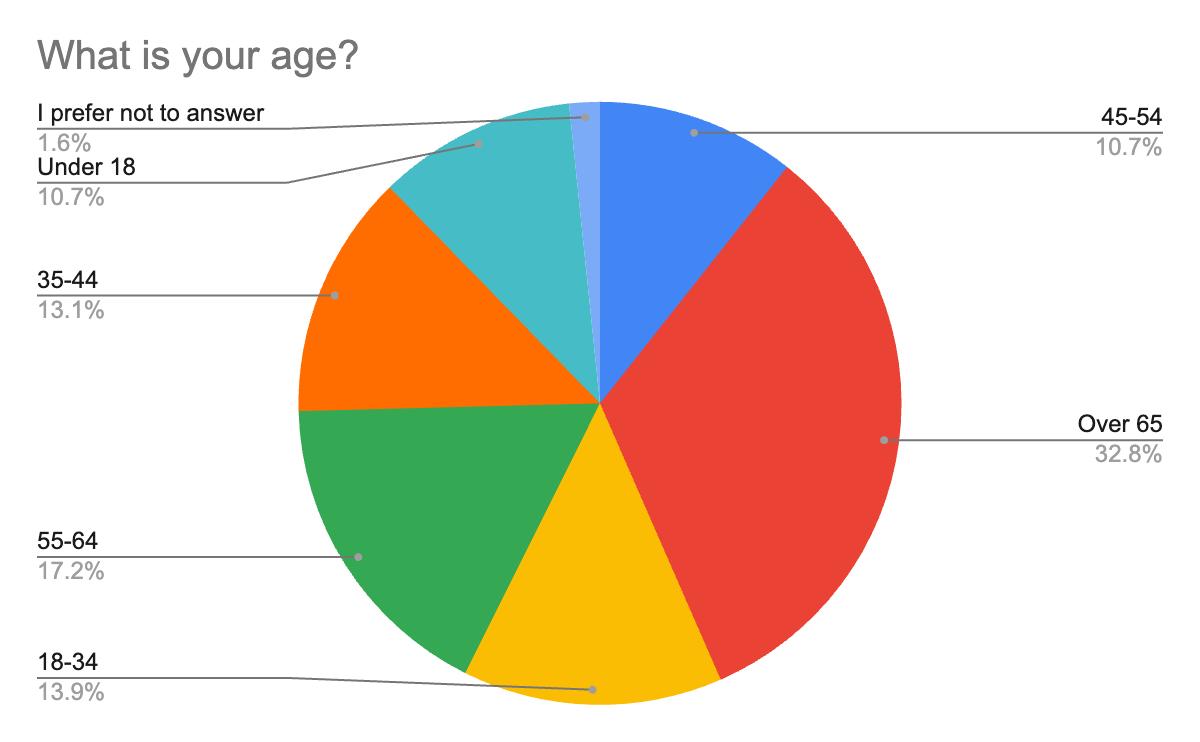
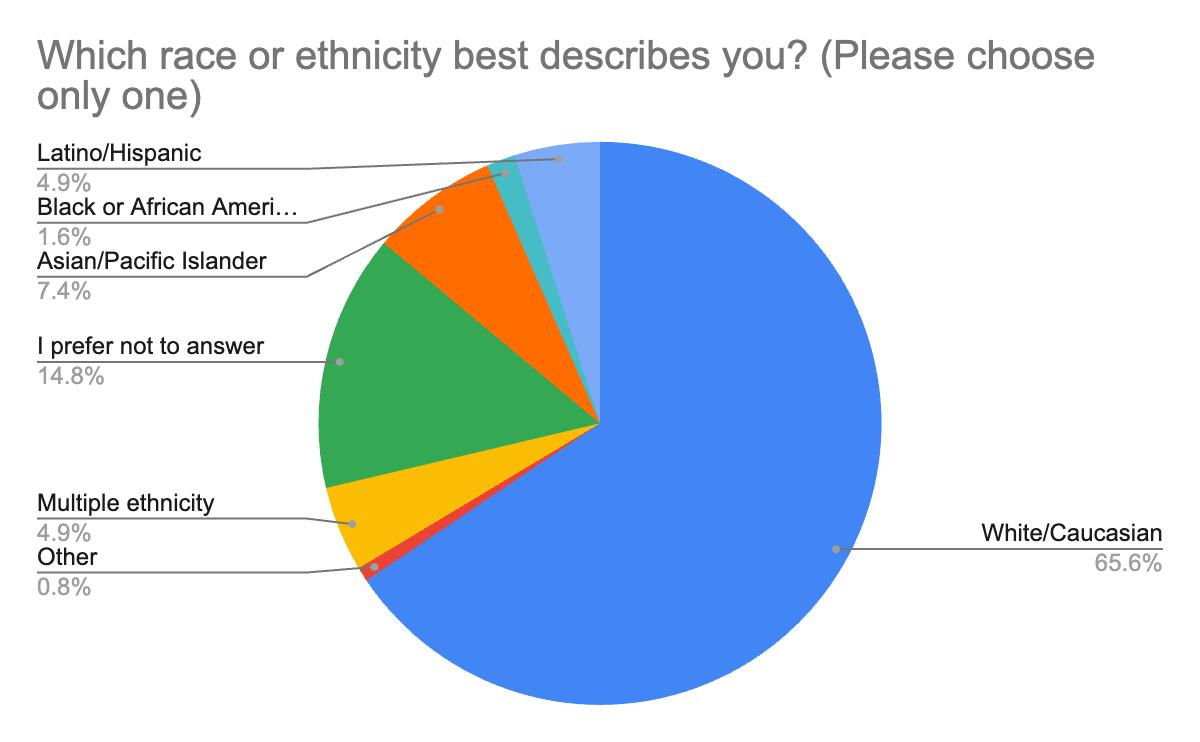
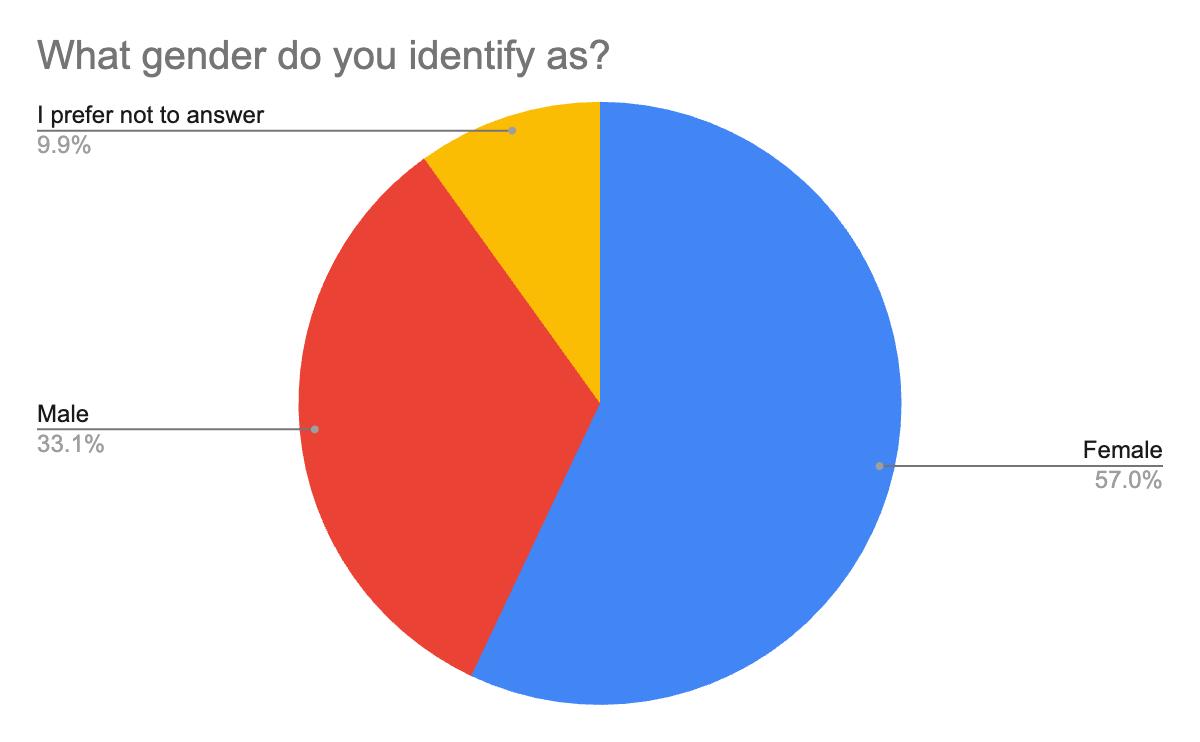
APPENDIX C: What Can I Do Now?
While governments and corporations can make significant mitigation impacts in the way they operate, individuals can make a difference in the way we live our daily lives. Our decisions give us the power to set a course for change by taking small actions that cause rippling effects across communities and can build dialogues that lead to broad behavior change. Join La Cañada Flintridge as it sets a course for community-wide climate change.
ENERGY
Pledge to:
› Turn off the lights when you leave if your home or office does not have occupancy sensors.
› Skip the elevator and take the stairs for exercise and energy savings.
› Unplug or use a power strip
› Obtain an energy audit for your home
› Take advantage of your energy provider’s incentives for reducing your energy consumption
WATER
Pledge to:
› Bring a reusable water bottle to work each day
› Reduce meat consumption (biggest water user)
› Reduce water use at home and work
› Plant native plants that require less water than non natives
FOOD
Pledge to:
› Say no to plastic by bringing a reusable to go container to work and for restaurant leftovers
› Not ask for a straw
› Only take what you can eat.
› Eat a more plant- based diet
GREEN SPACES
Pledge to:
› Be a good steward to the earth by planting a tree
› Convert some or all of your lawn space to native plants
› Use an electric mower or battery operated mower
PURCHASING
Pledge to:
› Prioritize local and minority owned farms and businesses and support those with a climate mission.
› Purchase products with reduced packaging
› Make your next purchase an electric one instead of gas
TRANSPORTATION
Pledge to:
› Ride your bike or carpool to work
› Take public transportation as often as possible
› Telecommute when possible
WASTE
Pledge to:
› Reduce/eliminate use of single use plastic bags
› Reduce food waste
› Start composting
› Purchase second-hand clothing whenever possible
› Reduce paper copies and print double sided
› Fix first before buying new
ENGAGE
Pledge to:
› Talk and share ideas with others about climate change
› Volunteer for a community climate action project
› Stay informed and involved with what the City and region are doing to tackle climate change
› Participate in community engagement efforts around climate change
APPENDIX D: 2019 GHG Inventory Report
Executive Summary
Introduction
The goal of this report is to provide an inventory of greenhouse gas (GHG) emissions that are attributable to human activities in La Cañada Flintridge, California. This report acts as a foundational document for the 2024 climate action and adaptation plan, which provides a roadmap for reducing carbon emissions while preserving the living standards of City residents. A GHG inventory describes the primary sources of emissions within the city, including those originating from residents, commercial enterprises, and governmental operations. The emissions studied can be either direct or indirect Direct emissions are those emitted at the location of use such as natural gas combustion in heating buildings, whereas indirect emissions are purchased and used at one location but generated elsewhere, such as those originating from the electrical grid [1] A GHG inventory is crucial for creating strategies and programs that reduce future emissions and providing insight into the environmental condition of the City during the study year
This GHG inventory analyzes two different tracks, which are presented separately The community track encompasses all La Cañada Flintridge residents, including businesses and individuals. Community emissions were divided into sectors: residential and commercial; transportation and mobile services; solid waste; and water and wastewater. The city government operations track includes the emissions related to La Cañada Flintridge government activities, including government facilities, vehicle fleets, and employee commuting. The municipal operations inventory is a subset of the community inventory, and has specific usage portioned out from the community inventory. This report relies on the best available data to date. If certain data could not be collected, best estimates were used. Emission factors were compiled for each sector from reliable sources, such as the Environmental Protection Agency (EPA) and the US Community Protocol, which update information regularly This GHG inventory offers a reliable reflection of real-world emissions in La Cañada Flintridge All calculations were made using the US Community Protocols for Greenhouse Gas Accounting studies, as published by ICLEI [2] Two appendices are included in this report Appendix A lists raw usage data collected from utilities and other sources, while Appendix B provides a detailed methodology of all calculations used in determining emission totals.
Community Inventory Results
In 2019, the La Cañada Flintridge community produced a total of 164,353 metric tons of carbon dioxide equivalent emissions (MT CO2e). As illustrated in the figure below, the greatest percentage of emissions was from transportation and mobile service at 57%, or 92,720 MT CO2e. Energy use (which includes electricity and natural gas) in residential buildings represents the next largest source at 29%, and energy from commercial use followed, contributing 7% In terms of total amounts, residential energy produced 47,691 MT CO2e, commercial energy resulted in 12,065 MT CO2e The remainder of the community inventory includes solid waste with 3% or 5,578 MT CO2e, water and wastewater with 4% or 6,182 MT CO2e, and fugitive emissions with 118 MT CO2e
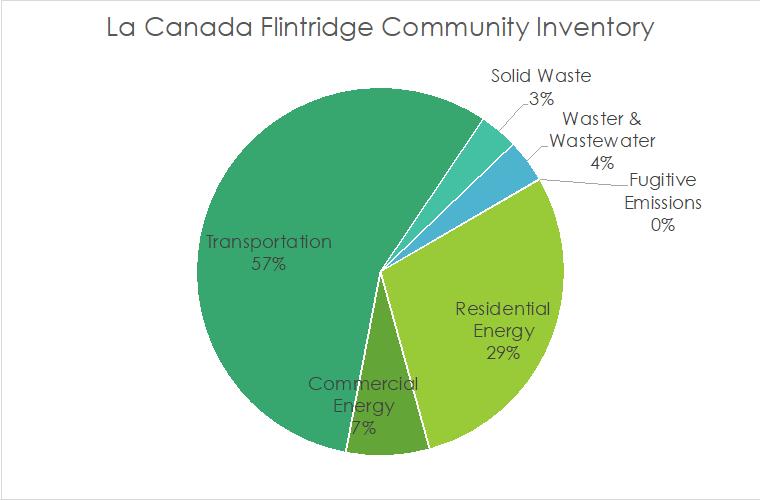
City Operations Inventory Results
City operations GHG emissions were also analyzed. La Cañada Flintridge government operations were responsible for 226 MT CO2e. The largest emission sources were employee commuting at 36% (80 MT CO2e) and City Facilities at 28% (64 MT CO2e) The Public Lighting sector contributed 22%, with 64 MT CO2e Finally, city operational water supply contributed 14% of emissions, or 32 MT CO2e
Fig. 1: La Cañada Flintridge 2019 community inventory by sector
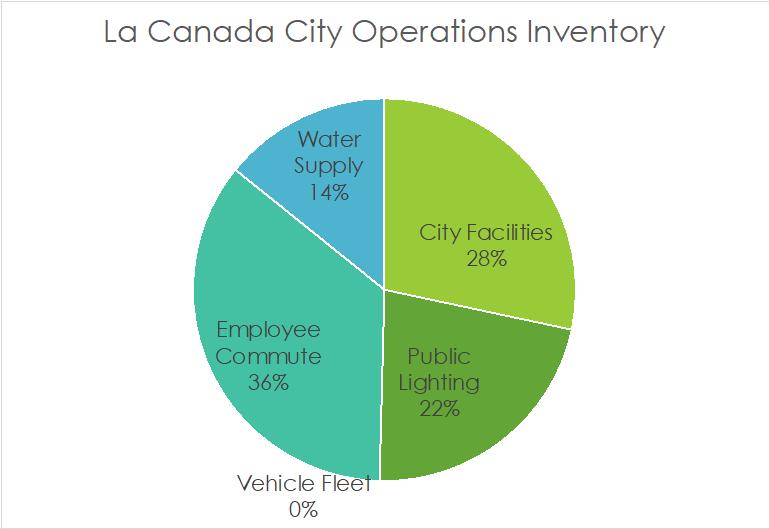
Introductory Summary
This inventory was performed using the U.S. Community Protocol Version 1.2, as developed by ICLEI and updated for this specific GHG accounting exercise in July 2019. Inventory emissions were calculated using best practices and were based on 2019 data gathered from the city. These “usage” data were assigned an appropriate emission factor to arrive at a figure for emissions emitted The calculations took place within Excel but used all formulas from the U S Community protocol The U S Community Protocol assists in GHG accounting and management at the community and municipal levels Emission factors were compiled from 2019 data and information from the federal Environmental Protection Agency GHG Emission Factors Hub [3]
As a result, this report compiles data from the city and models GHGs to provide an accurate depiction of the City’s real-world emissions It also identifies key areas to focus on for strategy development and program creation to reduce emissions in the city Finally, it serves as an update to the City’s existing GHG inventories completed in 2007 and 2014 [4]
Fig 2: La Cañada Flintridge 2019 municipal emissions by sector
Previous Inventories and Climate Resolutions
La Cañada Flintridge has been actively striving to reduce carbon emissions. The City’s first GHG inventory was conducted in 2007 and the second in 2014. This inventory builds upon previous inventories and provides valuable data on how the City is progressing towards reducing carbon emissions
Not all sectors were consistently measured across the 2007, 2014, and the current 2019 inventory; however, comparisons can be made in several sectors such as residential, commercial, transportation, wastewater, water, and solid waste. As shown in figure 3, these sectors have experienced significant emission reductions since 2007 In 2007, La Cañada Flintridge was responsible for emissions amounting to 292,181 tons of carbon dioxide equivalent. In 2014 emissions in La Cañada Flintridge were 203,776 tons of CO2e. By 2019, these emission sectors had fallen to 164,235 tons of CO2e, a decrease of 43 7% between 2007 and 2019
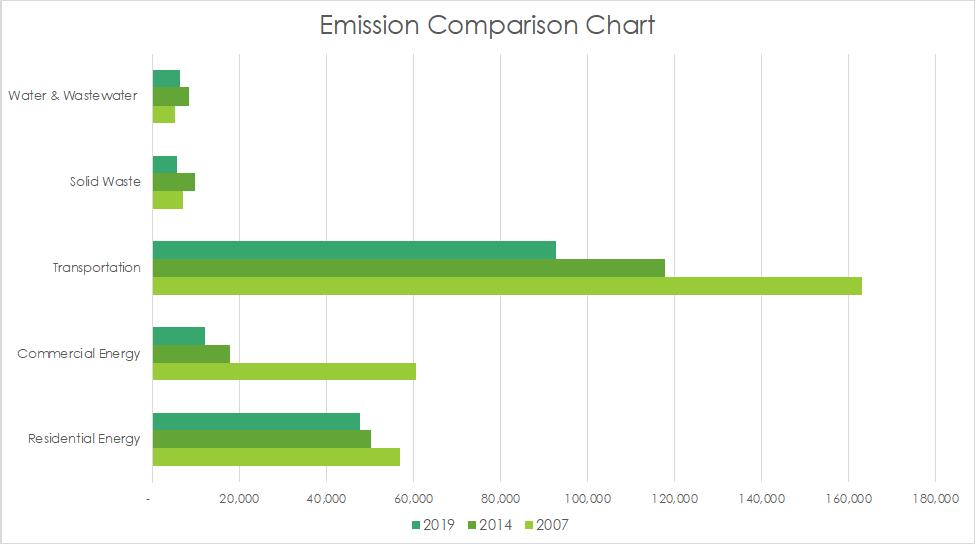
Methodology
The methodology for this inventory was based upon best practices from the US Community Protocol provided by ICLEI, coupled with the United States Environmental Protection Agency GHG Emission Factors, which serve as the benchmark for greenhouse gas inventory analysis nationwide. Emissions estimates incorporate real-world usage data (listed in Appendix A), which were subsequently processed through an Excel based tool.
Fig 3: GHG Inventory Comparison by Year
Inventory year
The year 2019 was selected for this inventory because it offers a more typical representation of GHG emissions for the year 2023 since the COVID-19 pandemic significantly reduced travel emissions and markedly impacted other sectors as well. Notably, the years 2020, 2021, and 2022 recorded significantly lower emissions compared to current levels. Additionally, the Science Based Targets Initiative recommends using 2019 as a baseline year for future emission reduction targets.[5]
Community and City Operations inventories
The inventory considers two distinct greenhouse gas accounting tracks: community and City operations sectors The community inventory includes emissions from residents within La Cañada Flintridge's jurisdiction, accounting for both emissions from residents within the City's limits and from people who recreate and work in La Cañada Flintridge; the inventory is inclusive of all towns within the city. Required sectors for community GHG inventories are: 1) community building energy use from kilowatt hours and natural gas therms usage, and other significant energy sources 2) transportation emissions from vehicle miles traveled in the city, 3) solid waste disposed, 4) wastewater and water electricity used and gallons consumed. In contrast, the City Operations inventory encompasses emissions resulting from La Cañada Flintridge operations and facilities. Although City emissions represent a small fraction of the emissions inventory, they are significant, given the government’s ability to influence and lead by example to combat climate change The city operations inventory includes emissions from City buildings, City vehicle fleets, employee commutes, and water consumption[6]
Calculating emissions
Greenhouse Gasses
Local governments are expected to evaluate emissions of the six internationally recognized greenhouse gasses (GHG) under the Kyoto Protocol[7], namely Carbon dioxide (CO2), Methane (CH4), Nitrous oxide (N2O), Hydrofluorocarbons (HFCs), Perfluorocarbons (PFCs), and Sulfur hexafluoride (SF6) Each of these greenhouse gasses is reported and converted into metric tons (MT), differentiated by their respective Global Warming Potential (GWP) The GWP of each is benchmarked on Carbon dioxide's potential, which is set at 1, as it serves as the reference point for the other gasses Methane, with a GWP of 28, is largely emitted from landfills, wastewater, and natural gas leakage. Nitrous Oxide, with a higher GWP of 265, is primarily associated with energy production and wastewater treatment. Hydrofluorocarbons, having a wide GWP range of 12-11,700, are mainly tied to refrigerant usage. Perfluorocarbons, with a GWP between 6,500-9,200, typically result from manufacturing and production processes. Sulfur Hexafluoride, possessing the highest GWP of 23,900, is principally connected with power transmission and distribution. This inventory primarily uses Carbon, Methane, and Nitrous Oxide[8] to establish the carbon dioxide emission equivalents (CO2e) for all sectors analyzed[9]
Sector Activity Data and Emissions Factors
The process of calculating Carbon dioxide equivalents (CO2e) utilizes both activity data and emission factors. When activity data is multiplied by corresponding emission factors, the result is an amount of carbon dioxide-equivalent emissions By converting each sector's activity data into carbon dioxide equivalents, a comparative ratio for each sector can be established, enabling further analysis and facilitating decision-making about potential reduction strategies
Emissions Reporting
Emissions are quantified using the measure of Carbon dioxide equivalent (CO2e) and compared across sectors Each sector is individually reported and assessed in relation to others, offering a comprehensive picture of emissions across the city The community inventory covers building energy use, transportation, solid waste, wastewater, and water. Building energy is further divided into residential and commercial energy and consists of both electricity and natural gas consumption. The municipal inventory includes building energy use, employee commute, vehicle fleet, water, and wastewater.
Results
The following sections detail the findings from the community and City government operations greenhouse gas inventories, with results organized by sectors. The community and City operations inventory are separate endeavors, but the information is combined within this report. There will be overlap in emissions data for the two inventories, and each inventory should be considered as a benchmark for future emission reductions. Calculation methodologies for all results are provided in Appendix B
Community Inventory
In La Cañada Flintridge, total community emissions were 164,235 MT CO2e. This result includes emissions originating from the combustion of fuel for transportation and mobile services, onsite burning of natural gas in residential and commercial sectors[10], emissions linked to electricity procurement for residential and commercial edifices, emissions connected to water and wastewater services within the city, as well as solid waste emissions emanating from the city
Table 1: La Cañada Flintridge Community Inventory by sector
Residential Energy
Residential energy consumption incorporates emissions from natural gas combustion and electricity production from all specific to residential communities within La Cañada Flintridge. Data regarding La Cañada Flintridge's residential electricity usage were supplied by Southern California Edison, while Southern California Gas Company provided data for natural gas usage. Electricity data for 2019 from Southern California Edison Electricity were extrapolated from 2017 usage statistics
Overall residential energy use contributed 47,691 MT CO2e Of that total, emissions attributed to electricity were 17,207 MT CO2e, natural gas contributed 30,484 MT CO2e Residential energy constituted 29% of total community emissions
Commercial Energy
Commercial energy produced 12,065 MT CO2e Data on commercial electricity energy consumption were provided by Southern California Edison Data for natural gas usage were sourced from Southern California Gas Company
Of the commercial total, electricity accounted for 7,349 68 MT CO2e and natural gas contributed 4,715 MT CO2e Thus, commercial energy constitutes 7% of total community emissions in La Cañada Flintridge
Transportation and Mobile Service
Transportation and Mobile services are the primary contributor of emissions in La Cañada Flintridge, generating 92,720 MT CO2e and accounting for 57% of the City’s total emissions La Cañada Flintridge is characterized by its location within Los Angeles County, where reliance on cars is significant, leading to a considerable amount of Vehicle Miles Traveled (VMT) within the City. The emissions produced by gasoline fuel vehicles is 91,254 MT CO2e, while the emissions produced from diesel vehicles equaled 1,465 MT CO2e.
Solid Waste
Emissions resulting from the waste sector are derived from methane production due to decomposition of solid waste generated in the city. This information was provided by CalRecycle for solid waste destined for Southeastern Resource Recovery Facility. These calculations incorporate data gathered from the landfill and consider factors such as methane capture processes. Solid waste disposal contributes to 3% of the total emissions in La Cañada Flintridge, accounting for 5,578 MT CO2e.
Water and Wastewater
There are four water and wastewater suppliers that manage the City’s potable water supply and wastewater disposal, and data were provided or were gathered from estimations of historical usage Total emissions from water and wastewater amount to 6,182 MT CO2e, accounting for 4% of total emissions across the city Emissions from potable water processes in La Cañada Flintridge are 4,782 MT CO2e Wastewater emissions equal 1,400 MT CO2e Specific data regarding water and wastewater calculations can be found in Appendix B Some of the suppliers were unable to provide data in time for this report to be completed, so emissions were estimated from applying population growth for La Cañada Flintridge from data from the 2017 inventory
Processes and Fugitive Emissions
Fugitive emissions, which are defined as unintended leaks or releases of gasses during the transportation or handling of substances like natural gas, contribute less than one percent to the total emissions of the city, amounting to an equivalent of 117 MT CO2e These inadvertent emissions can occur at various stages of production, processing, storage, transmission, and distribution
City Operations Inventory
The following sections provide detailed insights into the municipal GHG emissions within La Cañada Flintridge. The City’s emitting sectors include buildings and facilities, vehicle fleets, transit fleets, and employee commuting. In 2019, the City's municipal activities generated a total of 19,359 MT CO2e, making up roughly 1% of the City's total emissions.
Table 2: La Cañada Flintridge’s City Operations Inventory by sector
City Facilities
La Cañada Flintridge's government-owned and operated buildings and facilities contribute to 28% of the total emissions in the Municipal Inventory, and total 64 MT CO2e. The generation and consumption of electricity are the primary sources of these emissions, with only one building consuming natural gas. Electricity usage for the government consumed 59.5 MT CO2e, where the natural gas combustion consumed 4 7 MT CO2e
Public Lighting
Public lighting consists of electrically powered streetlights and streetlamps, traffic signals, and other public forms of lighting within the city These lights consumed 49 9 MT CO2 in 2019
Vehicle and Transit Fleet
The city has a minimal vehicle fleet which only had 2 vehicles, which both are already electrically powered. These vehicles consume a small amount of electricity, which is considered negligible for this emission study
Employee Commute
A survey of commuting habits was disseminated among all La Cañada Flintridge employees to gauge the carbon impact of the daily commute by the City's workforce Based on the surveys, employee commuting is estimated at around 35% of the total emissions generated by local government operations, producing 80 MT CO2e
Water and Wastewater
Emissions associated with water and wastewater contribute to 14% of municipal emissions These are emissions associated with specifically the municipal government operations In 2019 the city produced 32 MT CO2e relating to water and wastewater processes
Conclusion
In 2019, La Cañada Flintridge, California, the community generated a total of 164,353 MT CO2e and City government operations produced 226 MT CO2e The most significant contributors were transportation and mobile sources, accounting for 56% of community emissions Residential energy sources, including electricity and natural gas, were the second highest contributor, constituting 29% of the emissions Commercial energy was the third highest contributor; other sources contributed relatively minor amounts in comparison As for the emissions attributable to La Cañada Flintridge's government operations, four primary areas were prominent: employee commute, city facilities, public lighting, and water and wastewater are responsible for 35%, 28%, 22%, and 14 of the total emissions, respectively. Moving forward, La Cañada Flintridge is committed to maintaining its leadership role in California's efforts to reduce greenhouse gas emissions.
Community Inventory
City Operations Inventory Data
City Operations Inventory Data
Appendix C.2: Detailed Methodology
Community Inventory
Electricity
Residential, commercial, and industrial electricity usage data for 2019 were furnished by Southern California Edison Energy and Southern California Gas Company. The process of determining emissions involved multiplying electricity usage by the emissions factor relevant to the jurisdiction where the electricity was generated Southern California Edison Energy has a publicly available grid mix with which was calculated to produce emission factors for the local jurisdictions The specific emission factor is 0 211 kilograms of equivalent carbon dioxide
Natural Gas
Data on residential and commercial natural gas was provided by Southern California Gas Company The calculation of natural gas emissions involves multiplying the usage data by an emission factor provided by the US Community Protocol BE 1 1 [11] The respective emission factors are 53 02 kg/MMBtu CO2, 0 005 kg/MMBtu for CH4, and 1 xE-4 for N2O The full methodology is detailed in the U S Community Protocol for Accounting and Reporting of Greenhouse Gas Emissions Appendix C: Built Environment Emission Activities and Sources
Transportation and Mobile Service
Transportation emissions in La Cañada Flintridge were computed using a subcontractor Fehr and Peers Their specific memorandum on methodology of calculating vehicle miles traveled will be in a further appendix. The emissions factors are sourced from the US Community Protocol,[12] which are as follows:
Solid Waste
Solid Waste information was provided by CalRecycle and Southeastern Resource Recovery Facility The following are the specific emission factors: Mixed MSW Emission Factor (MT CH4/wet short ton) 0 0648, Newspaper Emission Factor (MT CH4/wet short ton) 0 042, Office Paper Emission Factor (MT CH4/wet short ton) 0.1556, Corrugated Cardboard Emission Factor (MT CH4/wet short ton) 0.1048, Magazines/Third Class Mail Emission Factor (MT CH4/wet short ton) 0.0476, Food Scraps Emission Factor (MT CH4/wet short ton) 0.0648, Grass Emission Factor (MT CH4/wet short ton) 0.0228, Leaves Emission Factor (MT CH4/wet short ton) 0.026, Branches Emission Factor (MT CH4/wet short ton) 0.058. The calculation methodology was adopted from the US Community Protocol.[13]
Water and Wastewater
Both potable water and wastewater systems consume electricity, and the emissions from this are calculated as previously outlined. Additionally, wastewater treatment processes utilize natural gas, the emissions from which are calculated using the aforementioned methods The process of digester gas combustion is estimated using site-specific data obtained from OWASA This information is converted into emissions data by applying emission factors from the US Community Protocols Specifically, the Biogenic CO2 Emissions Factor is 52 07 kg/MMBtu, the CH4 Emissions Factor is 0 0032 kg/MMBtu, and the N2O Emissions Factor is 6 3 x 10⁻⁴ kg/MMBtu Further details on digester combustion calculations can be found in US Community Protocols WW.1.A, WW2.A, and WW.3. Emissions resulting from the flaring of digester gas are also considered in this inventory. This is determined using site-specific data sourced from OWASA and adhering to the best calculation practices provided by the US Community Protocol. The CH4 Emissions Factor in this case is 1.2177 x10⁻⁷ MT CH4/scf. Daily nitrogen discharge is another factor incorporated in this inventory. Using the daily nitrogen load provided by OWASA, emissions data is calculated in line with the US Community Protocol. Here, the N2O Emissions Factor stands at 0 005 kg N2O/kg N in effluent Additional details concerning effluent discharge can be referenced in the US Community Protocol, specifically WW 12 The final aspect of the water and wastewater analysis pertains to emissions from septic systems While OWASA services the majority of households in La Cañada Flintridge, approximately 65,000 are not covered by the local wastewater agency This results in widespread use of septic systems for wastewater disposal Emissions from these systems can be calculated using a population-based method, which incorporates a CH4 Emissions Factor of 0.048213 MT CH4 per daily kg BOD5. An alternative calculation approach is documented in the US Community Protocol under reference WW.11 (alt).[14]
Fugitive Emissions
Fugitive emissions were calculated by usage data summed from natural gas. This was multiplied by a leakage factor of an industry standard recommended by the U.S. Community Protocol.[15] The leakage emissions are multiplied by an emissions factor of 6.1939x10⁻⁵ MT CH4/MMBtu natural gas used, and CO2 emission factor of 6.6316 x 10⁻⁵ MT CO2/MMBtu natural gas used.
City Operations Inventory
Building and Facilities
La Cañada Flintridge’s buildings and facilities emissions were calculated using usage data obtained from the government's tracking software This software monitors both electricity and natural gas usage data The calculations were carried out in the same manner as those for the community inventory of natural gas and electricity.
Vehicle Fleet
Fuel usage for La Cañada Flintridge’s vehicle fleet was supplied by the City and calculated using the US Community Protocol [16] The annual miles traveled, and annual fuel usage are tracked and multiplied by emission factors from ICLEI. These include a CO2 Emissions Factor of 0.070268 MT/MMBtu, a Biogenic CO2 Emissions Factor of 0 MT/MMBtu, a CH4 Emissions Factor of 2.153 x10⁻⁸ MT/vehicle mile, a Biofuel CH4 Emissions Factor of 0 MT/vehicle mile, a N2O Emissions Factor of 1.248 x10⁻⁸ MT/vehicle mile, and a Biofuel N2O Emissions Factor of 0 MT/vehicle mile.
Transit Fleet
Data on La Cañada Flintridge’s transit fleet usage was also provided by the City. This data was broken down by vehicle types, with transit fleet vehicles identified as buses within the data sheet. Emission factors for transit fleet buses include a CO2 Emissions Factor of 0.07024 MT/MMBtu, a CH4 Emissions Factor of 1.93 x 10⁻⁸ MT/vehicle mile, and a N2O Emissions Factor of 1.48 x10⁻⁸ MT/vehicle mile [17]
Employee Commute
Data on employee commutes was provided by the 2019 commuting survey of La Cañada Flintridge employees This survey asked employees about their commuting habits, and total annual Vehicle Miles Traveled (VMT) was extrapolated from the responses While the survey results did not include total mileage, it was possible to calculate this by multiplying the average miles per commute by the average workdays per week and then calculating the yearly VMT using the average number of working weeks in a year, which is 49 [18] This yields the total annual commuting VMT for La Cañada Flintridge The emissions were then calculated using the US Community Protocol emission factors of CO2 Emissions Factor 0.07024 MT/MMBtu, CH4 Emissions Factor 1.8300 x10⁻⁸ MT/Mile, and a N2O Emissions Factor 8.3 x10⁻⁹ MT/Mile.
Water and Wastewater
The emissions from water and wastewater operations for La Cañada Flintridge's municipal activities were calculated in the same manner as in the community inventory.[19] The usage data was provided by the city, and calculated for emissions in the same way as the community inventory.
[1] https://www epa gov/climateleadership/scope-1-and-scope-2-inventory-guidance
[2] U.S. Community Protocol for Accounting And Reporting of GHG Emissions Version 1.2 July 2019 ICLEI–Local Governments for Sustainability USA
The emissions from water and wastewater operations for La Cañada Flintridge's municipal activities were calculated in the same manner as in the community inventory.[19] The usage data was provided by the city, and calculated for emissions in the same way as the community inventory
[1] https://www epa gov/climateleadership/scope-1-and-scope-2-inventory-guidance
[2] U S Community Protocol for Accounting And Reporting of GHG Emissions Version 1 2 July 2019 ICLEI–Local Governments for Sustainability USA
[3] https://www epa gov/climateleadership/ghg-emission-factors-hub
[4] https://cityoflcf.org/wp-content/uploads/2020/01/ClimateActionPlan.pdf
[5] https://sciencebasedtargets org/faqs
[6] Data were not available for solid waste from City Operations to be differentiated from community waste, therefore all solid waste emissions are included only in the community inventory
[7] https://unfccc int/resource/docs/convkp/kpeng pdf
[8] As referenced in the US Community Protocol the high GWP GHG’s perfluorocarbons and sulfur hexafluoride are not required to complete an accurate inventory The city reported no refrigerant loss, and therefore no hydrofluorocarbons do not appear in the inventory All other GHGs are measured and reported
[9] https://icleiusa org/ghg-protocols/
[10] La Cañada Flintridge has no emissions generating from industrial sources, so only residential and commercial energy were accounted for
[11] U S Community Protocol for Accounting and Reporting of Greenhouse Gas Emissions Appendix C: Built Environment Emission Activities and Sources
[12] U S Community Protocol for Accounting and Reporting of Greenhouse Gas Emissions Appendix D: Transportation and Other Mobile Emission Activities and Sources
[13] U S Community Protocol for Accounting and Reporting of Greenhouse Gas Emissions Appendix E: Solid Waste Emission Activities and Sources
[14] U S Community Protocol for Accounting and Reporting of Greenhouse Gas Emissions Appendix F: Wastewater and Water Emission Activities and Sources
[15] https://www edf org/sites/default/files/US-Natural-Gas-Leakage-Model-User-Guide pdf
[16] U S Community Protocol for Accounting and Reporting of Greenhouse Gas Emissions Appendix D: Transportation and Other Mobile Emission Activities and Sources
[17] U S Community Protocol for Accounting and Reporting of Greenhouse Gas Emissions Appendix D: Transportation and Other Mobile Emission Activities and Sources
[18] https://www bls gov/news release/pdf/atus pdf
[19] U.S. Community Protocol for Accounting and Reporting of Greenhouse Gas Emissions Appendix F: Wastewater and Water Emission Activities and Sources
APPENDIX E: VMT & GHG Reduction Strategy Memo

Memorandum
Memorandum
Date: September 29, 2023
To: Kristin Cushman and Sol Shepherd, Blue Strike Environmental
Date: September 29, 2023
From: Netai Basu, AICP, CTP and Griffin Kantz, Fehr & Peers
To: Kristin Cushman and Sol Shepherd, Blue Strike Environmental
From: Netai Basu, AICP, CTP and Griffin Kantz, Fehr & Peers
Subject: VMT & GHG Reduction Strategy Analysis in Support of the La Cañada Flintridge CAAP
Subject: VMT & GHG Reduction Strategy Analysis in Support of the La Cañada Flintridge CAAP LA22-3415
LA22-3415
1. Introduction
1. Introduction
Fehr & Peers is assisting Blue Strike Environmental with transportation modeling efforts in support of the development of the La Cañada Flintridge Climate Action and Adaptation Plan (CAAP) for the City of La Cañada Flintridge, California. This memorandum documents the methodologies Fehr & Peers employed to estimate the potential for long-term reduction of citywide vehicle-miles-traveled (VMT) and the related greenhouse gas (GHG) emissions through strategies outlined in the draft CAAP, particularly in Goal T1
Fehr & Peers is assisting Blue Strike Environmental with transportation modeling efforts in support of the development of the La Cañada Flintridge Climate Action and Adaptation Plan (CAAP) for the City of La Cañada Flintridge, California. This memorandum documents the methodologies Fehr & Peers employed to estimate the potential for long-term reduction of citywide vehicle-miles-traveled (VMT) and the related greenhouse gas (GHG) emissions through strategies outlined in the draft CAAP, particularly in Goal T1
These quantification methodologies made use of the California Air Pollution Control Officers Association (CAPCOA) GHG Reduction Handbook 1 to the greatest extent possible. The 2021 CAPCOA GHG Reduction Handbook is the industry standard for quantifying GHG reductions from common transportation-oriented measures based on defensible, peer-reviewed research. In cases when the CAPCOA GHG Reduction Handbook does not offer an exact quantification methodology for a given transportation-based GHG reduction strategy proposed in the draft CAAP, Fehr & Peers referred to the closest quantifiable analog. Fehr & Peers also consulted research by the Southern California Association of Governments (SCAG) on post-pandemic “telework” / workfrom-home (WFH) trends.
These quantification methodologies made use of the California Air Pollution Control Officers Association (CAPCOA) GHG Reduction Handbook 1 to the greatest extent possible. The 2021 CAPCOA GHG Reduction Handbook is the industry standard for quantifying GHG reductions from common transportation-oriented measures based on defensible, peer-reviewed research. In cases when the CAPCOA GHG Reduction Handbook does not offer an exact quantification methodology for a given transportation-based GHG reduction strategy proposed in the draft CAAP, Fehr & Peers referred to the closest quantifiable analog. Fehr & Peers also consulted research by the Southern California Association of Governments (SCAG) on post-pandemic “telework” / workfrom-home (WFH) trends.
Please refer to our previous memorandum which documented the methodologies used to estimate the vehicle-miles traveled (VMT) associated with the City for the 2019 Baseline and 2045 future “Business as Usual” scenarios (“VMT Analysis in Support of the La Cañada Flintridge CAAP,”
1 California Air Pollution Control Officers Association (2021). Handbook for Analyzing Greenhouse Gas Emission Reductions, Assessing Climate Vulnerabilities, and Advancing Health and Equity (Final Draft). <http://www.airquality.org/air-quality-health/climate-change/ghg-handbook-caleemod>.
Please refer to our previous memorandum which documented the methodologies used to estimate the vehicle-miles traveled (VMT) associated with the City for the 2019 Baseline and 2045 future “Business as Usual” scenarios (“VMT Analysis in Support of the La Cañada Flintridge CAAP,”
1 California Air Pollution Control Officers Association (2021). Handbook for Analyzing Greenhouse Gas Emission Reductions, Assessing Climate Vulnerabilities, and Advancing Health and Equity (Final Draft). <http://www.airquality.org/air-quality-health/climate-change/ghg-handbook-caleemod>. 600 Wilshire Boulevard | Suite 1050 | Los Angeles, CA 90017 | (213) 261-3050 | Fax (310) 394-7663 www.fehrandpeers.com
Blue Strike Environmental September 29, 2023
Page 2 of 13

Fehr & Peers, July 6, 2023). Those estimates were based on the SCAG Activity-Based Model (ABM) from the agency’s 2020 Regional Transportation Plan/Sustainable Communities Strategy (RTP/SCS).
2. VMT & GHG Reductions Approach
Overview of CAPCOA GHG Reduction Handbook
Travel demand management (TDM) strategies have proved to be among the most effective for reducing VMT and the associated GHG emissions at the municipal level. The CAPCOA GHG Reduction Handbook provides general formulas and parameters for quantifying these TDM reductions given input variables on local conditions including built environment context and existing local travel patterns. The Handbook provides a percentage range (from zero up to the maximum feasible) on the expected VMT and GHG reductions for each individual TDM strategy. Many strategies covered in the CAPCOA GHG Reduction Handbook have associated benefits for equity and quality-of-life goals. Some strategies overlap others in scope, so the Handbook provides guidelines on how to avoid double-counting likely VMT reductions from multiple strategies in combination.
Data Sources
To estimate VMT and GHG reductions from each of the strategies proposed in the draft CAAP based on the formulas in the CAPCOA GHG Reduction Handbook, the Fehr & Peers team consulted the data sources listed below in Table 1
Table 1: Data Sources for VMT/GHG Reduction Estimation
Source Metric
SCAG 2020 RTP activity-based model
City staff and Jet Propulsion Laboratory (JPL) facilities operation staff
Local media
Source: Fehr & Peers, 2023.
• Baseline VMT trends (refer to memo dated 7/6/2023)
• Local travel behavior (e.g., mode split)
• WFH trends at JPL
• LCF Shuttle annual ridership
Additionally, the GHG reduction formulas in the CAPCOA GHG Reduction Handbook cite peerreviewed sources for default parameters such as elasticity multipliers. We cite each of these sources where they are used in the analysis presented later in this memo.
Baseline VMT
The formulas provided in the CAPCOA GHG Reduction Handbook compute VMT reductions in the form of percentages, which are then multiplied by baseline VMT specific to the study area as
Blue Strike Environmental September 29, 2023
Page 3 of 13
calculated by the analyst. In the case of this CAAP, the baseline year for analysis is 2019, and the percentage reductions shown here for any given horizon year should be interpreted in relation to 2019 Baseline VMT.
Refer to the previous memo dated 7/6/2023 for documentation of the process of interpolating between the SCAG 2020 RTP model’s 2016 base year scenario and 2045 full-build scenario. This linear interpolation method is used for some of the methods used to estimate VMT reduction, described below.
Relating VMT to GHG
The great majority of transportation strategies quantified in the CAPCOA GHG Reduction Handbook accomplish GHG reductions by reducing VMT, and for these strategies there is a 1:1 correspondence between percentage VMT reduction and percentage GHG reduction. Other strategies accomplish GHG reductions through a transition from fossil-fuel-powered vehicles to hybrid or zero-emissions vehicles. For this latter type of strategies, GHG reductions are not necessarily associated with any change in VMT, except for possible effects from production and recharging of such vehicles. It is important to note that trip mileage from zero-emissions vehicles is still counted towards total VMT.
Non-Quantifiable VMT & GHG Reductions
The CAPCOA GHG Reduction Handbook documents quantification methodologies for VMT and GHG reduction strategies when robust literature is available, but not all common strategies are yet quantifiable. Per the CAPCOA GHG Reduction Handbook, non-quantifiable GHG reduction strategies “may achieve emissions reductions and co-benefits on their own or may enhance the ability of quantified measures to attain expanded reduction and co-benefits.”
3. VMT & GHG Reductions Estimation for Goal T1
This memo estimates the GHG reductions possible through reduction of citywide VMT, but does not attempt to estimate GHG reductions possible through other transportation-related strategies that do not reduce VMT.
The following pages summarize the final list of quantifiable VMT and GHG reduction strategies including their closest CAPCOA equivalent, the CAPCOA formulae and parameters used, the sources referenced, assumptions made where necessary, and the total citywide VMT reduction percentage as a proportion of baseline VMT.
The estimated VMT reductions from strategy are presented in table format. In each table, there are forecasts for multiple years: the 2016 base year of the SCAG 2020 RTP model, the 2045 fullbuild scenario of the model, and the interpolated years 2019 and 2040.
Blue Strike Environmental September 29, 2023
Page 4 of 13
Strategy T1.1: Work with La Canada Flintridge School Districts and Jet Propulsion Laboratory to develop and implement TDM programs for students and employees.
• Action T1.1.1: “Encourage partnerships with private schools to develop and implement school bus programs that reduce school-related single occupancy vehicle commutes”.
• Action T1.1.2: “Work with School Districts to encourage EV shuttle service for students living >1 mile from their neighborhood schools.”
The closest GHG reduction strategies in CAPCOA for these actions are T-40 Implement School Bus Program and T-41 Implement a School Pool Program, however, these strategies are not quantified. The closest quantified strategy in CAPCOA is T-6 Implement Commute Trip Reduction Program (Mandatory Implementation and Monitoring), but the description of this strategy is more applicable to workplace commute trips rather than K-12 school trips. The City is likely to have more policy levers for reducing vehicular trips to/from local schools than with workplace commute trips, as well as more flexibility to adapt those approaches to a local context.
Thus, Fehr & Peers sought to estimate an upper limit on the proportion of citywide VMT that could potentially be reduced from school-purpose VMT alone. Table 2 estimates the potential effect of eliminating 100% of school-purpose VMT through a combination of unspecified strategies. The VMT totals presented in the table are based on the SCAG 2020 RTP model’s 2016 base year scenario and 2045 full-build scenario
Note that the school trip length assumptions in the SCAG 2020 RTP model may underestimate school trip lengths in La Cañada Flintridge, due to a higher-than-average proportion of private schools in the City, which draw attendance from further distances. Therefore, this estimate may underrepresent the amount of VMT that could be reduced through this strategy, since the total school-related VMT for La Cañada Flintridge may be higher than what is estimated by the model.
Strategy T1.1
The maximum citywide VMT and GHG reduction from implementing the actions in Strategy T1.1 by 2040 is 0.25%, which is a slight reduction from earlier years
*Interpolated from 2016 and 2045.
Source: SCAG 2020 RTP ABM and Fehr & Peers, 2023.
Table 2: Estimate of Maximum VMT Reduction from Strategy T1.1
Blue Strike Environmental September 29, 2023
Page 5 of 13
Strategy T1.2: Improve connectivity of transportation network to encourage more high-occupancy trips.
• Action T1.2.1: Expand the frequency and hours of service of the LCF Shuttle.
The LCF Shuttle is a fare-free transit service operated by Glendale Beeline which operates along Foothill Boulevard and Ocean Boulevard between JPL and Montrose 18 times per weekday in each direction.
The closest GHG reduction strategy in CAPCOA for this action is T-26 Increase Transit Service Frequency. Table 3 uses an adapted version of the formula from CAPCOA Strategy T-26 to estimate the potential effect of doubling the average frequency of the LCF Shuttle route. Table 3: Estimate of Maximum VMT Reduction from Action T1.2.1
The maximum citywide VMT and GHG reduction from implementing Action T1.2.1 by 2040 is
which would increase in later years
*Interpolated from 2016 and 2045.
Source: SCAG 2020 RTP ABM and Fehr & Peers, 2023.
1 Crescenta Valley Weekly (2016). “LCF Shuttle Ridership Increases Dramatically” (2016). <https://www.crescentavalleyweekly.com/news/02/25/2016/lcf-shuttle-ridership-increases-dramatically/>.
2 250:1 was used to annualize this metric of weekday travel patterns
3 Handy, S., K. Lovejoy, M. Boarnet, and S. Spears (2013). “Impacts of Transit Service Strategies on Passenger Vehicle Use and GHG Emissions”. <https://ww2.arb.ca.gov/sites/default/files/2020-06/Impacts_of_ Transit_Service_Strategies_on_Passenger_Vehicle_Use_and_Greenhouse_Gas_Emissions_Policy_Brief.pdf>.
4 This includes ridership on all public transit services within the City
Blue Strike Environmental September 29, 2023
Page 6 of 13
• Action T1.2.2: Consider rideshare options to LAX airport, similar to the beach bus
The closest GHG reduction strategy in CAPCOA for this action is T-26 Extend Transit Network Coverage or Hours, however, this strategy’s VMT reduction is quantified by scaling transit mode share in a community with existing transit service. In this case, quantifying the VMT reduction effect from this CAAP action requires estimating passenger use of a direct transit service not yet offered along a defined OD pattern.
Fehr & Peers sought to estimate an upper limit on the proportion of citywide VMT that could potentially be reduced from vehicular travel to/from LAX alone. Table 4 estimates the potential effect of shifting half of vehicular trips between the City and LAX to a new transit or rideshare service, not counting the VMT contribution of any transit or rideshare vehicles themselves. The trip totals presented in the table are based on the SCAG 2020 RTP model’s 2016 base year scenario and 2045 full-build scenario.
The maximum citywide VMT and GHG reduction from implementing Action T1.2.2 by 2040 is 0.04%
*Interpolated from 2016 and 2045.
Source: SCAG 2020 RTP ABM and Fehr & Peers, 2023.
Table 4: Estimate of Maximum VMT Reduction from Action T1.2.2
Blue Strike Environmental September 29, 2023
Page 7 of 13
• Action T1.2.3: Assess and promote Park-&-Ride options for commuters outside of the city
The closest GHG reduction strategies in CAPCOA for this action is T-51 Install Park-and-Ride Lots, however, this strategy is not quantified. The effectiveness of park-&-ride facilities is dependent on their location within the regional transit network and the orientation of regional commute patterns. The VMT reduction effect of this CAAP action cannot be quantified without new modeling analysis. The greatest potential for new transit ridership from park-&-ride may be along the Metro A Line, which is outside the City bounds and already offers parking at the Sierra Madre Villa, Lake, Del Mar, Fillmore, and South Pasadena stations. 1
Action T1.2.3 is supportive of other VMT and GHG reduction efforts.
Strategy T1.3: Require new non-residential developments greater than 10,000 sq. ft. or anticipated to include businesses with more than 50 employees to reduce VMT through TDM programs.
• Action T1.3.1: Offer an annual bus pass to all new employees who express interest
The closest GHG reduction strategy in CAPCOA for this action is T-9 Implement Subsidized or Discounted Transit. This action would only apply to new employment growth in the City that occurs in buildings of over 10,000 square feet or that have more than 50 employees, and not to employees at existing workplaces. Thus, the calculations below represent the highest reduction that can be expected from this action.
The SCAG 2020 RTP ABM forecasts citywide employment growth between the 2016 base year scenario and 2045 full-build scenario. Fehr & Peers linearly interpolated this growth between 2016 and 2045 to estimate the employment growth as a percentage of service population (population + employees) growth starting in 2019, the base year of the CAAP. Table 5 uses the formula from CAPCOA Strategy T-9 to estimate the potential effect of offering subsidized transit passes to new employees citywide.
1 Los Angeles County Metropolitan Transportation Authority (2023). “Metro Parking Lots by Line”. <https://www.metro.net/riding/parking/lotsbyline/>.
Blue Strike Environmental September 29, 2023
Page 8 of 13
Table 5: Estimate of Maximum VMT Reduction from Action T1.3.1 (New Emp. Only) Strategy T1.3 – Action T1.3.1
The maximum citywide VMT and GHG reduction from implementing Action T1.3.1 for new employees only by 2040 is 0.01%
*Interpolated from 2016 and 2045.
Source: SCAG 2020 RTP ABM and Fehr & Peers, 2023.
1 Night-shift employees and independent contractors/”gig workers” are not eligible.
2 Taylor, B., D. Miller, H. Iseki, and C. Fink (2008). “Nature and/or Nurture? Analyzing the Determinants of Transit Ridership Across US Urbanized Areas”. Transportation Research Part A: Policy and Practice, 43(1), 6077. <https://citeseerx.ist.psu.edu/viewdoc/download?doi=10.1.1.367.5311&rep=rep1&type=pdf>.
3 Handy, S. and Boarnet, M.G. (2013). “Impacts of Transit Service Strategies on Passenger Vehicle Use and Greenhouse Gas Emissions”. <http://www.arb.ca.gov/cc/sb375/policies/transitservice/transit_brief.pdf>.
Blue Strike Environmental September 29, 2023
Page 9 of 13
For demonstration purposes, Table 6 uses the same formula from CAPCOA Strategy T-9 to estimate the potential effect of offering subsidized transit passes to all employees citywide, as opposed to new employees only This reduction amount includes the 0.01% possible from offering subsidized transit passes to new employees only, and should not be double-counted when totaling their cumulative effect.
Table 6: Estimate of Maximum VMT Reduction from Action
The maximum citywide VMT and GHG reduction from implementing Action T1.3.1 for all employees citywide by 2040 is 0.08%, which would increase in later years.
*Interpolated from 2016 and 2045.
Source: SCAG 2020 RTP ABM and Fehr & Peers, 2023.
1 Handy, S. and Boarnet, M.G. (2013).
2 Taylor, B., D. Miller, H. Iseki, and C. Fink (2008).
3 Handy, S. and Boarnet,, M.G. (2013).
Blue Strike Environmental September 29, 2023
Page 10 of 13
• Action T1.3.2: Encourage employers to provide opportunities for flex hours, compressed work week and telecommuting schedules to reduce VMT and reintroduce transportation reduction programs.
The closest GHG reduction strategy in CAPCOA for this action is T-42 Implement Telecommute and/or Alternative Work Schedule Program, however, this strategy is not quantified. The closest quantified strategies in CAPCOA are T-5 Implement Commute Trip Reduction Program (Voluntary) and T-6 Implement Commute Trip Reduction Program (Mandatory Implementation and Monitoring), but the descriptions of these strategies are more applicable to travel demand management (TDM) practices that shift work commute trips to transit and non-motorized modes, not “telework”/WFH practices which eliminate work commute trips altogether.
Fehr & Peers sought to estimate the effect of requiring WFH practices for employees added between 2019 and 2045, drawing from the analysis of WFH rates at JPL as described in the previous VMT memo dated 7/6/2023. Table 7 estimates the potential effect of requiring WFH at the projected JPL rate for all new employees citywide.
The maximum citywide VMT and GHG reduction from implementing Action T1.3.2 by 2040 is 0.43%, which would increase in later years
*Interpolated from 2016 and 2045.
Source: SCAG 2020 RTP ABM and Fehr & Peers, 2023.
1 City staff and JPL facilities operation staff
Table 7: Estimate of Maximum VMT Reduction from Action T1.3.2
Blue Strike Environmental September 29, 2023
Page 11 of 13
Strategy T1.4: Reduce other sources of citywide vehicle miles traveled (VMT).
• Action T1.4.1: Support Transit-Oriented Development
The closest GHG reduction strategy in CAPCOA for this action is T-3 Provide Transit-Oriented Development. This action would only apply to new development within the City. The effectiveness of this strategy is dependent upon the level of implementation of Action T1.2.1 and the future frequency of the Glendale Beeline Route 3.
Table 8 uses the formula from CAPCOA Strategy T-3 to estimate the potential effect of TOD land use policies for new development citywide. The quantification below estimates the theoretical maximum effectiveness of this policy based on a value of 4.9 from CAPCOA for variable D. For a more conservative estimate, use the value 1.0 for variable D.
Table 8: Estimate of Maximum VMT Reduction from
The maximum citywide VMT and GHG reduction from implementing Action T1.4.1 by 2040 is 0.31%, which would increase in later years
*Interpolated from 2016 and 2045.
Source: SCAG 2020 RTP ABM and Fehr & Peers, 2023.
1 Lund, H., R. Cervero, and R. Wilson (2004). “Travel Characteristics of Transit-Oriented Development in California”. <https://trid.trb.org/view/696824>.
Blue Strike Environmental September 29, 2023
Page 12 of 13
• Action T1.4.2: Promote Work-From-Home policies and infrastructure
This action concerns WFH on the residential side, rather than the workplace side. Policy tools for encouraging WFH among local residents are even more limited than the tools for encouraging WFH among local employers.
The closest GHG reduction strategy in CAPCOA for this action is T-42 Implement Telecommute and/or Alternative Work Schedule Program, however, this strategy is not quantified The VMT reduction effect of this CAAP action cannot be quantified without new modeling analysis.
Action T1.4.2 is supportive of other VMT and GHG reduction efforts.
4. Summary of Cumulative VMT & GHG Reductions
Estimating the cumulative VMT and GHG reductions from the CAAP strategies and actions in Goal T1 requires accounting for the compounding effects of the multiple strategies in combination through a multiplicative approach This approach provides a mathematical way to reflect the diminishing returns that each additional strategy offers towards cumulative VMT reduction, recognizing that multiple strategies may target the same types of trips, and any individual trip cannot logically be reduced more than once even if it is targeted by multiple strategies. The method for quantifying the cumulative total percent VMT reduction from n strategies is described by the formula below:
The estimates provided in Tables 2 through 8 are shown in the calculation below to derive the maximum cumulative percent VMT reduction possible by 2040. This calculation uses the VMT reduction estimate from Table 6 (subsidized transit passes for all citywide employees) in place of the estimate from Table 5 (subsidized transit for employees from new growth only).
Using the VMT reduction estimate from Table 5 (subsidized transit for employees from new growth only) in place of the estimate from Table 6 (subsidized transit passes for all citywide employees) yields a more conservative estimate:
15%
The maximum citywide VMT and GHG reduction from implementing Goal T1 by 2040 is 1.22% This amount is relative to 2019 Baseline VMT, and on top of expected VMT decline in a “Business as Usual” scenario due to policies and programs already reflected in the SCAG 2020 RTP/SCS.
Blue Strike Environmental September 29, 2023
Page 13 of 13
If you have any questions or comments about the analysis contained in this memo, feel free to contact Fehr & Peers for clarification.
The maximum citywide VMT and GHG reduction from implementing Goal T1 by 2040 is 1.22% This amount is relative to 2019 Baseline VMT, and on top of expected VMT decline in a “Business as Usual” scenario due to policies and programs already reflected in the SCAG 2020 RTP/SCS.
If you have any questions or comments about the analysis contained in this memo, feel free to contact Fehr & Peers for clarification.
APPENDIX F: VMT Analysis in Support of the La Cañada Flintridge CAAP
Memorandum
Memorandum
Date: June 20, 2023
To: Kristin Cushman and Sol Shepherd, Blue Strike Environmental
Date: September 29, 2023
From: Netai Basu, AICP, CTP and Griffin Kantz, Fehr & Peers
To: Kristin Cushman and Sol Shepherd, Blue Strike Environmental
From: Netai Basu, AICP, CTP and Griffin Kantz, Fehr & Peers
Subject: VMT Analysis in Support of the La Cañada Flintridge CAAP
Subject: VMT & GHG Reduction Strategy Analysis in Support of the La Cañada Flintridge CAAP LA22-3415
Introduction
1. Introduction
Fehr & Peers is assisting Blue Strike Environmental with transportation modeling efforts in support of the development of the La Cañada Flintridge Climate Action and Adaptation Plan (CAAP) for the City of La Cañada Flintridge, California. This memorandum documents the methodologies Fehr & Peers employed to estimate the potential for long-term reduction of citywide vehicle-miles-traveled (VMT) and the related greenhouse gas (GHG) emissions through strategies outlined in the draft CAAP, particularly in Goal T1
Fehr & Peers is assisting Blue Strike Environmental with transportation modeling efforts in support of the development of the La Cañada Flintridge Climate Action and Adaptation Plan (CAAP) in La Cañada Flintridge, California. The purpose of this memorandum is to document the methodologies used to estimate the baseline and future scenario vehicle-miles traveled (VMT) associated with the City in support of quantifying GHG emissions.
VMT Analysis Overview
Origin-destination-based VMT was estimated using the Southern California Association of Governments’ (SCAG) Activity-Based Model from the agency’s 2020 Regional Transportation Plan/Sustainable Communities Strategy (RTP/SCS). Such models are developed and periodically updated, calibrated, and validated for use in long range infrastructure planning, environmental impact assessments, and air quality conformity analyses by local and regional agencies. Tripbased travel forecasting models generate daily vehicle trips for each traffic analysis zone (TAZ) across various trip purposes based on inputs such as the transportation network and socioeconomic data (population, household, and employment). SCAG’s 2020 model is validated to the base year 2016, and it forecasts conditions out to 2045 for different scenarios of future regional travel patterns.
These quantification methodologies made use of the California Air Pollution Control Officers Association (CAPCOA) GHG Reduction Handbook 1 to the greatest extent possible. The 2021 CAPCOA GHG Reduction Handbook is the industry standard for quantifying GHG reductions from common transportation-oriented measures based on defensible, peer-reviewed research. In cases when the CAPCOA GHG Reduction Handbook does not offer an exact quantification methodology for a given transportation-based GHG reduction strategy proposed in the draft CAAP, Fehr & Peers referred to the closest quantifiable analog. Fehr & Peers also consulted research by the Southern California Association of Governments (SCAG) on post-pandemic “telework” / workfrom-home (WFH) trends.
Please refer to our previous memorandum which documented the methodologies used to estimate the vehicle-miles traveled (VMT) associated with the City for the 2019 Baseline and 2045 future “Business as Usual” scenarios (“VMT Analysis in Support of the La Cañada Flintridge CAAP,”
1 California Air Pollution Control Officers Association (2021). Handbook for Analyzing Greenhouse Gas Emission Reductions, Assessing Climate Vulnerabilities, and Advancing Health and Equity (Final Draft). <http://www.airquality.org/air-quality-health/climate-change/ghg-handbook-caleemod>.
600 Wilshire
Post-processing the model’s outputs yields City-level VMT totals disaggregated by:
• Trip configuration: internal-internal (I/I), internal-external (I/X), external-internal (X/I)
• Heavy-duty truck weight
Kristin Cushman and Sol Shepherd
June 20, 2023
Kristin Cushman and Sol Shepherd
Page 2 of 3
June 20, 2023
Page 2 of 3
VMT forecasts have been provided for the years 2016 and 2045, which are the base year and horizon year of the adopted model, respectively. The VMT forecast for the year 2023 documented in this memorandum is based on linear interpolation between those two years.
VMT forecasts have been provided for the years 2016 and 2045, which are the base year and horizon year of the adopted model, respectively. The VMT forecast for the year 2023 documented in this memorandum is based on linear interpolation between those two years.
Model Adjustments
Model Adjustments
Before producing the following vehicle trip and VMT forecasts for each scenario year, Fehr & Peers reviewed the off-the-shelf SCAG model and determined it was necessary to make two adjustments so that it would be suitable for this use:
Before producing the following vehicle trip and VMT forecasts for each scenario year, Fehr & Peers reviewed the off-the-shelf SCAG model and determined it was necessary to make two adjustments so that it would be suitable for this use:
• The structure of the transportation anlaysis zones in the model do not precisely align with the city’s municipal boundaries. In order to produce data representative of the entire city, the model’s socio-economic data (SED) inputs were shifted. Some population, households, and employees for two TAZs spanning the southwestern city boundary were reallocated to TAZs fully within the city boundary. The reallocation of households and population was based on a count of residential parcels in the overlap area and the reallocation of employees was based on a count of commercial parcels by type in the same area.
• The structure of the transportation anlaysis zones in the model do not precisely align with the city’s municipal boundaries. In order to produce data representative of the entire city, the model’s socio-economic data (SED) inputs were shifted. Some population, households, and employees for two TAZs spanning the southwestern city boundary were reallocated to TAZs fully within the city boundary. The reallocation of households and population was based on a count of residential parcels in the overlap area and the reallocation of employees was based on a count of commercial parcels by type in the same area.
• In the 2016 base year scenario, 5,477 employees were added to the TAZ in the northeast of the city, since Fehr & Peers determined that the off-the-shelf SCAG model does not account for JPL’s employees in La Cañada Flintridge. JPL had 6,085 employees in 2016 and 90% of them worked on-site, therefore 5,477 on-site JPL employees were added to the model. 1 JPL had 6,167 emlployees in 2022 and 90% of them worked on-site, thus yielding 5,550 on-site JPL employees in 2022. Fehr & Peers used this number of JPL onsite employees in modeling the horizon year 2045. For travel behavior modeling purposes, Fehr & Peers treated two-thirds of JPL employees as professional services/information technology employees and one-third as manufacturing employees.
• In the 2016 base year scenario, 5,477 employees were added to the TAZ in the northeast of the city, since Fehr & Peers determined that the off-the-shelf SCAG model does not account for JPL’s employees in La Cañada Flintridge. JPL had 6,085 employees in 2016 and 90% of them worked on-site, therefore 5,477 on-site JPL employees were added to the model. 1 JPL had 6,167 emlployees in 2022 and 90% of them worked on-site, thus yielding 5,550 on-site JPL employees in 2022. Fehr & Peers used this number of JPL onsite employees in modeling the horizon year 2045. For travel behavior modeling purposes, Fehr & Peers treated two-thirds of JPL employees as professional services/information technology employees and one-third as manufacturing employees.
Forecast Year Interpolation
Forecast Year Interpolation
A linear interpolation between the SCAG 2020 RTP model’s 2016 base year scenario and 2045 fullbuild scenario was used to estimate past and future VMT for the City of La Cañada Flintridge in 2023. The full-build 2045 scenario assumes implementation of all transportation projects and programs adopted in the 2020 RTP/SCS.
A linear interpolation between the SCAG 2020 RTP model’s 2016 base year scenario and 2045 fullbuild scenario was used to estimate past and future VMT for the City of La Cañada Flintridge in 2023. The full-build 2045 scenario assumes implementation of all transportation projects and programs adopted in the 2020 RTP/SCS.
Regional Fair-Share VMT
Regional Fair-Share VMT
The forecasts shown here calculate the City’s “fair share” of regional VMT by adding 50% of VMT for I/X trips and 50% of VMT for X/I trips between the City and the surrounding region to the total I/I VMT entirely within the City. We omit external-external (i.e., pass-through) trip VMT. This
The forecasts shown here calculate the City’s “fair share” of regional VMT by adding 50% of VMT for I/X trips and 50% of VMT for X/I trips between the City and the surrounding region to the total I/I VMT entirely within the City. We omit external-external (i.e., pass-through) trip VMT. This
1 2016 and 2022 employee totals provided by City staff.
1 2016 and 2022 employee totals provided by City staff.
Kristin Cushman and Sol Shepherd
June 20, 2023
Kristin Cushman and Sol Shepherd
Page 3 of 4
June 20, 2023
Page 3 of 4
method is standard for Climate Action Plans and other related analyses; it may differ from VMT calculation methods used in other contexts (for example, transportation impact analysis of a land use project).
method is standard for Climate Action Plans and other related analyses; it may differ from VMT calculation methods used in other contexts (for example, transportation impact analysis of a land use project).
Figure 1 shows the linear trendline interpolating between the 2016 base year and 2045 horizon year scenario forecasts from the SCAG model.
Figure 1 shows the linear trendline interpolating between the 2016 base year and 2045 horizon year scenario forecasts from the SCAG model.
Figure 1: Vehicle-Miles Traveled Interpolation
1: Vehicle-Miles Traveled Interpolation
VMT for La Cañada Flintridge
Table 1 presents the “fair-share” regional VMT for the City of La Cañada Flintridge in the forecast years. The City’s VMT declines by approximately 3.34% between the baseline year 2016 and the horizon year 2045, or by roughly 21,000 vehicle-miles. The substantial majority of VMT will continue to be between the City and the surrounding region for the forecast year, with I/X and X/I VMT comprising more than 97% of the City’s total VMT share. I/I VMT is forecasted to increase over time while total VMT is forecasted to decrease, due to a larger proportion of short-distance, locally-captured trips in the future.
Table 1 presents the “fair-share” regional VMT for the City of La Cañada Flintridge in the forecast years. The City’s VMT declines by approximately 3.34% between the baseline year 2016 and the horizon year 2045, or by roughly 21,000 vehicle-miles. The substantial majority of VMT will continue to be between the City and the surrounding region for the forecast year, with I/X and X/I VMT comprising more than 97% of the City’s total VMT share. I/I VMT is forecasted to increase over time while total VMT is forecasted to decrease, due to a larger proportion of short-distance, locally-captured trips in the future.
Table 1: Vehicle-Miles Traveled Forecast Summary
Table 1: Vehicle-Miles Traveled Forecast Summary
Source: Fehr & Peers, 2023.
Source: Fehr & Peers, 2023.
Figure
Kristin Cushman and Sol Shepherd
June 20, 2023
Page 4 of 5
Table 2 presents the forecasted vehicle-trips (VT) for the City of La Cañada Flintridge in the same years. I/X and X/I trips comprise 83-84% of the City’s total VT share in each year, which is less than the I/X and X/I proportion of VMT, since external trips are longer than internal trips, on average. Total VT are forecasted to increase over time while total VMT is forecasted to decrease, again due to a larger proportion of short-distance, locally-captured trips in the future.
Table 2: Vehicle Trips Forecast Summary
VMT by Vehicle Type
Table 3 on the following page disaggregates VMT for the City by vehicle type according to this framework:
• Light motor vehicles (LMV) are comprised of
o Drive Alone (DA)
o 2 Person Shared Ride (SR2)
o 3+ Person Shared Ride (SR3)
• Heavy-duty trucks (HDT) are comprised of
o Light heavy-duty trucks (8.5K-14K lbs. gross vehicle weight) (LHDT)
o Medium heavy-duty trucks (14K-33K lbs. gross vehicle weight) (MHDT)
o Heavy heavy-duty trucks (>33K lbs. gross vehicle weight) (HHDT)
LMV VMT comprises over 95% of the City’s total VMT in each forecast year. DA VMT is consistently 74-76% of total LMV VMT and 71-73% of Total VMT.
Kristin Cushman and Sol Shepherd
June 20, 2023
Page 5 of 5
Table 3: Vehicle-Miles Traveled Forecast Disaggregation by Vehicle Type
APPENDIX G: PROVISIONAL
FORECASTS AND MITIGATION TARGETS
D:
Introduction
Forecasts and Mitigation Targets
This appendix describes current greenhouse gas (GHG) emissions reduction targets and forecasts identified in La Cañada Flintridge’s 2024 Climate Action Plan for the near and long-term future and explains the mitigation targeting plan to the year 2045 The report also quantifies the reduction impact that local and federal laws, utility grid mix changes, and transportation trends will have on La Cañada Flintridge’s business-as-usual forecast, resulting in an “adjusted business-as-usual forecast ” Finally, the implications of La Cañada Flintridge’s top 10 emission reduction strategies from the 2024 Climate Action Plan are visualized in the findings of this report. Importantly, achieving the GHG mitigation targets described below, will be dependent on the strategies within the 2024 Climate Action Plan
Provisional targets for La Cañada Flintridge GHG mitigation as identified in the climate action plan are:
1. Reduce 40% of GHG emissions below 2007 levels by 2030.
2 Reduce 58% of GHG emissions below 2007 levels by 2035
3. Carbon neutrality by 2045.
Historical trends, a current inventory and series of forecasts can provide the City’s emission profile. Historically, the total tracked emissions for La Cañada Flintridge in 2007, were 292,1811 metric tons (MT) of carbon dioxide equivalent emissions (CO2e) and fell to 203,775 MT CO2e2 in 2014 The most recent greenhouse gas inventory was performed for the year 2019 in association with the 2024 Climate Action Plan. Total emissions in 2019 equaled 164,353 MT CO2e. This represents an emission reduction of 18 8% in 14 years Several forecasts were also developed A business as usual3 forecast projecting emissions based on City growth and an absence of interventions shows emissions growing to 168,381 MT CO2e by 2030, and 172,506 MT CO2e by
1Data was sourced from the 2014 CAP appendix C: GHG Reduction Targets & Adjusted Forecasts
2Data was sourced from the 2014 CAP appendix C: GHG Reduction Targets & Adjusted Forecasts
3 The business-as-usual forecast was estimated starting in the year 2019 using projected growth in population, households, employment, and vehicle miles traveled between 2010 and 2020 Projections were obtained from the United States Census Data Data for the years 2020 and 2050 were estimated using straight‐line interpolation from the USA Census
2045 The adjusted business as usual forecast which includes the effect of existing state and local policies shows emissions will reduce to 138,356 MT CO2e in 2030, and to 107,228 in 2045. To achieve targets set in the 2024 Climate Action Plan emissions should not exceed 175,309 MT CO2e from sectors listed in the 2007 GHG inventory by the year 2030, and 122,716 MT CO2e in 2035. A 100% reduction in emissions would require significant investment in strategies listed in the plan, as well as the achievement of all policy targets reflected in the adjusted business as usual scenario. If targets from the Top 10 Emission reduction strategies in the 2024 Climate Action Plan are successful, the City’s emissions will reduce to 101,548 MT CO2e by 2030 and potentially 21,111 MT CO2e by 2045 To meet targets set in the 2024 CAP the City has stated willingness to purchase renewable energy credits and offsets to reach carbon neutrality.
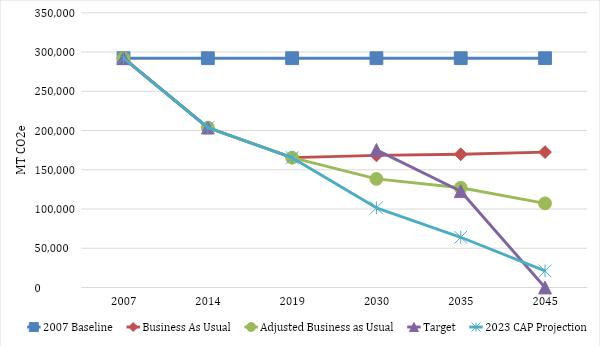
FIGURE 1: SUMMARY OF LA CAÑADA FLINTRIDGE’S GHG EMISSIONS AND REDUCTION TARGETS
Background
La Cañada Flintridge has set its goals in reference to a strong commitment for environmental mitigation from state and regional partners. There are many nearby organizations who influenced the strategic target of La Cañada Flintridge’s carbon reduction goals.
State Guidance
Some regulations apply at the state level, but others are state imposed mandates applicable at the municipal level and required of local agencies and jurisdictions AB 32 directs the state to reduce statewide GHG emissions to 1990 levels by 2020, while SB 32 deepens that commitment to 40 percent below 1990 levels by 2030. To achieve these reductions, the California Air Resources Board (CARB) and the state Office of Planning and Research recommend that local governments develop community-wide targets that are consistent with these statewide targets. As such, this CAAP sets a 2045 community wide GHG target for the city consistent with state recommendations, and it outlines the strategies and actions the city will take to reduce GHG emissions and track progress towards reaching that target.
In September 2022, the State of California adopted Assembly Bill 1279 (AB 1279), which creates a legally binding goal that the state achieves carbon neutrality meaning the state either eliminates or captures all its GHG emissions by no later than 2045 CARB has been entrusted with leading the statewide planning effort to achieve this long-term target, and the plan was published to chart a comprehensive path for the State of California to attain carbon neutrality by 2045
Regional Guidance
The forecasts were designed to be consistent with the City’s General Plan and other relevant planning documents, including the Energy Action Plan, Trails Master Plan and Local Hazard Mitigation Plan. As part of its 2013 General Plan Update, the city committed to preparing a 2016 Climate Action Plan that focused on reducing community and municipal emissions by at least 15% by 2020 compared to the 2007 baseline inventory. Table A identifies progress made since 2016. The city has noted a need for additional staff to help capture continued progress over time. More information on the City’s approach to staffing can be found in the Management Approach section.
Recognizing the need for urgent and ambitious climate action based on public concern and scientific evidence, La Cañada Flintridge saw the imperative to systemize and accelerate efforts.
Therefore, this 2024 CAAP represents the next step, unifying existing climate work under one strategic umbrella to transition the city to a low-carbon, climate-resilient community The CAAP builds on previous city planning documents and will be updated every five years to remain consistent with updates to the City’s General Plan Elements
Provisional GHG Reduction Targets
Blue Strike Environmental recommends three GHG mitigation targets, which are like those of nearby cities, as well as the state of California. These goals are outlined in the 2024 La Cañada Flintridge Climate Action Plan
1. Reduce 40% of GHG emissions below 2007 levels by 2030.
2 Reduce 58% of GHG emissions below 2007 levels by 2035
3 Carbon neutrality by 2045
These goals are consistent with state laws, regional partners, and local organizations in regard to GHG mitigation, as stated in future sections Blue Strike Environmental recommends 2030, 2035 and 2045 targets to meet state guidelines.
TABLE 1: 2020 AND 2035 GHG EMISSIONS TARGETS
2007 Baseline GHG Emissions 292,181 MT CO2e
2030 Target 175,309 MT CO2e
2035 Target 122,716 MT CO2e
2045 Target Carbon Neutrality
GHG Emissions Forecasts
GHG Emissions Forecasts
GHG Emissions Forecasts
GHG Emissions Forecasts
As annual emissions change over time because of external factors such as population and job growth, the reference of an emissions forecast that includes projected growth is needed to estimate the level of GHG reductions needed in a future year Calculating the change between forecasted GHG emissions and the reduction target shows the gap to be closed through La
As annual emissions change over time because of external factors such as population and job growth, the reference of an emissions forecast that includes projected growth is needed to estimate the level of GHG reductions needed in a future year Calculating the change between forecasted GHG emissions and the reduction target shows the gap to be closed through La Cañada Flintridge Climate Action Plan goals.
Cañada Flintridge Climate Action Plan goals
Business-As-Usual Forecast
Business-As-Usual Forecast
As annual emissions change over time because of external factors such growth, the reference of an emissions forecast that includes projected g estimate the level of GHG reductions needed in a future year. Calculatin forecasted GHG emissions and the reduction target shows the gap to b Cañada Flintridge Climate Action Plan goals
As annual emissions change over time because of external factors such as population and job growth, the reference of an emissions forecast that includes projected growth is needed to estimate the level of GHG reductions needed in a future year Calculating the change between forecasted GHG emissions and the reduction target shows the gap to be closed through La Cañada Flintridge Climate Action Plan goals
Business-As-Usual Forecast
The La Cañada Flintridge business-as-usual forecast scenario shows an emissions would change between the years 2019 and 2045 if populatio efficiencies, and energy usage continue as in 2019, without any new reg reduce local emissions. As shown in Figure 2, under the 2019 business-
Business-As-Usual Forecast
The La Cañada Flintridge business-as-usual forecast scenario shows an estimate of how GHG emissions would change between the years 2019 and 2045 if population trends, vehicle efficiencies, and energy usage continue as in 2019, without any new regulations that would reduce local emissions As shown in Figure 2, under the 2019 business-as usual forecast La
The La Cañada Flintridge business-as-usual forecast scenario shows an estimate of how GHG emissions would change between the years 2019 and 2045 if population trends, vehicle efficiencies, and energy usage continue as in 2019, without any new regulations that would reduce local emissions As shown in Figure 2, under the 2019 business-as usual forecast La Cañada Flintridge’s GHG emissions were estimated to grow approximately 4.3 % from a baseline of 2019 GHG emissions levels by the year 2045 (from 164,353 MT CO2e to 172,506 MT CO2e)
The La Cañada Flintridge business-as-usual forecast scenario shows an estimate of how GHG emissions would change between the years 2019 and 2045 if population trends, vehicle efficiencies, and energy usage continue as in 2019, without any new regulations that would reduce local emissions As shown in Figure 2, under the 2019 business-as usual forecast La Cañada Flintridge’s GHG emissions were estimated to grow approximately 4 3 % from a baseline of 2019 GHG emissions levels by the year 2045 (from 164,353 MT CO2e to 172,506 MT CO2e)
Cañada Flintridge’s GHG emissions were estimated to grow approximat of 2019 GHG emissions levels by the year 2045 (from 164,353 MT CO2e
Cañada Flintridge’s GHG emissions were estimated to grow approximately 4 3 % from a baseline of 2019 GHG emissions levels by the year 2045 (from 164,353 MT CO2e to 172,506 MT CO2e)
This forecast uses baseline annual population growth which is calculate 0.16% according to the US Census Bureau between 2010 and 2020 and population remains stable in the area
This forecast uses baseline annual population growth which is calculated to be approximately 0.16% according to the US Census Bureau between 2010 and 2020 and shows that the population remains stable in the area.
This forecast uses baseline annual population growth wh 0.16% according to the US Census Bureau between 2010 population remains stable in the area
This forecast uses baseline annual population growth which is calculated to be approximately 0 16% according to the US Census Bureau between 2010 and 2020 and shows that the population remains stable in the area
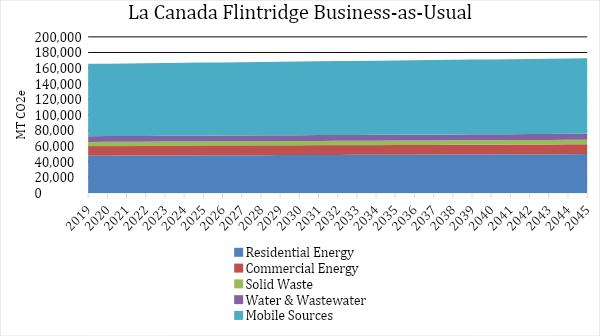
URE 2: BUSINESS-AS-USUAL FORECAS
Adjusted Business-As-Usual Forecast
Adjusted Business-As-Usual Forecast
Adjusted Business-As-Usual Forecast
There are several federal, state regulations and organizational commitments have been enacted that would reduce La Cañada Flintridge’s GHG emissions by 2045 The influence of these regulations and commitments was quantified and included into the adjusted business-as-usual forecast to provide an accurate picture of future emissions growth to 2045 as well as the response that the City will need to have to reduce GHG emissions. As shown in the figure below, these state regulations will reduce La Cañada Flintridge’s business-as-usual GHG emissions by approximately to 138,356 MT CO2e by 2030 and 107,228 MT CO2e by 2045
There are several federal, state regulations and organizational commitments have been enacted that would reduce La Cañada Flintridge’s GHG emissions by 2045 The influence of these regulations and commitments was quantified and included into the adjusted business-as-usual forecast to provide an accurate picture of future emissions growth to 2045 as well as the response that the City will need to have to reduce GHG emissions As shown in the figure below, these state regulations will reduce La Cañada Flintridge’s business-as-usual GHG emissions by approximately to 138,356 MT CO2e by 2030 and 107,228 MT CO2e by 2045
There are several federal, state regulations and organizational commitments have been enacted that would reduce La Cañada Flintridge’s GHG emissions by 2045 The influence of these regulations and commitments was quantified and included into the adjusted business-as-usual forecast to provide an accurate picture of future emissions growth to 2045 as well as the response that the City will need to have to reduce GHG emissions. As shown in the figure below, these state regulations will reduce La Cañada Flintridge’s business-as-usual GHG emissions by approximately to 138,356 MT CO2e by 2030 and 107,228 MT CO2e by 2045
The Corporate Average Fuel Economy (CAFE) standards also impact La Cañada Flintridge emissions which reduce the amount of carbon emitted by transportation and vehicle miles traveled According to U S Community Protocol and ICLEI ClearPath4 the increasing CAFE standards will reduce emissions by 1.8% per year, resulting in an average annual reduction of 8,322 6 MT CO2e
The Corporate Average Fuel Economy (CAFE) standards also impact La Cañada Flintridge emissions which reduce the amount of carbon emitted by transportation and vehicle miles traveled According to U S Community Protocol and ICLEI ClearPath4 the increasing CAFE standards will reduce emissions by 1.8% per year, resulting in an average annual reduction of 8,322.6 MT CO2e.
The Corporate Average Fuel Economy (CAFE) standards also impact La Cañada Flintridge emissions which reduce the amount of carbon emitted by transportation and vehicle miles traveled According to U S Community Protocol and ICLEI ClearPath4 the increasing CAFE standards will reduce emissions by 1.8% per year, resulting in an average annual reduction of 8,322 6 MT CO2e
La Cañada Flintridge has electricity serviced by Southern California Edison5 Southern California Edison has made commitments to provide 100% carbon free electricity to their customer base by the year 20456 The Adjusted Business as Usual takes these regional considerations into account when calculating projections for emissions in La Cañada Flintridge It also includes the assumed growth factors from the Business-as-Usual scenario.
La Cañada Flintridge has electricity serviced by Southern California Edison5 Southern California Edison has made commitments to provide 100% carbon free electricity to their customer base by the year 20456. The Adjusted Business as Usual takes these regional considerations into account when calculating projections for emissions in La Cañada Flintridge It also includes the assumed growth factors from the Business-as-Usual scenario.
La Cañada Flintridge has electricity serviced by Southern California Edison5 Southern California Edison has made commitments to provide 100% carbon f the year 20456 The Adjusted Business as Usual takes th when calculating projections for emissions in La Cañada F growth factors from the Business-as-Usual scenario.
La
Cañada Flintridge Adjusted Business-as-Usual
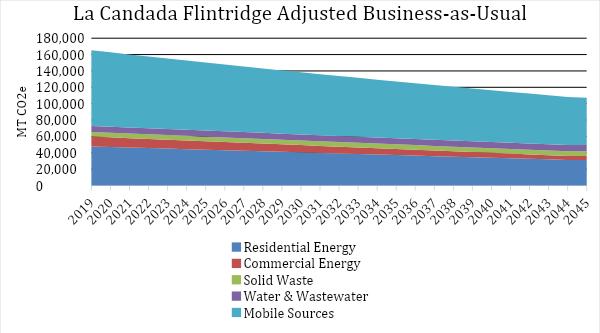
FIGURE 3: ADJUSTED BUSINESS-AS-USUAL FORECA
FIGURE 3: ADJUSTED BUSINESS-AS-USUAL FORECAST
4 More information can be found at https://icleiusa org/
5 Grid mix for Southern California Edison is available at https://www sce com/sites/default/files/custom-files/Web%20files/2021%20Power%20Content%20Label pdf
5 Grid mix for Southern California Edison is available at https://www sce com/sites/default/files/custom-files/Web%20files/2021%20Power%20Content%20Label pdf
6 More information on the climate goals for SCE are available at: com/about-us/who-we-are/corporate-responsibility#:~:text=Leading%20the%20Clean%20EnergyTr ansition&text=We%20are%20preparing%20our%20grid,and%20home%20heating%20and%20cooling
6 More information on the climate goals for SCE are available at: https://www sce com/about-us/who-we-are/corporate-responsibility#:~:text=Leading%20the%20Clean%20EnergyTr ansition&text=We%20are%20preparing%20our%20grid,and%20home%20heating%20and%20cooling.
6 More information on the climate goals for SCE are available at: https://www sce com/about-us/who-we-are/corporate-responsibility#:~:text=Leading%20the%20Clean%20EnergyTr ansition&text=We%20are%20preparing%20our%20grid,and%20home%20heating%20and%20cooling https://www sce com/sites/default/files/custom-files/Web%20files/2021%20Power%20Content%20Label pdf
4 More information can be found at https://icleiusa org/ 6
FIGURE 3: ADJUSTED BUSINESS-AS-USUAL FORECAST
Top 10 Emission Reduction Strategies
To meet the targets set in the 2024 Climate Action Plan, Blue Strike modeled the top 10 emission reduction targets. There were 5 emission strategies that had quantitative emission reductions attached to the strategies The table below shows the annual emission reductions for each individual strategy, as calculated, and modeled in excel using the U.S Community Protocol.
TABLE 2: Emission reductions Strategies from 2024 Climate Action Plan
Transition to 100% renewable energy by 2050
1,116 MT CO2e MT CO2e/year
Increase EV infrastructure and adoption community-wide to reduce combustion engine VMT by 25% by 2040 and promote increased EV adoption by 2045 and substantially increase EV adoption rates7 2,207 MT CO2/year8
Promote natural gas alternatives to commercial and residential customers using a Heat Pump Promotional Campaign 4,308 MT/year9
Complete a community-wide building electrification study and establish a long-term implementation plan (Phase 1 and Phase 2) 1,306 MT CO2e/year10
Consider a residential and commercial “Bulk Purchasing” solar agreement to bring upfront costs down. Campaign: Solarize LCF (Partner with the school district) 1,104 MT CO2/year11
Encourage all appropriate new construction be designed for net-zero energy 393 MT CO2e/year12
Achieve 15% reduction in residential and commercial energy use by 2035 587 MT CO2e/year13
Incorporate climate action and adaptation into city policy, budget, planning, and internal standards N/A
Join the Clean Power Alliance 1,502 MT CO2/year14
Appoint a Commission on the Environment N/A
7 To reach carbon neutrality the assumption much be made to reach 100% EV adoption rate by 2050, which is in line with the State of California’s goals for carbon reduction
8 This number was drawn from using U S Community protocol appendix D and https://evadoption com/ev-sales/ev-sales-forecasts/ to reduce transportation emissions
9 Assuming 10% of household renovated by 2030
10 10% of housing Natural Gas to transition by 2035
11 Average size of a systems is 4kWh, with a goal of getting 10% of housing solarized by 2030 Cumulative reductions until 2030 using US Community protocol for reduction of mmbtu per kwh solar added.
12 All new buildings reduce their embodied carbon to zero Cumulative embodied carbon saved by 2045 for residential building based on average construction and average home size multiplied by average embodied carbon of 150 kg CO2e per m3
13 Reducing 8,817 over 16 years
14 On average communities reduce electricity emissions by 30% by 2030 by joining the Clean Power Alliance Cumulative carbon emissions reduction with a 30% emissions reduction in electricity by 2030 Annual carbon emissions reduction with a 30% emissions reduction in electricity by 2030
The emission reductions leading to 2045 are shown in figure 3. According to projections, the City should be able to achieve its goals, if the 2024 Climate Action Plan strategies (listed in table 2) are enacted, and policies from the adjusted business-as-usual scenario are achieved In 2030 the city can reduce its emissions to 101,548 MT CO2e per year, which achieves the target of 50% emission reduction by 2030 using a 2005 baseline By 2045 the city would be emitting 21,111 MT CO2 per year; these remaining emissions are due to water and wastewater treatment as well as solid waste emissions.
The emission reductions leading to 2045 are shown in figure 3. According to projections, the City should be able to achieve its goals, if the 2024 Climate Action Plan strategies (listed in table 2) are enacted, and policies from the adjusted business-as-usual scenario are achieved In 2030 the city can reduce its emissions to 101,548 MT CO2e per year, which achieves the target of 50% emission reduction by 2030 using a 2005 baseline By 2045 the city would be emitting 21,111 MT CO2 per year; these remaining emissions are due to water and wastewater treatment as well as solid waste emissions.
LA CAÑADA FLINTRIDGE TOP REDUCTIONS SCENARIO
MOBILE SOURCES
WATER & WASTEWATER SOLID WASTE COMMERCIAL ENERGY RESIDENTIAL ENERGY
BASELINE ADJUSTED BUSINESS AS USUAL
FIGURE 3: LA CAÑADA FLINTRIDGE’S TOP 10 EMISSION REDUCTION SCENARIO
FIGURE 3: LA CAÑADA FLINTRIDGE’S TOP 10 EMISSION REDUCTION SCENARIO
Meeting the Targets
Achieving emission reductions as substantial as those outlined in the 2024 Climate Action Plan may not be easy, but carbon neutrality is a worthwhile endeavor for the community. Enacting the measures from the 2024 Plan will be essential to success, though it is acknowledged that adjustments may need to be made Currently listed strategies can be periodically revisited by the City and community for any necessary changes in the Plan. Further, the Plan leaves a small number of emissions in 2045 from water, wastewater, and solid waste These emissions: a total of 21,111 MT CO2e need to be offset to reach carbon neutrality in 2045 As stated in the 2024 CAP the city is willing to temporarily use Renewable Energy Credits (REC’s) and Offsets to meet their goals By combining credits with the strategies contained in the Plan the City looks forward to achieving its goals, in pursuit of 50% emissions reductions by 2030 and net zero by 2045.