FRAMING THE GAP ANALYSIS STRATEGIES & CONSIDERATIONS
SUMMARY OF SCENARIOS
SUMMARY OF INDIVIDUAL STRATEGIES FOR IMPLEMENTATION
IMPLEMENTATION TIMELINE & BUDGET
SUMMARY
APPENDIX A: STRATEGY DESCRIPTIONS
METHODOLOGY ASSUMPTIONS
EXECUTIVE SUMMARY
In 2018, the Durham’ County Board of Commissioners adopted a resolution, calling for a plan to transition operations from fossil fuel-powered operations to 80 percent clean, renewable energy by 2030 and 100 percent by 2050. This goal aligns with Durham County’s efforts to reduce greenhouse gas emissions, reduce local air pollution, and stimulate the creation of jobs. Durham County’s bold resolution necessitates ambitious strategies that are outlined in this Renewable Energy Plan (REP). The REP provides a roadmap to enable Durham County to achieve its goal through a combination of strategic policy and program design, focused on developing local renewable energy resources and bolstering local reliability and resilience. Furthermore, the REP will help Durham County understand and prioritize each renewable energy strategy with a lens on social, economic and environmental benefits.
APPROACH
The Durham County Board of Commissioners recognized that the transition to renewable fuels should also include opportunities to provide clean jobs, spur economic development and improve the resilience of our energy systems in the face of a changing climate. Given these priorities, the REP necessitates a strong preference for locally-sited, renewable generation and fuel switching, with the option to buy renewable energy credits (RECs) only after all other options have been exhausted. The approach for the REP is to ensure that the final Plan is an actionable, relevant document that can guide all efforts to meet the County’s renewable energy goals. Each phase of the REP will contain strategic initiatives that will enable Durham County to reach its goals within the County’s parameters, to:
•Reduce building electricity consumption with energy efficiency, on-site generation, and renewable thermal alternatives
•Explore renewable options such as solar to replace all electricity that is fossil or nuclear powered
•Focus on building electrification, which may include replacing all building thermal energy sources with heat pump water heaters, solar-source heat pumps, or renewable fuels
•Replace fossil fueled vehicles with electric or renewable diesel options
•Select, design, and implement actions with conscious focus on equity impacts
BACKGROUND
Energy policy is set at the state level in North Carolina and utilities are regulated through the NC Utilities Commission. This leaves local communities with limited choices regarding how they procure energy sources. North Carolina has been a leader in renewable energy for over a decade, beginning with the passage of the southeast’s first law to require utilities to provide renewable energy through the Renewable Energy and Efficiency Portfolio Standard (REPS). Under this law, investor-owned utilities in North Carolina are required to meet at least 12.5% of their energy production through renewable energy resources and energy efficiency measures.
Recent state laws such as Competitive Energy Solutions for NC (2017) and Energy Solutions for North Carolina (2021) require electric utilities to increase the amount of renewable energy they generate and purchase, thus increasing the percentage of renewable energy available to customers through the grid. In addition, Governor Cooper has signed several Executive Orders (EO80, EO218, and EO 246) that create aggressive clean energy and greenhouse gas reduction goals for North Carolina that will in turn affect the energy mix and emissions at the local level.
Durham County has had a commitment to high performance buildings for more than 15 years, and has to date built or renovated over a dozen buildings to LEED standards. The County adopted a High Performance Building policy in 2008 and entered into a Utility Performance Contract in 2012 that resulted in significant energy and water savings in seven buildings over 15 years.
The County’s Environmental Affairs Board (EAB) wrote the definition for what energy is considered renewable as it relates to the County’s goals, One point of consideration is how to account for nuclear energy which makes up 25%1 of the electricity provided to Durham County through the electrical grid. Nuclear Energy is a source of carbon-free electricity but is not considered clean or renewable.
definition of renewable energy
Clean, renewable energy is defined as energy derived from ongoing natural processes that rapidly replenish and is sustainably collected from natural resources such as solar, wind and geothermal. Other approaches may be included after being evaluated for sustainability and environmental justice implications. Energy Efficiency will continue to be an important part of our approach by minimizing the amount of energy used overall.
It is important to note that one potential strategy discussed in the REP, renewable diesel used in the County fleet, does not directly align with the definition presented above. This solution would need to be evaluated further by County staff and the EAB with respect to sustainability, carbon intensity and environmental justice considerations.
EQUITY
Durham County is committed to transitioning to clean, renewable energy in a just and equitable manner. This means that all actions, projects, and policies need to be developed, analyzed, and implemented in ways that shift the negative effects away from communities that have traditionally been overburdened and positive effects towards those that have traditionally been left out of the economic and environmental benefits. Because this plan is focused on county operations and county facilities, most of the impacts will be contained on Durham County property. However, staff must still work with the community to answer key questions including what impacts there will be, who will be affected, who benefits, how can negative impacts be minimized and positive impacts maximized for affected neighbors and communities.
As applicable, throughout the implementation process, the County will frame vendor solicitations with equity as a core value. Equity can play a role in ensuring that projects are sized to fit the capabilities of certified small businesses who might not be able to bid on larger projects. Equity can also play a role in designing projects to have a workforce development element. Throughout the planning process, the County will look for ways to build public private partnerships that can scale the value of the projects being implemented. In addition, the County will adhere to its equitable engagement commitment to ensure that people who are most affected by decisions are part of the planning process.
benefits & outcomes
ALIGN WITH LOCAL CLIMATE ACTION PLAN contribute to global climate action
Align with the priorities outlined in the updated Durham Local Climate Action Plan and the 2017 Strategic Plan.
Decrease greenhouse gas emissions by transitioning to 100% renewable energy.
RECOMMENDED STRATEGIES
PROMOTE LOCAL ECONOMIC DEVELOPMENT
ENHANCE DISASTER RESILIENCY
Produce green jobs in the solar, energy efficiency industries, and electric vehicle sectors. Continue operation of critic al facilities and services during disasters.
REACH STATE GOALS
Share best practices with local and regional networks.
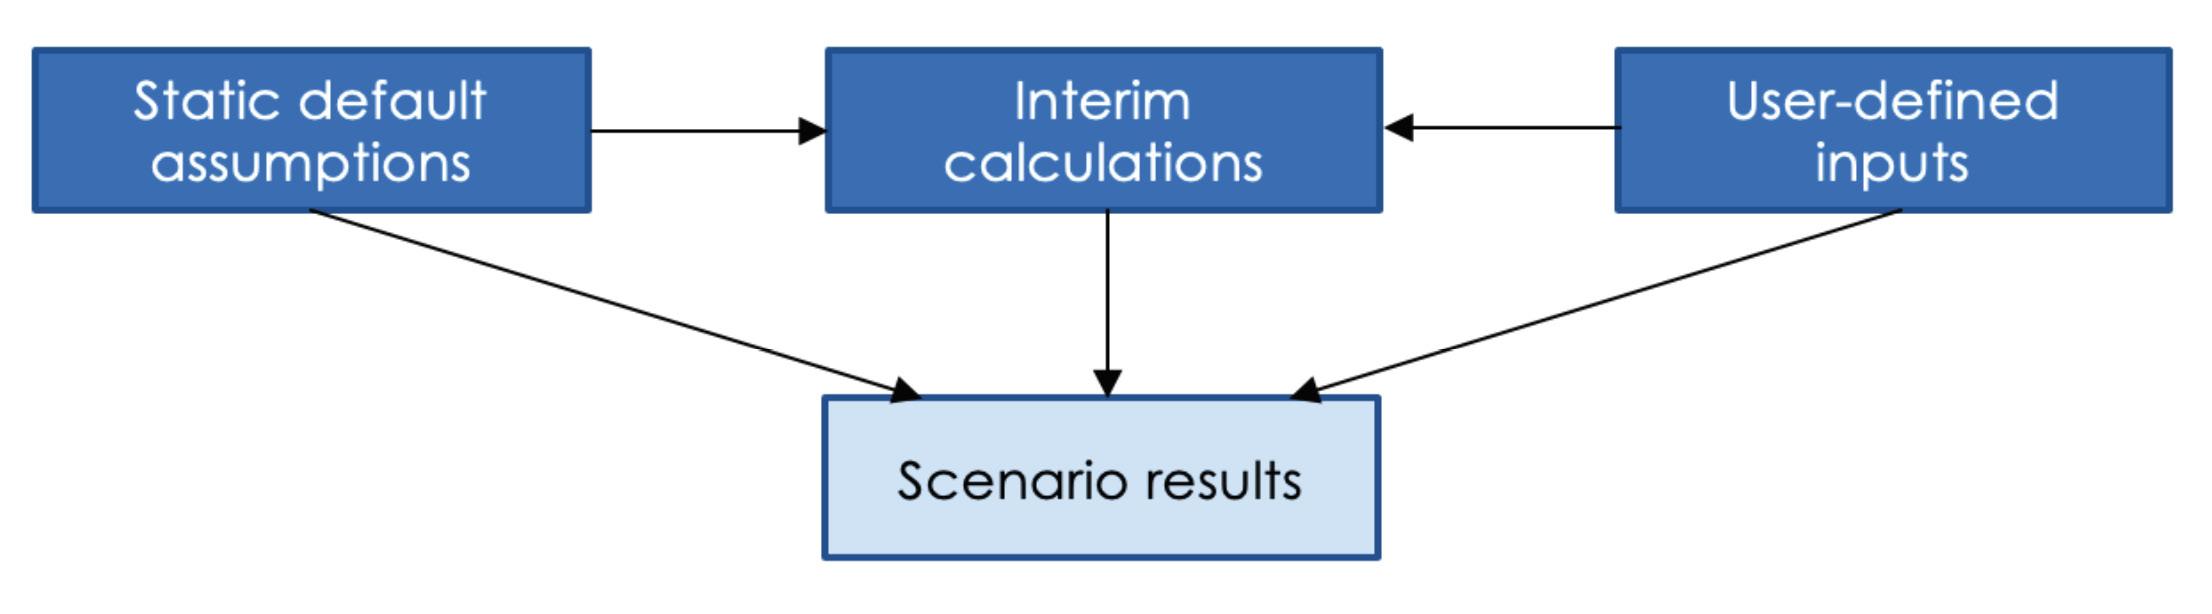
The appropriateness of each proposed strategy, including SMART recommendations highlighting specific, measurable, achievable, relevant, and timely goals will be considered for implementation. These specific measurements allow the County to follow a concrete time frame for strategy completion driven by the feasibility and costs of each action within Durham County. The County utilized EcoShift’s Climate and Energy Scenario Analysis (CESA) tool to test and create various pathways to 80% and 100% renewable energy.
POLICY ALIGNMENT
fleet
energy efficiency building electrification
Target energy efficiency projects to reduce 20% of energy usage
rooftop solar & large scale solar
Invest in on-site solar projects
Participate in Duke Energy’s Green Source Advantage program
Sell All (when available)
Right-size the fleet
Transition to Electric Vehicles
Reduce VMT
Purchase renewable diesel (when available)
STATEWIDE ENGAGEMENT
Switch natural gas boilers and hot water to heat pumps at large facilities
Plan new facilities to reduce natural gas use
fill the gap
Advocate for increased grid renewables through policy change and utility engagement
Purchase minimal amount of renewable energy credits
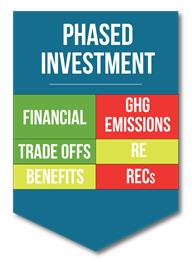
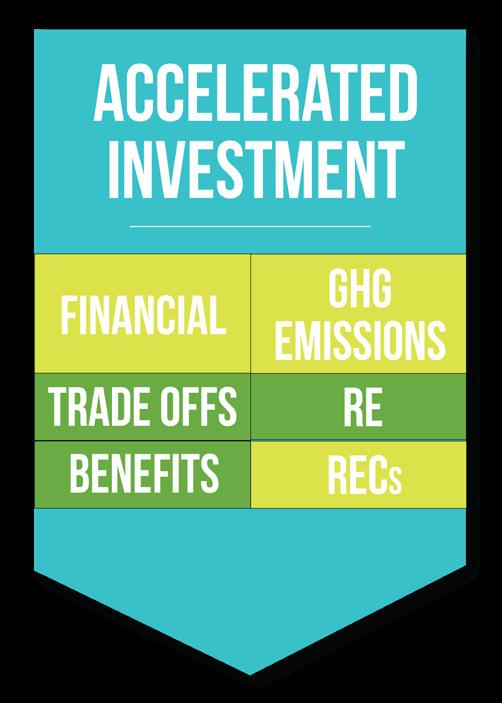
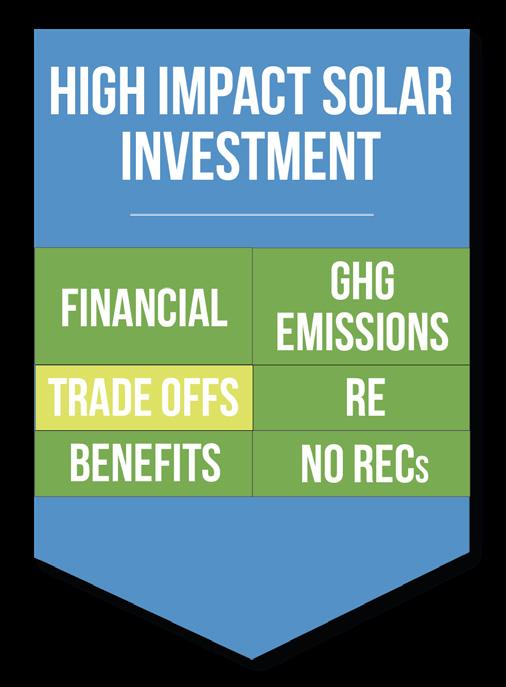
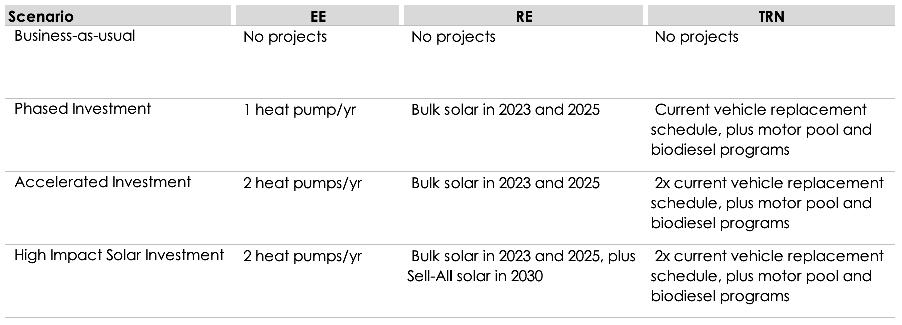
The recommended strategies are combined into scenarios that align growth, phasing, and infrastructure investment over various time horizons. These scenarios can be adjusted as market trends change to account for budgetary uncertainty and Duke Energy’s unpredictable future renewable energy portfolio. Three primary scenarios were developed: a Phased Investment scenario based on the County’s typical boiler, HVAC, and fleet vehicle replacement schedule; an Accelerated Investment scenario that doubles the pace of investment; and a High Impact Solar Investment that includes a number of additional off-site solar project ideas that will help propel the County to 100% renewable energy. For a complete breakdown of each scenario, refer to Appendix A
POSITIVE NEUTRAL NEGATIVE
scenario name key characteristics considerations IMPACT
1 Heat Pump project/year
2 Rooftop Solar projects/year
Fleet Replacement schedule
Renewable Diesel fleet conversion
Follows County’s standard HVAC and fleet replacement schedules
Additional cost considerations (price premiums)
Takes longer to reach goals
Benefits of improvements accrue more slowly
Higher investment required closer to goal target date
47% GHG reductions by 20302
53% renewable energy by 2030, and 72% by 2050
2 Heat Pump projects/year
4 Rooftop Solar projects/year
Accelerated Replacement schedule (doubles the pace of fleet replacement)
Renewable Diesel fleet conversion
Higher investment each year relative to the Phased approach
Additional cost considerations (price premiums)
Might retire some vehicles before useful life is realized
61% GHG reductions by 2030
61% renewable energy by 2030, and 72% by 2050
Identical to Accelerated Investment, but also including off-site solar projects to meet County goals
Note: CESA modeling for this scenario uses 5 solar projects developed through Duke Energy’s Sell-All tariff (4 at the County stadium and 1 at the landfill). However, given significant policy and market uncertainty and concerns over project viability, the REP describes four other off-site solar development strategies that could be used by the County (See Phase 3 and Appendix A)to fill the same need for renewable electricity
Figure A: Key characteristics within each Scenario
CONTINUOUS IMPROVEMENT needed
Regulatory considerations
Community considerations regarding solar installations at the stadium
Ability to attract solar developers to County sites
Ensuring additionality for RECs sourced from off-site renewables
Financial risk for County inherent in exploring new programs and contracting arrangements
100% GHG reductions through 2030
100% renewable energy by 2050
The development of this REP is an important first step on the County’s path to 100% renewable energy. Increasing from 2% to 100% renewable energy will require commitment from the County, strong local and regional partnerships, and engagement with a wide variety of stakeholders.
Monitoring the progress of the REP will also be important to its success. To that end, the County has developed tools to track progress towards its goals. The County will provide regular updates on the progress of this Plan and encourages the community to stay involved as critical stakeholders.
Forces outside of the County’s direct control like emerging technologies, market forces, and state and federal policies will continue to change over time, affecting the County’s progress towards its goals. It is expected that many of the projects outlined in this report that are less feasible today will become more feasible over the next 10-20 years. Of the projects that are feasible today, it is expected that the economics of many of them will improve. For example, the costs of solar panels and battery storage are expected to continue to decline. Other technologies like offshore wind and renewable fuels are also expected to mature over the next 10-20 years.
While market and policy solutions are certain to arise to address some barriers the County is facing, challenges outside of the County’s direct control may persist through 2050 including the use of natural gas in Duke Energy’s electricity generation mix and the presence of non-renewable energy in regional imports on the electricity grid. Considering current projections for the renewable content of grid electricity in North Carolina and current limitations to on-site renewable development opportunities, the County does not reach its renewable energy goals without
significant off-site renewable energy development. Additionally, while the County owns significant land to support said development, all potentially viable avenues for that development have significant challenges and risks associated with them (described further in Appendix A). Because of this, it is possible the County will need to consider the purchase of carbon offsets or retirement of RECs. The purchase of RECs should be weighed carefully against other solutions, as well as the source and quality of the RECs, within the larger context of the County’s goals.
As this REP demonstrates, there are a number of options the County can pursue on its journey to 100% renewable energy, but each has unique challenges and risks. As the forces outlined above unfold and evolve, it will be important to revisit the assumptions in this REP. As such, this should be viewed as a living document that will change over time in response to changes in market and policy conditions. Consider this REP as a guidebook as the County launches towards a bold new future fueled by clean, renewable energy
overall funding needed
Outlined in this report is a thorough breakdown of all costs associated with individual projects and the Net Present Value (NPV) associated with each scenario. Although the NPV is positive for many projects, the cumulative scenariolevel NPV represents a cost to the County. Depending on the pathway the County takes, investment costs will range from $2,500,000 - $4,500,000 per year through 2030, with larger investments for large-scale building systems required between 2030-2040. Cost savings from those investments will yield between $230,000-$1,600,000 per year, mostly from decreased vehicle fuel use and increased energy efficiency in County buildings. The County will need to update cost estimates every two years to account for changes in markets, incentives, inflation, interest rates, salaries, and other factors.
The investments in many projects will become more costly the longer they are delayed. It will require a commitment from the County to invest up front to realize the GHG reduction benefits that these projects will bring long term. The more investment the County makes up front, the less GHG reductions will need to be invested in over time. Therefore, the County has an opportunity to lead by example and take the necessary steps to use 100% clean energy in all its operations by 2050.
Implementing the REP will also necessitate hiring more staff and providing additional training for existing staff. Managing the projects requires a dedicated staff person. The additional workload and new technical expertise needed for the new systems will likely also require new maintenance staff and training for existing staff.
DURHAM COUNTY RENEWABLE ENERGY PLAN
BASELINE & ENERGY FORECAST
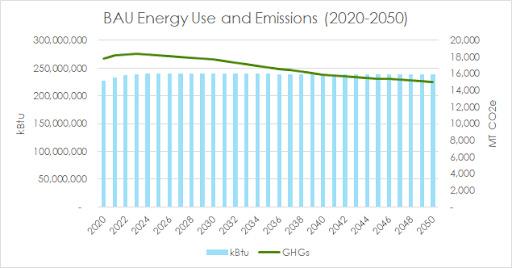
An energy baseline represents the amount of energy (electricity, natural gas, gasoline and diesel) in a baseline year (in this case 2019), and an energy forecast provides a projection of the amount and sources of energy the County would most likely consume through 2050. The baseline and forecast serve as reference points for reduction targets and inform the strategy and action selection process. Figure B outlines an energy forecast considering the County continues to rely solely on the current mix of energy sources. This is referred to as a business-as-usual (BAU) scenario.
The current BAU includes all County owned buildings, fleet vehicles, and energy use at the wastewater treatment facility. Durham County has taken this data and forecasted future energy and fuel use using assumptions based on long-term averages, projections of renewable energy available on the grid, and the County’s planned capital investments. Durham County also calculated escalation rates for energy and fuel pricing, degradation factors of critical buildings systems, and other relevant factors. Future baseline updates can demonstrate progress toward the adopted strategies and assess the effectiveness of County actions. Figure B also shows how, even as projected energy use remains flat, the County’s greenhouse gas emissions reduce slightly over time as the grid’s renewable energy content improves. The increase in energy use and emissions in 2020-2024 represents new load growth as the County adds a small number of new buildings.
British thermal units (Btu) are units of energy equivalent to the amount of heat required to increase the temperature of one pound of water by one degree. By measuring energy use in Btu, it is possible to combine energy from energy, natural gas, and vehicle use into one common metric. kBtu is equivalent to 1,000 Btu.
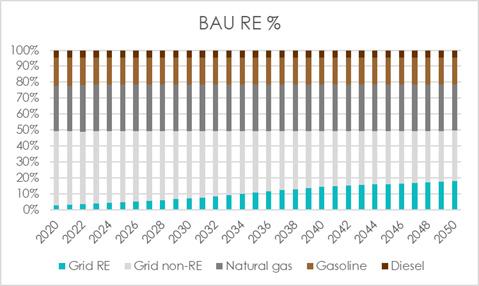
Figure C shows what the County’s renewable energy percentage would be in a BAU scenario. The blue bars along the bottom of the graph represent the projected increase in renewable energy available on the grid. If the County does nothing, the County’s renewable energy (RE) % would be approximately 8% in 2030 and 18% in 2050. The grid RE percentage was based on projections in Duke Energy’s 2020 Climate Report. This forecast has the utility providing 14% RE by 2030 and 36% by 2050. Additional projections of RE available from the grid were modeled based on reports provided by Duke Energy and Duke University, and ranged from 7%-19% in 2030 to 10%-45% in 2050. Ultimately the RE % representing the middle path was chosen.
The transition to renewable energy is a major strategy to meet Durham County’s climate mitigation goals. In 2007, Durham was the first community in North Carolina to develop a Greenhouse Gas Emissions Reduction Plan, committing to reduce GHG emissions 50% by 2030 from the 2005 baseline year in government operations. (It should be noted that, given the poor quality of data sets available from 2005 - 2008, the County uses 2009 as its baseline year.)
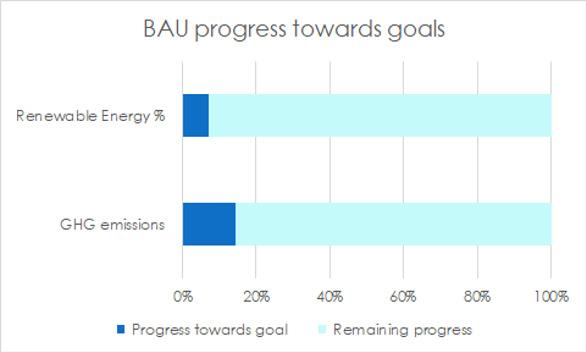
As of 2020, Durham County is 15% toward its goal as shown in Figure D below. In order to reach the goal in the next 9 years, Durham County will need to reduce approximately 940 MTCO2 annually. Switching to renewable resources and increasing energy efficiency are necessary to achieve the remaining emissions reductions and have been factored into the REP planning process. Under a BAU scenario, the County’s GHG emissions would be 17,474 in 2030, 20% short of its goal.
Figure B: BAU Energy Use and Emissions (2020-2050)
Figure C: Renewable Energy Percentage under a BAU approach (2020-2050)
As part of this process, the County reviewed current policies and programs and produced a comprehensive, annotated list of high-impact strategies that could be analyzed and prioritized based on feasibility, financial considerations, health benefits, and equity. In addition, many opportunities and barriers were considered as part of this process.
One key consideration that could accelerate the implementation of the REP is the timing of Duke Energy’s Renewable Energy and Efficiency standard compliance. Under this law, investor-owned utilities in North Carolina are required to meet up to 12.5% of their energy needs through renewable energy resources or energy efficiency measures by 2020 and 36% by 2050. According to Duke Energy’s 2019 Sustainability Report, the utility provided 6.45% renewable energy, generated by solar, wind, and hydroelectric sources. This same report forecasts 90% fossil and nuclear electricity sources by 2030 which are not considered renewable. The primary gap analysis took into consideration the difference between current renewable energy provided by Duke Energy and the amount of renewable electricity generation needed to meet the County’s goal. Recently, Duke Energy set goals for its entire company to be carbon neutral by 2050, which is more aggressive than the law requires. It should be noted that the County’s ability to achieve 100% renewable energy by 2050 is heavily influenced by Duke Energy’s decisions about increasing renewable energy as part of its generation mix.
other renewable energy actions in North carolina
In 2018, North Carolina’s Governor Roy Cooper signed Executive Order No. 80 calling for a 40 percent reduction in statewide greenhouse gas emissions and at least 80,000 zero-emission vehicles by 2025. As part of this commitment, the state set a course to transition away from fossil fuel usage to a more clean and renewable energy economy. As a result of Executive Order 80, the state created a Clean Energy Plan and NC Energy Regulatory Process Report that include many policy options for transforming the electricity sector to encourage more renewables, energy efficiency, and cost effectiveness. The impact of these reports depends on the legislature and Public Utilities Commission’s willingness to adopt laws, regulations, policies, and budgets to enable this transition
key findings:
• Buildings represent the largest component of County energy and emissions
• Powering buildings on clean electricity is one of the most cost-effective ways to reduce emissions
• Adopting clean vehicle technology will have a major impact on reducing transportation emissions
• Regulatory and market barriers will need to be addressed
• Without further action, Durham County will not meet internal renewable energy or greenhouse gas reduction goals and is not aligned with statewide goals or scientific consensus on avoiding the worst impacts of climate change.
STRATEGIES & CONSIDERATIONS
APPROACH POLICY
Policy Green building policy
Fleet purchasing policy
Disaster planning policy
Operations Resolution to commit to 100%
renewable energy
STRATEGIES
Adopt requirements for EV charging installations
Target net zero emissions in all facilities
Eliminate natural gas use in all facilities
Right size the fleet so vehicles are used more efficiently and therefore replaced more frequently, allowing for faster adoption of electric vehicles
Transition to electric or hybrid vehicles
Consider renewable diesel as an option for vehicles that do not have an electric alternative such as ambulances and other heavy equipment
Focus on energy resiliency
Install rooftop solar
Improve Building Energy Management Systems
Increase energy efficiency in buildings and waste water treatment
CONSIDERATIONS
Are there ways to promote Durham County as a leader in the state?
What other local governments are adopting similar policies?
Durham County has committed to reducing greenhouse gas emissions in operations 50% by 2030
Utility Infrastructure Renewable Energy & Efficiency Renewable Portfolio Standard
Financial & Funding Adopt new approaches to financing
Work with Duke Energy and other stakeholders to increase renewable energy generation in the grid mix
Create an internal Green Revolving Fund
Participate in Duke Energy’s Green Source Advantage program
Consider Pilot Projects
Consider Bulk Procurement Strategies
Align Capital Improvement Plan budget
Access third party financing
Build Public Private Partnerships
How many projects can the County implement each year given the allocation of staff and funding?
What are the trade-offs to investing more money upfront versus phasing projects over a longer period of time?
What role do renewable energy credits play in helping the County reach its goal and what type of credits should be considered?
What can the County do to encourage more renewable energy in the generation mix?
How can the County align the budget to the plan?
SUMMARY OF SCENARIOS
The Phased scenario includes 2 rooftop solar investments each year and the Accelerated scenario includes 4 per year. Projects with roof or HVAC replacements already planned for those buildings are scheduled for the year of replacement. Refer again to Figure A. In each scenario, it is assumed that Duke Energy will provide 14% renewable energy to the County by 2030 and 36% by 2050. In the event that this does not occur, Durham County can adjust scenarios to compensate for the lower percentage.
The primary difference between scenarios is when investment occurs, how long the benefits accrue, how much staff time is needed to implement measures beyond current levels, and the rate of return on investments. Implementing projects earlier in the process reduces overall greenhouse gas emissions, accelerates return on investment for projects with savings, and accrues other benefits like improved air quality sooner, but requires more staff time and funding earlier in the process.
PHASED INVESTMENT
The Phased Investment represents the timeline if the County were to follow its existing replacement schedule for boilers and fleet vehicles, as well as two rounds of bulk solar procurement, one in 2023 and one in 2025. See the Bulk Solar section below for more information on bulk solar procurement. This scenario also includes participation in Duke’s Green Source Advantage (GSA) program starting in 2023.
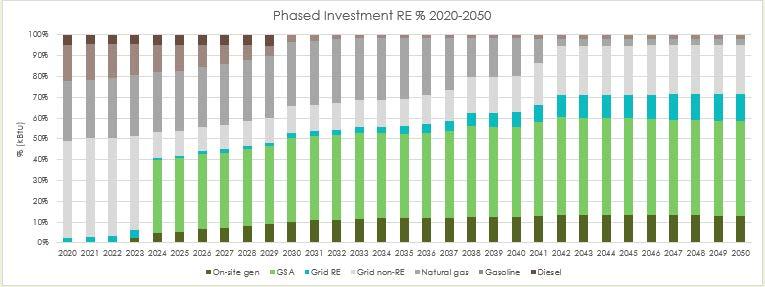
Outlined in Figure E, the Phased Investment scenario would help the County reach 53% renewable energy by 2030, and 72% renewable energy by 2050. This would leave the County 47% short of its 2030 goal and 29% short of its 2050 goal, meaning the County would need to make up the remaining difference by purchasing RECs.
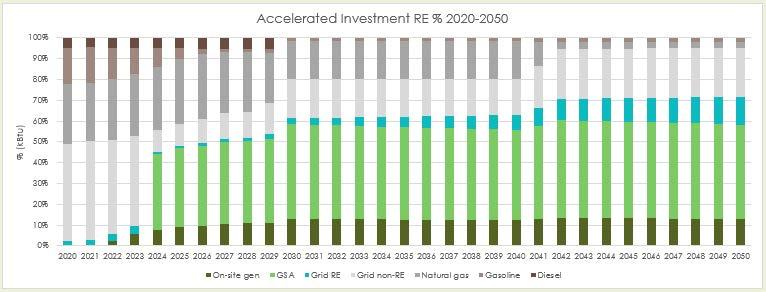
Under this scenario, by 2030 approximately 40% of the County’s energy would come through the Green Source Advantage program, 32% would come from natural gas, 20% from grid-purchased electricity, and a small percentage from on-site solar and gasoline purchases.
Figure E: Renewable Energy Percentage under the Phased Investment Approach (2020-2050)
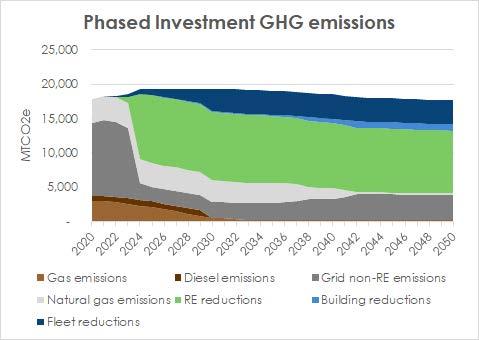
As outlined in Figure F, the Phased Investment scenario would help the County greatly reduce its greenhouse gas emissions. Under this scenario, the County’s GHG levels would be reduced 66% from 2009 levels by 2030. In this scenario, the majority of emission reductions would come from renewable energy projects, followed by fleet projects and building electrification projects. Costs through 2030 would be an estimated $1 million to $3 million per year and $90,000 to $70 million per year through 2044 After that, there is a projected savings of approximately $1 million per year until 2050.Cummulative GHG reductions would be 77,310 MTCO2e by 2030 and 335,016 MTCO2e through 2050.
ACCELERATED INVESTMENT
The Accelerated Investment scenario essentially doubles the pace of investment, with two heat pump projects per year being implemented, an accelerated fleet replacement schedule, and similar to the Phased Investment scenario, two rounds of bulk solar procurements in 2023 and 2025.
As Figure G below shows, the Accelerated scenario would help the County reach 61% renewable energy by 2030 and, similar to the Phased scenario, 72% renewable energy by 2050. As in the Phased scenario, the County would be left to make up the remaining 2030 and 2050 renewable energy gaps through the purchase of RECs. Both the Phased and Accelerated scenarios are also highly influenced by the renewable content of electricity purchased from the grid, meaning advocacy by local and regional stakeholders will play a critical role in helping the County reach its goals.
Under this scenario, gasoline and diesel are phased out more quickly. Natural gas also makes up a small portion of the County’s energy use in this scenario (20% compared to 32% for Phased Investment) due to the more rapid implementation of heat pump projects.
Figure F: Scenario GHG emissions under a Phased Approach
Figure G: Renewable Energy Percentage under the Accelerated Investment Approach (2020-2050)
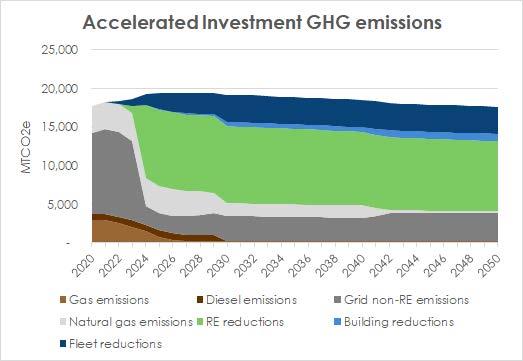
Similar to the Phased Investment scenario, the Accelerated Investment scenario achieves deep reductions in greenhouse gasses emitted by County operations as outlined in Figure H. Under this scenario, the County’s GHG levels would be reduced 77% from 2009 levels by 2030. As in the Phased scenario, the majority of emission reductions come from renewable energy projects, followed by fleet projects and building electrification projects. Investments would range from $1.7 million to $4.8 million per year through 2030 and $2.4 to $7 million through 2050 with several years of net savings projected for the later years. Cummulative GHG reductions would be 88,488 MTCO2e through 2030 and 349,290 MTC02e through 2050.
By pushing up the timeline of building, renewable energy, and fleet investments, the County can get about 16% closer to its 2030 target. One of the advantages of the Accelerated scenario over the Phased scenario is that it leaves less uncertainty in terms of technological, policy, and market factors and places more of the County’s renewable energy percentage in its own hands. The total GHG reduction is larger (14,274 MTCO2e are reduced in the Accelerated scenario compared to the Phased scenario) because starting projects earlier allows for reductions to accumulate over more time.
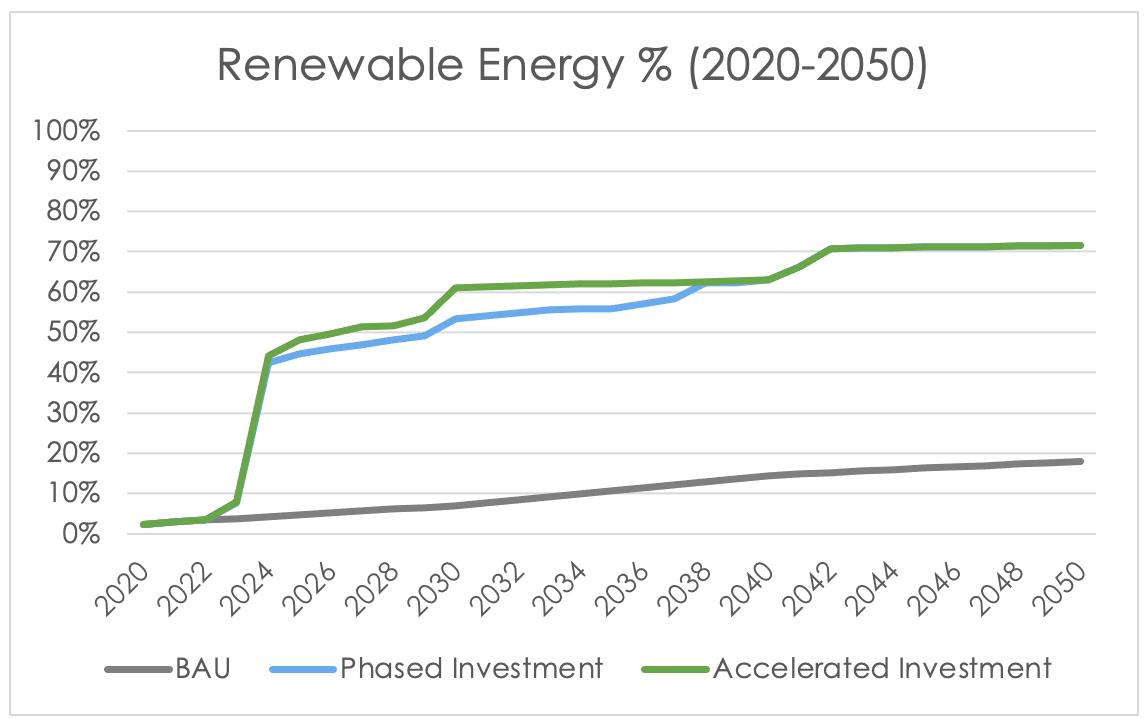
The Figure I below shows the extra gains that can be made through accelerated investment, as well as the point around 2038 when the scenarios converge as all projects have been implemented.
I: Renewable energy percentages under Phased and Accelerated Investment scenarios (only the upper line is displayed in places where scenarios overlap)
Figure H: Scenario GHG emissions under an Accelerated Investment approach (2020-2050)
Figure
HIGH IMPACT SOLAR INVESTMENT
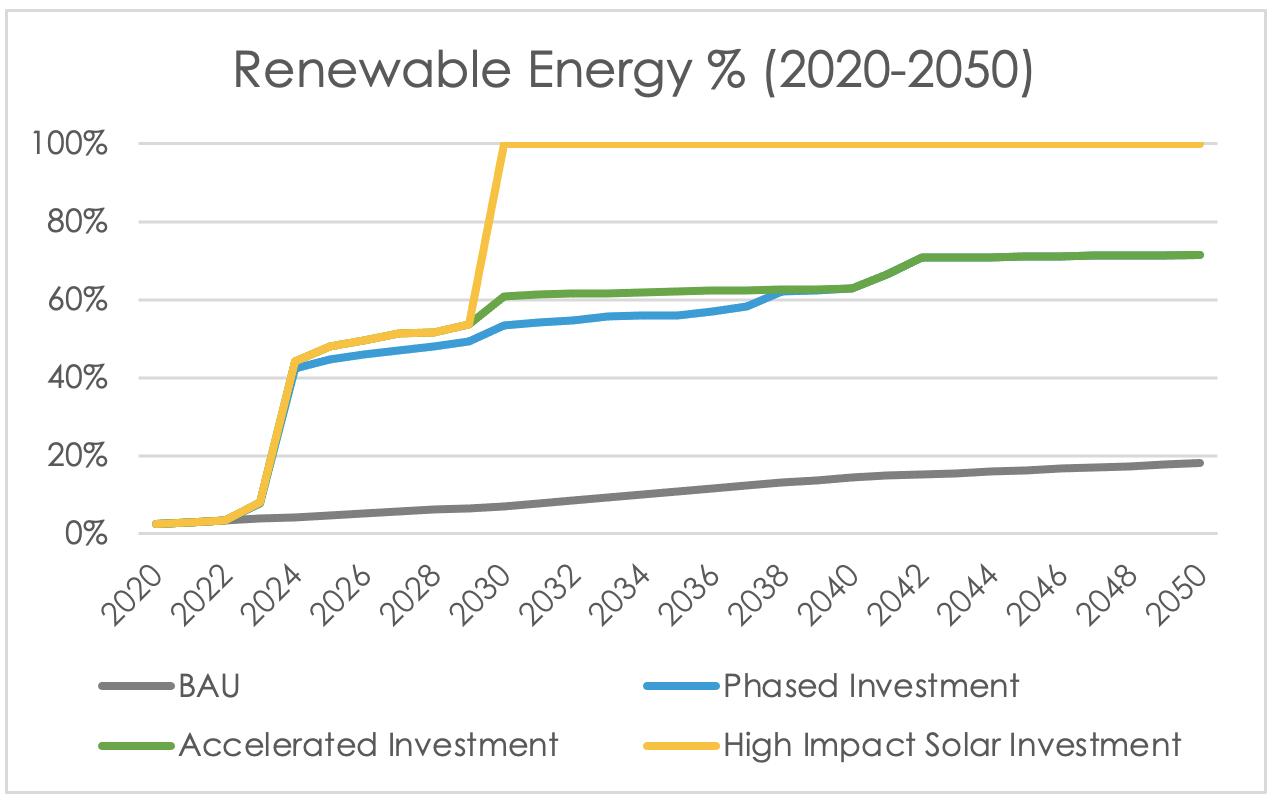
Figure J: Renewable energy percentages under Phased Investment, Accelerated Investment, and High Impact Solar Investment scenarios (only the upper line is displayed in places where scenarios overlap)
The High Impact Solar Investment scenario is the same as the Accelerated scenario, but includes one of four optional approaches (in addition to GSA) to catalyze off-site solar development in support of the County’s goals. The potential approaches include, executing a Virtual Power Purchase Agreement (VPPA), launching a procurement effort for local RECs, developing County land with solar projects via the Sell-All tariff or participating in a Community Solar program. All of these approaches face significant challenges to viability, making it necessary for the County to monitor statewide policy and market developments to determine the best pathway in the mid-term. A VPPA is a financial contract enabling the County to directly support and receive RECs from a solar project outside of North Carolina. Procurement of local RECs refers to a novel program launched by the County in which the County buys RECs from commercial solar projects within its borders. Sell-All solar projects entail development of a large-scale solar project by an outside developer who sells the energy but passes the environmental credits (RECs) onto the County, thereby increasing the County’s renewable energy percentage. Potential Sell-All projects include 3,500 kW of solar at the County Stadium parking lots, and up to 15,091 kW at the County landfill. Finally, Community Solar entails participating in the NC Shared Solar program, or equivalent, run by Duke Energy. For a more detailed description of potential off-site solar development approaches, barriers and challenges, see the following section (Phase 3, Part 2).
Figure J shows that, with the addition of one of the off-site solar projects described above, the County can meet or exceed its 80% by 2030 and 100% by 2050 goals. However, there are currently regulatory barriers impacting this approach, including caps on system size and contract length.
In this scenario, if the County develops the entire potential at the County landfill, the County, starting in 2030, would be generating more RECs than are required to offset non-renewable electricity from the grid.
Investments would range from $1.7 to $5 million through 2030 and $1 to $8 million through 2050. Cumulative GHG emissions would be 97,672 MTCO2e through 2030 and 534,519 MTCO2e through 2050.
Tracking Renewable Energy
Renewable Energy Credits (RECs) are used throughout the country to track the environmental attributes of renewable energy. RECs are most commonly related to renewable electricity, although their application may be expanding to include biogas. Generally, one REC is created for each megawatt hour (MWh) of renewable electricity that is generated. Depending on the organization of a given renewable energy project, the ownership of those RECs will transfer to the project owner or to the entity buying the electricity. Once created, RECs are tracked through various regional databases. In North Carolina, RECs are registered and tracked through the North Carolina Renewable Energy Tracking System (NCRETS).
After RECs are registered, they can then be sold to a new owner or “retired” by a certain entity to prove compliance with a renewable energy goal or policy. Increasingly, RECs have been used by organizations beyond utilities (private companies, local governments) as a means to track progress towards and back-up claims of achieving renewable energy goals . In cases where non-renewable energy is not being directly replaced by energy from a renewable source, Durham County can use RECs to track the amount of renewable energy generated off-site, determine if it is sufficient to offset remaining non-renewable energy and, if it owns those RECs, retire them each year to back-up any claims made by the County that they are using a certain percentage of renewable energy.
It is important to acknowledge that not all RECs are created equally. To understand this, it is necessary to understand the concept of additionality. In the context of renewable energy, additionality describes a situation where an organization’s investment led to new renewable generation being added to the grid. When considering compliance with a renewable energy goal, RECs created from a project that has additionality are preferred because additionality means that those RECs are associated with new renewable electricity. Technically, an organization could purchase RECs generated from an existing renewable energy project located anywhere in the country and claim compliance with a renewable energy goal. However, since those RECs came from a project lacking additionality the impact of achieving that renewable energy goal on reducing carbon emissions can be called into question. When approaching the role of RECs in meeting its renewable energy goals, Durham County prioritized strategies that would create additional RECs and sought to avoid relying on the purchase of existing RECs.
SUMMARY OF INDIVIDUAL STRATEGIES FOR IMPLEMENTATION
Specific details for each strategy allows the County to follow a concrete time frame for strategy completion driven by the feasibility and costs of each action within Durham County. Strategies are designed to align with other County planning documents such as the Local Government Operations Climate Action Plan and the Strategic Plan.
Within each scenario, strategies were first ranked based on Net Present Value and the highest percentage of energy content that can be transitioned away from fossil fuels. A secondary review assigned social and environmental co-benefits to each strategy; the most prominent co-benefits are outlined in Figure K
As the market shifts away from fossil fuels toward 100% renewable energy, it is empowering local jurisdictions to create actionable steps that will lead to cleaner air and a more resilient future. This shift also accelerates new technology and holds utilities accountable for complying with state renewable portfolio standards. By transitioning to renewables, Durham County has more control over its emissions and can use this REP process to ignite interest and influence behavior change throughout the region.
The County has identified three objectives that will help the County reach its renewable energy goal: (1) improve building performance, (2) increase renewable energy generation and (3) increase vehicle fleet efficiency. A careful analysis was conducted and challenges and strategies were considered in order to frame each objective. An objective is defined as an end result or target that provides a broad framework for the County to work within. From these objectives, strategies are then defined as specific actions that will lead to greenhouse gas emissions reductions and renewable energy adoption.
OBJECTIVE 1: IMPROVE BUILDING PERFORMANCE
Reducing total energy use is a key tenant of Durham County’s ability to reach its renewable energy goals. Because the majority of the County’s energy use occurs in buildings (electric and natural gas), improving the performance of those buildings through energy efficiency and building electrification is an important objective required to achieve the County’s goal. It is easier to create renewable electricity than renewable natural gas, therefore, building electrification has the dual impact of reducing energy use and enabling the transition of energy end uses such as heat and hot water to renewable sources.
While the REP does not include an assessment of energy efficiency projects, the County plans to continue identifying and implementing energy efficiency improvements in existing buildings, specifically targeting a long-term reduction in energy use of 20%. Efficiency improvements are a proven and cost-effective method to capture financial benefits and reduce the overall energy load needing to be replaced with renewables. The County has a long history of successful energy efficiency projects. Using its existing processes, the County has identified multiple LED lighting retrofits that, when implemented, will likely result in the County achieving the 20% target, enabling any additional opportunities identified to exceed the goal. The County plans to continue its process of systematic review of existing buildings to identify any remaining energy efficiency projects and future opportunities that may arise. See specific strategy descriptions in Appendix A
STRATEGY
STRATEGY ACTION BENEFITS METRIC TIMELINE LEAD ACTOR
1A Reduce overall energy use by 20% by 2040 through continuous energy efficiency upgrades to lighting and building systems. (This would be additional to the 61% expected savings in energy by installing heat pumps.)
Complete LED lighting upgrades for 50% of County building square footage by 2025 and all facilities by 2030.
Create and implement a Strategic Energy Action Plan to guide increased energy efficiency upgrades.
Integrate new energy efficient equipment and reduction measures for the wastewater treatment and collection system to reduce energy use 10% below 2009 values.
1B Build all new buildings and retrofits to higher standards
1C Develop a Green Revolving Fund
Update High Performance Building Policy to include renewable generation, higher efficiency, and electrification
Identify the department that would manage the budget
Establish accounting principles
1D Continue server virtualization where feasible
1E Target net zero emissions in all facilities
Install heat pumps in 26 County owned buildings
Follow the implementation schedule outlined in the CESA tool
1F Consider Solar thermal heat pumps in County owned buildings as they become costeffective
increase in energy reduction
Eliminate all natural gas as buildings are retrofitted or constructed each year % of renewable energy compared with overall County useage
Research IRS’s EnergyEfficient Commercial Buildings Tax Deduction and other incentives
impact METRICS
with overall County useage
11% Cost Effectiveness of Policy in Dollars Spent per therm reduced
Reduction Potential through 2050 (MtCO2e)
OBJECTIVE 2: INCREASE RENEWABLE ENERGY GENERATION
Within the REP planning process, Durham County explored multiple avenues to increase renewable electricity generation. Given the County’s priority of directly offsetting use of non-renewable energy, the first avenue assessed was the feasibility of installing on-site, net-metered solar photovoltaic (PV) systems. However, there are multiple physical and policy constraints that limit the realistic developable potential of on-site solar. Theoretically, about 35,500 MWh of solar generation would be needed to meet the County’s projected electrical usage in 2050 with 100% renewable energy generated on-site. The results of this analysis indicate that, even in a scenario where the maximum viable potential of 5.6 MW (7,500 MWh annually) of on-site, behind-the-meter solar is developed, renewable generation beyond County facilities will be needed to meet the County’s goal. Due to these constraints, the analysis also explored development pathways for off-site renewable energy projects, specifically several options for utility-scale and commercial solar projects from which Durham County could receive credit for the renewable electricity generated. See specific strategy descriptions in Appendix A
2A Participate in Duke Energy’s Green Source Advantage program
Release a RFP for Services, select a project, sign agreements
Approve budget
2B
Install On-Site rooftop and carport solar projects on 32 County-owned facilities
Complete detail assessment of all County sites identified in this plan in order to finalize site designs and group sites by feasibility.
Pursue a bulk purchasing agreement for all County solar projects and release RFP for Phase 1 procurement of most feasible sites
Approve chosen vendor and budget
Repeat process as needed for future Phases
Percentage of renewable energy compared with overall County usage
Number of local jobs
Percentage of renewable energy compared with overall County usage
Number of local jobs Mid Term Sustainability Office General Services
2C Pursue most feasible off-site solar development pathway (see Appendix A) depending on policy and market changes
Review updates to North Carolina renewable energy policies and markets, as well as County resources, to determine best pathway
Conduct community outreach
Conduct industry outreach (RFI) to determine vendor interest and likelihood of identifying a private partner, depending on chosen pathway
Proceed with chosen pathway
Percentage of renewable energy compared with overall County usage
Number of local jobs
Mid-to-long term
Pursue floating solar PV at the Triangle Waste Water Treatment Plant
Conduct assessment Issue RFP
Select vendor Install system
Percentage of renewable energy compared with overall County usage Short term Engineering &
strategic impact metrics
Percentage Contribution To 100% Renewable Electricity By 2050
Cost Effectiveness of Policy in Dollars Spent per kWh produced
Emissions Reduction Potential through 2050 (MtCO2e)
Durham County has the opportunity to reduce its gasoline and diesel consumption and reduce GHG emissions by investing in electric or hybrid vehicles. Currently, the fleet makes up 23.6% of the County’s overall energy mix by using over 400,000 gallons of fuel annually. The analysis of transitioning the County’s fleet to renewable energy covered three main strategies; (1) streamlining fleet management and operations, (2) fleet electrification and (3) switching to renewable diesel.
To support all of these strategies, it is important to synchronize the management of the County fleet so that fleet purchases can be completed in a manner that meets staff and operational needs while being cost-effective and transitioning to a fully decarbonized fleet. Synchronizing fleet management by improving the breadth and depth of vehicle data collected provides the opportunity for the County to fully consider important vehicle purchasing factors such as the total cost of ownership for an alternative fuel vehicle, whether to buy or lease and whether the vehicle in question even needs to be replaced or whether it can be retired. See specific strategy descriptions in Appendix A
3A Right size and right type the fleet
3B Transition the fleet to electric and hybrid vehicles
Implement a motor pool
Integrate telemetrics and idle-reduction technology into fleet
Set reduction goals for each County department
Replace between 1-44 fleet passenger vehicles (non-sheriff) with hybrid or electric vehicles per year through 2036
Implement energy efficient vehicle purchasing policy
Follow the replacement scheduled outlined in the CESA tool
Annual VMT per vehicle
Parking spaces occupied by fleet vehicles
Money saved Mid Term General Services
MTCO2e/year reduced
Number of hybrid and electric vehicles purchased per year
Percent of fleet that is hybrid and EV
Increased MPG
Increased fuel savings
Savings in fleet maintenance Mid Term General Services
Sustainability Office
3C Increase the number of EV charging stations by between 8-55 ports each year
Align charging infrastructure with vehicle parking areas
Follow the replacement scheduled outlined in the CESA tool
Total # of County-owned EV charging stations
Mid term Sustainability Office
3D Transition to renewable diesel for all diesel fleet vehicles
strategic impact metrics
Research sources of renewable diesel
Work with other NC fleets and the Clean Cities Coalitions to increase supply in NC
Percentage of diesel fuel purchased that is renewable diesel fuel
Emissions reductions Mid Term General Services
Percentage Contribution To 100% Renewable Electricity By 2050
Cost Effectiveness of Policy in Dollars Spent per gallon reduced (combined gasoline and diesel gallons)
Emissions Reduction Potential through 2050 (MtCO2e)
Phased Investment: 20%
Accelerated Investment: 20%
High Impact Solar Investment: 20%
Phased Investment: Approx. $3.90/gallon
Accelerated Investment: Approx. $2.82/ gallon
Phased Investment: Approx. 65,197
Accelerated Investment: Approx. 71,437
High Impact Solar Investment: 71,437
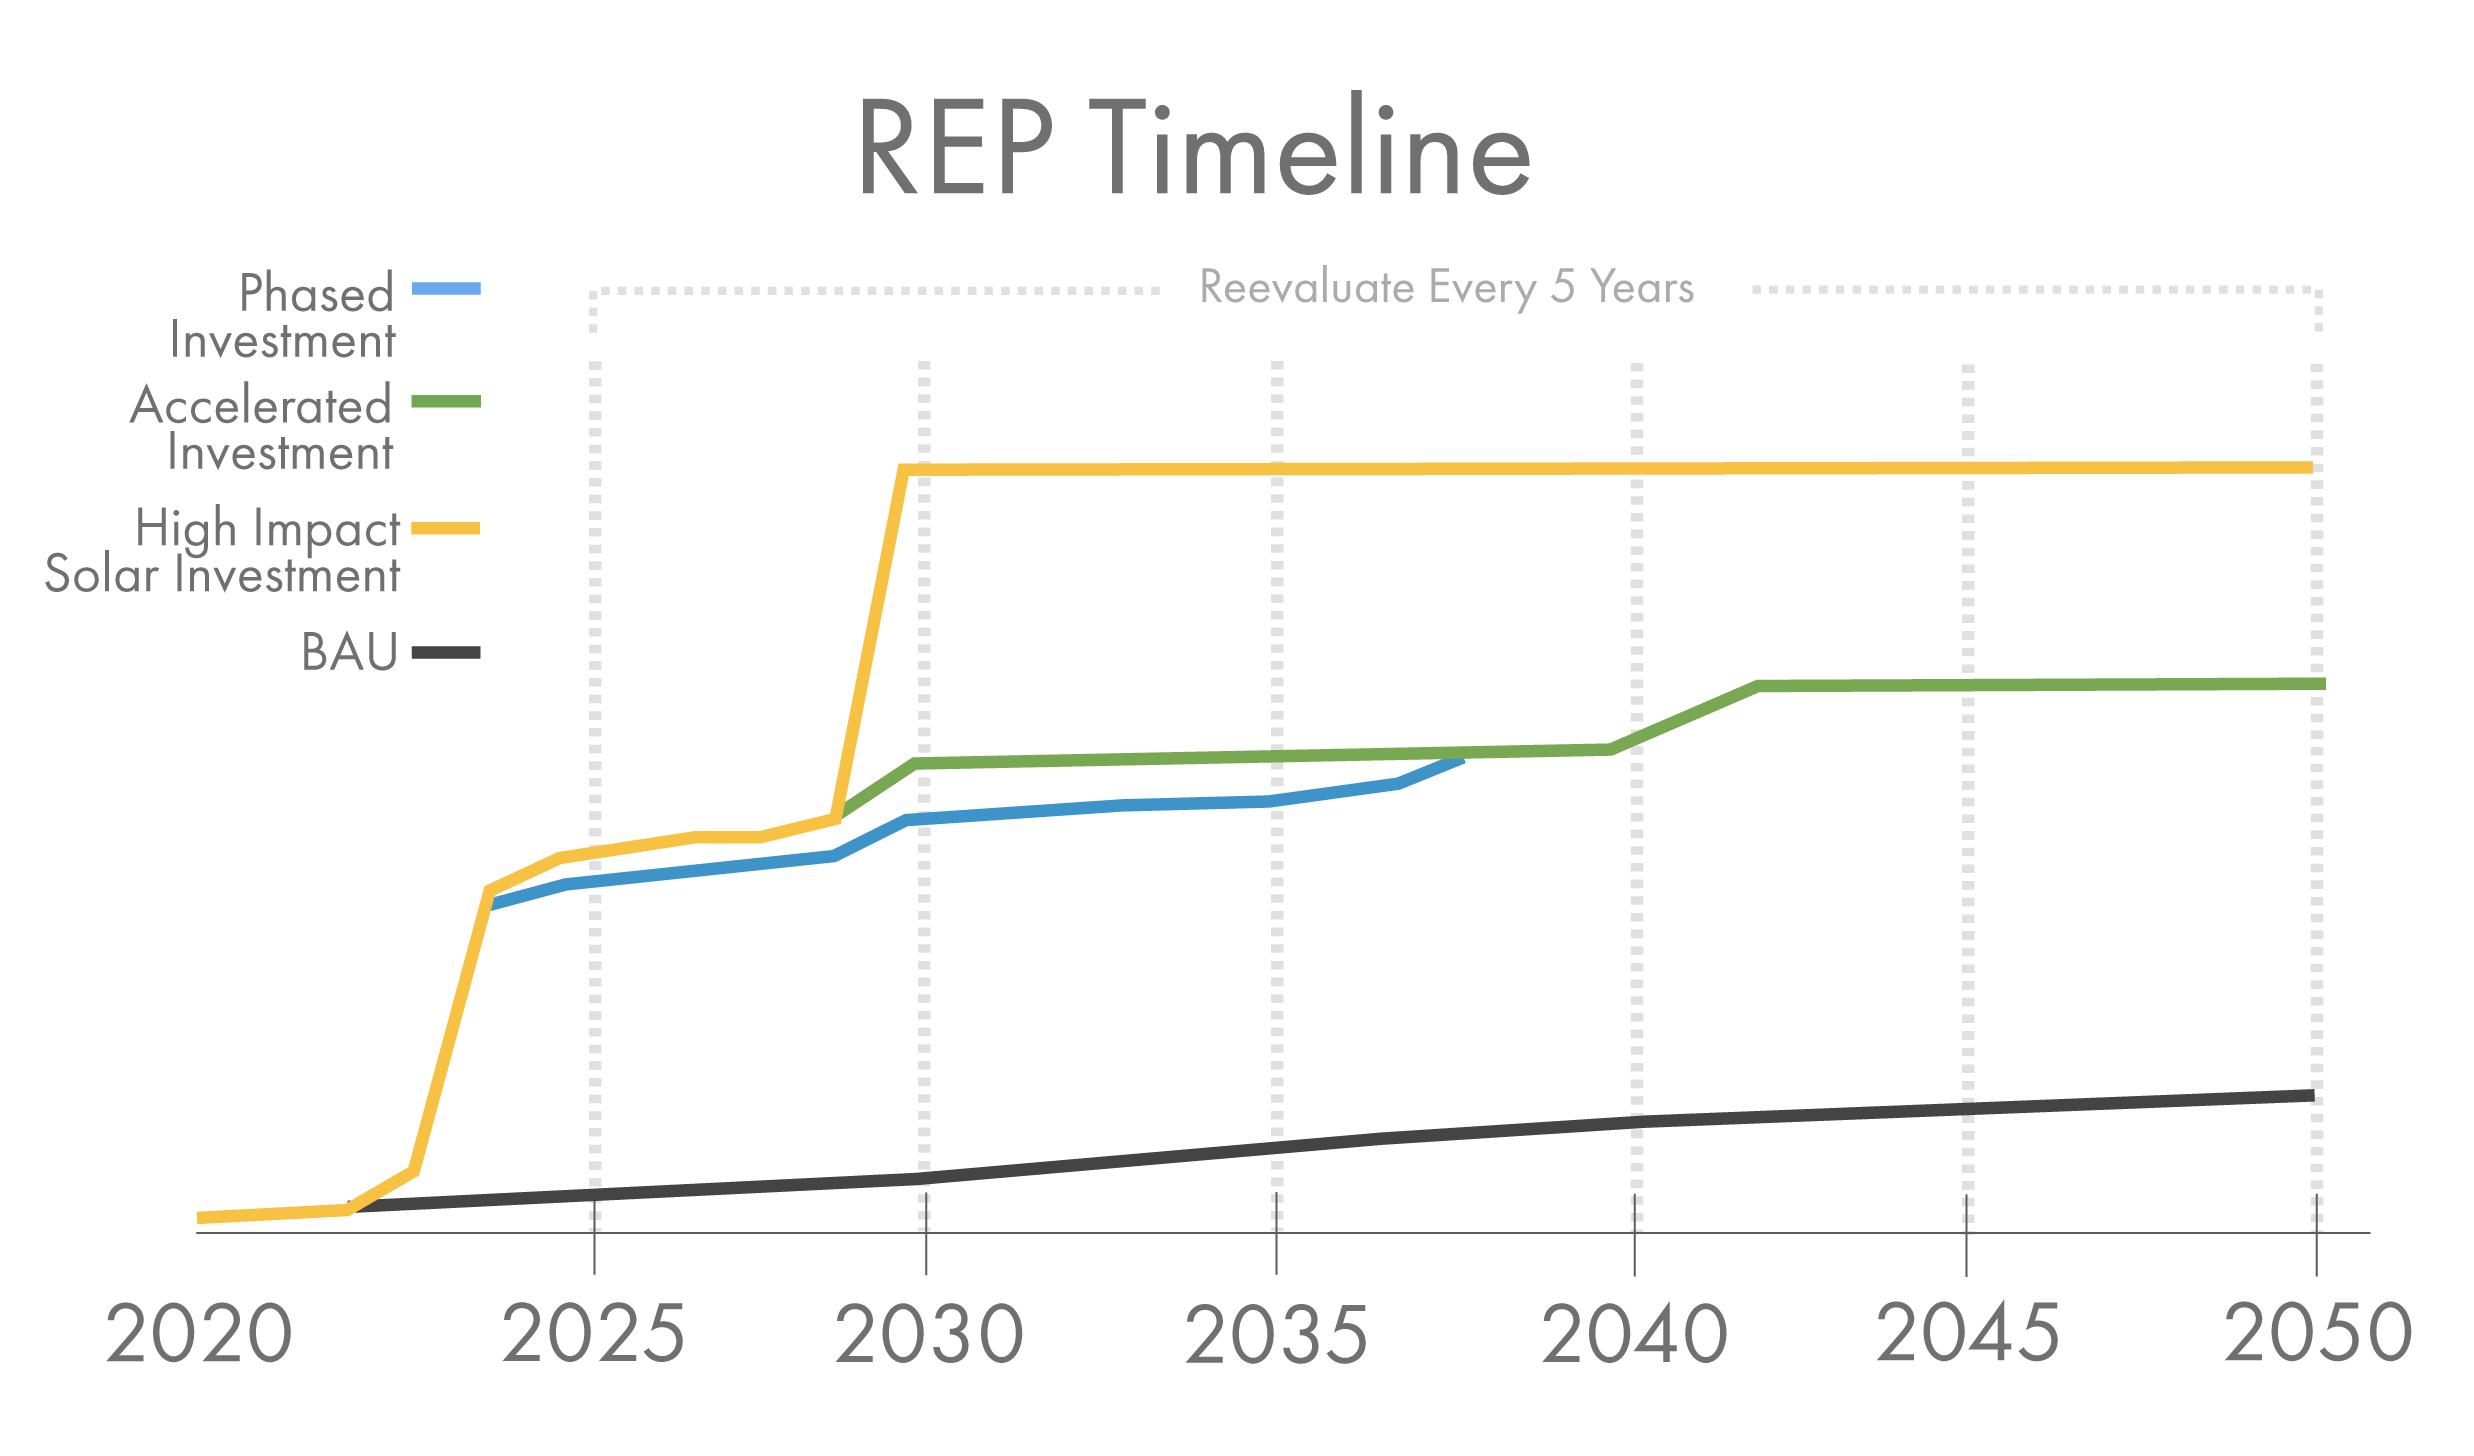
In order to meet the County s renewable energy goals and balance County resources, REP strategies will be implemented through a phased approach. This timeline maps proposed strategy design and implementation periods through 2050, in a manner consistent with achieving the goals set forth by Durham County’s Board of Commissioners. As Figure M demonstrates, the County will need to periodically reassess its progress beginning in 2025. Areas the County will reassess include off-site solar development options (GSA participation, Sell-All, Community Solar, Virtual Power Purchase Agreement and Local REC Purchase Program) the feasibility of renewable generation projects, the renewable percentage available from grid-purchased electricity, availability of EV models and renewable diesel, and technology and market maturities.
Target Metrics
While the County’s renewable energy targets may seem far away, it will require sustained effort to achieve them. Interim target metrics can make it easier to stay on course, and can allow for course corrections over time. Target metrics can also provide transparency and improve monitoring of the REP. To support the County’s path to 80% renewable energy by 2030 and 100% by 2050, the following interim targets are recommended.
Figure M: REP Timeline
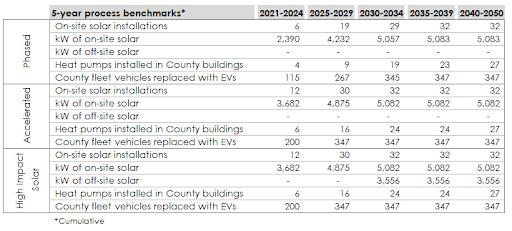
Table C: Targets matrix
The County will update these metrics as the technologies included in this plan, like solar PV panels and electric vehicles, improve, and as emerging technologies like biofuels become more feasible. As these metrics are updated, the County will report out on progress to key stakeholders and the larger community.
Funding
In order to fund building electrification projects, Durham County’s first recourse should be to target projects through their existing capital improvement budget. Heat pump systems could be bundled with projects in other buildings or even in the same building, and can be done in phases (see Vancouver example, page 17) to spread out the capital required. The County or its contractors should take advantage of Duke Energy’s Smart $aver Business rebates for heat pumps and the IRS’s Energy-Efficient Commercial Buildings Tax Deduction and other incentives to the greatest extent possible.
The County could establish a Green Revolving Fund (GRF), which is an internal fund that provides financing to implement energy efficiency and renewable energy projects that generate cost savings. These savings are tracked and used to replenish the fund for the next round of investments, thus establishing a sustainable funding cycle while cutting operating costs and reducing environmental impact. Another use of these funds would be to cover expected increases in operating budget resulting in participating in the GSA program.
For on-site solar projects, a bulk procurement process is recommended to align all 32 solar projects under a small number of contracts. Given the variation in site feasibility, the County would likely complete multiple phases of bulk procurement. Generally, this approach would provide economies of scale savings across the portfolio of projects and enable a larger number of sites to be developed by pairing projects that have quicker paybacks with projects that have slower paybacks in order to create a cost-effective portfolio of sites. All 32 on-site solar projects identified in this REP will be located on County owned facilities, providing the County direct control over financing. It is also recommended that the County look for other public agencies to partner with, such as the City of Durham and Durham Public Schools, to further reduce costs by including additional sites where on-site solar projects are cost-effective . This collaborative procurement model proved successful in Buncombe County, NC, offering them the equivalent to a 0% interest loan and a reduced price per kW.
Financial Calculations
Financial calculations are performed within CESA by accounting for a number of costs and cost savings. A summary of cost and savings considerations for each strategy area is listed below.
Building Projects:
• Costs of installing heat pumps
• Financing payments (if any)
• Costs from additional electricity use
• Cost savings from avoided natural gas purchases
Renewable Energy Projects:
• Costs of installing solar panels
• Financing payments (if any)
• O&M costs
• Cost savings from avoided grid electricity purchases
Fleet Projects:
• Marginal costs of EV purchases (as compared to fossil fuel alternatives)
• Costs of electric vehicle charging infrastructure
• Costs from additional electricity use from EV charging
• Additional (marginal) cost of renewable diesel fuel
• Cost savings from avoided gasoline and diesel purchases
• Operation & Maintenance (O&M) savings
While marginal costs were used to calculate Net Present Value (NPV) for fleet projects, this calculation was not possible for heat pump projects. Therefore, when factoring costs of HVAC equipment into the County’s decision-making process, the actual financial considerations may be more favorable than presented here. Rooftop solar projects have no marginal cost considerations because they are not replacing another type of equipment.
D: Financial results
Net Present Value (NPV) is the value in present-day dollars of a series of cash flows over a period of time, and is a common metric to evaluate different investments. By using NPV to evaluate different options, the County can determine the most cost-effective pathway to achieving its renewable energy targets.
Budget
Table D displays the NPV for the two core scenarios and three supplementary scenarios. The NPVs are further broken down by strategy area (Buildings, Renewable Energy, and Fleet). Some takeaways from this analysis are that (1) the NPV and the County’s progress towards its RE goals are heavily influenced by the timing of investments, (2) fleet projects are generally revenue-positive, and (3) many on-site solar projects are cost-effective. As explained in the Financial Calculations section, costs for fleet projects are calculated using the marginal cost of electric vehicles compared to fossil fuel vehicles, whereas renewable energy projects and heat pump projects were calculated using base implementation costs.
Table D: Financial results
Near-term Actions Budget
In order to align with the County’s ongoing budget process, the Near-Term Actions Budgets presented in Figures N-P outline the additional budget needs required to complete REP implementation through 2050. Under this scenario, it’s assumed that capital purchases fall between July-Dec of 2022 to align with the County’s fiscal year schedule. Note that these implementation costs do not include ongoing personnel costs to perform routine operations and maintenance activities.
It should also be noted that this investment would replace at least one planned HVAC project the County would already do, meaning the marginal cost to the County would be less than presented here. The fiscal year 2024 budget request of approximately $3.4 million for the Accelerated Investment scenario represents approximately 6% of the FY 2023-24 capital budget. The following charts display annual implementation costs, as well as renewable energy percentages and
Table
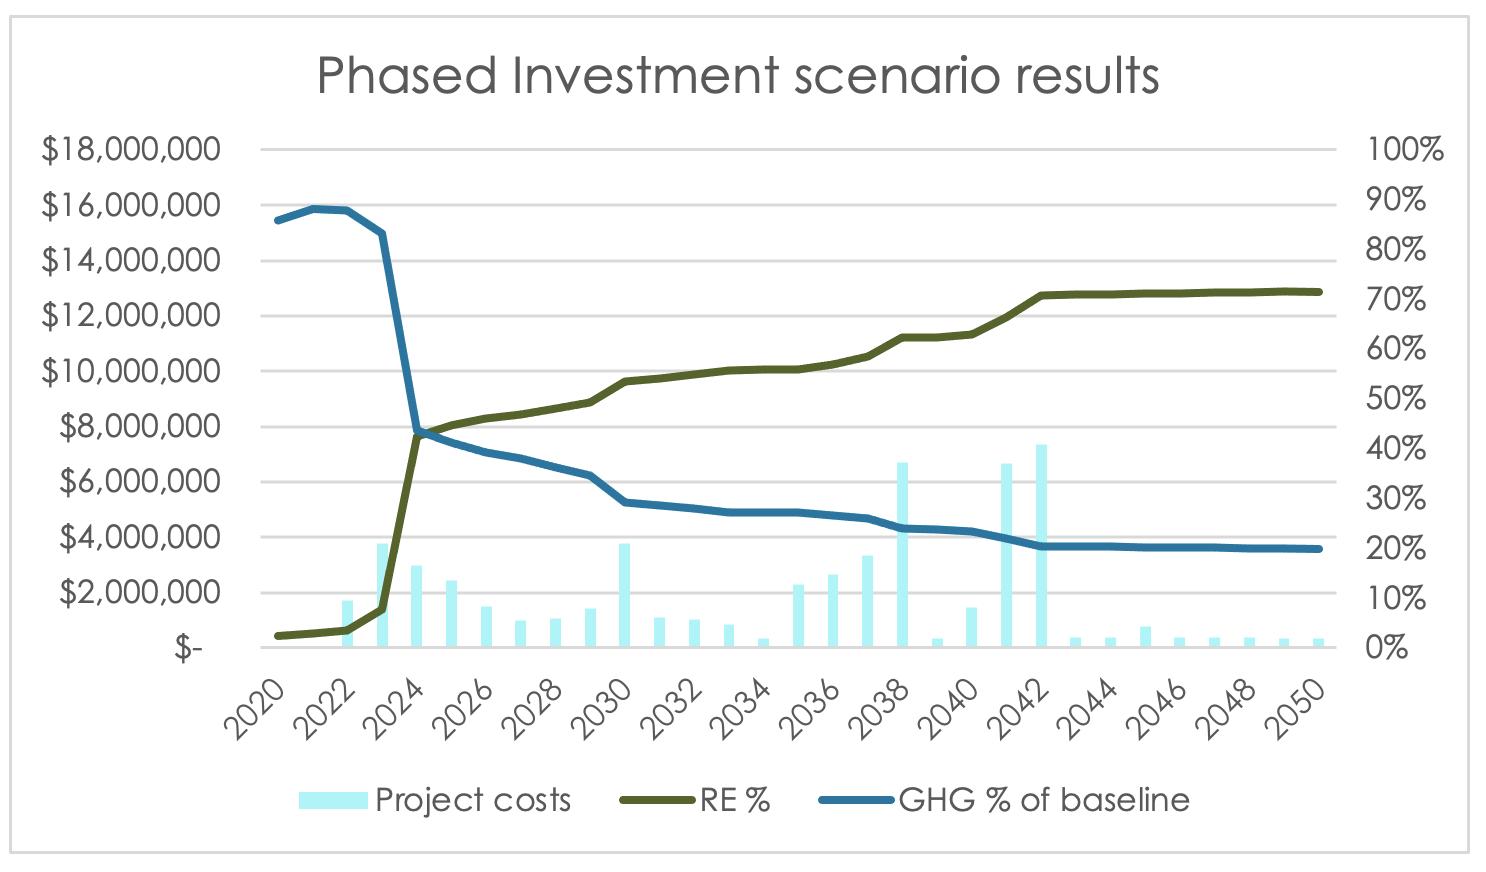
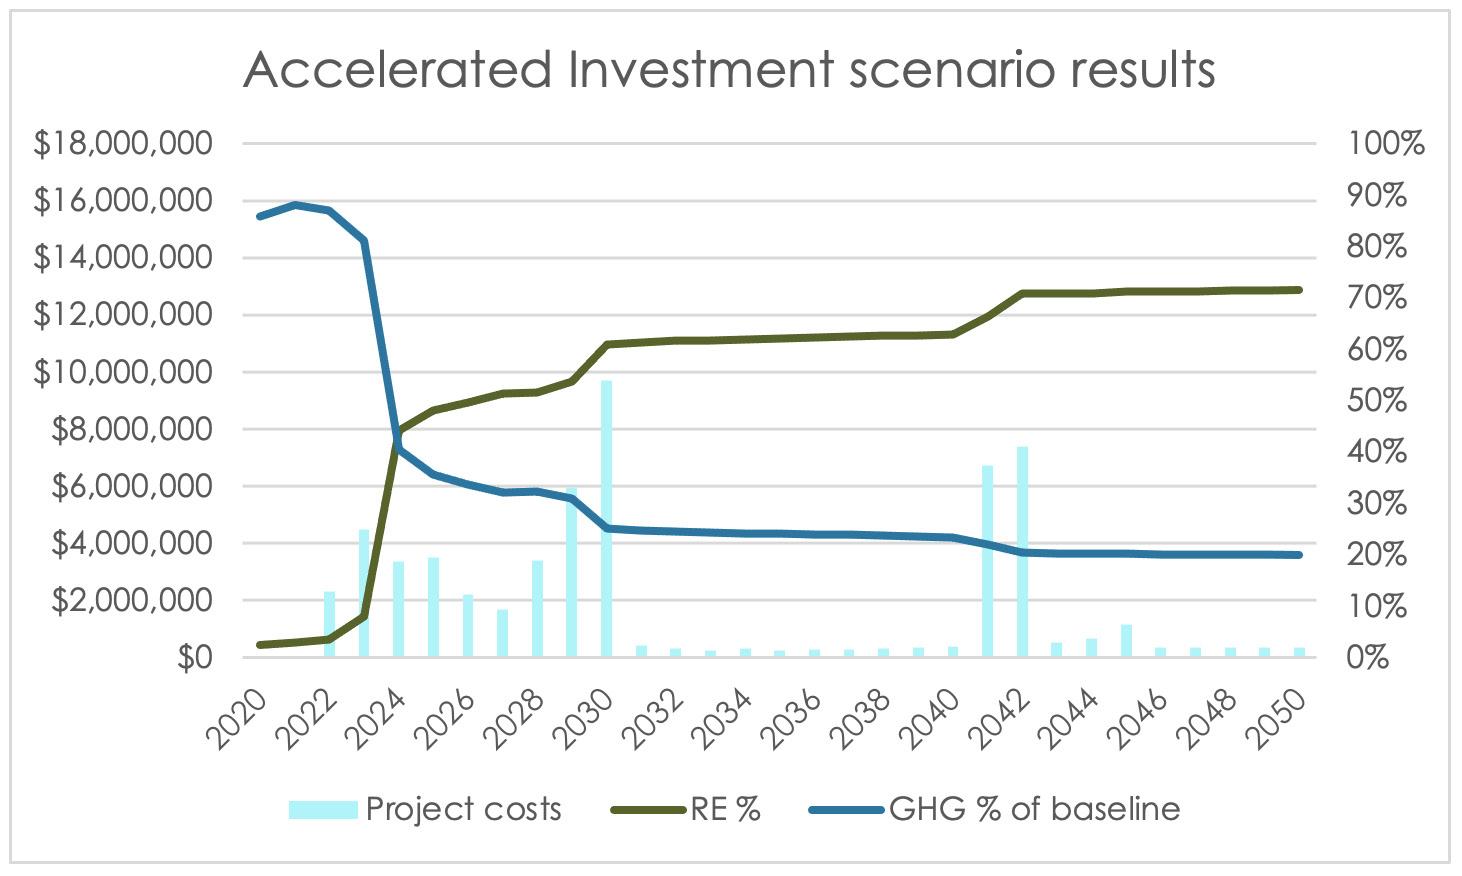
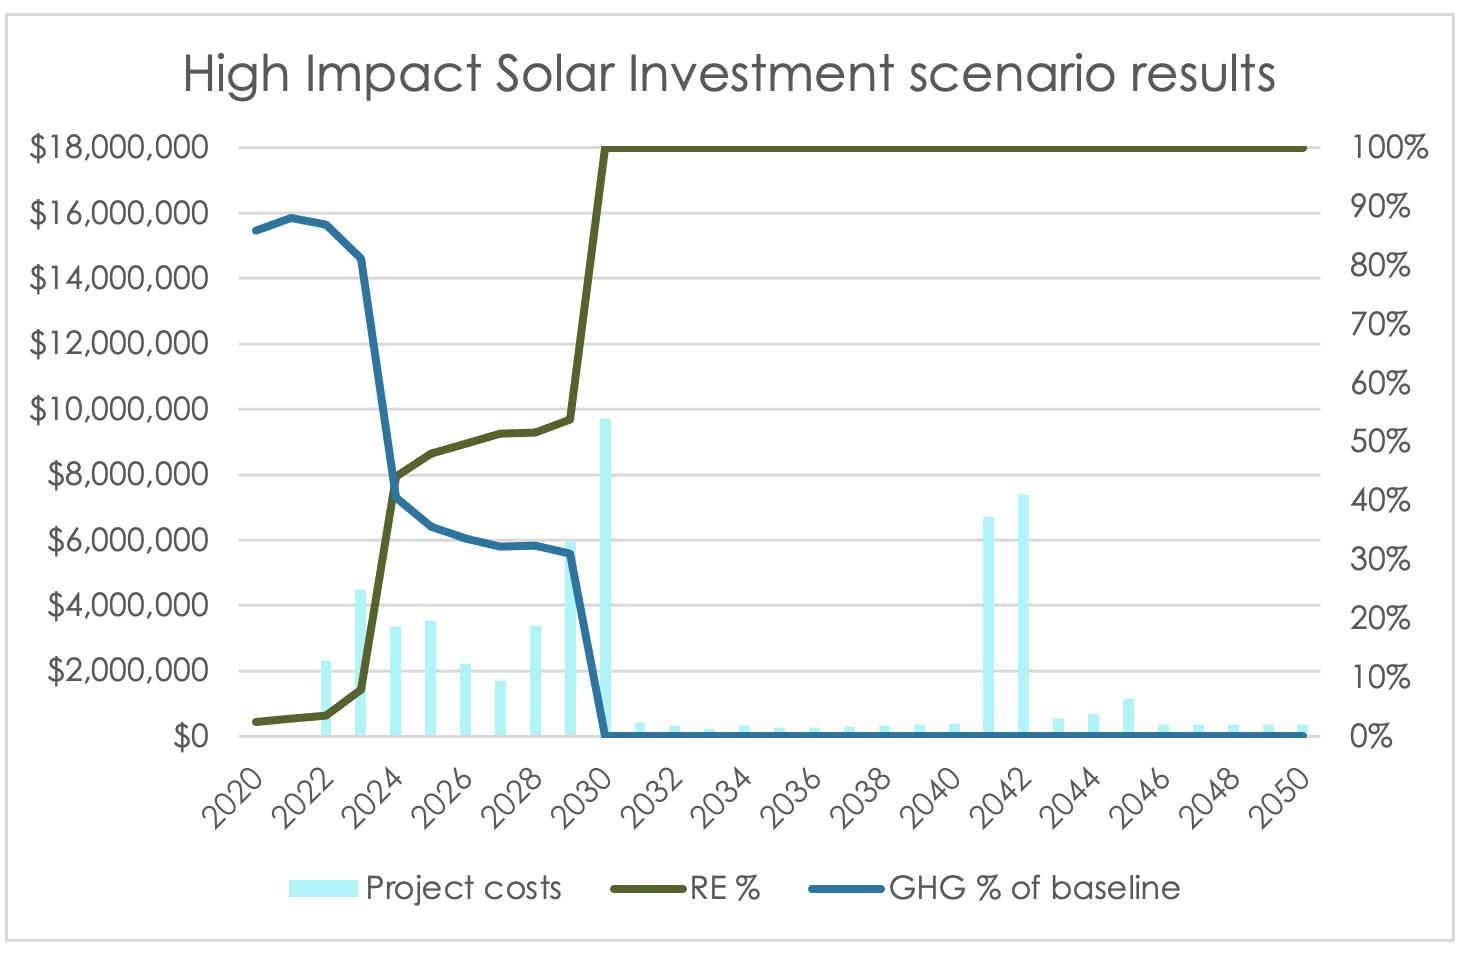
greenhouse gas emissions for each of the three scenarios. The left-hand axes represent the value of yearly investments, and the right-hand axes represent percentages for both renewable energy used by the County and greenhouse gases as a percentage of baseline emissions.
Figure N represents the costs and benefits associated with the Phased Investment scenario. Under this scenario, the County would reach 54% renewable energy in 2030 and 72% in 2050, leaving the County to make up the difference Greenhouse gas levels would achieve a 70% reduction from baseline levels by 2030. The years with the largest capital investments would be 2038 ($6.7 million), 2041 ($6 7 million), and 2042 ($7.4 million). For all scenarios, the largest capital outlays are associated with large-scale heat pump projects. Although not known at this time, the marginal cost of heat pumps compared to standard HVAC system replacement should be taken into consideration in capital budgeting decisions.
Figure O represents the costs and benefits associated with the Accelerated Investment scenario. Under this scenario, the County would reach 62% renewable energy in 2030 and 72% in 2050, again leaving the County to make up the difference through purchasing RECs. Greenhouse gas levels would achieve a 76% reduction from baseline levels by 2030. The years with the largest capital investments would be 2030 ($9.7 million), 2041 ($6 7 million), and 2042 ($7.4million).
Figure P represents the costs and benefits associated with the High Impact Solar Investment scenario. Under this scenario, the County would reach 100% renewable energy in 2030 and remain at 100% in 2050. The County would eliminate all greenhouse gas emissions (either directly or through retirement of RECs) by 2030. As with the Accelerated Investment scenario, the years with
Figure N: Phased Investment scenario results
Figure O: Accelerated Investment scenario results
the largest capital investments would be 2030 ($9 7 million), 2041 ($6 7 million), and 2042 ($7.4 million).
P: Aggressive + Sell-All scenario results
Figure
summary
As this plan has noted, the County has some flexibility in the way it approaches its 2030 and 2050 renewable energy goals. It is possible to adjust the years different projects are implemented based on the County’s budget. However, delaying action too long increases uncertainty and leaves more up to chance, risking not reaching the 2030 and 2050 targets. In this way, the recommendations in this plan are really an all-of-the-above approach that should be considered as building blocks starting in the near-term.
100% renewable energy won’t happen by itself. Work will be needed in terms of financial investment, staff time, and community engagement. It is recommended that the County take action by investing in on-site solar and installing energy-efficient heat pumps at County facilities, replacing fleet vehicles with electric and biofuel alternatives, and taking advantage of Green Source Advantage and other programs available through Duke Energy.
As the plan is implemented, it is recommended that the County periodically reassess the feasibility of other renewable energy resources like biogas and biofuels, battery storage, and other resources.
Even with the County’s best efforts, the goals of this plan will require help from government and utility partners. Therefore, it is recommended that the County stay engaged with these stakeholders and clearly articulate the need for their support.
The County is demonstrating leadership by developing this REP, and strongly believes that with commitment from local leaders, community partners, and strong government action, the County can achieve its goal of fueling operations with 80% renewable energy by 2030 and 100% by 2050.
APPENDIX A: STRATEGY DESCRIPTIONS
OBJECTIVE 1: IMPROVE BUILDING PERFORMANCE
Building electrification is the process of converting non-electric (usually gas or oil), energy-intensive processes in a building into electric equivalents. In the case of commercial and municipal buildings, these non-electric end-uses tend to be boilers or furnaces used for space heating and domestic hot water heating. While the carbon intensity of electricity varies by region, electric heat pumps tend to have lower carbon emissions per unit of heating delivered than their fossil fuelconsuming counterparts.3 In Durham specifically, electric heating is already less carbon intensive than gas-fired heating and will tend to get cleaner as time goes on, as Duke Energy increases carbon free electricity generation and the County adds on-site solar. Thus, by electrifying the heating loads across facilities Durham County can immediately reduce their carbon footprint and create a pathway to achieve its renewable energy goals as the renewable content of electricity used in County facilities increases. Retrofit costs vary from building to building, depending mostly on the type of system installed, changes needed to ductwork, and upgrades needed for the buildings’ electrical panels and main switchgear.4
Strategies
Heat Pump Installation
Heat pumps move heat using refrigerants rather than release it through combustion. This makes heat pumps highly efficient - about 300-400% more efficient on average than traditional fossil-fuel fired HVAC systems (e.g. boilers) for a middle-of-the-line building heat pump.5 This means that for every 1 unit of energy used, the heat pump will deliver 3-4x that amount in heating. Although this efficiency varies with the temperature difference between the interior of the building and its heat source, it typically remains above 200%. A further benefit to heat pumps is that they do a better job at dehumidifying air compared to standard air conditioners, leading to greater comfort in the cooling season.6
CASE STUDY: MUNICIPAL BUILDING ELECTRIFICATION
Durham County is already planning to install a ground source heat pump as part of the new Youth Home in order to meet the County’s 2008 High Performance Building Policy and decrease energy costs and emissions. This system will provide reliable, inexpensive heating/cooling for many years to come, with the pump itself likely lasting 20+ years and the underground pipework likely lasting ~50 years. While the new Youth Home will use a ground source heat pump, this likely won’t be an attractive option for buildings electrified through a retrofit. For these buildings, air source heat pumps are the more likely the answer. To find an example of other large municipal building HVAC systems being electrified in mild climates similar to North Carolina, we look to Vancouver, Canada (average yearly low of 37 °F). The City of Vancouver’s City Hall, which at a floor area of 152,000 ft2 and 12 story height is of a similar size to Durham County’s own Admin II building, is entering the final phase of its heat pump retrofit project as part of its plan to reach 100% renewable energy and zero emissions by 2040. By the end of the project, the air source heat pump and related systems will provide 100% of space heating and Domestic Hot Water (DHW) preheat throughout the year, with an expected GHG emissions decrease of 91%, or 201 tCO2e/yr.
In HVAC applications, heat pumps come in many different configurations to meet different project constraints. The biggest variation is the source with which the system exchanges heat: air, water, or ground. Of the three, air-source heat pumps (ASHPs) have lower and more variable efficiencies since their heat source varies in temperature with the weather but, all else equal, tend to be the least expensive systems.7 Water-source heat pumps (WSHPs) typically have higher efficiencies than ASHPs at a slightly higher price point, but they need a large water source nearby and thus are often not an option.8 Ground-source heat pumps (GSHPs), also known as geothermal systems, use pipes to draw heat from the ground, where temperature varies little throughout the year and is nearly constant on a daily scale.9 This allows GSHPs to operate in much colder climates than ASHPs but adds a great deal to upfront cost. The increased efficiency of both WSHPs and GSHPs, about 25-50% higher than ASHPs, can improve return on investment, but this benefit depends on the local climate.10 In Durham County specifically, the efficiency
increase of WSHPs and GSHPs would likely see about a 10-20% average increase during the heating season compared to ASHPs, though this will depend on the specific models compared.11
Solar Thermal & Hybrid Solar
Solar thermal is technology that captures thermal energy from the sun, usually to perform water heating, and represents a renewable source of thermal energy. Installed in combination with solar photovoltaic (PV), a hybrid PV/T solar system can generate electricity and capture excess heat for use. Depending on weather conditions and heating demand, electrification of heating loads can result in significant increases in electricity use. Beyond cost, added electricity load increases the difficulty of achieving the County’s goal because, based on Duke Energy’s resource mix, a portion of the electricity on the grid will come from non-renewable sources. Hybrid solar can help to mitigate increases in electricity load by using thermal energy from the sun to increase heat pump efficiency.
While the hybrid solar systems modeled had measurable emissions reductions benefits, the increased cost of the systems did not result in significant enough additional progress towards the County’s goals to warrant inclusion in the core scenarios. The inclusion of hybrid solar heat pumps on all building projects results in an approximately 1% increase in 2030 and 2050 renewable energy percentages compared to the Aggressive Investment base case. As solar heat pump retrofits and solar PV system installations happen on County facilities and as technology improves and prices come down, County staff should reassess the potential for a hybrid PV and thermal solar system on a case by case basis.
Analysis
In order to inform Durham County’s building electrification strategy, a heat pump sizing analysis was conducted for each building in the County’s portfolio to estimate appropriate Air Source Heat Pump (ASHP) sizes that would meet each building’s heating needs. Cooling needs were not directly considered because heat pumps are more effective in cooling mode than in heating mode and systems sized for heating are expected to be sufficient to meet cooling demand. Durham is in a climate zone where heating demand dominates, with an average of about 1100 more heating-degree-days (HDDs) than cooling-degree-days (CDDs) per year over the last four years. As the global climate continues to warm, CDDs may reach parity with or exceed HDDs, with about 600 more CDDs than HDDs if local temperatures rise by an average of 5°F. In the event that CDDs overtake HDDs due to a warming climate, buildings with heat pumps will be well-positioned to decrease their total energy usage for HVAC needs because heat pumps are more efficient at cooling.
To assess the role that solar thermal could play in increasing heat pump efficiency, solar thermal energy production potential was estimated as a proportion of electric energy generation at each site. A recommendation for installing solar thermal collectors was then made based on the ratio of thermal energy potential to annual heating needs. Solar thermal costs were estimated at a $/kW rate based on how much of the PV array would have thermal collectors installed on it.
Heating and Cooling Degree Days
A degree-day is a measure of the difference between the average ambient temperature on a given day and a specified set point temperature governing heating/cooling of a building. For calculation of degree-days, this set point temperature is traditionally assumed to be 65 F, since most occupied buildings aim for 70 F inside and must account for extra heating from the equipment and people. For every one degree Fahrenheit below the set point, a Heating Degree-Day (HDD) is incurred; conversely for every one degree above the set point, a Cooling Degree-Day (CDD) is incurred. Thus, on day when the temperature is five degrees below the set point, five HDDs are incurred. A geographical area in which there are more HDDs than CDDs over a whole year is said to be heating-dominated, whereas an area with more CDDs than HDDs is said to be cooling-dominated.
Challenges
Across Durham County’s portfolio of buildings, building size will play a large role in the size and number of heat pump systems needed to meet heating demand. Small or historic buildings may lack ducting and thus require the use of split heat pumps, which place the air handler inside of the targeted room and put the condenser outside. These systems provide on-demand heating/cooling to each room but cost more per heating/cooling delivered. On the other side of
the size spectrum, in large buildings such as Admin II or the Courthouse heat pumps require more time to reach their setpoint during the heating season because their efficiencies fall with outdoor temperature (and in the cooling season due to outdoor humidity). One strategy for mitigating these downsides is to employ a Dedicated Outdoor Air System (DOAS), which dehumidifies the outside air before passing it through the heat pump and then ducts, leading to higher heat pump efficiencies, net energy savings, and greater thermal comfort. DOAS add some capital costs to the project, but often increase return on investment in buildings such as these.
While heat pumps are generally mature and proven technology, there are still some recent innovations that improve comfort and may improve the long-term economics of the system. Variable Refrigerant Flow (VRF) heat pumps paired with desuperheaters operate more efficiently than standard on/off systems, which typically improve return on investment. Some other features that improve operational comfort and may slightly improve efficiency are: Zone Control Systems, Variable Speed Fan Motors, and Scroll Compressors. County staff should continue to research new technologies as they arise to assess the benefits and costs of including them in this strategy.
OBJECTIVE 2: INCREASE RENEWABLE ENERGY GENERATION
Strategies
On-Site Solar (Net-Metered Projects) Where technically and economically feasible, Durham County can install solar PV systems on County facilities to directly replace grid electricity with 100% renewable electricity. Solar systems installed on County facilities on the customer side of the meter are eligible for net energy metering (NEM) through Duke Energy. Under the NEM rules in place at the time of writing, customers receive a credit at the full retail rate that they pay for electricity for all energy generated by their solar system and exported to the grid. This credit is applied to their electricity bill and reduces costs. Receiving credit under NEM is the most financially beneficial interconnection arrangement for solar that the County can access. While commercial electricity rates in North Carolina are lower than elsewhere in the country (40th most expensive commercial electricity in 2019),14 reducing the value of solar, all on-site solar projects analyzed have a positive NPV if funded via a cash purchase. In total, 36 potential NEM solar projects were identified. Table A summarizes the top ten solar projects identified by highest NPV.
One way to drive down costs of solar and further improve the financial benefits of a project is to pursue bulk purchasing. Bulk purchasing refers to a solar procurement strategy that aggregates projects across multiple facilities in an organization’s portfolio, or even facilities across multiple agencies, to create economies of scale that reduce project costs. This strategy requires increased coordination and staff time prior to procurement compared to a site-by-site approach, but the cost benefits can be significant. Additionally, this strategy results in faster solar development which can help the County reach its near-term renewable energy goals. Recently, Buncombe County, the City of Asheville, Buncombe County Schools, Asheville CIty Schools and Asheville -Buncombe Tech partnered on a bulk purchasing strategy for a total of 7MW of solar across the organization’s combined facility portfolio. The vendor bid resulting from the effort was about $450,000 less than expected.15 More importantly, the resulting portfolio-wide cost of about $1.50 per watt is cheaper than the 20th percentile of national small and large non-residential solar project costs.16
Given proposed updates to Duke Energy’s NEM rules in South Carolina, it is expected that the NEM rules in North Carolina will change within the next 2-5 years. The updated NEM rules are likely to change the procedure for how NEM credits are applied to customers’ accounts, shifting from the current system where excess credits (i.e. solar generation beyond the building usage) roll over each month before any extra credits are zeroed out at the end of the year to a new system where credits do not roll-over monthly and all excess solar generation in each month is credited at a lower rate. Initial modeling has indicated that these changes, if implemented, will not have a significant impact on the financial value of Durham County’s solar projects due to the load profiles of the buildings where solar is likely to be installed.
15 Buncombe County Office of Sustainability Presentation. Presented by Jeremiah LeRoy on July 21, 2020.
16 System cost percentiles from Distributed Solar 2020 Data Update published by Lawrence Berkeley National Labs : https://emp.lbl. gov/tracking-the-sun
[2] Ryan Shea and Stephen Abbott, A Local Government’s Guide to Off-Site Renewable PPA Risk Mitigation, Rocky Mountain Institute, 2020, https://rmi.org/ insight/local-governments-guide-off-site-renewableppa-risk-mitigation.
A final factor influencing the feasibility of developing on-site solar is the availability of solar rebates provided on a $/ watt basis by Duke Energy through the “NC Solar Rebate Program”. Rebates for commercial customers have declined in recent years and, as of the Summer 2021 rebate application window, were 30 cents per watt with a cap of $30,000 per project17. While not extremely lucrative, this incentive money can play an important role in making on-site solar projects cost-effective. For example, in the solar procurement implemented by Buncombe County discussed above, Duke Energy rebates were used to cover the cost of capital associated with the bonds used to fund the project. It is important to note, however, that this rebate program is scheduled to expire at the end of 2022, adding a level of urgency for the County to implement solar projects prior to that date in order to capture the external funding.
Resilience & Battery Storage
Because energy storage does not contribute additional renewable generation, the role of batteries and other storage technologies was not analyzed in detail. However, when paired with onsite renewable generation such as solar, energy storage can provide valuable resilience benefits for local government facilities. These benefits include continuity of operations for critical infrastructure and operation during emergencies for critical facilities. Solar and storage can also be paired with existing fossil-fuel generators to further increase a facility’s ability to ride through a blackout. As energy storage costs continue to fall, Durham County should assess the technical and financial feasibility, making sure to consider the value of resilience, of adding such systems to facilities where resilience is important and solar is being installed.
Off-Site Solar
Due to the limitations on-site solar development and Duke Energy’s expected future electricity mix, all scenarios assessed in the REP have a significant gap between the County’s actual renewable energy percentage and the County’s goal without including some sort of off-site solar project. Approximately 16 - 18 MWs of solar generation (or other renewable electricity source) is needed to fill this gap. There are multiple potential pathways for Durham County to support development of large solar projects that are not constrained by net metering rules and can serve to fill the gap. It is likely that the County will have to leverage multiple pathways, depending on future policy and market changes in North Carolina. The potential pathways identified and discussed in this plan can be divided into two categories related to viability; pathways requiring policy change and those that do not. Pathways that may be viable without policy changes include (1) Duke’s Green Source Advantage Program, (2) a Virtual Power Purchase Agreement and (3) a procurement for the purchase of RECs from local solar projects. Pathways that will only be viable with policy change include (1) Community Solar and (2) developing County-owned parcels via Duke Energy’s Sell-All Tariff program. In all cases, Durham County could retain the RECs associated with the project(s) in support of their renewable energy goals. Even pathways that do not require policy change will be novel efforts for the County presenting new risks and challenges, as there are limited currently viable and proven pathways for the development of community and small utility-scale solar projects in North Carolina.. Risks and challenges associated with specific pathways are discussed below.
Green Source Advantage
Green Source Advantage (GSA) is a Duke Energy program, established via HB 589, designed to increase the ability of large electricity customers to source renewable energy. The program enables Durham County to contract for a solar developer to build, own, and operate a large solar project in North Carolina, but not necessarily on County property, and the County would receive credit for the electricity generated. These credits are used to offset non-renewable electricity from the grid that is not offset by on-site solar. The net cost or benefit to the organization is the difference between the price it pays to the 3rd-party for the electricity and the bill credit they receive from Duke. Because of how Duke calculates the credits, based on their avoided cost of service, GSA is likely to come at a net cost to the County.
An organization is eligible to sign a GSA agreement for a solar project that is up to 125% of the organization’s aggregate peak load. In the case of Durham County, that is a 10 MW project. Throughout the process of creating this plan, the County has been exploring GSA and issued an RFP, in partnership with the City of Durham, to identify a preferred vendor.
Virtual Power Purchase Agreements (VPPA)
A VPPA is a purely financial contract (not a contract to buy electrons) enabling organizations to support development of off-site renewable generation projects while taking advantage of potential financial benefits and receiving the Renewable Energy Credits (RECs) associated with the electricity generated. The renewable generation project associated with a VPPA
must be located in a wholesale market, but the buyer can be located anywhere. The regulatory and geographic flexibility of VPPAs makes them an appealing solution for local governments located in areas of the country that do not have retail electricity choice and are not served by a municipal utility or community aggregation, such as Durham County. Currently, Durham County cannot contract for electricity from an off-site project without going through a Duke Energy program such as GSA. A VPPA enables the County to support projects located in wholesale markets and meet renewable energy goals without changing their relationship with Duke Energy.18
The contractual structure within a VPPA is known as a “contract for differences”. Under this structure, the buyer pays a fixed rate ($/MWh) to the project owner. The project owner then sells the electricity into the applicable wholesale market and passes the variable revenue to the buyer. If the wholesale market price is higher than the fixed price, the buyer receives the upside, but if the wholesale market price is lower than the fixed price the buyer must pay the project owner the difference.
Local REC Purchasing
Another potential mechanism to support off-site renewables would be for the County to release an RFP to purchase RECs, at a fixed price for a defined period of time, from solar projects hosted on businesses within the County. In North Carolina, retail electricity customers that choose to take service under a time-of-use (TOU) tariff may claim the RECs associated with onsite solar projects and transfer them through a voluntary market.19 The County can take advantage of this and, In return for receiving the environmental attributes from the solar project to apply to their goal, provide a per kWh payment (similar to a performance based incentive) to local projects. This payment would function as a local incentive for solar projects, increasing the financial viability of projects constrained by low energy offset savings on Duke Energy commercial rates and supporting local jobs. Depending on funding levels, the County could look to purchase RECs from a mix of existing and new projects. Additional benefits and considerations related to this program include;
• Provides localized co-benefits such as energy resiliency, new green jobs and cleaner air.
• Requires owners to monitor and maintain systems, ensuring continued REC supply and effective use of subsidy
• Can be offered for entire system lifetime (adds assurance for lifetime maintenance and operation) or for critical system payback period only (e.g. first 5-7 years)
• Can be offered at different tiers for residents with low income or for multi-family and condominiums
• REC payment is paid in the future rather than in advance (PBI budget allocations can earn interest for the County while waiting to be paid out to recipients)
• PBI price is controlled by County program manager and can be increased or decreased (by annual vintages) to drive deployments as needed
• Drives “tipping-point” commercial projects, especially rooftop solar lease projects
While implementation of this program would require significant investment and potentially additional County staff, there is precedent for a similar program in the state, specifically the NC GreenPower program. NC GreenPower is a program20 supported by volunteer contributions that enables individuals and organizations across utility territories to purchase RECs and support renewable power in North Carolina. It was approved by the North Carolina Public Utilities Commission in 2003. One significant drawback to this program, however, is that, since it relies on volunteer contributions, it is not capable of providing long-term, guaranteed payments to solar projects. The County can build on the GreenPower example and improve the model by providing stable long-term payments to projects within the county.
Community Solar
Community Solar is a policy mechanism that enables electricity customers (residential, commercial, industrial, municipal) to subscribe to off-site solar projects and receive the financial benefits of solar, as well as, in some cases, the environmental credits in return for a subscription fee. Subscribers receive credit on their utility bills for the electricity generated by their portion of the solar project and pay the project owner for the electricity, capturing savings equal to the difference between the solar credit and solar rate. Given the opportunity, the County could subscribe electricity accounts at facilities without on-site solar to a community solar program.
18 Ryan Shea and Stephen Abbott, A Local Government’s Guide to Off-Site Renewable PPA Risk Mitigation, Rocky Mountain Institute, 2020, https://rmi.org/ insight/local-governments-guide-off-site-renewableppa-risk-mitigation.
19 Pursuant to G.S. 62-133.8 and Commission Rule R8-66, REC sellers must complete a form certifying that RECs are not simultaneously under contract for sale from the same electricity production being tracked in NC-RETS
However, while North Carolina has a fair number of community solar projects, all of them are located in municipal utility or electric co-op territories. Duke Energy recently launched a community solar program (NC Shared Solar), but it is unclear if this program will have the scale required to support County accounts. All sites will be selected and developed by Duke Energy, giving organizations like the County minimal control of system size and location. Additionally, the allowed subscription size for commercial customers will be defined on a project by project basis so it is unclear how much capacity the County could access.21 The County could engage with Duke Energy to provide County sites for project construction but there is no guarantee that this would result in successful development.
Sell-All Tariff
The Public Utility Regulatory Act (PURPA), passed in 1978, requires utilities to purchase electricity from small, usually renewable, power plants at a rate equal to the utility’s avoided cost of electricity. The exact implementation of PURPA is determined at the state level. In Duke Energy’s North Carolina service territory, the tariff through which PURPA is implemented is known as the Sell-All tariff. Under the Sell-All tariff, the customer is billed at their normal usage according to the tariff to which they subscribe for electricity service (if applicable) and concurrently sells all of their generated power to Duke Energy at a rate equal to the utility’s avoided cost. The utility’s avoided cost rates (2-4 cents per kWh) are lower than the retail electricity rates offset through NEM (7-9 cents per kWh), but system sizes are not capped by a facility’s peak electrical demand. Customers selling power through the Sell All tariff have full claim to all RECs associated with their system’s output.
Durham County owns two sites where the Sell-All Tariff, or a variation, would apply because the solar potential vastly exceeds the on-site electricity use. These sites are the County Stadium, which has about 5 MW of solar carport potential, and the Old County Landfill, which has in excess of 15 MW of ground mount solar potential. However, due to the current characteristics of the Sell-All tariff, namely the low avoided cost value, small system size cap and the short contract length, it is unlikely that either of the sites will be developed by the County, or with a 3rd-party lease, in the near term. While battery storage could theoretically be used to shift grid exports and take advantage of higher avoided cost rates at certain times of day, system costs remain high enough to make the economics difficult and Duke does not clearly define rates for resources that have battery storage under the Sell-All tariff. However, if these rates or conditions change in the future, the County should reevaluate this strategy. See “Challenges” below for further discussion.
To determine the solar development potential of Durham County’s facilities and properties a two part analysis was completed. The first phase of the analysis focused on Net Energy Metered projects. The analysis leveraged solar PV hardware specifications (e.g. panel size and power capacity), County data on roof size, geographic data on County parcels and energy usage data to estimate the rooftop and carport solar potential at each facility with electricity usage. Physical potentials were adjusted based on NEM requirements. The second phase of the analysis focused on Sell-All projects. Of the four (4) potential off-site solar development pathways discussed above, the Sell-All pathway was chosen to include in modeling because enough data was available to accurately determine viable solar potential and production. Industry-standard solar design software was used to complete potential system designs based on satellite imagery. Designs were checked with County staff to ensure that all known constraints (e.g. vehicle parking at County Stadium) were respected. Additionally, in collaboration with County staff, five priority solar sites were selected for a detailed financial analysis to accelerate implementation following completion of the REP.
Challenges NEM Limitations
Despite the economic benefits of NEM, the current system size limits placed on NEM projects by Duke Energy limit the extent to which onsite solar can contribute to the County’s renewable energy goals. NEM projects are limited in system size (MW) to the smaller of two factors; (1) a site’s peak electricity demand or (2) 1MW. Especially for sites with a flat electrical demand throughout the day and year, this capacity limitation results in solar systems that do not offset 100% of a site’s energy usage. In the absence of a change to net-metering rules, this significant policy limitation, combined with physical constraints, result in on-site solar being able to account for only 15% of energy use in 2050.
Financial Uncertainty & Contracting Risk of a VPPA
VPPAs were popularized by large corporate entities with high energy costs and a desire to support renewable energy, such as Apple and Google. Historically, the financial risk associated with these deals has made them a poor fit for local governments. However, novel contracting mechanisms that reduce this risk and inherent flexibility of a VPPA are changing this equation. Recently, Arlington County, Virginia, procured 38 megawatts (MW) of solar via a VPPA and employed a contracting mechanism that aligned the variable nature of the contract’s cash flows with its annual budgeting process, reducing the financial risk.
22
PURPA & Sell-all Tariff Implementation
Changes in North Carolina’s PURPA implementation in 2017, which impacted Duke Energy’s Sell-All Tariff, reduced the viability of the Sell-All tariff as a realistic solar development pathway. Key changes included reduction of the maximum system size eligible to receive that standard Sell-All offer from 5MW to 1 MW and a reduction in the offered contract length to 5-years. The relatively low avoided cost rates that a system owner receives for electricity generated, small system size eligibility, and the revenue uncertainty brought by short contract lengths significantly reduces a developer’s ability to count on the Sell-All tariff to provide revenues that cover system costs. Duke Energy does offer the possibility of receiving a 20-year contract for systems that are chosen through a competitive bid process managed by the utility. While this could be an effective development pathway, it is less certain than the standard Sell-All process and the County may be required to give up RECs associated with the renewable electricity, preventing the generation from being applied to the County’s goal. These changes in PURPA implementation negatively impacted Durham County’s ability to leverage available land assets for large-scale solar development via the Sell-All tariff. Undoing these changes, or creating another robust mechanism to sell solar electricity are policy changes that would increase Durham County’s ability to reach its renewable energy goals.
Prior to pursuing broad fleet electrification, it is important for the County to explore fleet right sizing and look for opportunities to improve the utilization of existing assets. One opportunity to do this that is already under consideration by County staff is the implementation of a “motor pool” at the Criminal Justice Resource Center (CJRC) Parking Deck. Establishing a motor pool shifts the assignment of vehicles from specific County departments to create a pool of vehicles that are shared by employees of multiple departments. Currently, 21% of County fleet vehicles are driven less than 3,000 miles per year. These vehicles take up scarce parking spaces and stay in the fleet for a very long time before meeting the 10 year or 100,000 mile threshold for being surplused. This slows down the County’s transition to higher efficiency and alternative fuels for the overall fleet.
The CJRC Parking Deck is an ideal location to implement a motor pool because it houses over 70 County vehicles from more than 5 departments. County staff have estimated that a motor pool that results in the removal of 15 vehicles from the fleet would save about $800,000 over 5 years after implementation, primarily from avoided maintenance and insurance costs.26 This also reduces the number of vehicles that the County needs to consider for electrification, potentially saving additional money on infrastructure in the future.
Another option to improve fleet efficiency quickly is to lease vehicles rather than purchase them. Leasing would allow the County to add or eliminate vehicles monthly based on need thus avoiding keeping unused vehicles for many years when departmental needs change or the vehicle becomes unreliable. Leasing could save the county money by not paying insurance and maintenance on underutilized vehicles and could result in a rapid transition to high efficiency, hybrid, and electric vehicles without significant upfront costs.
Vehicle Telematics
As Durham County explores and implements changes to its fleet in support of its 100% renewable energy goal, vehicle data will be the foundation on which these changes are based. The fleet analysis completed as part of the REP revealed that some data necessary to implement a motor pool and phased fleet electrification, such as where vehicles park, life-todate maintenance costs and daily/weekly driving patterns are not currently collected.
Widespread installation of telematic units in the County’s fleet is the most impactful step the County can take to improve its vehicle data collection. Telematics provide key data on vehicle duty cycles (driving behavior) and fuel usage as well as aid in tracking maintenance costs. Detailed telematic data will enable the County to quickly identify low utilization vehicles for retirement, make informed decisions on which electric vehicles are purchased to replace which existing vehicles, accurately calculate the total cost of ownership of electric vehicles compared to traditional alternatives and where/how much EV charging infrastructure is required to support fleet operations.
Implementing vehicle telematics comes with an installation cost and ongoing software fees in the range of $13 - $40 per vehicle per month, depending on the exact solution and level of service. The installation cost varies and can be reduced by using existing fleet staff to complete installation. In addition to the benefits of telematics related to electrification, telematics can also save fleets money through in various ways including improved vehicle and driver safety, improved preventative maintenance, route optimization and fuel reduction. Many telematic providers have return on investment (ROI) calculators to aid fleets in determining the value that telematics can provide based on exact fleet characteristics.
Fleet Electrification
A systematic approach to fleet electrification was the primary strategy assessed through the REP to transition Durham County’s fleet to renewable energy. Fleet electrification enables energy used in the County’s vehicles to align with Durham County’s definition of renewable energy as electricity generation comes increasingly from renewable sources (on-site and off-site), is the most effective solution to reduce harmful local pollutants that impact the Durham community and has the potential to result in long-term cost savings to the County through reduced vehicle maintenance and fuel costs. Of the
26 Based on the County’s Fleet Management Modernization analysis completed in 2019 in collaboration with Agile Fleet Management Solutions.
407 vehicles analyzed, approximately 41% (169) are light duty sedans, SUVs, pick-up trucks, and cargo vans that can likely be electrified based on electric vehicle models that are currently available or will be within 2 years. Another 54% (219) are light duty vehicles in the Sheriff’s Department that may be able to be electrified depending on specific operational requirements. Plug-in Hybrid Electric vehicles (PHEVs) and traditional hybrid vehicles may also have a role to play as a near-term solution to reduce fuel usage and increase renewable energy in the County’s fleet where full electrification is not possible. Traditional hybrids, such as the Ford Interceptor Utility Hybrid, can be used immediately in the Sheriff’s Department to reduce fuel usage. PHEVs may also be a solution for certain vehicle duty cycles that require quick refueling at certain times. However, PHEVs have smaller battery sizes and much less electric range compared to fully electric vehicles, meaning that they have to charge more often if the goal is to maximize electric miles driven. Thus, widespread adoption of PHEVs in a fleet can lead to higher infrastructure costs due to a reduced ability to share charging stations. This can reduce the feasibility of PHEVs to act as a bridge solution to a fully electric vehicle.
As with the motor pool, the County’s CJRC Parking Deck should be the focus for near term implementation. The majority of the vehicles parked at this facility are prime candidates for electrification due to their duty cycles and vehicle types. Of the estimated 79 active vehicles parked at this location, 72 of them are candidates for electrification based on currently available vehicle models. If these vehicles were electrified, it would result in an estimated $550,000 -$650,000 in total cost of ownership savings over the lifetime of the electric vehicles purchased. Given the long dwell times and low daily mileage of vehicles at the CJRC Parking Deck, it is estimated that electrification of these vehicles could be supported by only 19-25 Level 2 (6.6 kW) charging ports (half as many stations assuming two ports per station). During a detailed EV infrastructure study, the County could also explore the utility of Level 1 charging (trickle charging) for vehicles with particularly low or infrequent usage.
Vehicle “Right-Typing”
One way to accelerate vehicle electrification is to explore “vehicle right typing”. Vehicle right typing is the process of reassessing the operational requirements of existing vehicles to determine if a different, usually smaller, vehicle could be used to replace the existing vehicle. Initial discussions with County staff indicated that a portion of the maintenance vehicles that are currently pick-up trucks would be better served by small vans that enabled technicians to securely store equipment. As there are currently limited electric pick-up truck options available, replacing select existing gas pick-up trucks with electric vans could accelerate electrification.
Renewable Diesel
Due to limited near-term, cost-effective electric options to replace heavy-duty vehicles, renewable diesel was explored as a secondary strategy to transition County vehicles to renewable energy and reduce carbon emissions. Due primarily to differences in the production process, renewable diesel is distinct from biodiesel and is considered an entirely different product. Renewable diesel is a liquid renewable fuel created from processing fat, oil and grease feedstocks. Its chemical composition is comparable to petroleum diesel and it behaves exactly like conventional diesel. This enables fleets to switch to cleaner fuel without making any additional investments or modifications to their fleet. While the specific feedstock has an impact on the carbon intensity of renewable diesel, on average renewable diesel can reduce carbon emissions by about 68%.27 Additionally, in older diesel engines (pre-2010) renewable diesel has the potential to reduce particulate matter and NOx emissions. While renewable diesel can be purchased at cost parity, or cheaper, with petroleum diesel in western states with clean fuel incentives (Oregon, California), a cost premium remains to purchase the fuel in North Carolina and elsewhere in the country. This cost premium could be addressed by aggregating demand for renewable diesel in collaboration with other public fleets in North Carolina to increase purchasing amounts or enticing production closer to North Carolina.
Case Study: Renewable Diesel in the City of Charlotte
Starting in May 2019, Charlotte Water began piloting renewable diesel (specifically R99) in 34 vehicles. The utility did not report any operational issues with the vehicles and saw immediate reductions in carbon emissions. Due to the small size of the pilot and limited fuel supply, Charlotte Water paid almost twice the price for renewable diesel compared to petroleum diesel. Despite this, and due to the environmental benefits, the utility is exploring ways to expand their use of renewable diesel.
27 Based on an internal analysis of all renewable diesel types approved under California’s Low Carbon Fuel Standard program. Analysis performed on April 27th, 2020.
Analysis
Figure L summarizes the fleet electrification analysis completed to inform the REP. The analysis addressed all active vehicles in the County’s fleets, with the exception of diesel vehicles, and was intended as a high level summary of the County fleet’s electrification potential. A detailed site by site analysis will still be needed to guide implementation.
County vehicle data including vehicle body type, vehicle department, gross vehicle weight, expected vehicle lifespan and annual mileage were used to calculate a replacement year, “best fit” electric vehicle type and estimated annual electrical energy required for each existing vehicle. These calculations, combined with data on fuel cost, electricity cost and estimated maintenance costs, enabled the creation of a vehicle replacement timeline and total cost of ownership savings estimates. Vehicle parking locations were assigned to each vehicle based on the vehicle department to inform vehicle charging infrastructure estimates based on the total electric vehicle charging load expected at each facility in question.
Challenges
The primary challenges of fleet electrification are (1) determining appropriate electric vehicle models to replace existing assets, and (2) developing charging infrastructure. The electric vehicle market is rapidly changing and expanding, making it challenging for fleet managers to stay up to date on all available models. However, this rapid expansion means that there are increasingly more options to replace internal combustion vehicles that to date did not have appropriate electric alternatives (e.g. pick-up trucks). Collecting robust vehicle data that enables rapid analysis of vehicle duty cycles to determine an appropriate alternative is the most impactful step that the County can take to address this challenge.
Developing and installing charging infrastructure is the most technically challenging and costly aspect of fleet electrification. Unlike electric vehicles which often result in lifetime savings, charging infrastructure represents a capital improvement project required to support vehicle operation without a clear payback. Costs related to design, engineering, installation, trenching and electrical infrastructure upgrades can often be a barrier for public agencies exploring fleet electrification. A comprehensive vehicle and infrastructure analysis can determine whether savings accrued from vehicle electrification are sufficient to justify the infrastructure investment. Additionally, this process can be used to further explore available grants that can be used to reduce EV and charging infrastructure costs. Duke Energy is piloting models to reduce the up-front cost of infrastructure and there are grants available to pay for infrastructure.
Figure L: Fleet electrification analysis
A final important challenge to fleet electrification is employee acceptance. Many employees may have concerns about driving EVs stemming from a lack of experience with the technology and a misconception that EVs commonly run out of charge while driving. While range limitations are not often a legitimate concern for vehicles in public fleets, given the limited daily vehicle miles traveled required by most duty cycles, and fleet managers are not likely to purchase a vehicle that will not meet operational needs, additional engagement with employees will likely still be necessary to reduce hesitancy. A robust educational campaign that includes physical demonstrations of vehicle charging and employee test drives is one of the most effective ways to address these concerns.
Electrification of Emergency Vehicles
While many public agency vehicles, such as administrative or maintenance vehicles, have long dwell times with ample time to charge, that is not the case for emergency vehicles. The shorter dwell times and unpredictability or emergency vehicles’ duty cycles pose unique challenges for electrification. Public agencies considering electrifying vehicles in Fire, Emergency Services or Law Enforcement departments must perform specialized analyses of vehicle operational needs and infrastructure requirements. Often, a combination of Level 2 and Direct Current Fast Charging is necessary to satisfy charging requirements. Some charging station providers offer a “cost per electric mile” model where fleets pay a fixed rate per mile and the 3rd-party company determines and installs all required infrastructure for mission critical vehicles.
While challenges exist, the high mileage and fuel usage of emergency vehicles, particularly law enforcement vehicles, mean that these vehicles often represent the highest financial and emissions reductions benefits. Because of this, there are public agencies working diligently to address these challenges and realize benefits. The City of Fremont California has piloted, with positive results, a Tesla Model S in a law enforcement patrol applications and is now exploring infrastructure solutions to pursue further electrification of its patrol fleet.
As public agencies explore opportunities for electrification of mission critical vehicles, partial electrification solutions such as on-board batteries used to power vehicle equipment and reduce idling may be appealing to realize fuel and emissions savings.
APPENDIX B: METHODOLOGY
scenario analysis
Overview
The County utilized the Climate & Energy Scenario Analysis (CESA) Tool to help plan for and visualize the multidimensional impacts of the various options presented in this plan. Designed in Microsoft Excel, the CESA Tool combines user inputs with existing data, performs a series of calculations, and provides output in the form of comparative tables and graphs. By selecting bundles of renewable energy, energy efficiency, and fuel switching projects, the County can analyze the outcomes of different scenarios and assess multiple pathways towards reaching 80% renewable energy by 2030 and 100% by 2050. The tool is designed to be updated as newer data becomes available.
The tool performs a series of calculations and computes results based on a set of interacting components: static default assumptions, user-defined inputs, and interim calculations.
Static default assumptions are generally non-changeable assumptions that were provided by Cal Poly SLO and the consultant team during the tool’s development. These assumptions are used in various manners by the tool to calculate results and generate output. These assumptions can be changed by the user. These static default assumptions include, but are not limited to:
• historical energy use
• historical emissions
• electricity and fuel combustion emission factors
• unit conversions
User-defined inputs are inputs defined by the user while building a scenario. These inputs are spread throughout the various subsections which comprise the entire scenario-building process, described later in section 3. These user-defined inputs include:
• Global economic assumptions (discount rate, inflation rate)
• Energy costs (electricity and natural gas)
• Energy cost escalation rates
• Target years for 80% and 100% renewable energy
To explore the different ways of achieving the County’s clean energy goals, four scenarios were created:
• Business As Usual (BAU)
• Phased Investment
• Accelerated Investment
• High Impact Solar Investment
Figure Q: Tool architecture
Background Data
The calculations in the CESA Tool are based on the following background datasets: Building data
• Electricity and natural gas consumption
• Gross sq ft
• Building type County data
• Vehicle fleet gasoline and fuel consumption
• Capital projects
• Baseline energy (kWh, therms) and fuel (gasoline, diesel, propane) consumption Project data
• Building project data (cost, kWh/thm savings, degradation factors, etc.)
• Renewable energy projects (cost, capacity, kWh production, etc.)
Calculations in the CESA Tool are performed as follows:
1. Baseline energy consumption, renewable energy percentage, and GHG emissions are calculated.
2. Energy savings, generation, and emission reductions from selected EE, RE, and TRN projects are calculated for the years 2020–2050 and subtracted from the baseline.
3. Renewable content is calculated based on remaining demand and the projected renewable energy content from the electric grid.
4. Net cash flow is calculated for each project based on energy prices, costs, and savings.
5. Net present value (NPV) is calculated for each project using net cash flows and a default discount rate of 6%.
Scenario Definitions
Table E: Scenario Definitions
Hour-by-hour Heat Pump Sizing
A true HVAC sizing analysis will take into account many factors such as building envelope, shading from nearby trees/ buildings, heat gain/loss through transparent surfaces, and much much more. The analysis carried out by Optony is not the same analysis that would be carried out by HVAC professionals; instead this analysis aims to reasonably estimate heat pump sizing for a large portfolio of buildings in order to estimate the possible financial and environmental benefits of building electrification. In order to estimate an adequate heat pump size for each building, some simplifying assumptions had to be made:
• Passive heat exchange with the surroundings is modeled as an adjustable Heat Loss Coefficient (HLC), in kWh/hr per °F of temperature difference between the interior and exterior
• The building’s internal thermal mass can be modeled as 180 kg of wood per m2 of floor area [ref]
• A deviation of +/- 2 °F from the setpoint temperature is acceptable
• Each building’s floor-to-ceiling height is 10 ft
From discussions with County staff, we learned that in the heating season they set the HVAC setpoint temperature in most buildings to 72 °F from 5 AM to 7 PM, and then lower it to 65 °F at all other hours.
The model has three inputs that vary from building to building. The first is the building’s floor area, which is simple to find. The next two are estimates for the HLC and the heat pump’s size in kW; these inputs are left to Excel’s built-in genetic algorithm as levers as it tries to minimize the difference between: (1) the total energy lost to the surroundings vs gained from the heat pump; and (2) the 95th percentile energy loss hour and the heat pump’s output at its average Coefficient of Performance (COP).
Using these inputs, as well as Typical Meteorological Year (TMY) data for Durham, the model estimates the thermal behaviour of the building’s interior as the time and outdoor temperature change. Over many iterations, the genetic algorithm will tend to converge on an adequate heat pump size and reasonable estimate for the HLC. Once a heat pump size is selected, the spreadsheet calculator estimates total energy use throughout the year for a standard ASHP, as well as the energy use of a Solar-Assisted ASHP to determine the potential benefit of coupling a PV/T system with the heating system. This Solar-Assisted case does not affect heat pump sizing decisions both in order to ensure heat pump performance and because PV/T systems do not provide much thermal energy during the winter months.
Renewable Energy Potential Study
Solar Potential Study
To assess the physical potential of solar photovoltaic systems across County buildings and undeveloped property, Optony leveraged a combination of facility characteristic data, GIS data, custom solar design software and several industrystandard and market-informed assumptions. Solar potential estimates were also adjusted to comply with the relevant state and utility policies governing solar development and interconnection, such as net energy metering (NEM). Given the number of facilities in question, the scope of the project and some inconsistencies in available data, a two phase study was completed. The first phase employed a generalized solar potential methodology based on physical area available for development and solar coverage ratios for various types of installation.
To complete the first phase, existing rooftop area (square footage) data provided by the County was multiplied by solar density factors (watts per square foot) and solar coverage ratios (% of developable area covered) to calculate total rooftop solar potential (kW). Durham County and Durham City GIS data was then used to isolate and estimate parking lot area for each County parcel with a County facility. Parking lot area at the County Stadium is not paved and, as a result, was not accounted for in the GIS analysis, as non-paved parking lots are not included in the analyzed shapefiles. However, this site was analyzed specifically in the second phase of the analysis. Following the calculation of parking lot area, the same calculation used for rooftop solar potential was used to estimate carport solar potential. A solar density of 15 Watts/sqft was used, based on average solar panel power ratings and size. Solar coverage ratios of 60% for rooftop installations and 65% for carport installations were used, based on Optony’s experience with past municipal solar potential studies. Estimates of carport and rooftop solar potential also accounted for information provided by County staff such as roof age, expected changes to a building (e.g. demolition), and roof age and type. Given the scope of this study, a detailed review of every site to identify all physical constraints to solar development, such as rooftop HVAC equipment or shading, was only completed for the priority sites (listed below).
The second phase utilized custom solar design software (Helioscope) to create sample solar designs based on satellite imagery for facilities that did not have sufficient data available for inclusion in the first phase. Helioscope was also used on several priority sites to refine solar potential estimates created in the first phase and to estimate solar potential on undeveloped sites with the possibility for utility-scale projects. A list of priority and undeveloped sites is included below:
• Courthouse & Justice Center Parking Deck (510 S Dillard Street) - NEM project
• Detention Center (219 S Mangum Street) - NEM project
• Admin II (201 East Main Street) - NEM project
• Southwest Library (3605 Shannon Road) - NEM project
• Hillsborough Warehouse (4527 Hillsborough Road) - NEM project
• Old County Landfill (Electra Road) - utility-scale project
• County Stadium (750 Stadium Road) - utility-scale and NEM project
After the physical solar PV potential was identified, designs were updated to comply with the expected interconnection type. For NEM projects, the physical potential was compared to the site’s 2019 peak electrical demand and system sizing was reduced to the peak demand if physical potential exceeded peak demand. For utility-scale projects expected to be interconnected as a Sell-All project, designs were refined to create multiple 1 MW projects that could be interconnected separately. The analysis did not include a comprehensive assessment of electrical constraints such as building electrical switchgear capacity or utility interconnection.
Fleet Electrification Assessment
The fleet electrification assessment and charging infrastructure analysis were completed using methodologies established by Optony and partners, in collaboration with the Bay Area Air Quality Management District and the City of Fremont, California, and vetted through a year-long regional Working Group in the Bay Area covering fleet electrification. The methodology established for a fleet planning and electrification assessment are included in free tools available on EVFleet. tools. Leveraging these tools enabled a vehicle-by-vehicle fleet electrification analysis to be completed efficiently within the scope and budget of the project.
Vehicles that did not have any utilization data in the last year were assumed to be surplus and excluded from the analysis. Additionally, vehicles expected to be removed from the fleet as a result of the motor pool implementation were also removed from the analysis. These vehicles were identified by analyzing vehicles domiciled at the Justice Center Parking Deck and determining those in the bottom 20% of utilization. Finally, while diesel vehicles were included in the initial analysis, these vehicles were excluded from the final vehicle electrification results.
DATA FIELD
Equipment ID
SOURCE
County Fleet Database
Make County Fleet Database
Model County Fleet Database
Purchase Price Not Available
Auxiliary Equipment Cost Not Available
Life-to-Date Maintenance Not Available
Fuel Type County Fleet Database
Powertrain County Fleet Database
Department County Fleet Database
Domicile Location Inferred Based on Department
Meter Type
County Fleet Database
Meter Read County Fleet Database
Body Class
Calculated using VIN Decoder
Fuel Usage County Fleet Database
Expected Service Life
Gross Vehicle Weight Rating
County Vehicle Policy
Calculated using VIN Decoder
Data Organization: All existing fleet data provided by the County was sorted into a fleet database template for easy analysis. A summary of the data fields included in the database is provided below, along with whether or not Durham County provided the required data or if assumptions were used.
Vehicle Replacement Timeline: An expected replacement year for each vehicle was calculated based on vehicle age, vehicle mileage, vehicle maintenance costs and a set of replacement thresholds established through discussions with the Durham County Fleet Manager. Replacement thresholds are expressed as a “percent of expected”, with respect to the replacement parameters established through the County fleet policy. They include expected vehicle lifespan (age), expected utilization (mileage) and cost to maintain as a percentage of purchase price. Each factor was projected forward based on historical data and the replacement year was assigned when the first replacement threshold was met. Since the County was not able to provide life-to-date maintenance costs for each vehicle, this factor was not considered.
Electric Vehicle Suitability: For each existing vehicle, a potential EV Type was identified using a formula based on vehicle body type, vehicle department and use case, gross vehicle weight rating and mileage. A definition of each EV Type and an example model can be found here under Step 4. The example model associated with each EV Type informed assumptions used in the Total Cost of Ownership analyses.
Total Cost of Ownership (TCO) Analysis: To assess the financial impacts of vehicle electrification, a total cost of ownership analysis comparing purchasing EVs to replacing existing vehicles with new ICE vehicles was completed. The total cost of ownership analysis used a period of 10 years. Total purchase price, maintenance cost and fuel/electricity cost was calculated for each replacement scenario. Total purchase price was based on the MSRP of a set of standard ICE vehicle models common in municipal fleets and the example EV models for each EV Type. Maintenance cost was based on a cost per mile assumption and the mileage of the existing vehicle. Fuel cost for ICE vehicles was based on the County’s historical fuel price and annual fuel usage of the existing vehicle. Electricity cost for EVs was based on the average electricity price paid by the County across the facility portfolio and expected annual energy used by the new EV (kWh), calculated using existing vehicle mileage and the EPA modeled miles per gallon equivalent of the example EV models.
Charging Infrastructure Requirements: Estimated charging infrastructure requirements (number of Level 2 charging ports) for each domicile facility were calculated based on daily EV charging needs in 2030, an assumed vehicle dwell time (12 hours) and an assumed charger output of 6.6 kW (Level 2 charging). Daily EV charging needs were calculated using the annual vehicle energy use calculation completed during the TCO analysis divided by the number of working days in a year.
Charging Infrastructure Cost Estimates: Charging infrastructure cost estimates were based on the number of charging ports required at each site and data on charger costs, inclusive of materials and installation. Additional cost estimates were included for the trenching requirements of each site. Trenching requirements were estimated using satellite imagery to measure trenching distance based on the location of the existing electrical room and the location of EV parking. Cost estimates did not include additional costs related to the reconfiguring electrical subpanels and supply equipment or soft costs associated with engineering and design.
ASSUMPTIONS
The analysis and modeling done for the plan incorporated a number of assumptions that affect energy and environmental calculations, shown in Table F.
SOURCES
Discount Rate 6%
Inflation rate 2%
Electricity price
Natural gas price
Gasoline price
Diesel price
$0.1265/kWh (3% escalation rate)
$0.6176/thm (5% escalation rate)
Economic Assumptions
Tobin Freid, Sustainability Manager, Durham County
Tobin Freid, Sustainability Manager, Durham County
From Enpira (average cost from Oct. 2019 – Oct. 2020)
$3.110/gal GasBuddy price for Durham, NC 10.26.20
https://www.gasbuddy.com/ charts
$3.248/gal AAA average NC price for 10.26.20
https://gasprices.aaa.com/
Baseline Energy Use (2020)
Building electricity consumption (kWh)
25,211,245 kWh/year
Building natural gas consumption 671,562 therms/year
Water/Wastewater electricity consumption
7,002,961 kWh/year
Net Zero Forecast (default) 14% by 2030, 29% by 2040, and 36% by 2050
Base Case without Carbon Policy[1]
7.5% by 2035
Base Case with Carbon Policy 11.5% by 2035
IPM
DIEM
13.7% by 2030, 39.9% by 2050
18.8% by 2030, 45.2% by 2050
Enpira
Grid Renewable Energy %
Duke Energy 2020 Climate Report (pg.26)
Duke Energy Carolinas 2020 IRP (pg.163)
Duke Energy Carolinas 2020 IRP (pg.164)
Power Sector Carbon Reduction (Duke Univ. report) (pg.183)
Power Sector Carbon Reduction (Duke Univ. report) (pg.184)
Update as County conditions change
Update as conditions change
Annually
Annually
Annually
Annually
Update as County conditions change
Update as County conditions change
Update as County conditions change
Update as conditions change
Update as conditions change
Update as conditions change
Update as conditions change
Update as conditions change
[1]Base Case without Carbon Policy and Base Case with Carbon Policy scenarios chosen based on 9/2/20 Utility Dive interview (https://www.utilitydive.com/news/duke-irp-includes-scenarios-to-reduce-carbon-emissions-70-by-2030/584561/)
Building electricity growth
CIP-based
Energy Forecasts
Building square footage x Building type EUI x Building type energy split (kWh/therms) x EIA Annual Energy Outlook 2020 growth projections
Updated as conditions change
Building natural gas growth
CIP-based
Building electricity savings
CIP-based
Building natural gas savings
Water/Wastewater electricity growth
CIP-based
Building square footage x Building type EUI x Building type energy split (kWh/therms) x EIA Annual Energy Outlook 2020 growth projections
Based on 2%/year savings for HVAC projects and 5%/year savings from building envelope projects (conservative estimates based on survey of industry best practices)
Based on 2%/year savings for HVAC projects and 5%/year savings from building envelope projects (conservative estimates based on survey of industry best practices)
0.2%/year 10-year historic trend from County GHG report
Gasoline usage growth Flat
Diesel usage growth Flat
Critical building system degradation factor 1%/year
Assumption based on increased utilization offsetting any service growth
Assumption based on increased utilization offsetting any service growth
Conservative value based on survey of industry best practices
Yearly energy efficiency improvement 1.3%/year 10-year historic trend from County GHG report
Project Calculation & Modeling Assumptions
Solar maintenance costs $300 per system per year
Based on reported costs from Buncombe-Asheville bulk procurement
Solar System Cost 1.50 $/Watt All in installed pricing for a cash purchase system. Pricing received by Buncombe/Asheville via bulk procurement
Updated as conditions change
Updated as conditions change
Updated as conditions change
Updated as conditions change
Updated as desired with new research.
Updated as desired with new research.
Updated as desired with new research.
Updated as desired with new research.
Updated as desired with new research.
Annually, or as desired. Average system cost for non-residential systems of varying sizes can be sourced from LBNL, updated annually: https:// emp.lbl.gov/tracking-the-sun. Recent studies are not NC specific due to lack of data.
Non bulk purchase pricing included as option in CESA is 2.30 $/Watt, from 2020 Tracking the Sun Report.
Solar Efficiency 1350 kWh/kW/ year
Modeled in Helioscope using Durham weather records
Solar Density by Area 15 W/ft2
Calculated based on average panel capacity and size.
Update not required. Could be updated on advice from a solar vendor in reference to a specific design. Solar production totals are calculated using yield in the Solar Analysis Google Sheet.
Only used for facilities with rooftop square footage data and usable parking lot area GIS data. Not used for sites with a detailed solar analysis.
Recurring update not required. This is an average figure. Premium solar panels (e.g., SunPower manufactured panels) will exceed this power per square foot.
Only used for facilities with rooftop square footage data and usable parking lot area GIS data. Not used for sites with a detailed solar analysis.
Solar Coverage Area (Rooftop & Carport) 60 - 65% Internal Optony estimate based on past project experience.
Recurring update not required. Only used for facilities with rooftop square footage data and usable parking lot area GIS data. Not used for sites with a detailed solar analysis.
Argonne National Laboratory, Burnham et al. (forthcoming).
EV Maintenance Costs 0.061 $/mile Know Your Driving Costs 2019, AAA Argonne National Laboratory, forthcoming paper by Andy Burnham.
Representative ICE Vehicle Purchase Prices
Representative EV Purchase Prices
Recurring update not required.
Updated as desired with new research.
$35,000 –$62,000, varies by vehicle model Manufacturer MSRPs (2020) Annually
$31,600 to $80,000, varies by vehicle model
ICE Vehicle Efficiency MPG, varies by vehicle model
EV Efficiency kWh/mile, varies by vehicle model
Manufacturer MSRPs (2020), Sourcewell and Climate Mayor’s EV Collaborative Pricing Annually
EPA MPGe Database (2020) Updated as desired with new research
EPA MPGe Database (2020)
Updated as desired with new research
EV Battery Range 32 – 315 miles, varies by vehicle model
EV Charging Station Hardware Cost
EV Charging Station Install Cost
Trenching Costs
Local Meteorological Data
Building Thermal Mass per Floor Area
OEM Specifications
$2,793 (per port) International Council on Clean Transportation
$2300 - $3000 (per port)
International Council on Clean Transportation
$400/ft Based on Optony internal data
TMY3 Data from NREL
180 kg of wood per m2
Heat Pump Cost per Ton
$630/ton + $1090
Heat Pump Maintenance Costs 1.45% of HP Cost/year
Boiler Maintenance Costs 1% of Boiler Cost/year
Hybrid Solar Cost Adder $2/W of PV installed
NREL National Solar Radiation Database
Johra, H., and Heiselberg, P., 2017, “Influence of internal thermal mass on the indoor thermal dynamics and integration of phase change materials in furniture for building energy storage: A review”, Renewable and Sustainable Energy Reviews, 69, pp. 19-32.
Market Research done by Optony
NREL Report: “Distributed Generation Renewable Energy Estimate of Costs”
Optony Internal Database
Optony Internal Database, estimated based on observed project costs.
Updated as desired with new research
Assumes 6.6 kW output per port and network capability. Updated as desired with new research
Updated as desired with new research
Updated as desired with new research
Updated as desired with new research
Updated as desired with new research
Updated as desired with new research
Recurring update not required
Recurring update not required
Recurring update not required
Emission Factors (EFs)
Electricity EF 0.3372 kg CO2e/kWh eGRID
Natural gas EF 5.32 kg CO2e/ thm
Gasoline EF 8.780 kg CO2e/ gal U.S. EPA (2020)
Diesel EF 10.210 kg CO2e/gal
Updated as new research becomes available
Updated as new research becomes available
Updated as new research becomes available
Updated as new research becomes available
Table F: Assumptions used in the CESA Tool & CESA project inputs