ALTOS, CA

CLIMATE ACTION & ADAPTATION PLAN
Vision
“To place Los Altos on an accelerated, sustainable path to carbon neutrality by advancing bold and effective climate policies.”
Mission
The mission of our Climate Action and Adaptation Plan is to preserve the unique character of Los Altos and enhance its natural environment while improving the quality of life and health of its people by supporting transformative change in the areas of climate action, resilience and equity.

Executive Summary
Executive Summary
This Climate Action and Adaptation Plan (CAAP) assesses the impacts of Los Altos on the climate, how Los Altos can reduce its impact on the climate and how Los Altos can adapt to the changing climate.
Call to Action
Our Impacts
• Electrify transportation
SIXTH ASSESSMENT REPORT
Working Group I – The Physical Science Basis
An updated greenhouse gas (GHG) inventory was conducted to understand the current GHG emissions of Los Altos and to establish a baseline for the forecasting and measuring of future emissions. Executive Summary Figure 2 shows that approximately 96% of Los Altos’ city-wide community GHG emissions are from the use of fossil fuels in the transportation and energy sectors. To mitigate Los Altos’ impact on climate change we must:
• Increase walking, bicycling and shared transportation in our lives and work
Climate Impacts
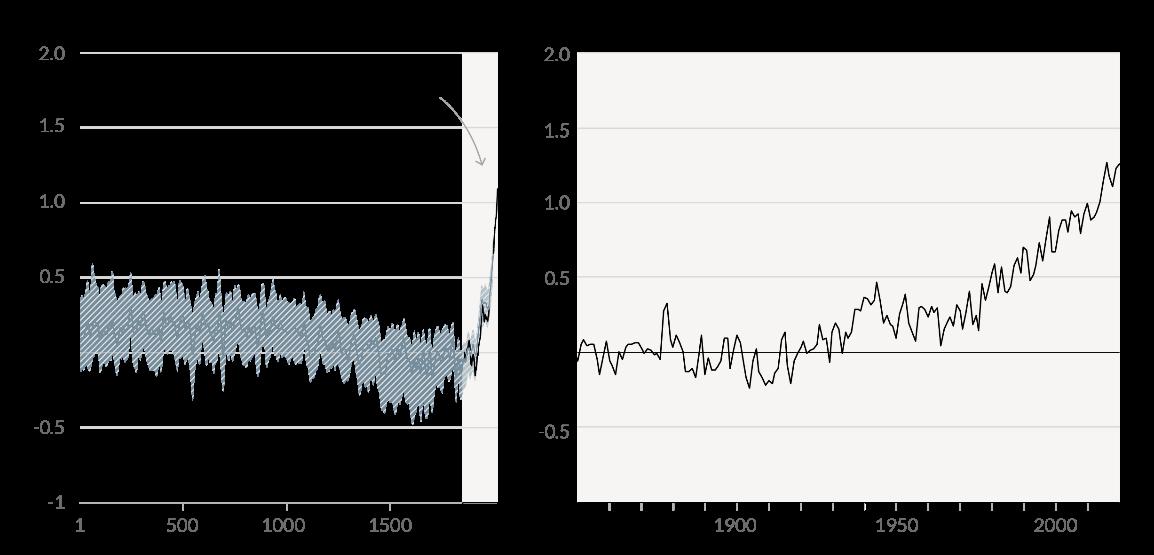
There is international consensus on the science of climate change and actions that must be taken over the next few years to avoid some of the potentially catastrophic impacts on Earth and its ability to sustain our current population and civilization. The CAAP’s Introduction section presents information on the urgency of action and policies being developed to address and adapt to climate change locally, nationally and internationally in just and equitable ways. Executive Summary Figure 1 shows that warming of the planet is unprecedented since the middle of the 19th Century.
Changes
• Switch from fossil fuels to clean renewable electrical energy in our buildings and residences
Human influence has warmed the climate at a rate that is unprecedented in at least the last 2000 years
• Reduce vehicle miles traveled
in global surface temperature relative to 1850-1900
A Vulnerability Assessment was conducted to determine threats Los Altos is likely to face from the changing climate, as well as assess the City’s preparedness and capacity to address those threats. Los Altos will experience increased heat waves, floods, drought, and poor air quality from regional events and reverberations from the regional impacts of climate change on the natural environment, water supply
Executive Summary
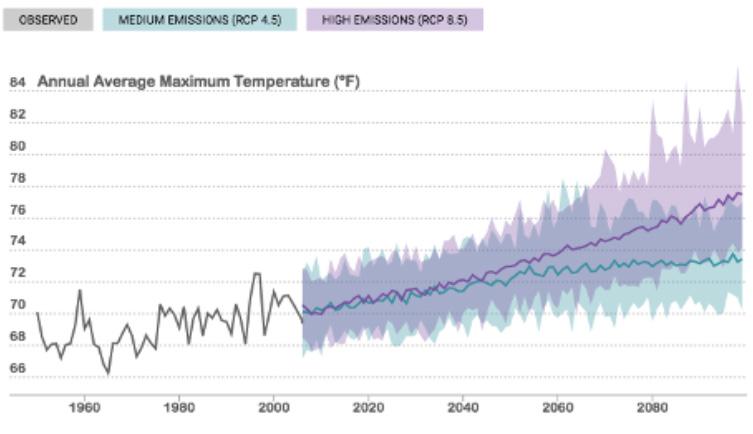
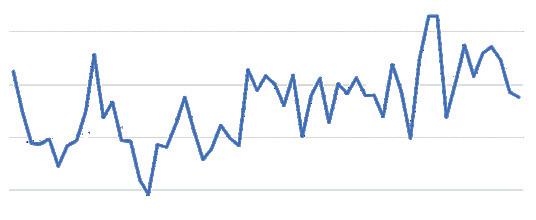
system, and the energy grid on which we depend. Executive Summary Figure 3 shows the forecasted change in expected temperatures in Los Altos. The complete Vulnerability Assessment is included as Appendix E.
Looking to 2050
To determine what the City’s emissions might look like in 2050, a series of emissions forecasts were developed. First a BusinessAs-Usual (BAU) forecast was developed to estimate the City’s emissions without any additional action from Federal, State, or local governments. The City’s Business As-Usual emissions are expected to increase from 111,320 metric tons in 2018 to 116,346 metric tons in 2050. Executive Summary Figure 4 shows the results of the Cit’s BAU forecast.
ANNUAL AVERAGE MAXIMUM TEMPERATURE
Executive Summary Figure 3
BAU Forecast (2018 -2050)
Executive Summary CONTINUED
To project the City’s emissions in 2050 including the expected impacts of State and local actions, an Adjusted Business-As-Usual (ABAU) forecast was developed which includes expected increases in fuel economy and building energy efficiency in California, increased EV adoption in Los Altos specifically, and the expected increase in air conditioning use due to increased temperatures related to climate change. This forecast shows that, with the inclusion of these additional factors, the City’s emissions are expected to decline from 111,320 metric tons in 2018 to 70,800 metric tons in 2050. Executive Summary Figure 5 shows the results of the City’s ABAU forecast.
Based on the current and forecasted greenhouse gas emissions, implementation of Los Altos’ 2013 Climate Action Plan, and guidance from City government and the community, the CAAP is based on pursuing a goal of Carbon Neutrality by 2035. Reducing
Emissions Timeline by Scenario (MTCO2e)
EMISSIONS TIMELINE BY SCENARIO (MTCO2 e)
1Historic Data (data for 2006-2017 not
2Projected data based on models
as many GHG emissions produced by the City and its residents as possible and sequestering the remaining emissions through naturebased solutions, innovative carbon sequestration solutions, communitybased sequestration projects, and local carbon offsets will be required to reach Carbon Neutrality by 2035.
After factoring in the impacts of the 2021 Reach Codes and 2013 CAP actions not included or modified in this update, we will need to reduce our net emissions by an additional 60,000 metric tons by 2030 and a further 15,000 metric tons by 2035 to reach our carbon neutrality goal. Executive Summary Table
1 summarizes the historical and projected emissions for Los Altos.
Strategic roadmap
To help Los Altos be more resilient and carbon neutral, a roadmap of Strategies, Goals and Actions was developed. This roadmap defines the actions, their schedule, estimated cost and expected benefits. The roadmap is broken into three sections:
• Greenhouse gas mitigation strategies
• Climate adaptation strategies
• Cross-cutting strategies (ones that deliver both mitigation and adaptation outcomes)
ADJUSTED BAU FORECAST (2018-2050)
Adjusted BAU Forecast (2018 -2050)
Executive Summary Table 1 Emissions Timeline by Scenario
Executive Summary
Executive Summary Figure 6 shows the relationship of these three types of strategies to each other. Some of the strategies build on existing efforts within Los Altos like the 2013 CAP, the 2018 Green Infrastructure Stormwater Management Plan, or the Complete Streets Master Plan. Most are new strategies adopted or altered from other California CAAPs and programs beyond California. Others were developed in discussion with different stakeholders.
Through quantitative and qualitative analysis, stakeholder engagement, and survey of best practices, 68 actions were identified and prioritized. The Strategic Roadmap section of this plan contains a summary of the proposed Strategies, Goals and Actions grouped by Focus Area, as well as the strategy development process and a detailed description of each action. Executive Summary Table 2 lists CAAP strategies by Focus Area.
Executive Summary Figure 7 shows Los Altos’ forecasted pathway to carbon neutrality by Focus Area. Note that approximately 3,144 MTCO2e remain in 2035 that will need to be eliminated through the sequestration solutions mentioned above.
The CAAP strategies entail transforming the urban landscape to make it more walkable, bikeable, and livable; supporting green transportation options; switching to clean, renewable energy in our buildings; reducing consumption and waste; promoting green infrastructure and nature-based solutions; understanding and reducing climate risks; and leading through example by addressing municipal operations.
DISASTER PREPAREDNESS
BUILDING
BUILDING
MITIGATION
ADDRESS THE CAUSE
ADAPTATION ADDRESS THE IMPACTS SUSTAINABLE TRANSPORTATION
Transportation
Energy
Municipal Operations
STRATEGIES
Electrify Transportation
RESTORATION OF NATURE AREAS EQUIP COMMUNITIES FOR EXTREME WEATHER SEA
FOCUS AREA
Electrify Off-Road Mobile Sources Reduce Emissions from Energy Consumption Facilitate Building Decarbonization Increase Solar Energy Production Resource ConservationReduce Consumption and Waste Operate Sustainable Municipal Buildings Promote Green Municipal Practices Reduce Municipal VMT Integrate Climate Action and Adaptation into City Functions Green CommunityDevelop Nature-Based Solutions
Climate Risk Understand and Reduce Physical Risk Emergency ManagementIntegrate Adaptation into Emergency Preparedness and Response Resilient CommunityEducate and Protect Residents
Executive Summary Figure 6 Relationship between mitigation and adaptation actions
Executive Summary CONTINUED
Priority Actions
Because most of the CAAP actions support or reinforce the objectives of other actions, essentially all the CAAP actions need to be implemented, monitored, and achieved to reach our goal of Carbon Neutrality by 2035. However, all actions cannot be implemented at once. To assist policy makers and staff in the allocation of City resources:
• Each action includes a priority rating (Priority 1 being the highest)
• Each action includes an assessment of the action’s CoBenefits (Cost Effectiveness, Community Benefits, Economic Benefits, Aligns with State and Local Policies, Promotes Equity & Climate Justice)
• The final page of each action Focus Area contains a timeline for implementing the highest priority actions within the Focus Area.
A summary of key action items is presented in the Priority Actions by Focus Area section of the CAAP.
Implementing the CAAP
City policies and resources must first be directed to Priority 1 Actions in the Transportation and Energy Focus Areas. The faster and larger the GHG reductions made in these Focus Areas, the better chance Los Altos will have in meeting its Carbon Neutrality goal. Progress on selected Priority 1 Actions in the other Focus Areas is important while maintaining attention on Transportation and Energy. Timelines for each action are not specified in the CAAP for several reasons. Available capital
investments budget, available staff, secured outside funding, committed community partnerships and resident support for CAAP actions will determine which and how many Priority 1 Actions will be initiated and maintained each year.
The CAAP contains detailed information to assist Los Altos policy makers and staff in prioritizing and selecting actions including:
• Anticipated GHG reductions for each action (Appendix D)
• Methods and assumptions made in determining GHG reductions, cost and staff requirements (Appendix E)
• Recommended leaders, partners, estimated cost and potential funding sources and programs (Appendix F)
• A general timeline, key performance indicators and performance monitoring (Appendix G)
Maintaining flexibility in implementing the CAAP will be important. As technologies, business models, funding and political will evolve, Los Altos will need to remain flexible in when and how it implements the actions in the CAAP. Los Altos must evaluate and adjust course as necessary.
Monitoring & Reporting
Although actions may have different milestones to completion and benchmarks of success, monitoring and reporting allow implementation to be evaluated and tracked by City departments, elected officials, and the public. Monitoring the
progress towards goals and reporting on results is a critical step in implementing the CAAP.
As progress towards key targets is tracked, Los Altos may need to scale up or down its efforts depending on the results observed. The City should update the CAAP in 2025 and 2030, and report every two years on greenhouse gas emissions and progress towards goals. For monitoring and evaluation of adaptation actions, the City should conduct a debrief within one year of all hazardous events such as floods, wildfires, and severe air pollution, then adjust actions as necessary based on those findings. The City’s Environmental Commission should be able to update the CAAP during its life cycle.
Conclusion
The goals of this plan are to set the City on a path towards carbon neutrality and climate resilience. The goals are ambitious, but ones that we believe we can achieve. If we achieve these goals - carbon neutrality, equity, sustainability, resilience - we will create a community that is healthy, connected, and vibrant. Please fully participate in implementing this CAAP, and see Appendix A presenting personal actions, entitled “What Can I Do Now?" to find suggestions for simple actions each individual can take to help.
Los Altans have been planning
the

The Los Altos community has worked together to shape this vision through 2035.

It's important for the City to reduce its emissions so as to not adversely affect vulnerable communities
● PRIORITY ACTIONS
● IMPLEMENTING THE CAAP
▶▶▶ IMPLEMENTATION OVERVIEW
▶▶▶ BUDGET
▶▶▶ IMPLEMENTATION TOOLS
▶▶▶ MONITORING & REPORTING
■ MITIGATION MONITORING & REPORTING
■ ADAPTATION MONITORING & REPORTING
▶▶▶ ALIGNMENT WITH FUNDING RESOURCES
■ FUNDING IMPLEMENTATION
■ MITIGATION FUNDING SOURCES
■ ADAPTATION FUNDING SOURCES
▶▶▶ A NOTE ON CONSUMPTION-BASED INVENTORIES
▶▶▶ CONCLUSION
UNDER SEPARATE COVER
APPENDIX A
“WHAT CAN I DO NOW?” GUIDE
APPENDIX B
APPENDIX
APPENDIX
APPENDIX
APPENDIX
IMPLEMENTATION LEADS, PARTNERS, COSTS, AND FUNDING SOURCES
APPENDIX G
IMPLEMENTATION TIMELINE AND KPI s
APPENDIX H
VULNERABILITY ASSESSMENT
93 CONCLUSION
The ambitious goals of this plan are to set the City on a path towards carbon neutrality and climate resilience.

List of Figures
cycle GHG emissions of passenger car segment gasoline ICEVs, PHEVs, BEVs, and FCEVs registered in the
States in
List of Tables
▶▶▶
▶▶▶
▶▶▶
▶▶▶
▶▶▶
▶▶▶
▶▶▶
Acronyms
ABAG
Association of Bay Area Governments
ABAU
Adjusted Business-As-Usual
ADU
Accessory Dwelling Unit
BAAQMD
Bay Area Air Quality Management District
BAU
Business-As-Usual
CAAP
Climate Action and Adaptation Plan
CAP (2013) Climate Action Plan
CARB
California Air Resources Board
CBI
Consumption-Based Inventory
CCA
Community Choice Aggregation
CSMP
Complete Streets Master Plan
DCFC
Direct Current Fast Charger
EC
Environmental Commission
EV Electric Vehicle
EVSE
Electric Vehicle Supply Equipment
FEMA
Federal Emergency Management Agency
FIRM
Flood Insurance Rate Map
GHG
Greenhouse Gas
GWP
Global Warming Potential
HVAC
Heating, Ventilation and Air Conditioning
ICLEI
International Council for Local Environmental Initiatives
IPCC
Intergovernmental Panel on Climate Change
MTC
Metropolitan Transportation Commission
MTCO2e
Metric Tons of Carbon Dioxide Equivalent
NGO
Non-Governmental Organization
OES
California Office of Emergency Services
OPR
California Office of Planning and Research
PSPS
Public Safety Power Shutoff
RCP
Representative Concentration Pathway
SB 379
California Senate Bill No. 379
SVCE
Silicon Valley Clean Energy
VA
Vulnerability Assessment
VMT
Vehicle Miles Traveled
UWMP
Utility Water Master Plan
ZNE
Zero Net Energy
Acknowledgments
CITY COUNCIL
Anita Enander
Mayor
Sally Meadows
Vice Mayor
Neysa Fligor Councilmember
Lynette Lee Eng Councilmember
Jonathan Weinberg Councilmember
ENVIRONMENTAL COMMISSION
Bruno Delagneau (CAAP subcommittee)
Raashina Humayun (CAAP subcommittee)
Don Weiden (CAAP subcommittee)
Laura Teksler
Shiao-ping Lu
David Klein
Lei Yuan
CITY OF LOS ALTOS COUNCIL LIAISON
Sally Meadows
Neysa Fligor
CITY OF LOS ALTOS SUSTAINABILITY COORDINATORS
Emiko Ancheta
Laura Simpson
CAAP TASK FORCE
Kirk Ballard
Building Official
Jon Biggs
Community Development Director
Anthony Carnesecca
Economic Development Coordinator
Jamie Chew
Recreation Manager
Ann Hepenstal
Emergency Preparedness Coordinator
Manny Hernandez
Municipal Services Director
Jennifer Leal
Human Resources Manager
Donna Legge
Recreation and Community Services Director
Scott McCrossin
Captain of Police
Guido Persicone
Design Review Commission Liaison
Jim Sandoval
Engineering Services Director
COMMUNITY PARTNERS
GreenTown Los Altos
Los Altos Property Owners Downtown
Los Altos Village Association
Los Altos Chamber of Commerce
LAYCAT (Los Altos Youth Climate Action Team)
Los Altos High School (Green Team Student Club)
Los Altos History Museum
LAUSD Outdoor Educator
Orchard Commons Committee
BATS Block Action Team
Grass Roots Ecology
Los Altos Rotary Club
Parks & Recreation
Commission Liaison
Youth Commission Liaison
Complete Streets Commission Liaison
Senior Commission Liaison
THANKS TO Abby Young BAAQMD
Louie Pellegrini, Mission Trail Waste Systems
Shruti Mukhtyar, UC Berkeley, College of Natural Resources
Kasmira Kit
California Governor’s Office of Emergency Services
Rebecca Lucky
City of Menlo Park
CONSULTANTS
EcoShift Consulting
Fehr & Peers
Urban Planning Partners
Baseline Environmental Consulting
Letter from Mayor Enander
California has a long history of variable climate, drought, and wildfires. The impact of human activity is profound, and, together with the continued population growth expected in the Bay Area, compels us to act to mitigate those impacts.
The health and safety of our residents must be foremost in the actions of local government. We face several immediate needs. We must improve water conservation and find better ways to manage that precious resource. Rising sea level will impact our storm- and wastewater treatment systems and compel us to work cooperatively with the City of Palo Alto on changes needed to keep our shared wastewater treatment plant functioning. Because a single wildland fire can negate the substantial positive actions on carbon reduction, we must encourage proper management of adjacent wildlands and prevent the spread of fire into our city. In planning for significant population growth as mandated by the State of California, new ways to work and to commute are key to making continued progress on reducing GHG emissions. Increasing our tree canopy and enhancing our green spaces are essential strategies for mitigating temperature increases and sequestering carbon.

This Climate Action and Adaptation Plan documents the tremendous progress Los Altos has made since 2005, having achieved a 40 percent reduction in GHG against a target of 15 percent reduction. Our success is attributable in the government sector largely to changes in work schedule/ commute and to adoption of efficient lighting and energy consumption in city buildings. Notable in this effort was the opening of our new Community Center, built to LEED Gold standard. The Center provides an incredible community resource that demonstrates the possibilities with sustainable construction and operation. Our community also contributed with huge reductions
from changes in transportation and energy, the latter resulting substantially from the move to sustainable energy production through Silicon Valley Clean Energy.
The combination of mitigation and adaptation strategies recommended in the CAAP show the breadth of actions needed for the future. The plan wisely shows that both strategies are needed as we strive to reduce our adverse impacts and adapt to changes we cannot directly control.
The Los Altos community has worked together to shape this vision through 2035. City government can lead some efforts, but many depend on the actions of individual residents. Only through the combined actions of both can we achieve the goals set out here. Los Altos has demonstrated it can achieve what we, as a community, want to achieve. There is something here for each of us to contribute to creating a healthy, environmentally sustainable community.
Anita Enander, Mayor

Introduction DRAFT
SIXTH ASSESSMENTREPORT
Working Group I – The PhysicalScience Basis
Introduction
Human influence has warmed the climate ata unprecedented in at least the last 2000 years
CALL TO ACTION
The citizens and government of Los Altos have a long history of bold and forward-looking climate action. Since the adoption of the City’s first Green Building Ordinance in 2007, Los Altans have been planning for the sustainable use of energy, waste, water and land resources. In 2013, Los Altos’ first Climate Action Plan was released, calling for a 15% reduction in GHG emissions by 2020 as compared to 2005 levels. This update to the City's Climate Action Plan includes an adaptation section to prepare for the local impacts of climate change and represents the next step in the journey towards a sustainable, healthy, equitable future.
The next few years are incredibly important in limiting global temperature increase to 1.5°C and avoiding the most catastrophic impacts of climate change. As Figure 1 shows, warming of the planet is unprecedented since the middle of the 19th Century, and has been accelerating since the 1950s. As of 2020, the planet has already warmed by 1.1°C1. Figure 3 shows the impacts this warming has already had on our planet. By 2030 global emissions need to be halved, and carbon neutrality achieved before 2050. The longer we wait to take action, change will become increasingly expensive and will eventually be impossible.
GLOBAL WARMING
TRENDS
Changes in global surface temperature relativeto 1850
IPCC Sixth Assessment Report, pg. SPM-7.
According to the most recent report from the Intergovernmental Panel on Climate Change (IPCC), the Earth has warmed 1.09°C since 1850 and many changes such as sealevel rise and glacier and arctic ice melt are now virtually irreversible1 . Global temperatures are likely to increase to a total of 1.5°C by the mid-2040's which will further stress our environmental systems and result in Los Altos experiencing more
frequent and more intense heat waves, winter floods, drought and wildfire air pollution events. On a global level, we are rushing to find solutions, but the most effective solutions that will be developed are at the local level. Although Los Altos has taken action to mitigate emissions produced locally, we can do more and need to do more.
Here in Los Altos, we are already
1 IPCC, 2021: Climate Change 2021: The Physical Science Basis. Contribution of Working Group I to the Sixth Assessment Report of the Intergovernmental Panel on Climate Change [Masson-Delmotte, V., P. Zhai, A. Pirani, S.L. Connors, C. Péan, S. Berger, N. Caud, Y. Chen, L. Goldfarb, M.I. Gomis, M. Huang, K. Leitzell, E. Lonnoy, J.B.R. Matthews, T.K. Maycock, T. Waterfield, O. Yelekçi, R. Yu, and B. Zhou (eds.)]. Cambridge University Press. In Press.
Figure 1 Global Warming trends
Source:
Introduction
facing periods of severe drought, heat waves, and poor air quality more frequently. We’ve seen wildfires in the hills and the air darkened with smoke. We are not insulated. While some responses will need to be coordinated regionally, it is important for Los Altos to take quick and effective action locally if we want to maintain our quality of life. The good news is that strong and sustained transition from combustion engines and moving away from methane gas for heating our buildings could quickly make air quality better and in 20 to 30 years global temperatures could stabilize.
A five-step Climate Action Planning process was described in the 2013 CAP, which has been followed here and is shown in Figure 2. By including a Vulnerability Assessment and climate adaptation strategies in this plan, the City now has a comprehensive set of actions designed to both reduce our greenhouse gas emissions and prepare our community for the future impacts of climate change. This updated Climate Action and Adaptation Plan (CAAP), will help guide the City’s actions into the coming decade and beyond.
In the end, we believe Los Altos can achieve its climate goals within the next 15 years if we take an aggressive approach. Following the guidance in this plan, we need to commit wholeheartedly to these actions and get them underway as soon as
THE FIVE-STEP CLIMATE ACTION PLANNING PROCESS
5 EVALUATE PROGRESS
1 INVENTORY EMISSIONS
4 IMPLEMENT MEASURES
2 ESTABLISH A REDUCTION TARGET 3 ADOPT MEASURES TO ACHIEVE TARGET
possible. To guide this effort, the City has developed these Vision and Mission statements.
VISION
“To place Los Altos on an accelerated, sustainable path to carbon neutrality by advancing bold and effective climate policies.”
MISSION
“The mission of our Climate Action and Adaptation Plan is to preserve the unique character of Los Altos and enhance its natural environment while improving the quality of life and health of its people by supporting transformative change in the areas of climate action, resilience and equity.”
Figure 2 The Five-Step Climate Action Planning Process
BACKGROUND
The City’s 2013 Climate Action Plan was designed to serve as a guiding document towards GHG reductions, both in municipal operations and community-wide. It was designed as a comprehensive strategy to reduce emissions in a manner consistent with state guidelines and regulations, and to identify costeffective opportunities for existing and future residents, businesses, and development projects for a more sustainable community. At the same time, the CAP provided a framework for environmental leadership and an educational resource to the community.
This update provides a pathway to the City’s bolder GHG reduction
SIXTH ASSESSMENT REPORT
target, as well as a framework for a climate-resilient community. The goals of this CAAP are:
• Reduce greenhouse gas (GHG) emissions
• Increase climate resilience (SB 379 compliance)
• Demonstrate leadership
The Los Altos Sustainability Coordinator and Environmental Commission (EC) oversaw the development of the CAAP. In addition, a City-led climate Task Force made up of department heads and City employees was assembled to provide expert input and guidance. Together, these groups helped ensure the CAAP is realistic, feasible, and relevant to the residents of Los Altos.
POLICY BACKDROP
There are many international, national, State, and local policies and regulations designed to affect climate change and sustainability, and this CAAP was developed with those policies and regulations as a guide. This way, the City ensures it’s doing its part to help meet larger-scale goals and support science-based targets. By developing the Vulnerability Assessment and Adaptation Framework included in this plan, the City also helps meet its SB 379 compliance requirements. Table 1 describes the most relevant State policies affecting climate action planning for cities.
IMPACTS OF CLIMATE CHANGE




LegislationYearName
LegislationYearName
AB 32 2006
AB 32 2006
SB 32 2016
STATE POLICIES
Description
Description
CA Global Warming Solutions Act of 2006
CA Global Warming Solutions Act of 2006
CA Global Warming Solutions Act: emissions limit
SB 32 2016 CA Global Warming Solutions Act: emissions limit
EO B-55-182018
EO B-55-182018
Executive Order to Achieve Carbon Neutrality
EO B-16-122012ZEV Mandate
Requires CARB to adopt a statewide greenhouse gas emissions limit equivalent to the statewide greenhouse gas emissions levels in 1990 to be achieved by 2020.
Requires CARB to adopt a statewide greenhouse gas emissions limit equivalent to the statewide greenhouse gas emissions levels in 1990 to be achieved by 2020.
Requires CARB to ensure that statewide greenhouse gas emissions are reduced to 40% below the 1990 level by 2030.
Requires CARB to ensure that statewide greenhouse gas emissions are reduced to 40% below the 1990 level by 2030.
Calls for carbon neutrality by 2045.
Executive Order to Achieve Carbon Neutrality Calls for carbon neutrality by 2045.
EO B-16-122012ZEV Mandate
EO B-30-152015
EO B-30-152015
Executive Order to Achieve Carbon Neutrality
AB 1493 (Pavley I)2002Automobile Emission Standards
Executive Order to Achieve Carbon Neutrality
AB 1493 (Pavley I)2002Automobile Emission Standards
SB 379 2015 Climate Adaptation and Resiliency Strategy
SB 379 2015 Climate Adaptation and Resiliency Strategy
SB 350 2015 Clean Energy and Pollution Reduction Act of 2015
SB 350 2015 Clean Energy and Pollution Reduction Act of 2015
SB 100 2018CA Renewables Portfolio Standard
SB 100 2018CA Renewables Portfolio Standard
SB 1383 2016 Short-Lived Climate Pollutant Reduction Strategy
SB 1383 2016
AB 398 2017
AB 398 2017
SB 535 2012
SB 535 2012
Short-Lived Climate Pollutant Reduction Strategy
Requires State agencies to facilitate the rapid commercialization of zero-emission vehicles (ZEVs).
Requires State agencies to facilitate the rapid commercialization of zero-emission vehicles (ZEVs).
Sets interim target of greenhouse gas emissions 40% less than 1990 levels by 2030.
Sets interim target of greenhouse gas emissions 40% less than 1990 levels by 2030.
State law requiring the first set of greenhouse gas emission standards for passenger vehicles.
State law requiring the first set of greenhouse gas emission standards for passenger vehicles.
Requires all cities and counties to include climate adaptation and resiliency strategies in the safety elements of their general plans.
Requires all cities and counties to include climate adaptation and resiliency strategies in the safety elements of their general plans.
Requires electricity providers, investor-owned utilities, and CCAs to increase their procurement of renewable generated electricity to 50% by 2030.
Requires electricity providers, investor-owned utilities, and CCAs to increase their procurement of renewable generated electricity to 50% by 2030.
Sets a target of 100 percent carbon-free electricity by 2045.
Sets a target of 100 percent carbon-free electricity by 2045.
Legislation requiring reductions in emissions of short-lived climate pollutants (like methane) by 40-50% below 2013 levels by 2030.
Legislation requiring reductions in emissions of short-lived climate pollutants (like methane) by 40-50% below 2013 levels by 2030.
Law extending California’s cap-and-trade program through 2030
Law extending California’s cap-and-trade program through 2030
Legislation requiring the state to direct at least 25% of state cap-and-trade revenues to go to projects that
Legislation requiring the state to direct at least 25% of state cap-and-trade revenues to go to projects that
Executive Order Establishing 2030 Emissions Target state cap-and-trade revenues to go to projects that benefit disadvantaged communities
SB 375 2008 Sustainable Communities and Climate Protection Act Directs CARB to set regional targets for GHG reductions from passenger vehicles
SB 743 2013
SB 375 2008 Sustainable Communities and Climate Protection Act Directs CARB to set regional targets for GHG reductions from passenger vehicles
SB 743 2013
Updates the way transportation impacts are measured in California for new development projects
Updates the way transportation impacts are measured in California for new development projects
Table 1 Relevant State policies affecting climate planning in California.
Introduction
ALIGNMENT WITH CITY PLANS AND POLICIES
The CAAP was designed to be consistent with the City’s General Plan and other relevant planning documents, including the Complete Streets Master Plan, Downtown Vision, Emergency Operations Plan, Green Stormwater Infrastructure Masterplan and Local Hazard Mitigation Plan. This document builds off the policies and programs in those plans.
In addition, the CAAP must be updated periodically to remain consistent with updates to the City’s General Plan Elements and other plan and policy updates.
DEVELOPING THE CAAP
The CAAP was developed through a multi-stakeholder process involving the Los Altos Environmental Commission, heads of City Divisions and Departments, and the public. Community input and feedback were crucial to the climate action and adaptation planning process, and the City conducted a robust outreach and engagement process to solicit input and feedback. The City hosted a series of focus groups and workshops, administered surveys, and embarked on a public education campaign through existing communication channels. Feedback from the focus groups, surveys, and community workshop showed that most Los Altos residents are concerned about the effects of climate change and support climate action, with 74% of respondents saying they were very concerned about climate change.
HOW TO ACHIEVE CARBON NEUTRALITY
4 Achieving carbon neutrality
Based on the City’s current and forecasted greenhouse gas emissions, guidance from City government, and community input, the City has elected to pursue a goal of Carbon Neutrality by 2035. This will entail reducing as many emissions as possible produced by the City and its residents, sequestering as many remaining emissions as possible through nature-based solutions, and utilizing innovative carbon sequestration solutions, community-based sequestration projects, and local carbon offsets to reach zero net emissions. A bold goal aligns us with the latest science and puts us on a path for a sustainable, equitable, healthy future. Figure 4 displays the steps needed to achieve carbon neutrality.
EQUITY AND CLIMATE JUSTICE
Equity and climate justice are important considerations as the City sets about pursuing its goals. There
are several populations within Los Altos that are more vulnerable to the effects of climate, including:
• Senior citizens
• Children
• Individuals with mobility issues
• Individuals with language barriers
• Day workers
• Homeless populations
• Individuals with chronic respiratory or heart conditions
It’s also important to note that the impacts of climate change are not evenly distributed. Globally, the effects of air and water pollution, extreme heat, and sea level rise fall disproportionately on disadvantaged communities who are largely not responsible for creating the majority of the GHG emission. Therefore, it's important for the City to reduce its emissions so as to not adversely affect these communities.
Figure

Our Impacts
Our Impacts
The City’s 2013 Climate Action Plan detailed 41 actions which, taken together, were designed to reduce emissions 15% by 2020 compared to 2005 levels. 1990 is the baseline year used by the State of California, but as municipalities often lack highquality data going this far back, 2005 is often chosen as the baseline year. The progress of these actions was tracked and, to date, we have begun or fully implemented 29 actions and designated two other actions for
future implementation. Some actions were deemed infeasible and have either been revisited for this update or removed from the list.
An updated greenhouse gas inventory was conducted as part of this update, the purpose of which was to understand the present state of environmental impacts and to establish a baseline for the forecasting of future emissions. Los Altos’ 2018 inventory is actually
composed of two inventories, one for the community and one for municipal operations. ICLEI - Local Governments For Sustainability provides protocols for both, which were used for these inventories. Table 2 describes the activity data and sources of data used. Details of the data, methodology and calculations used in the 2018 inventory can be found in Appendix E.
Scaled based on households growth
Our Impacts CONTINUED
As Table 3 shows, emissions were reduced from 184,725 metric tons in 2005 to 111,320 metric tons in 2018, a reduction of 40 percent. This far exceeds the 15 percent target
Comparison table
reduction outlined in the 2013 plan. These reductions can be attributed to the actions taken by the City such as supporting energy efficiency and the
adoption of electric vehicles, as well as the City becoming a member of Silicon Valley Clean Energy in 2017.
Our Impacts
Table 4 provides an overview of the most impactful actions from the 2013 CAP, measured in terms of projected 2020 GHG reductions.
2013 ACTION
CAP 2013 Action
Construct all bikeways and implement all programs identified in the 2012 Bicycle Transportation Plan by 2020
Develop and fully implement a pedestrian master plan with specific focus on local vehicle trip reduction by 2020
Continue to pursue and implement Safe Routes to School Projects
Continue to implement the City's Complete Streets policy and traffic calming plans and projects
Work with the Santa Clara Valley Transit Authority (VTA) to seek opportunities to expand local service to improve connectivity to regional transit options.
Encourage alternative-fuel vehicle charging stations in existing private development.
Amend the Green Building Ordinance to include EV prewiring requirements and encourage EV charging installations in residential development.
Amend the Green Building Ordinance to require EV charging stations in nonresidential projects greater than 10,000 square feet.
Provide outreach and educational materials for energy conservation and renewable energy programs targeted at outdoor amenities (e.g., lighting, swimming pools, hot tubs).
Ensure city residents are eligible to participate in and actively promote and support energy efficiency financing for residential and commercial properties.
Continue to encourage the installation of energy-efficient indoor and outdoor appliances and equipment (e.g., pool pumps).
Maintain and expand food waste diversion programs.
Continue to encourage recycling and reuse of building materials.
Continue to support implementation of the 2010 UWMP through enforcement of the Water Efficient Landscape Ordinance (LAMC 12.36) and distribution of greywater/rainwater harvesting guides.
Audit appropriate City facilities and conduct comprehensive energy efficiency upgrades, including installing energy-efficient lighting, appliances, and heating, ventilation, and air conditioning systems.
Adopt a zero-waste policy for City facilities and City Sponsored events.
Our Impacts
Figures 5-8 below show the breakdown of emission sources in 2005 and 2018 for municipal operations and the community. Overall, emissions associated with transportation make up a slightly larger share in 2018 as emissions from energy use and other sectors have declined.
2005 GOVERNMENT
2018 GOVERNMENT
Figure 7 2018 Government emissions sources
Figure 5 2005 Government emissions sources
Figure
Figure 8 2018 Community emissions sources

Climate Impacts
Climate Impacts
A climate Vulnerability Assessment was conducted to determine the increasing climate threats the City is likely to face, as well as assess the City’s preparedness and capacity to address those threats. Following International, U.S., and California Climate Assessments, this report is the first to consider Los Altos on its own. The Vulnerability Assessment is included in this report as Appendix H.
To assess Los Altos’ expected climate changes, global climate models developed by the scientific community and recommended by the California Governor’s Office of Emergency Services (OES) were used. The online Cal-Adapt tool was used to create local outputs and predict how the frequency and intensity of climate hazards are changing. This was cross-referenced against California’s Fourth Climate Assessment Bay Area Report, other scientific and government papers, and the local knowledge of the Environmental Commission CAAP Subcommittee members and focus group participants.
ANNUAL AVERAGE MAXIMUM TEMPERATURE
Average of all the hottest daily temperatures in a year.
SIXTH ASSESSMENT REPORT
Figure 9 Annual average maximum temperatures in Los Altos (image from Cal-Adapt)
Working Group I – The Physical Science Basis
SIXTH ASSESSMENT REPORT
Changes to the Water cycle
Working Group I – The Physical Science Basis
CHANGES TO THE WATER CYCLE
With warmer temperature
Atmosphere



Changes to the Water cycle
With warmer temperature



Atmosphere can hold more water
Atmosphere can hold more water
More and faster evaporation
More and faster evaporation
Heavier precipitation
Heavier precipitation
Even with the bold emissions reductions at a local level detailed in the CAAP, Los Altos is subject to how significantly or poorly emissions are reduced globally. The increase in global emissions will cause Los Altos to experience increased heat waves, floods, drought, and poor air quality from wildfires in the region. Because Los Altos is not coastal it will not experience sea level rise, and because of our proximity to the Pacific Ocean and San Francisco Bay, we will continue to benefit from the climate moderating influences of those water bodies. As a result, Los Altos will not suffer some of the extremes of climate change as directly as some other areas in California.
Atmosphere Frozen

Figure 10 Changes to the water cycle due to climate change.
Source: IPCC Sixth Assessment Report Working Group 1– The Physical Science Basis presentation, slides 35.
Climate Impacts
Instead, Los Altos will experience the reverberations from the impacts of climate change on the natural environment, the water supply system, air quality, and the energy grid which are beyond the municipal boundary but on which we depend. So the availability and affordability of water and energy within Los Altos are likely to be jeopardized by climate change across the Bay Area and California as a whole. Figure 9 displays the temperature change projections for Los Altos, and Figures 10 and 11 describe expected global changes to the water cycle.
Within Los Altos itself, by mid-century particularly under a high emissions scenario, the number of extreme heat days are projected to increase substantially, from an average of 4 days/year from 1961-1990 to as many as 20 days/year. Heat and poor air quality from wildfires outside of Los Altos are likely to impact the quality of life, particularly for vulnerable populations, and increase energy demands for additional building air cooling and filtering. Extreme heat, poor air quality, and blackouts or Public Safety Power Shutoffs (PSPS) that occur simultaneously will present novel emergency situations that have the potential to strain or overwhelm City resources.
Similarly but more uncertain will be the resilience of Los Altos' natural and maintained landscapes. The annual precipitation amounts in Los Altos are not likely to change, but will become less consistent. As a recent example, Sacramento recorded 7.87 inches during the 2020-2021 water year
SIXTH ASSESSMENTREPORT
Changes to the Water cycle
CHANGES TO THE WATER CYCLE


More global warming
Heavier rainfall
Intensifying dry seasons and droughts Atmosphere Frozen regions
Figure 11 Changes to the water cycle due to climate change continued. Source: IPCC Sixth Assessment Report Working Group 1–The Physical Science Basis presentation, slides 36.
which ended on October 1, 2021, only to receive a daily record 5.44 inches on October 25, 2021. Such seasonal whiplash shows the limits of reading only annual averages. In combination with expected temperature increases, the amount of water that plants will need during extended, dry summers will also increase, possibly changing the vegetation composition of the area. Considering pressures on the shared water supply system which Los Altos relies on, it is likely that water customers will face financial incentives and regulatory pressure to reduce daily water use.
In the winter and spring, seasonal storms which Los Altos has experienced in the past are likely to continue. Extreme precipitation events (1-day maximums) that used to occur once every several years are projected to occur multiple times a year by the end of the century, increasing the need for maintenance and repair of stormwater
infrastructure on building sites and across the City, as well as increasing the risk of flooding requiring more acute management of potential flood zones.
After living through years of drought and the COVID pandemic, Los Altos’ government, residents, and businesses have unfortunately become familiar with environmental hazards. Emergency preparedness and hazards requiring large-scale adjustment and intervention in some ways will help Los Altos adapt to climate change. The scale of climate change and the need to reach new vulnerable populations during heat waves, unsafe air quality days or power outages present new challenges, though. These challenges are addressed through a suite of adaptation strategies and the Implementing the CAAP section of this plan.

Looking to 2050
Looking to 2050
To determine what the City’s emissions might look like in 2050, a series of emissions forecasts were developed. First a Business-As-Usual (BAU) forecast was developed to forecast the City’s emissions without any additional action from federal, State, or local governments. A series of growth factors such as population and household growth were applied to the City’s baseline emissions, with the results shown below.
Without any additional action, the City’s emissions are expected to increase from 111,320 metric tons in 2018 to 116,346 metric tons in 2050.
To project the City’s emissions in 2050 including the expected impacts of State and local actions, an Adjusted Business-As-Usual (ABAU) forecast was developed. This forecast, shown in Figure 13, includes expected increases in fuel economy and building energy efficiency in California, increased EV adoption
BAU FORECAST (2018-2050)
ADJUSTED BAU FORECAST (2018-2050)

Looking to 2050
in Los Altos (to 60% EV), and the expected increase in air conditioning use due to increased temperatures related to climate change.
This figure shows that, with the inclusion of State and local actions, electric vehicle adoption increases, and increase in AC use, the City’s emissions are expected to decline from 111,320 metric tons in 2018 to 70,800 metric tons in 2050.
Including the impacts of 2013 CAP actions, we will need to reduce our emissions by approximately 67,000 metric tons by 2035 to reach our carbon neutrality goal. Table 5 below shows historic and projected emissions under different scenarios, and Figure 14 displays the emissions reductions expected to be achieved in each Focus Area if the CAAP is fully implemented.
EMISSIONS TIMELINE BY SCENARIO (MTCO2E)
Emissions Timeline by Scenario (MTCO2e)
Scenario BAU
ABAU
ABAU+Existing CAP '13
CAAP 2022
1Historic Data (data for 2006-2017 not available; 111,320 MTCO2e used as the baseline for all scenarios)
2Projected data based on models

Table 5 Emissions by Scenario (2030 & 2035)
Figure 14 Emissions reductions by Focus Area

Strategic Roadmap
Strategic Roadmap
To propel the City towards its goals of becoming more resilient and carbon neutral, a strategic roadmap of Strategies, Goals and Actions was developed. This roadmap is intended to guide us through the priorities, action steps, when to take them, and the level of effort and benefits that can be achieved by implementing them.
The roadmap is broken into three sections:
• Mitigation strategies
• Cross-cutting strategies (that deliver both mitigation and adaptation outcomes)
• Adaptation strategies
Mitigation strategies are aimed at reducing the sources of emission that arise from within the City’s borders. This includes emissions from energy consumed, transportation, waste
created, and resources used. To achieve global climate goals, richer countries will need to do more on average than poorer countries. This is not only equitable, but richer countries have the means to do so. Within richer countries, more affluent communities are expected to do even more. Within Los Altos, the lack of heavy industry and large office buildings will make reducing GHG emissions easier to achieve.
By reducing the sources and intensity of the emissions, we hope to align with and go beyond global climate goals in order to reverse the harmful effects of climate change.
While mitigation aims to lessen GHG emissions, thereby reducing climate change, adaptation aims to lessen the impact of climate change. In other words, mitigation addresses the cause
of climate change and adaptation addresses the impacts of climate change - the effect of heat, drought, air pollution and extreme storms on Los Altos. Mitigation and adaptation are inclusive, as everything interacts with climate.
Cross-cutting efforts address both mitigation and adaptation. Many actions the City can take, like increasing the urban tree canopy, reducing water use, and developing community microgrids reduce the source of emissions and help prepare the City for climate change impact or emergencies. Similarly, the effects of climate change can have the opposite effect if increases in heat or drought lead to increased energy use or resource intensity. Figure 15 describes the relationship between mitigation, adaptation, and crosscutting strategies.
MITIGATION
ADAPTATION
Figure 15 Relationship between mitigation and adaptation actions
Strategic Roadmap
In general, mitigation and adaptation strategies should be viewed as two sides of the same coin. Together, they represent a comprehensive set of actions to address climate change.
DEVELOPMENT & METHODOLOGY
Through quantitative and qualitative analysis, stakeholder engagement, and a survey of best practices, 68 actions were identified. Some of the actions build off existing efforts within Los Altos like the 2013 CAP and the 2018 Green Infrastructure Stormwater Management Plan. Most are new strategies adopted and altered from other California CAAPs and programs beyond California. Others were developed based on discussions with different stakeholder groups.
CAAP Strategy Development Process:
• Preliminary mitigation and adaptation strategies identified and agreed upon
• Development of “Long List” of CAAP actions to implement each strategy
• Community and stakeholder feedback
• Development of “Short List” of CAAP actions
• Quantify emission reductions from actions
Figure 16 displays the Focus Areas encompassing mitigation, adaptation, and cross-cutting strategies. The mitigation strategies were selected using a multi-factor scoring system, as well as through qualitative evaluation. The strategies were modeled using ICLEI’s ClearPath tool, which allows
CLIMATE ACTION PLAN FOCUS AREAS
rapid scenario analysis of different actions and implementation times.
All of the adaptation strategies respond to the vulnerabilities determined in the Vulnerability Assessment - that is the climate events that Los Altos is expected to experience and the ability of the people, businesses, environment, and government of Los Altos to manage those events. As an example, it was determined that some of Los Altos’ population are seniors who are vulnerable to wildfire-induced Public Safety Power Shutoffs (PSPS) because of a combination of health conditions and mobility limitations. Actions
to address this population include developing an early warning system for air pollution, conducting outreach specifically to vulnerable populations, and developing resilience hubs, as described in the Climate Adaptation Strategies section.
The adaptation strategies were catalogued according to the climate hazard they addressed (drought, heat, flood, wildfire & air pollution), as well as their feasibility, their cost effectiveness, whether they would promote equity, the potential for greenhouse gas reductions, their alignment with City priorities, and other factors.
Figure 16 CAAP Focus Areas
Mitigation Strategies
These greenhouse gas mitigation strategies are designed to cover all sources of emissions from within the City, including transportation, energy, resource conservation, green community, and municipal operations. Although the sectors vary in the amount of emissions created, a comprehensive, broad-based set of strategies addressing all sectors will improve the effectiveness of the plan and increase co-benefits.
A series of Prioritization Scores were developed based on a number of factors including community impact, feasibility, GHG reductions, and projected cost and FTE requirements. These scores indicate the relative importance of the action, 1 being the highest and 3 being the lowest, and can be found underneath each action description.
Important information and details on each action for each goal within each strategy and Focus Area are contained in the Appendices, found under separate cover.
Appendix A: “What Can I Do Now?” guide
Appendix B: CAAP Fact Sheet
Appendix C: Glossary
Appendix D: Actions List
Appendix E: Technical Appendix
Appendix F: Implementation Leads, Partners, Costs, and Funding Sources
Appendix G: Implementation Timeline and KPIs
Appendix H: Vulnerability Assessment

FOCUS AREA 1 TRANSPORTATION
Transportation is the largest source of emissions within Los Altos (58% of all emission), therefore reducing fossil fuel vehicle travel is imperative. By increasing active transit and helping create a walkable and bikeable city, public health and social connectivity will be increased. The strategies and actions in this section are designed to make alternatives to single-occupant, fossil fuel trips easy, convenient, and
STRATEGY 1
Reduce SingleOccupancy Vehicle Travel
Reduce 2018 fossil fuel VMT generated by Los Altos by 25% by 2035
attractive to residents and visitors. The remaining vehicle travel, over time, will shift to a majority electric. Figure 17 describes the life cycle benefits of EVs.
As the City has set an aggressive VMT reduction target, participation by all community members will be required to achieve it.
STRATEGY 2
Electrify Transportation
Increase EV component of all light duty vehicles in Los Altos to 80% by 2035
STRATEGY 3
annual mileage decreases linearly with about 500 km/a each year (U.S. Department of Transportation, 2017). Accordingly, the fuel and electricity mix in the first years has a higher impact on the total GHGs than the mixes close to the vehicles’ end of life.
LCA results and discussion
Electrify Off-Road Mobile Sources
Eliminate Off-Road fossil fuel engines
Figures 4.1 and 4.2 present the life-cycle GHG emissions in g CO2 eq. /km of new gasoline ICEVs, PHEVs, BEVs, and FCEVs in the passenger car and SUV segment. They mostly correspond to the production of the fuel or electricity (WTT) and the emissions of fuel consumption directly in the vehicle (TTW) during the vehicle use phase. For the methane emissions, mostly of natural gas production, also the near-term, 20-year GWP is indicated. The figures further include the GHG emissions of the production of the battery, the hydrogen system, and the rest of the vehicles and of maintenance.
LIFE-CYCLE GHG EMISSIONS
20-year GWP for methane
Fuel/electricity production
Fuel consumption
Maintenance
Hydrogen tank manufacture
Battery manufacture
Vehicle manufacture
Current policies vs Paris Agreement-compatible electricity mix
Figure 4.1. Life-cycle GHG emissions of passenger car segment gasoline ICEVs, PHEVs, BEVs, and FCEVs registered in the United States in 2021.
Figure 17 Life-cycle GHG emissions of passenger car segment gasoline ICEVs, PHEVs, BEVs, and FCEVs registered in the United States in 2021.
Source: International Council on Clean Transportation, A Global Comparison of the Life-Cycle Greenhouse Gas Emissions of Combustion Engine and Electric Passenger Cars, pg. 33.
20-year GWP for methane
Fuel/electricity production
Fuel consumption
Maintenance
Hydrogen tank manufacture
Battery manufacture
Vehicle manufacture
Current policies vs Paris Agreement-compatible electricity mix
STRATEGY 1 Reduce City-Wide Vehicle Miles Traveled
TRANSPORTATION
GOAL 1.1 CREATE A WALKABLE AND BIKEABLE CITY ACTION
1.1 A
1.1 B
Fully implement the 2022 Complete Streets Master Plan by 2035 and make adjustments as needed to comply with VMT reduction objectives
Work closely with Complete Streets commission to fully implement the 2022 Complete Streets Master Plan by 2035, with a focus on specific measures to reduce VMT. Reassess the development of specific citywide protected bike corridors. Maintain and expand access to businesses while promoting slow streets with biking and walking access. Improve the safety and attractiveness of walking downtown through traffic calming, dedicated pedestrian trails and streets, accelerating the development of green downtown plazas, and other strategies. Fully implement all Safe Routes to School programs in the CSMP. Consider an ordinance to reduce speed limits.
1.1 C
PRIORITY: 2
Create a pedestrianfriendly Downtown and other community and commercial spaces throughout the city
PRIORITY: 1
Develop and implement a new Parking Management Plan that supports strategic VMT reduction
1.1 D
PRIORITY: 1
Pilot shared bike, ebike, and escooter programs, and partner with adjacent cities to improve first/last mile options
PRIORITY: 2
CO-BENEFITS:
Establish Car-Free zones and one-way traffic Downtown and in other commercial and community areas to encourage non-vehicular travel. Expand sidewalk space and dedicate specific streets for pedestrian and cycling use only. Create safe, sheltered, outdoor areas for pedestrians and increase the number of bicycle racks for cyclists. Base development on 15-minute city principles.
CO-BENEFITS:
Develop and implement a community-wide Parking Management Plan that reduces minimum requirements and sets upper limits on parking spaces for new development. Ensure the strategy is based on three principles: increasing dedicated EV and handicapped parking spaces in key commercial areas, reducing the parking footprint (turn into green space), and add specific drop-off and pick up zones at strategic locations. Plan for street and parking lot changes to accommodate conversion to passenger pick-up and drop-off stops at commercial and other public land use locations.
CO-BENEFITS:
Develop pilot bike, ebike and escooter sharing programs by 2025. Expand programs by 2030 based on lessons learned. Explore regulations to promote the safe and responsible operation of ebikes and escooters including issuing permits to private companies and designating dedicated parking spaces at key locations. Partner with adjacent cities to enable first/last mile travel shuttles to train stations/commuter hubs, including regional networks of ebike, scooter, shuttle, and Transit Network Company routes.
CO-BENEFITS:
STRATEGY 1 Reduce City-Wide Vehicle Miles Traveled
TRANSPORTATION
GOAL 1.2 PROMOTE SMART GROWTH STRATEGIES
1.2 A
ACTION
Support TransitOriented Development
PRIORITY: 1
Encourage Live Near Work incentives
1.2 B
1.2 C
PRIORITY: 1
Promote Work From Home policies and infrastructure
PRIORITY: 1
Require increased residential and commercial density and diversity along main corridors and commercial areas, including affordable multi-family housing and mixed-use developments. Encourage Transit-Oriented Development along major bus routes within and outside of the City to attract new employers and better serve the daily needs of residents and employees. Set a target of at least a 20% increase in the percent of the city’s population living in high-density Transit-Oriented Development by 2035. Integrate with the City’s Housing Element (ensure meeting RHNA commitments encourages high-density & affordable housing in transit-accessible/walkable areas).
CO-BENEFITS:
Work with Los Altos employers and schools to develop a plan to provide affordable housing or rent assistance for employees to live close to work. Ensure new low-income and multi-use development is high density housing located no more than a 10-minute walk or bike ride from transit stops.
CO-BENEFITS:
Require new multifamily residential developments with 10 or more units to provide Work From Home spaces. Support future conversion of commercial developments to residential uses as appropriate. Work with local Wi-Fi providers to expand coverage and speed.
CO-BENEFITS:
STRATEGY 1 Reduce City-Wide Vehicle Miles Traveled
TRANSPORTATION
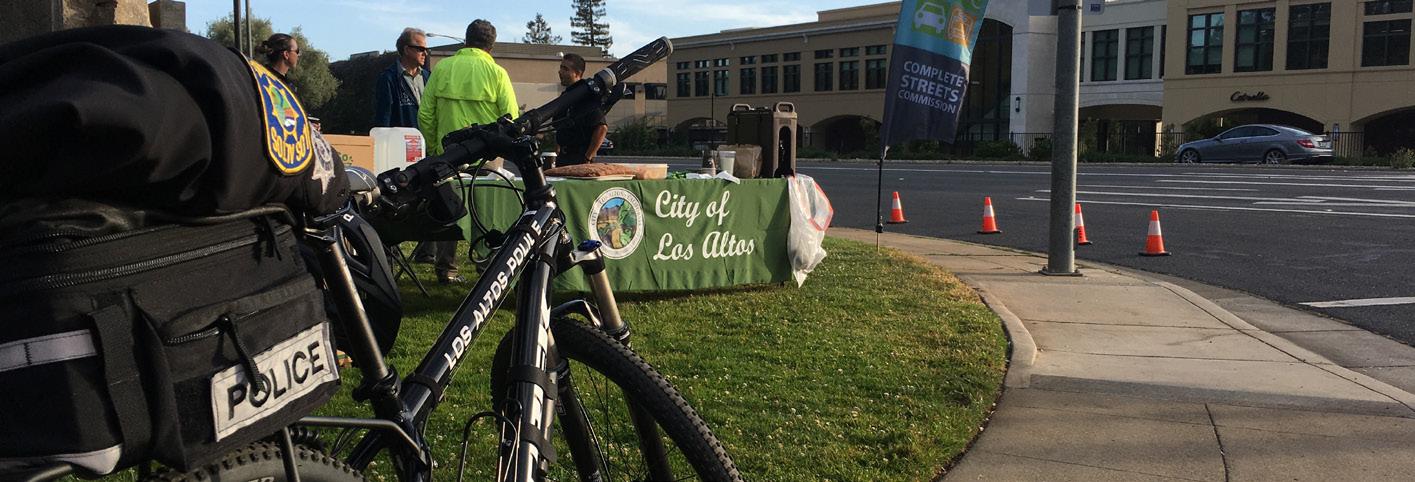
GOAL 1.3 SUPPORT SHARED MOBILITY ACTION
1.3 A
1.3 B
Develop an electric shuttle program as an alternative to SOV travel
PRIORITY: 1
Expand transit service, connectivity, and transit stop amenities
Work with local public and private organizations to develop an electric shuttle program for cross-town traffic, including "short hops" along main streets and key commercial areas. Explore autonomous options when the program is mature and expand as needed.
CO-BENEFITS:
Engage with transportation partners like VTA to expand zero emission transit service in City limits. Explore the creation of shaded and green commuter amenities and increased bicycle parking in order to help promote a public transit culture. Develop a green mobility app that allows users to check on EV shuttle routes and arrival times, see where available bikes and scooters are and potentially reserve directly on the app. Include VTA transit routes and schedule, location of EV chargers and whether they’re free. Provide City funding or seek other funding sources to support these efforts.
1.3 C
1.3 D
PRIORITY: 2
Require commercial Transportation Demand Management programs
1.3 E
PRIORITY: 2
Work with Los Altos School Districts to reduce VMT
CO-BENEFITS:
Implement, mandate, enforce, actively promote, and use Transportation Demand Management strategies (TDM is defined as a set of strategies aimed at maximizing traveler choices). Require new nonresidential developments greater than 10,000 square feet or anticipated to include businesses with more than 50 employees to reduce VMT through TDM programs.
CO-BENEFITS:
Support a rotating car-free day program at local schools and as part of other local events to raise awareness about school commute alternatives. Encourage partnerships with private schools to develop and implement school bus programs that reduce school-related SOV commutes. Work with School Districts in Los Altos and surrounding cities (Mountain View, Palo Alto, Cupertino, Los Altos Hills) to encourage EV shuttle service for students living >1mile from their neighborhood schools.
PRIORITY: 3
Develop and promote community carshare and carpool programs
PRIORITY: 2
CO-BENEFITS:
Explore opportunities with carsharing companies to add or expand service in Los Altos. Develop a target number of shared cars available to individuals. Mandate that all shared vehicles be EV. Follow progress of shared autonomous vehicle testing regionally and consider developing ordinances and policies to guide shared AV use in City limits.
CO-BENEFITS:
STRATEGY 2 Electrify Transportation
TRANSPORTATION
GOAL 1.4 REACH 80% COMMUNITY-WIDE ELECTRIC VEHICLE ADOPTION BY 2035
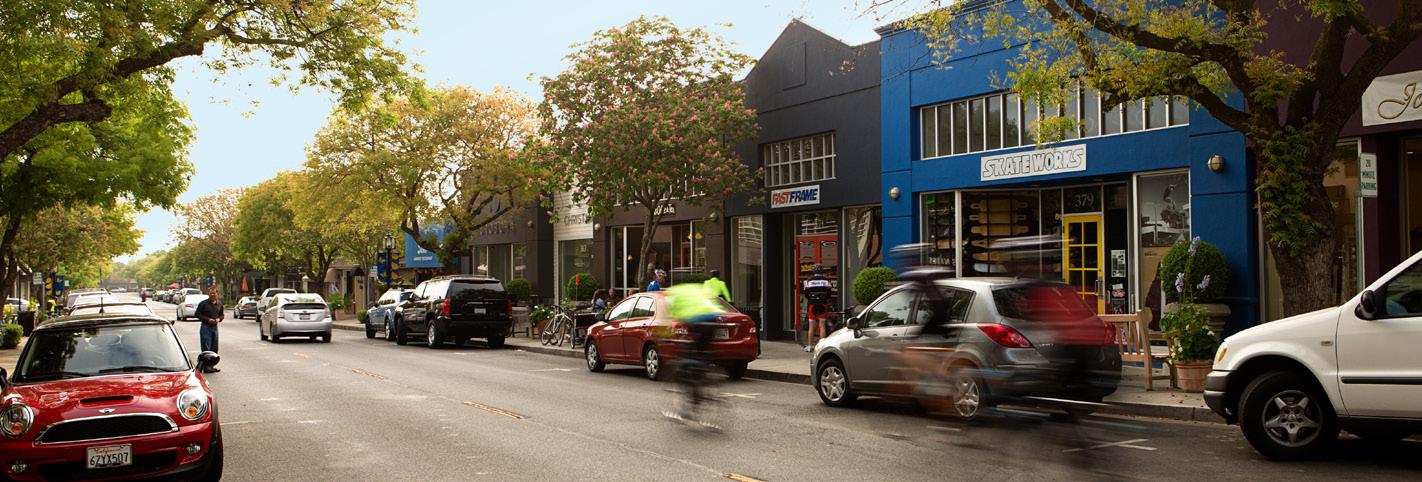
ACTION
1.4 A
GOAL 1.5 ACCELERATE COMMUNITY-WIDE ELECTRIC VEHICLE SUPPLY EQUIPMENT SUFFICIENT TO SUPPORT 80% EVs
1.4 B
Increase education and awareness of available EV resources and incentive programs
PRIORITY: 2
Actively promote EV adoption and require EV-only parking
PRIORITY: 1
ACTION
1.5 A
1.5 B
Increase the number of available Level 2 EV charging stations in workplace, commercial and multifamily areas
PRIORITY: 2
Create a citywide network of DC Fast Charging (DCFC) stations
PRIORITY: 2
1.5 C
1.5 D
Expand the current Electric Vehicle charging and prewiring requirements in future Reach Code updates
PRIORITY: 1
Identify grants and incentives to install residential EV charging including DCFC, solar EV charging, and paired EV charging + battery storage systems
PRIORITY: 2
Develop a yearly EV fair with participation from local dealerships and owners. Develop a map of the city charging network and available dedicated parking spaces. Create a webinar series on EV ownership. Promote all available incentive programs and encourage their use.
CO-BENEFITS:
Negotiate a discount program with local car dealerships to offer rebates or other incentives to car buyers purchasing new or used EVs. Require businesses to set aside a percentage of parking spaces for EVs.
CO-BENEFITS:
Increase the number of available Level 2 EV charging stations at businesses with >50 employees, multifamily homes of >10 units, and in commercial areas. Adopt an Electric Vehicle Supply Equipment Master Plan to identify number and location of EVSE.
CO-BENEFITS:
Create a network of DC Fast Charging (DCFC) stations Downtown and in other commercial areas, as well as along major vehicle corridors. Set a 1-mile target for DCFC stations. Engage local gas stations to explore conversion to DCFC centers.
CO-BENEFITS:
Continue the current requirements for EV pre-wiring and Level 2 charging in new single-family development and extend to include large remodels and additions, and double the requirements for new multi-family and commercial development as part of future Reach Code updates.
CO-BENEFITS:
Identify grants and incentives available through State, federal, or local agencies that may be used to support DCFC, solar EV charging and battery storage. Work with SVCE to expand existing EV resources and programs.
CO-BENEFITS:
TRANSPORTATION
GOAL 1.6 ELIMINATE OFF-ROAD FOSSIL
FUEL ENGINES
1.6 A fossil fuel engines such as landscaping equipment
PRIORITY: 1
such as landscaping equipment through bans, replacement ordinances, and/or incentives for electric alternatives. Work to reduce construction-related emissions. Form an Environmental Commission subcommittee to develop rules and/or ordinances.
CO-BENEFITS:
FOCUS AREA 1 TRANSPORTATION TIMELINE
2022-2025
2026-2030
2031-2035
• Live Near Work/Work From Home policies adopted
• Parking Management Plan adopted
• Transit Oriented Development requirements developed
• Commercial Transportation Demand Management standards passed
• Electric Vehicle Supply Equipment needs assessment completed
• Shared bike, ebike and escooter pilots launched
• Electric Vehicle Supply Equipment to support 80% EV installed
• City-wide electric shuttle launched
• DCFC network completed
• Pedestrian-friendly downtown created
• 2022 CSMP fully implemented
• 80% communitywide EV adoption
FOCUS AREA 2 ENERGY
Energy is the second-largest source of emissions within Los Altos (39% of all emissions). As the City has a larger-than-average per-capita residential energy footprint, this represents an area of opportunity for the City. Since most residents and businesses use low- or zero-carbon electricity from Silicon Valley Clean Energy, the majority of emissions in this category are from methane gas use. Similar to the transportation sector, a shift from fossil fuels to clean electricity or alternative fuels will be necessary to meet the City’s climate goals.
The strategies and actions in this section focus on improving
STRATEGY 1
Reduce Emissions from Energy Consumption
Reduce the amount of electricity and methane gas used in homes and businesses 20% by 2035
community-wide energy efficiency, increasing community solar and battery storage capacity, preventing new methane gas appliance and equipment installation, discouraging the use of methane gas in existing buildings, and ultimately replacing most or all methane gas appliances and equipment in existing buildings.
Electrifying transportation and buildings will increase electrical energy consumption in the near term but reduces GHG emissions as methane gas use is reduced. Over time, due to the increasing energy efficiency of electric vehicles and building equipment, electricity consumption will also be reduced.
STRATEGY 2
Facilitate Building Decarbonization
Reduce or eliminate methane gas use in homes and businesses by 2035
STRATEGY 3
Increase Solar Energy Production
Facilitate the installation of new solar capacity and expand battery storage on new and existing buildings community-wide
STRATEGY 1 Reduce Emissions from Energy Consumption
ENERGY
GOAL 2.1 ENCOURAGE ENERGY CONSERVATION MEASURES IN HOMES AND BUSINESSES
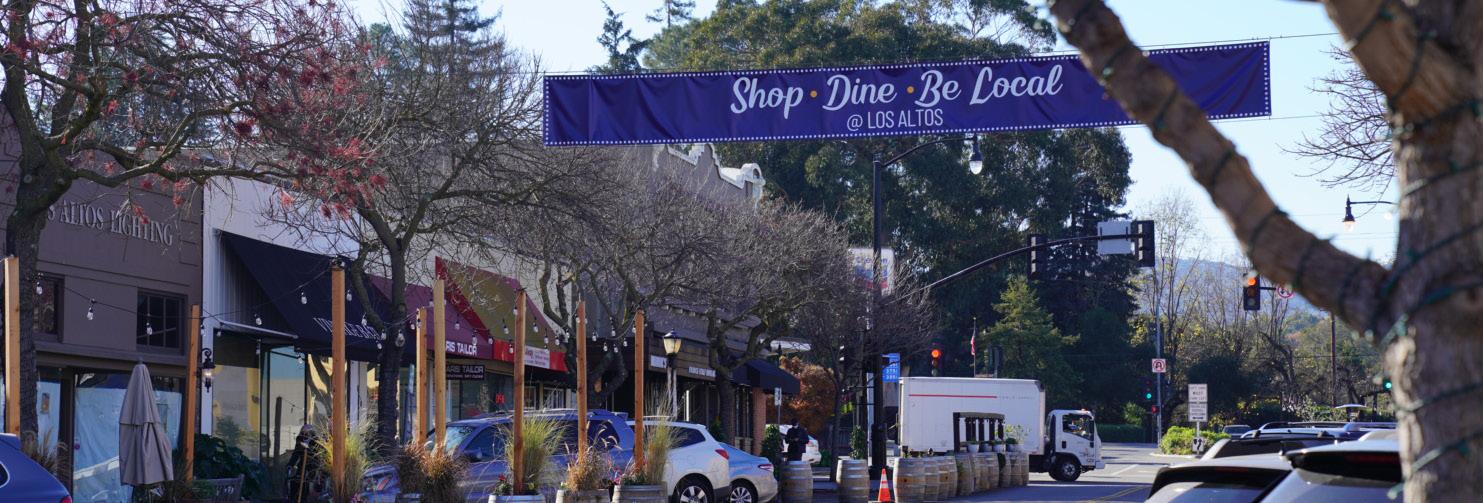
ACTION
2.1 A
2.1 B
Support third party residential and commercial energy audits
PRIORITY: 1
Increase residential and commercial energy efficiency
Provide resources to support energy audits including listing of approved providers, listing of incentive programs, and other resources. Work with approved providers to perform energy audits.
CO-BENEFITS:
Develop a program to increase energy efficiency in existing residential buildings including wall and ceiling insulation, roof replacements, new ducting and windows, lighting upgrades, and outdoor amenities upgrades. Identify outside funding to perform upgrades identified in energy audits performed under action 2.1 A, and ensure eligible residents and businesses take advantage of all available energy efficiency incentive programs.
PRIORITY: 1
CO-BENEFITS:
STRATEGY 2 Facilitate Building Decarbonization
ENERGY
GOAL 2.2 REQUIRE ALLELECTRIC NEW BUILDINGS AND MAJOR RETROFITS 2.2 A and major remodels
PRIORITY: 1
CO-BENEFITS:
STRATEGY 2 Facilitate Building Decarbonization
ENERGY
GOAL 2.3 REDUCE OR ELIMINATE METHANE GAS USE IN EXISTING BUILDINGS BY INCREASING FUEL SWITCHING
ACTION
Accelerate residential HVAC replacements
2.3 A
2.3 B
2.3 C
PRIORITY: 1
Accelerate residential water heater replacements
Develop a program to replace methane gas HVAC (heating, ventilation, and air conditioning) units in existing residential buildings with electric alternatives. Require permits and enforce compliance for HVAC replacements. Develop a "Replace upon Burnout" and "Replace upon Sale/Remodel" ordinance for HVAC units. Adopt an ordinance making it mandatory to replace all methane gas HVAC units with electric alternatives by 2035, with exemptions for low-income residents and Seniors. Provide education and outreach to residents and property owners.
CO-BENEFITS:
Develop a program to replace methane gas hot water heaters in existing residential buildings with electric alternatives. Require permits and enforce compliance for water heater replacements. Develop a "Replace upon Burnout" and "Replace upon Sale/Remodel" ordinance for water heaters. Adopt an ordinance making it mandatory to replace all methane gas water heaters with electric alternatives by 2035, with exemptions for low-income residents and Seniors. Provide education and outreach to residents and property owners.
2.3 D
PRIORITY: 1
Accelerate commercial HVAC replacements
PRIORITY: 1
Accelerate commercial water heater replacements
CO-BENEFITS:
Develop a program to replace methane gas HVAC units in existing commercial buildings with electric alternatives. Require permits and enforce compliance for HVAC replacements. Waive permit fees for electric HVAC units. Develop a "Replace upon Burnout" and "Replace upon Sale/Remodel" ordinance for HVAC units. Adopt an ordinance making it mandatory to replace methane gas HVAC units with electric alternatives by 2035. Provide eduction and outreach to property owners.
CO-BENEFITS:
Develop a program to replace methane gas hot water heaters in existing commercial buildings with electric alternatives. Require permits and enforce compliance for water heater replacements. Waive permit fees for electric water heaters. Develop a "Replace upon Burnout" and "Replace upon Sale/Remodel" ordinance for water heaters. Adopt an ordinance making it mandatory to replace methane gas water heaters with electric alternatives by 2035. Provide eduction and outreach to property owners.
CO-BENEFITS:
PRIORITY: 1
STRATEGY 2 Facilitate Building Decarbonization
ENERGY
GOAL 2.4 DISINCENTIVIZE METHANE GAS
2.4 A
ACTION
Establish a fee or penalty on the use of methane gas
PRIORITY: 2
Work with PG&E and community partners to develop or expand a fee on the use of methane gas within City limits. Set up a City-led Task Force in 2022 to lead this effort. Funds collected will be used to fund incentives for electric appliance adoption. Potential estimated funds available each year of at least $500k.
CO-BENEFITS:
STRATEGY 3 Increase Solar Energy Production
ENERGY
GOAL 2.5 EXPAND COMMUNITY

Increase community solar capacity
2.5 A
2.5 B
PRIORITY: 2
Adopt Net Zero Building requirements for new construction by 2030
PRIORITY: 1
Increase solar panel requirements in new construction from 4kW to 6kW minimum, and add solar panel requirement for large additions and remodels (>4kW). Ensure residents and businesses are aware of and take advantage of incentive programs for solar panels.
CO-BENEFITS:
Adopt Net Zero Building requirements following New Building Institute guidelines by 2030. Add solar requirements sufficient to power Net Zero homes to future Reach Code updates. Encourage battery storage systems of 10 kWh or more through promotion of incentive or rebate programs, educational campaigns, and/or pilot programs. Encourage participation in demand response programs to improve grid resiliency.
CO-BENEFITS:
FOCUS AREA 2 ENERGY TIMELINE
2022-2025
2026-2030
• Residential fuel switching program launched
• Solar requirements updated
• Residential and commercial energy efficiency resources developed
• City-led Task Force on methane gas fee or penalty formed and program implemented
• Ordinances in place to replace residential methane gas appliances upon burnout with equivalent electric ones
• Commercial fuel switching program launched
• Net Zero requirements for new construction adopted
• Fee or penalty on methane gas use passed
• Ordinances in place to replace commercial methane gas appliances upon sale or remodel with equivalent electric ones
2031-2035
• Energy use reduced community-wide by 20%
• Methane gas use eliminated or greatly reduced
• Ordinances in place to replace methane gas appliances upon sale or remodel with equivalent electric ones
FOCUS AREA 3 RESOURCE CONSERVATION
While waste disposal, water use, and operation of labor-saving equipment are all essential activities in the community, consuming and/or disposing of natural resources generates community GHG emissions. The effects of these activities can be reduced by diverting waste from
STRATEGY 1
Reduce Consumption and Waste
Increase landfill diversion, reduce water use, and promote sustainable lifestyles
the landfill, conserving water, and promoting sustainable consumption patterns. The following strategy and actions identify the City’s goals in reducing the amount of resources consumed and disposed of.
CO-BENEFITS
COST EFFECTIVENESS
COMMUNITY BENEFITS
ECONOMIC BENEFITS
ALIGNS WITH STATE AND LOCAL POLICIES
PROMOTES EQUITY & CLIMATE JUSTICE
STRATEGY 1 Reduce Consumption and Waste
RESOURCE CONSERVATION
GOAL 3.1 DECREASE LANDFILL WASTE 15% AND ELIMINATE SINGLE-USE PLASTICS AND CONSTRUCTION WASTE BY 2035

ACTION
Increase the landfill diversion rate
3.1 A
3.1 B
PRIORITY: 1
Eliminate nonessential single-use plastics
PRIORITY: 1
3.1 C
GOAL 3.2 REDUCE WATER USE 15% BY 2030
3.2 A
Reduce waste from demolition, construction and building materials
PRIORITY: 1
ACTION
Increase communitywide water efficiency
Increase landfill diversion rate to 90% by 2030 and 95% by 2035, negotiated in the next Franchise Agreement. Launch an education and awareness campaign for residents and businesses to help promote best practices.
CO-BENEFITS:
Adopt a new ordinance to eliminate non-essential single-use plastics and prioritize reusable foodware and utensils. Ensure all new single-use foodware and utensils are compostable per guidelines from the Franchise Waste Hauler.
CO-BENEFITS:
Develop an ordinance requiring the deconstruction of old buildings instead of demolition and the recycling/re-use of materials. Provide incentives to builders for the use of environmentally friendly construction materials.
CO-BENEFITS:
Increase education and awareness of water efficiency programs through Calwater and other organizations. Continue to support implementation of the 2015 UWMP through enforcement of the 2015 Model Water Efficient Landscape Ordinance. Develop an ordinance requiring conversion of grass lawns to low-water landscaping. Consider an update to the building code prohibiting new grass lawns.
GOAL 3.3 PROMOTE A CIRCULAR ECONOMY
PRIORITY: 1
ACTION
Promote sustainable food choices
3.3 A
3.3 B
PRIORITY: 2
Encourage responsible goods and services consumption
PRIORITY: 2
CO-BENEFITS:
Expand consumer education and awareness of sustainable and plant-based food choices through City media channels, speaker series, and other methods. Work with the current vendor to expand the farmers market into a year-round event. Work with local restaurants to increase organic, vegetarian, and farm-to-table menu options and reduce food waste.
CO-BENEFITS:
Increase education & awareness of circular economy concepts, including responsible purchasing habits and the promotion of a Repair, Reuse, Recovery, and Refurbishment economy. Provide support and resources to help local businesses participate in green business programs.
CO-BENEFITS:
FOCUS AREA 3 RESOURCE CONSERVATION TIMELINE
2022-2025
• Non-essential singleuse plastic ban adopted
• Deconstruction ordinance passed for buildings
• Sustainability Speakers series launched
2026-2030
2031-2035
• Landfill diversion increased to 90%
• Water use reduced by 15%
• Landfill diversion increased to 95%
FOCUS AREA 4 MUNICIPAL OPERATIONS
While City activities represent a small part of overall GHG emissions in the community, the Municipal Operations focus area is the City’s opportunity to lead by example. Emissions reduction measures may also reduce the cost of City operations by decreasing energy, fuel, and other material consumption at City facilities.
STRATEGY 1
Operate Sustainable Municipal Buildings
Increase efficiency, resiliency, and renewable energy at City-owned buildings and facilities
STRATEGY 3
Promote Green
Municipal Practices
Create and promote efficient practices
STRATEGY 2 Reduce Municipal VMT
Reduce commute fossil fuel VMT and eliminate City fleet fossil fuel VMT
STRATEGY 4
Integrate Climate Action and Adaptation into City Functions
Incorporate Climate Action and Adaptation into City Policy, Budget, Planning, & Internal Standards
STRATEGY 1 Operate Sustainable Municipal Buildings
MUNICIPAL
OPERATIONS
GOAL 4.1 REDUCE MUNICIPAL BUILDING ENERGY USE BY 30% BY 2035
ACTION
4.1 A
GOAL 4.2 INSTALL SOLAR AND BATTERY STORAGE AT CITY FACILITIES
4.2 A
Audit appropriate City facilities and conduct comprehensive energy efficiency upgrades
PRIORITY: 2
Audit appropriate City facilities and conduct comprehensive energy efficiency upgrades focusing on energy-efficient lighting, motion sensors, appliances, and HVAC systems. Develop a 10-year phase-out program in which all existing methane gas appliances are replaced with comparable electric alternatives.
CO-BENEFITS:
4.2 B
ACTION
Build new City buildings to Net Zero standards
PRIORITY: 1
Develop battery storage options and evaluate microgrids for cost savings and resilience
PRIORITY: 2
Ensure all new buildings are Net Zero and all-electric with solar panels, battery storage and electric efficient appliances. Align with CA Public Utilities Commission Zero Net Energy goals and definitions.
CO-BENEFITS:
Install ground- or roof-mounted solar panels at select City buildings and facilities. Explore options for microgrids capable of going into "island mode" and serving as resilience hubs during power outages.
CO-BENEFITS:
STRATEGY 2 Reduce Municipal VMT
MUNICIPAL OPERATIONS
GOAL 4.3 CONVERT 100% OF THE CITY'S FLEET TO ELECTRIC VEHICLES BY 2030

ACTION
4.3 A
GOAL 4.4 DEVELOP GUIDELINES FOR SUSTAINABLE EMPLOYEE COMMUTE AND BUSINESS TRAVEL
4.4 A
Develop a phase-out schedule to replace all City-owned fleet vehicles with electric vehicles
PRIORITY: 1
Develop a phase-out schedule to replace all City-owned fleet vehicles with comparable electric versions by 2030. Conduct a feasibility study to determine the optimal number and location of municipal and public chargers at City facilities and properties, and install sufficient Level 2 charging to charge EV fleet and staff-owned EVs.
CO-BENEFITS:
4.4 B
ACTION
Improve City staff use of commute alternatives to single-occupant vehicles
PRIORITY: 2
Expand Work From Home and flexible schedule policies
PRIORITY: 1
Increase options for commute alternatives, including information and materials that identify available transit and alternative transportation routes. Encourage staff to buy and use EVs through incentives, free charging at City facilities, and other means.
CO-BENEFITS:
Expand the current policy to facilitate alternative work schedule or telecommuting options for City staff to reduce daily commute trips. Evaluate flexible employee schedules that allow for at least 50% remote work while maintaining City hours of operation.
CO-BENEFITS:
STRATEGY 3 Promote Green Municipal Practices
MUNICIPAL OPERATIONS
GOAL 4.5 PROMOTE GREEN MUNICIPAL PRIORITIES
ACTION
4.5 A
4.5 B
Adopt a zero-waste policy for City facilities and Citysponsored events
PRIORITY: 1
Continue to allow virtual participation in public meetings
PRIORITY: 2
Adopt a policy that requires City-owned buildings and facilities to be zero waste. Develop an action plan to eliminate waste through diversion and recycling. Work with event vendors and participants to eliminate waste at City-sponsored events.
CO-BENEFITS:
Decrease community Vehicle Miles Traveled by continuing to allow virtual participation at all public meetings. Allow for public comment by virtual participants.
CO-BENEFITS:
Cross-Cutting Strategies
These strategies address both the sources and impacts of climate change within Los Altos. These strategies include the remaining Municipal Operations strategies, as well as Green Community and Climate Risk strategies.

STRATEGY 4 Integrate Climate Action and Adaptation into City Functions
MUNICIPAL OPERATIONS
4.6 INCORPORATE CLIMATE ACTION AND ADAPTATION INTO CITY POLICY, BUDGET, PLANNING, & INTERNAL STANDARDS

ACTION
4.6 A
4.6 B
Account for climate change in all new City projects
4.6 C
PRIORITY: 1
Incorporate climate preparedness into City programs, operations, and maintenance protocols
PRIORITY: 1
Integrate CAAP goals into City projects as an order of business
PRIORITY: 1
Establish an interdepartmental working group to integrate climate preparedness in planning, maintenance, and capital improvements though the development of work plans, screening of capital improvements, and crosssector collaboration. Establish protocols for mitigating public health impacts from heat and air quality with regional agencies and partners.
CO-BENEFITS:
Ensure that maintenance reflects expected future climate conditions and variability and not historical climate data for all City buildings, facilities, structures, and infrastructure.
CO-BENEFITS:
Integrate annual CAAP report goals during the budget review process at the direction of the City Manager. Plan to inventory City GHG emissions every two years using ClearPath and track against targets.
CO-BENEFITS:
FOCUS AREA 4 MUNICIPAL OPERATIONS TIMELINE
2022-2025
• Net Zero building standard for new buildings adopted
• Energy audits of City buildings and facilities conducted
• Sustainable employee commute guidelines developed/updated
• Virtual City meeting program developed
2026-2030
• 100% of City fleet converted to EV
• CAAP goals integrated into City budget processes
2031-2035
• Building energy use reduced by 30%
• Microgrid pilot at City facility launched
FOCUS AREA 5 GREEN COMMUNITY
Many projects in Los Altos contribute to an improved quality of life by providing economic, social, and environmental benefits for the community. These projects also indirectly reduce GHG emissions.
STRATEGY 1
Develop Nature-Based Solutions
Favor and implement nature-based solutions in the community
While the measures and actions in this focus area identify only minor direct emissions reductions, they support the reduced energy or fuel consumption goals underlying numerous other CAAP strategies.
CO-BENEFITS KEY
COST EFFECTIVENESS
COMMUNITY BENEFITS
ECONOMIC BENEFITS
ALIGNS WITH STATE AND LOCAL POLICIES
PROMOTES EQUITY & CLIMATE JUSTICE
LOS ALTOS
STRATEGY 1 Develop Nature-Based Solutions
GREEN COMMUNITY
GOAL 5.1 EXPAND GREEN INFRASTRUCTURE AND IMPROVE WATER RESILIENCE
ACTION
5.1 A
GOAL 5.2 SEQUESTER
ALL REMAINING CARBON BY 2035
5.1 B
Create waterefficient buildings and landscapes
5.2 A
PRIORITY: 1
Develop a partnership with the Regional Water Quality Control Plant to use recycled water from the plant
PRIORITY: 3
ACTION
Increase urban tree canopy
PRIORITY: 1
5.2 B
5.2 C
5.2 D
Expand parks and natural wooded spaces
PRIORITY: 2
Pilot carbon farming opportunities
PRIORITY: 2
Eliminate the use of non-organic pesticides and herbicides
Update building code to incentivize rainwater harvesting and greywater recycling. Install systems at municipal facilities. Develop resources to help residents purchase water-saving equipment, and encourage rainwater harvesting strategies. Adopt mandatory guidelines requiring a set of stormwater and greywater management features in new construction. Utilize reissuance of City’s National Pollution Discharge Elimination System (NPDES) permit starting July 2022 to lower threshold for regulation. Partner with local and global organizations to identify space and resources to enhance the natural environment and rural feel of the city.
CO-BENEFITS:
Work with the Wastewater Treatment Plant to implement upgrades to increase the amount of recycled water production, and add desalination and treatment to provide a drought resilient, potable water supply. Work with the RWQCP to reduce process-related emissions.
CO-BENEFITS:
PRIORITY: 1
Set a goal of at least 10,000 new City trees by 2035. Develop a city-wide Urban Tree Master Plan.
CO-BENEFITS:
Work with community partners to expand the number and size of parks and wooded spaces within City limits.
CO-BENEFITS:
Identify land to plant intensive urban forests following the Miyawaki Method. Explore opportunities to develop carbon farming pilots for carbon sequestration. Partner with local organizations with available greenspace.
CO-BENEFITS:
Ban the use of non-organic pesticides and herbicides throughout City green spaces. Develop education and incentivization programs for residents about use of alternatives to synthetic pesticides and herbicides. Develop organic community gardens, pollinator friendly planting programs and encourage bee farms in residents' gardens through partnerships with local organizations.
CO-BENEFITS:
FOCUS AREA 5 GREEN COMMUNITY TIMELINE
2022-2025
• Building code updated to incentivize rainwater and greywater harvesting
• City-wide Urban Forest Master Plan developed
2026-2030
• Partnership with the RWQCP to use recycled wastewater formed
• Carbon farming pilots launched
• Non-organic pesticides and herbicides eliminated
• Park and natural wooded space expansion plan in place and funded
2031-2035
• At least 10,000 new city trees planted
FOCUS AREA 6 CLIMATE RISK
The risk of flooding and extreme heat can be reduced by first understanding which areas of Los Altos are most likely to experience flooding and/ or heat. Vegetation, pavements and other conditions at ground level influence both flood and heat risk. The city can’t stop the rain or the heat, but it can magnify - or damper - their impacts.
STRATEGY 1
Understand and Reduce Physical Risk
Reduce flood and heat risk
CO-BENEFITS
COST EFFECTIVENESS
COMMUNITY BENEFITS
ECONOMIC BENEFITS
ALIGNS WITH STATE AND LOCAL POLICIES
PROMOTES EQUITY & CLIMATE JUSTICE
STRATEGY 1 Understand and Reduce Physical Risk
CLIMATE RISK
GOAL 6.1 REDUCE FLOOD RISK ACTION
6.1 A
6.1 B
Update city-wide flood risk assessment and capital and policy recommendations
6.1 C
PRIORITY: 3
Develop and implement comprehensive riparian ecosystem restoration plan and relevant floodplain management policies
PRIORITY: 3
Expand green infrastructure program to reduce impermeable surface areas and capture runoff from paved areas
PRIORITY: 1
The hydraulic analyses that form FEMA's FIRM (Flood Insurance Rate Map) are decades old. Hire a company to perform hydraulic analyses of existing creek crossings and culverts to determine how many, if any, are undersized based on changing precipitation patterns (climate is typically based on 30-year data cycles). Replace/rebuild undersized culverts and creek crossings as needed. Work with FEMA to update the FIRMs.
CO-BENEFITS:
Work with Valley Water to revitalize and restore creeks, learning from case studies like Adobe Creek Reach 5 Restoration. Restore the riparian ecosystem of creeks flowing through Los Altos, add managed ponds and dams to slow the flow of water, and increase percolation to the ground. Increase natural floodplain management through policies and education to establish "Buffer Zones" and limit new construction.
CO-BENEFITS:
Implement porous paving in sidewalks, parking lots and driveways, and other water percolation methods like bioswales to reduce stormwater runoff to streets.
CO-BENEFITS:
STRATEGY 1 Understand and Reduce Physical Risk

CLIMATE RISK GOAL 6.2 REDUCE HEAT RISK ACTION
6.2 A
Conduct heat study/ mapping to identify areas of Urban Heat Island
PRIORITY: 3
6.2 B
6.2 C
Enact reflectivity standards for asphalt and ground level surfaces; enact reflectivity/green roof standards for roofs
PRIORITY: 2
Promote alternative building cooling strategies; enact standards
PRIORITY: 2
Conduct heat study/mapping to identify areas of Urban Heat Island and address with capital and policy recommendations.
CO-BENEFITS:
Require light-colored roofs and/or a minimum specified reflectance for commercial roofs when new or at replacement. Explore and implement guidelines to resurface streets and sidewalks with heat reflective surfaces.
CO-BENEFITS:
Promote alternative cooling strategies like shade trees, green roofs, and building awnings. Determine and enact standards for new buildings
CO-BENEFITS:
FOCUS AREA 6 CLIMATE RISK TIMELINE
2022-2025
• Heat Risk mapped & studied, solutions identified
• City-wide flood risk re-assessed, capital investments identified
2026-2030
• Flood Insurance Rate Maps (FIRMs) updated
• All Heat-Reduction strategies & investments implemented
• Riparian Ecosystem Restoration Plan developed
2031-2035
• Twenty-five acres of impervious area managed by Green Stormwater Infrastructure
• All City-related flood reduction strategies & investments implemented
Adaptation Strategies
The adaptation strategies presented below are a range of programs, investments, studies, and policies to help Los Altos prepare for and adapt to changes in climate. Since the impacts of climate change are a combination of climate events (like heat and extreme storms) and their effect on the environment and people, some of the strategies reduce how climate events cause damaging impacts. For instance, strategies that provide more shade and means of cooling can help Los Altos adapt to increasing temperatures. Other strategies are meant to prepare Los Altos and its residents and businesses for a less certain future with climate emergencies and discomforts by creating safe resilience hubs that are protected when other pieces of infrastructure are rendered unusable.

FOCUS AREA 7 EMERGENCY MANAGEMENT
Los Altos already prepares for earthquakes and other emergency situations. By integrating growing climate hazards into its planning, the City can be prepared for these new emergencies.
STRATEGY 1
Integrate Adaptation Into Emergency Preparedness and Response
Ensure public safety during extreme heat, wildfire, and unhealthy air events
CO-BENEFITS
COST EFFECTIVENESS
COMMUNITY BENEFITS
ECONOMIC BENEFITS
ALIGNS WITH STATE AND LOCAL POLICIES
PROMOTES EQUITY & CLIMATE JUSTICE
LOS ALTOS
STRATEGY 1 Integrate Adaptation into Emergency Preparedness,
EMERGENCY MANAGEMENT
GOAL 7.1 ENSURE SAFETY DURING EXTREME HEAT

ACTION
7.1 A
Develop temperature/heat safety protocols for outdoor work; determine education and enforcement mechanisms
PRIORITY: 2
7.1 B
7.1 C
Adjust/extend park and public facility hours during heat waves
PRIORITY: 1
Expand public drinking fountains/ refillable water stations
PRIORITY: 2
Adjust construction policies to allow extended work hours (earlier or later than usual) to avoid peak daytime heat. Adjust/extend construction hours in Ordinance 6.16 Noise Control, Section 70 Prohibited Acts during heat waves to avoid peak daytime heat. Work with community groups and residents to determine best methods of outreach and communication with outdoor workers. Educate employers and workers about existing worker rights and protections and ways to protect outdoor workers from the effects of extreme heat.
CO-BENEFITS:
Adjust park and facility hours to discourage active recreation during peak periods and extend open hours to early morning/late evening. Develop community cooling centers at City and non-City sites. Ensure temporary shade structures are provided for community events.
CO-BENEFITS:
Locate at bus stops, Downtown shopping areas, trailheads, community centers, and sport courts/fields.
CO-BENEFITS:
STRATEGY 1 Integrate Adaptation into Emergency Preparedness,
EMERGENCY MANAGEMENT
GOAL 7.2 ENSURE SAFETY DURING WILDFIRES AND UNHEALTHY AIR EVENTS
ACTION
7.2 A
7.2 B
7.2 C
Update wildfire warning and evacuation protocols
PRIORITY: 1
Develop an early warning system for air quality alerts
PRIORITY: 2
Ensure high-air-quality indoor spaces and purchase and distribute N-95 masks to vulnerable outdoor populations
PRIORITY: 1
Ensure existing alert systems and safety measures are updated to address increasing climate risk and vulnerable, not easily mobile populations.
CO-BENEFITS:
Partner with regional agencies to make wildfire and air quality prediction data widely used and accessible to all, including through an early warning system. If not feasible, develop Los Altos-specific warning system based on available and accessible data.
CO-BENEFITS:
Two-pronged strategy to retrofit and/or install air filtration systems on resilience hubs, schools, and other facilities. Separately, provide face masks to filter air for outdoor workers and other vulnerable populations who need to be outdoors before and during bad-air-quality days.
CO-BENEFITS:
FOCUS AREA 7 EMERGENCY MANAGEMENT
2022-2025
2026-2030
2031-2035
• Heat Safety & Air Quality Protocols developed, implemented
• Wildfire warning and evacuation protocols updated
• 25% of new public drinking fountains/ refillable water stations installed
• Climate-hazard safety protocols re-evaluated and updated
• 50% of new public drinking fountains/ reillable water stations installed
• Climate-hazard safety protocols re-evaluated and updated
• 100% of new public drinking fountains/ refillable water stations installed
FOCUS AREA 8 RESILIENT COMMUNITY
Like changes with emergency preparedness, Los Altos needs to find new ways to communicate with and ensure the comfort and safety of its residents. Since not every home, business, and government building
STRATEGY 1
Educate and Protect Residents
Increase public health and resilience
can be made completely safe and operational during extreme weather, Los Altos needs to create or enhance the capacity of existing buildings to shelter groups of residents.
CO-BENEFITS
COST EFFECTIVENESS
COMMUNITY BENEFITS
ECONOMIC BENEFITS
ALIGNS WITH STATE AND LOCAL POLICIES
PROMOTES EQUITY & CLIMATE JUSTICE
LOS
STRATEGY 1 Educate and Protect Residents
RESILIENT COMMUNITY
GOAL 8.1 ESTABLISH RESILIENCE HUBS
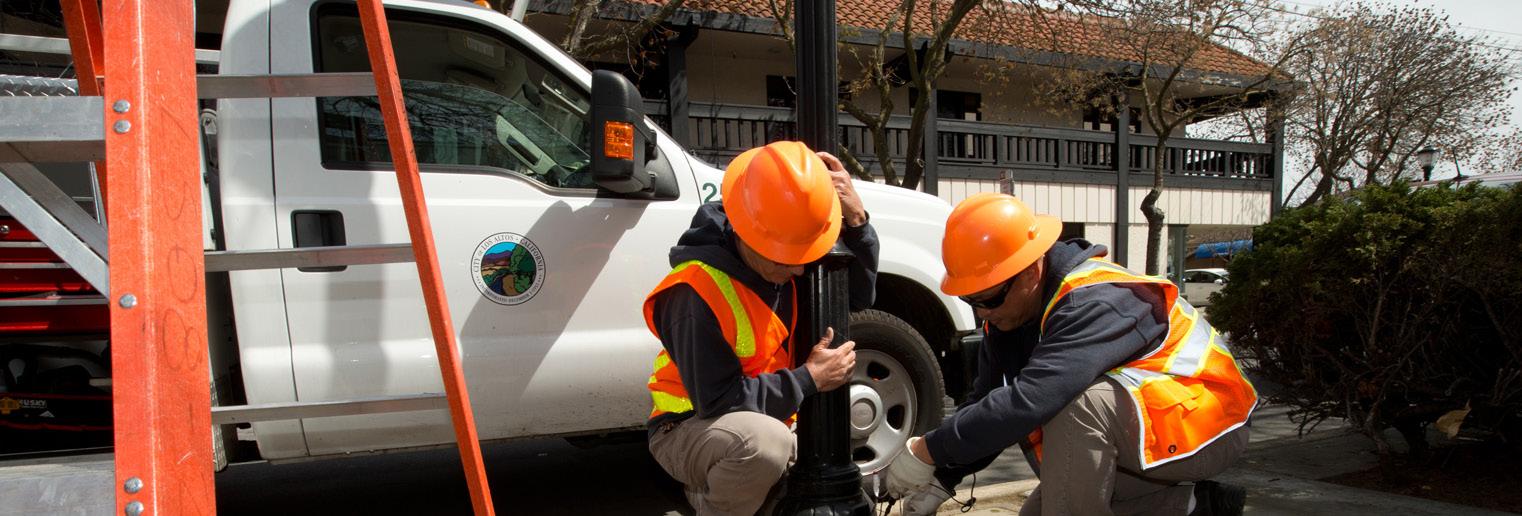
8.1 A
GOAL 8.2 IDENTIFY AND PROTECT VULNERABLE COMMUNITY MEMBERS
GOAL 8.3 IMPROVE CLIMATE LITERACY AND RISK UNDERSTANDING
8.2 A
Identify, fund, and prepare existing and new public facilities to serve as resilience hubs
PRIORITY: 2
8.3 A
Develop outreach to and comprehensive care strategy for vulnerable populations
Conduct interviews with facility staff to determine their resilience to extreme heat, power outages, floods, and poor air quality. Compile and analyze to help prioritize investments and coordination. Identify suitable locations for/upgrade evacuation centers to serve as resilience hubs, safe zones, cooling centers, etc., depending on the event, with the capabilities to provide disaster assistance.
CO-BENEFITS:
8.3 B
PRIORITY: 2
Conduct survey of and outreach to vulnerable populations (e.g. isolated seniors, outdoor workers, long-term care residents) and the people and institutions that care for them. Collaborate with community-based organizations to develop an inventory of locations with isolated seniors and develop a plan for a social support network during heat waves, bad air quality days, and other emergencies. Plan should include orders of assistance, including temporarily moving vulnerable populations to and from resilience hubs.
CO-BENEFITS:
Update Community Emergency Response Training (CERT) to include growing climate hazards
PRIORITY: 1
Launch a Community Climate Action Grant
PRIORITY: 2
Form partnerships with neighborhood-based organizations and businesses to develop Neighborhood Resilience Hub programs and prepare residents and respond to climate change. Develop community outreach and engagement materials.
CO-BENEFITS:
Establish an annual micro-grant program to support local citizen-led projects and programs that will reduce emissions, adapt to climate change and enhance equity.
CO-BENEFITS:
FOCUS AREA 8 RESILIENT COMMUNITY
2022-2025
• Resilience Hubs identified and funded
• CERT updated to include response to climate hazards
• Outreach and care strategy for vulnerable populations in place
2026-2030
• Resilience Hubs built out and operated
• Community Climate Action Grant launched
2031-2035
• Resilience Hubs operated and evaluated
Priority Actions by Focus Area
TRANSPORTATION
• 1.1 B Create a pedestrian-friendly Downtown and other community and commercial spaces throughout the city
• 1.1 C Develop and implement a new Parking Management Plan that supports strategic VMT reduction
• 1.2 A Support Transit-Oriented Development
• 1.2 B Encourage Live Near Work incentives
• 1.2 C Promote Work From Home policies and infrastructure
• 1.3 A Develop an electric shuttle program as an alternative to SOV travel
• 1.4 B Actively promote EV adoption and require EV-only parking
• 1.5 C Expand the current Electric Vehicle charging and pre-wiring requirements in future Reach Code updates
• 1.6 A Phase out off-road fossil fuel engines such as landscaping equipment
ENERGY
• 2.1 A Support third party residential and commercial energy audits
• 2.1 B Increase residential and commercial energy efficiency
• 2.2 A Adopt evolving Reach Codes and expand to include large additions and major remodels
• 2.3 A Accelerate residential HVAC replacements
• 2.3 B Accelerate residential water heater replacements
• 2.3 C Accelerate commercial HVAC replacements
• 2.3 D Accelerate commercial water heater replacements
• 2.5 B Adopt Net Zero Building requirements for new construction by 2030
RESOURCE CONSERVATION
• 3.1 A Increase the landfill diversion rate
• 3.1 B Eliminate non-essential single-use plastics
• 3.1 C Reduce waste from demolition, construction and building materials
• 3.2 A Increase community-wide water efficiency
MUNICIPAL OPERATIONS
• 4.2 A Build new City buildings to Net Zero standards
• 4.3 A Develop a phase-out schedule to replace all City-owned fleet vehicles with electric vehicles
• 4.4 B Develop Work From Home and flexible schedule policies
• 4.5 A Adopt a zero-waste policy for City facilities and City-sponsored events
• 4.6 A Account for climate change in all new City projects
• 4.6 B Incorporate climate preparedness into City programs, operations, and maintenance protocols
• 4.6 C Integrate CAAP goals into City projects as an order of business
GREEN COMMUNITY
• 5.1 A Create water-efficient buildings and landscapes
• 5.2 A Increase urban tree canopy
• 5.2 D Eliminate the use of non-organic pesticides and herbicides
CLIMATE RISK
• 6.1 C Expand green infrastructure program to reduce impermeable surface areas and capture runoff from paved areas
EMERGENCY MANAGEMENT
• 7.1 B Adjust/extend park and public facility hours during heat waves
• 7.2 A Update wildfire warning and evacuation protocols
• 7.2 C Ensure high-air-quality indoor spaces and purchase and distribute N-95 masks to vulnerable outdoor populations
RESILIENT COMMUNITY
• 8.3 A Update Community Emergency Response Training (CERT) to include growing climate hazards

Implementing the CAAP
Implementing the CAAP
IMPLEMENTATION OVERVIEW
Implementation will be overseen by the Department of Community Development, but rely on other departments as well as NGOs, businesses, and members of the public. Implementing the plan’s strategies and actions will depend in part on the leadership of City government and the specifics of each action. Sustainability and adaptation are inherently wide
ranging and not every action can be implemented at once.
Actions geared toward municipal operations can be started immediately. Other actions like policies and regulations involve City staff time “up front,” but in the long run instead rely on the activity of the private sector. Still other actions including capital investments involve a common series of steps from project scoping, fundraising and procurement,
to planning, design, and construction. Figure 18 displays the steps and circular nature of the mainstreaming of climate investments.
Although actions may have different milestones to completion and benchmarks for success, they can all benefit from monitoring and reporting which allow implementation to be evaluated and tracked by City departments, elected officials, and the public.
MAINSTREAMING CLIMATE INVESTMENTS
MAINTENANCE
• Consider climate impacts when restoring and retrofitting infrastructure assets.
• Assess opportunities for resilience and risk mitigation.
OPERATIONS
• Evaluate vulnerabilities to climate impacts including disaster events.
• Develop plan to adapt operations.
PROCUREMENT & CONSTRUCTION
• Select climate-resilient building methods and materials.
PLANNING & FINANCE
• Integrate climate projections into needs assessments.
• Use systems thinking to address multiple needs and maximize funding options.
• Engage vulnerable populations.
• Minimize GHG emissions from operations.
DESIGN
• Ensure design parameters reflect adaptation to changing climate impacts.
• Evaluate and maximize multiple benefits.
Source: Adapted from Jamesine Rogers Gibson, Built to Last Challenges and Opportunities for Climate- Smart Information in California, Union of Concerned Scientists, November 2017.
Figure 18 Mainstreaming climate investments
Implementing the CAAP
CONTINUED
Actions that are new capital investments and program updates and expansions will require new funding, in some cases to support new staff or hire private entities. Meanwhile, integration and interagency coordination will be needed to address climate change requiring low-cost changes to City planning, budgeting, operations, and programs. At minimum, the CAAP goals should be integrated into future iterations of the following plans:
• Los Altos General Plan, Natural Environment and Hazards Element, and Housing Element
• Capital Improvements Plan
• Emergency Operations Center Plan/Manual
• Santa Clara County Hazard Mitigation Plan - Los Altos Annex
• Downtown Vision Plan
• Complete Streets Master Plan
The CAAP will also need community support and broad-based partnerships to be effectively implemented. Stakeholder groups should be addressed across the board, from youth to our Seniors. A non-exhaustive list of stakeholders that should be considered for the process include:
• GreenTown Los Altos
• Los Altos Chamber of Commerce
• Los Altos High School Green Team
• Los Altos Village Association
• Los Altos Mountain View Community Foundation
In addition, public-private partnerships should be evaluated.
Businesses and those who invest in the City should understand the benefits that the actions in the CAAP could bring them. Support in terms of time and resources will be needed, and changes in lifestyle and behavior may be necessary. Not everything will necessarily be easy or work perfectly the first time, and sustained energy and perseverance will be important.
It will also be important to maintain flexibility in implementing the CAAP. As technologies, business models, and political will at various levels of government evolve, Los Altos will need to remain flexible in when and how it implements the actions in this plan. As costs and feasibility change, the City will periodically evaluate and adjust course as necessary.
Similarly, as progress towards key targets is tracked the City may need to scale up or down its efforts depending on the results observed. The City should update the CAAP in 2025 and 2030, and report every two years on greenhouse gas emissions and progress towards goals. For monitoring and evaluation of adaptation actions, the City should conduct a debrief within one year of all hazardous events such as floods, wildfires, and air pollution and adjust actions as necessary based on those findings.
Unlike mitigation, there are no universal metrics, targets, or measurement systems for adaptation. This is in part because climate mitigation has global benefits, while adaptation actions produce local benefits. It is also because there is no system to measure baseline adaptation.
Instead, Appendix G lays out when actions can be expected to be completed and describes metrics for measuring progress.
BUDGET
Costs or cost ranges were estimated for the implementation of each action and can be found in Tables 6-8. Based on these estimates, a total of approximately $14,981,000 will be needed to implement all mitigation actions, including approximately $4.1M between 2022-2025, $5.4M between 2026-2030, and $5.0M between 2031-2035. As quality data on adaptation actions was unavailable, cost ranges were used for adaptation and some crosscutting actions. In addition, it’s estimated that 2 new FTE will need to be added between 2022-2025, 2026-2030, and 2031-2035. Some costs will fall under other plan implementations budgets, such as those for the 2022 Complete Streets Master Plan.
The cost of inaction is much higher. In addition, investments in sustainability and clean infrastructure reduce costs for homeowners and businesses, promote growth in local jobs and the economy, and reduce recovery costs from climate-related disasters.
A number of tools and resources are provided in the next sections below to help the City take advantage of existing funding streams. By leveraging existing and future funding streams, costs to the City, residents, and businesses can be substantially reduced.
Transportation1.1 A
1.1 B
MITIGATION BUDGET
Fully implement the 2022 Complete Streets Master Plan by 2035 and make adjustments as needed to comply with VMT reduction objectives n/a (costs included in CSMP implementation budget)
Create a pedestrian-friendly Downtown and other community and commercial spaces throughout the city
1.1 C Develop and implement a new Parking Management Plan that supports strategic VMT reduction
1.1 D
Pilot shared bike, ebike, and escooter programs, and partner with adjacent cities to improve first/last mile options $135,000
1.2 A Support Transit-Oriented Development $300,000
1.2 B Encourage Live Near Work incentives $380,000
1.2 C Promote Work From Home policies and infrastructure$110,000
1.3 A
Develop an electric shuttle program as an alternative to SOV travel
1.3 B Expand transit service, connectivity, and transit stop amenities $140,000
1.3 C Require commercial Transportation Demand Management programs $650,000
1.3 D Work with Los Altos School Districts to reduce VMT$200,000
1.3 E Develop and promote community carshare and carpool programs $5,000
1.4 A Increase education & awareness of available EV resources and incentive programs $15,000
1.4 B Actively promote EV adoption and require EV-only parking $160,000
1.5 A
Increase the number of available Level 2 EV charging stations in workplace, commercial and multifamily areas
1.5 B Create a citywide network of DC Fast Charging (DCFC) stations $1,350,000
1.5 C
1.5 D
Double the current Electric Vehicle charging and prewiring requirements in future Reach Code updates $10,000
Identify grants and incentives to install residential EV charging including DCFC, solar EV charging, and paired EV charging + battery storage systems
$50,000
1.6 A Phase out off-road fossil fuel engines such as landscaping and construction equipment $150,000
2.1 A Support 3rd party residential and commercial energy audits
Table 6 Mitigation Budget
Valley Clean Energy (informational resource)
MITIGATION BUDGET TABLE
Transportation1.1 A Fully implement the 2022 Complete Streets Master Plan by 2035 and make adjustments as needed to comply with VMT reduction objectives $900,00 included in CSMP implementation budget) U.S. DOT Calbike
1.1 B
Create a pedestrian-friendly Downtown and other community and commercial spaces throughout the city $215,000 BAAQMD Caltrans
1.1 C Develop and implement a new Parking Management Plan that supports strategic VMT reduction $400,000 BAAQMD
1.1 D
Pilot shared bike, ebike, and escooter programs, and partner with adjacent cities to improve first/last mile options $135,000
1.2 A Support Transit-Oriented Development $300,000 Metropolitan Transportation Commission
1.2 B Encourage Live Near Work incentives $380,000
1.2 C Promote Work From Home policies and infrastructure$110,000
1.3 A Develop an electric shuttle program as an alternative to SOV travel $250,000 BAAQMD Caltrans Caltrans
1.3 B Expand transit service, connectivity, and transit stop amenities $140,000
1.3 C Require commercial Transportation Demand Management programs $650,000
1.3 D Work with Los Altos School Districts to reduce VMT$200,000
1.3 E Develop and promote community carshare and carpool programs $5,000
1.4 A Increase education & awareness of available EV resources and incentive programs $15,000 1.4 B Actively promote EV adoption and require EV-only parking $160,000 Silicon Valley Clean Energy (technical assistance) CARB U.S. DOT
1.5 A Increase the number of available Level 2 EV charging stations in workplace, commercial and multifamily areas $140,000
1.5 B Create a citywide network of DC Fast Charging (DCFC) stations $1,350,000
1.5 C Double the current Electric Vehicle charging and prewiring requirements in future Reach Code updates $10,000
1.5 D Identify grants and incentives to install residential EV charging including DCFC, solar EV charging, and paired EV charging + battery storage systems $50,000 Silicon Valley Clean Energy (informational resource)
1.6 A Phase out off-road fossil fuel engines such as landscaping and construction equipment $150,000 Energy
2.1 A Support 3rd party residential and commercial energy audits $900,000
Municipal Operations
Green Community
CROSS-CUTTING BUDGET
4.6 A Account for climate change in all new City projects<$50k
4.6 B Incorporate climate preparedness into City programs, operations, and maintenance protocols <$50k
4.6 C Integrate CAAP goals into City projects as an order of business <$50k
5.1 A Create water-efficient buildings and landscapes$65,000
5.1 B Develop a partnership with the Regional Water Quality Control Plant to use recycled water from the plant
5.2 A Increase urban tree canopy
$50-$500k
$3,650,000
5.2 B Expand parks and natural wooded spaces >$500k
5.2 C Pilot carbon farming opportunities
Climate Risk
Water Resources Control Board
Valley Water
Natural Resources Agency
CA Natural Resources Agency
CAL FIRE CA ReLeaf
CA Natural Resources Agency
CAL FIRE
CA ReLeaf
$100,000
5.2 D Eliminate the use of non-organic pesticides and herbicides $5,000
6.1 A Update city wide flood risk assessment and capital and policy recommendations
Cost for analysis likely to be $50,000 - $500,000. Design/construction order of magnitude more.
6.1 B
6.1 C
Develop and implement comprehensive riparian ecosystem restoration plan and relevant floodplain management policies
Expand green infrastructure program to reduce impermeable surface areas and capture runoff from paved areas
$50-$500k
$1.5 M to construct systems to manage 5 acres of runoff/5 year period, beyond what is already funded
FEMA/Cal Offices of Emergency Services
Department of Water Resources Wildlife Conservation Board
Natural Resources Agency
Wildlife Conservation Board
Water Resources Control Board
6.2 A Conduct heat study/mapping to identify areas of Urban Heat Island <$50k Office of Planning and Research
6.2 B Enact reflectivity standards for asphalt and ground level surfaces; enact reflectivity/green roof standards for roofs <$50k California Transportation Commission
6.2 C Promote alternative building cooling strategies; enact standards <$50k
Table 7 Cross-Cutting Budget
California Energy Commission
Focus AreaAction #Action
Emergency Management7.1 A
7.1 B
7.1 C
7.2 A
ADAPTATION BUDGET
Develop temperature/heat safety protocols for outdoor work. Determine education and enforcement mechanisms.
$50-$500k Office of Planning and Research
Adjust/extend park and public facility hours during heat waves <$50k
Expand public drinking fountains/refillable water stations
$50-$500k
Update wildfire warning and evacuation protocols$50-$500k Public Information Officer
7.2 B Develop an early warning system for air quality alerts$50-$500k Office of Planning and Research
7.2 C
Ensure high-air-quality indoor spaces and purchase and distribute N-95 masks to vulnerable outdoor populations
$50-$500k Resilient Community
8.1 A Identify, fund, and prepare existing and new public facilities to serve as resilience hubs
$50-$500k
8.2 A Develop outreach to and comprehensive care strategy for vulnerable populations. $50-$500k
8.3 A Update Community Emergency Response Training (CERT) to include growing climate hazards <$50k
8.3 B Launch a Community Climate Action Grant <$50k
Table 8 Adaptation Budget
Office of Planning and Research
Office of Planning and Research
Office of Planning and Research
Implementing the CAAP
CONTINUED
IMPLEMENTATION TOOLS
The City has several tools at its disposal to help implement the CAAP. Some are less costly and take longer to develop, yet provide long-term benefits in the form of partnerships and engagement. Others, like innovative funding or financing options, are more costly but can provide immediate impact. The City will consider the following tools in CAAP implementation:
Form Relationships, then Alliances: By developing relationships with a broad base of community partners, the City can reduce its risk and help gain public support and trust. The relationships can be built into alliances that can be used as testing grounds for pilot projects. The City will consider developing relationships with organizations such as:
▶▶▶ The David & Lucile Packard Foundation
▶▶▶ Stanford Healthcare
▶▶▶ Silicon Valley Clean Energy
▶▶▶ PG&E
▶▶▶ Santa Clara Valley Transportation Authority
▶▶▶ Santa Clara County
▶▶▶ Valley Water
▶▶▶ Acterra
▶▶▶ Metropolitan Transportation Commission
▶▶▶ Association of Bay Area Governments
▶▶▶ Bay Area Air Quality Management District
▶▶▶ Caltrans
▶▶▶ Resilient by Design: Bay Area Challenge
▶▶▶ Silicon Valley Bicycle Coalition
▶▶ Silicon Valley 2.0
▶▶ Manzanita Works
▶▶ Joint Venture Silicon Valley
▶▶ Neighboring Jurisdictions
▶▶ Existing relationships including among all the stakeholders who participated in the plan development
Develop Innovative Pilots: The City can work independently or with community partners to launch pilots for new or unproven technologies and practices. These opportunities can be used for trial-and-error and information-gathering before scaling up programs, as well as increasing public awareness and engagement. A typical pilot schedule includes:
▶▶ YEAR 1: Launch pilot and collect stakeholder feedback
▶▶ YEAR 2: Roll out incentives that resonated with stakeholders
▶▶ YEAR 3: Report out on results of pilot (case study) and identify the 2nd level of implementation
Increase Public Engagement and Marketing: Working with City staff or a consultant, increase public awareness and participation in CAAP efforts and pilot programs. The following steps can be used to report progress and promote successes:
▶▶▶ Capture data- collect data on energy savings, water savings, and other metrics from pilot projects
▶▶▶ Evaluate data in-housecalculate energy, water, cost savings, etc. and conduct financial analysis to determine cost-effectiveness
▶▶▶ Internalize data- understand data in terms of broader CAAP goals
▶▶▶ Display data- share data with the public on City website and other channels
Explore Gamification Opportunities: Simple and inexpensive apps can be used to create fun and engaging activities that reduce greenhouse gas emissions. The following types of contests can be used to drive engagement:
▶▶▶ Neighborhood vs Neighborhood
▶▶▶ City vs City
▶▶▶ Apps to record commitments and spark action
City-Funded Incentives: Funding targeted programs is a good way for the City to demonstrate commitment and help spur action. The City will look for opportunities to fund programs or supplement funding available through other sources.
City-Led Innovative Financing: The City can explore innovative financing opportunities for the community such as Green Revolving Funds or Climate Impact Funds to create a dedicated funding stream for CAAP actions.
Implementing the CAAP
CONTINUED
MONITORING AND REPORTING
Monitoring the progress towards goals and reporting on results is a critical step in implementing the CAAP. The approach to monitoring climate mitigation and adaptation actions are different but both involve collecting information and data, analyzing results, and sharing those results with internal and public stakeholders.
MITIGATION MONITORING AND REPORTING
There are two approaches to monitoring and reporting of mitigation actions that the City will take. The first is a bottom-up approach, in which individual actions will be tracked for performance. This approach can help answer questions related to whether an action had its intended impact, whether it did so in a costeffective manner, and other lessons learned from its implementation. This view is highly useful to further inform decision making on where to invest in future emissions reduction strategies.
However, within the limited view of an individual action or group of actions, changes occurring at the citywide scale or some other higher level may obscure the impact of those actions when looking at the aggregate change in emissions. A top-down approach tracks the City’s progress towards its high-level targets like energy use and vehicle miles traveled reductions. This is important for understanding if we are on track to meet our goals, or if
we need to consider adjusting any of the programs. Regular performance of emissions re-inventories are a necessary part of performance monitoring to provide the top down perspective.
Taken together these two approaches will inform the scale of the effort required to continue upon the reduction pathways required to meet our targets, as well as the type of actions that are proving to be the most effective.
To support monitoring activities, the City will utilize the ClearPath platform developed by ICLIE. Monitoring records will be created to record information about the implementation and impact of actions, and reports designed to utilize the data contained in those records will reveal the individual achievements of actions and overall progress.
ClearPath, which contains the City’s 2005 and 2018 inventory records and was used to forecast emissions and develop the CAAP actions, will be used to produce a series of reports for the purposes of implementation and monitoring. Reports available in ClearPath include implementation details, status, progress, and efficacy, as well as reports on projected-toactual comparisons and indicator monitoring. The City will utilize these reports to track and communicate progress, both internally and to the broader community.
ADAPTATION MONITORING AND REPORTING
Since there are no overarching adaptation targets like greenhouse gas emissions, monitoring adaptation as a whole requires more qualitative assessments. The number of actions taken can be measured and metrics for each action serve as a useful baseline, but the degree to which Los Altos has or has not adapted cannot be measured quantitatively. As an example, the city will identify sites for installation of water fountains/refilling stations, track progress in installing the water fountains, and track their use. To track their use requires purchasing or upgrading water fountains with, at minimum, metering that is logged daily. Such data could be compared against extreme heat days, at minimum. A more sophisticated study would require surveys or interviews to determine how the water fountains help populations at risk from heat exhaustion. For instance, if vulnerable populations do not use the water fountains ever, and other populations use the fountains at times, but never during high heat events, then water fountains are not a successful strategy for ensuring safety during extreme heat.
For this reason, the Environmental Commission will receive updates from responsible parties implementing adaptation strategies and discuss how progress is made. If actions have not been taken, the Commission will discuss the reasons for shortcomings. Similarly, the Environmental Commission needs to
Implementing the CAAP
CONTINUED
determine whether actions that are successful by their internal metrics actually achieve the true goal of adaptation.
Additionally, annual meetings will incorporate information about the occurrence, impacts, and responses to hazardous climate risks like droughts, wildfires, and heat waves. The City and Environmental Commission should be able to amend the CAAP during its life cycle.
One of the most difficult aspects of climate change is that adaptation will likely not be completed in our lifetimes, but instead be an ongoing process. As such, the plan as a document and a guide for action needs to be re-evaluated and adjusted
in light of climate events and lessons learned from implementation.
ALIGNMENT WITH FUNDING RESOURCES
New costs associated with the implementation of this plan are expected to come in the form of capital investments, equipment, staff time, and professional services contracts. The funding sources listed in this section are intended to act as starting points to help consider financing options for actions.
The California legislature has passed significant new funding for climate action signed by the Governor. The requirements for disbursement of these funds have not yet been created, however the City will work with State
agencies and local legislators to prepare for many grant programs. At the time of this writing, infrastructure and climate spending at the Federal level has not been decided. The City must also consider funding projects itself if outside funding can’t be secured. It’s important to note that, although not quantified in this plan, the costs of inaction on climate change can be substantial and often far outweigh the costs of mitigation and adaptation. An analysis by the National Institute of Building Sciences found that for every $1 spent on mitigating natural hazards, $6 is saved.
Figure 19 shows the relationship between different funding sources and stakeholder groups.
FUNDING OPTIONS ANALYSIS: BENEFICIARIES AND LEVERAGE
STATE/ FEDERAL
STAKEHOLDERS TYPES OF REVENUE
STATE AND FEDERAL AGENCIES (GRANTS, SUBVENTIONS**)
REGIONAL AGENCIES (GRANTS, SUBVENTIONS**)
LOCAL/REGIONAL PUBLIC ENTERPRISES* (RATE REVENUE)
CITIES/COUNTIES (TAXES, CHARGES)
LOCAL PROPERTY OWNERS (FINANCING DISTRICT SPECIAL TAXES AND ASSESSMENTS)
* Utilities, Ports, airports, etc.
** Subventions are tax revenues passed through to lower-level agencies by formula rather than competitive grant
Implementing the CAAP
FUNDING IMPLEMENTATION
Funding is available and can be obtained from local taxes and fees, utility fees, and regional, State, and federal grants. Table 9 describes several sources of funding that Los Altos has the prerogative to create or adjust.
Financing District
Special Benefit-Based Assessments
Community Services/Facilities District
Special Taxes
Property Tax Increment
Property Tax
Tax
Fees
Utility User Tax
Parking Fee
Enterprise Fund
Development Fee
Carbon Development Impact Fee
Congestion Pricing
Bond
Levied on property owners in a neighborhood, business area, or defined geographic area in order to provide a benefit which that area receives.
Existing City tax on real estate, based on value of land and improvements
Cities and counties may impose UUTs on users' consumption of certain utility services such as utility delivered methane gas
User fees that can generate ongoing revenue, but may disincentive activities. For instance, a congestion pricing program set up to reduce driving may have a different structure than a program meant to raise funds. Enterprise funds require voter approval.
Bond measures are exclusively for capital improvements and require financing.
Implementing the CAAP CONTINUED
MITIGATION FUNDING SOURCES
Table 10 lists the primary funding sources for greenhouse gas mitigation actions. They range from utilities to regional organizations, to State and national opportunities. Each funding source will have specific
types of actions it can be used for, and consideration will be given to each when implementing actions. In addition, the City will continuously monitor these and new funding streams to assist in CAAP implementation.
Geography/ Agency Entity Program(s)
Geography/ Agency Entity
Utility Silicon Valley Clean Energy eHub
Utility Silicon Valley Clean Energy eHub
FUNDING SOURCES
Program(s)
Funding Amount/Description
Funding Amount/Description
Informational resource for home and vehicle electrification
Informational resource for home and vehicle electrification
Utility Silicon Valley Clean Energy FutureFit Program
Utility Silicon Valley Clean Energy FutureFit Program
$1,000-2,000 for heat pump water heaters
$1,000-2,000 for heat pump water heaters
Utility Silicon Valley Clean Energy FutureFit Assist
Utility Silicon Valley Clean Energy FutureFit Assist
Technical assistance for EVSE for commercial and multifamily property owners
Technical assistance for EVSE for commercial and multifamily property owners
Utility Silicon Valley Clean Energy Lights On Silicon Valley $500 rebates for solar+storage
Utility Silicon Valley Clean Energy Lights On Silicon Valley
UtilityPG&E
UtilityPG&E
UtilityPG&E
UtilityPG&E
UtilityCalWater
UtilityCalWater
Residential Rebates (thermostats, water heaters, etc.)
Residential Rebates (thermostats, water heaters, etc.)
Business Rebates (lighting, refrigeration, energy efficiency, etc.)
$500 rebates for solar+storage
$50-$1,000 rebates for home energy efficiency and resilience
$50-$1,000 rebates for home energy efficiency and resilience
Rebate programs for various types of businesses
Business Rebates (lighting, refrigeration, energy efficiency, etc.)
Residential and Commercial water efficiency rebate programs
Residential and Commercial water efficiency rebate programs
CountySanta Clara County BRACE Grants
CountySanta Clara County BRACE Grants
Bay AreaBayREN
Bay AreaBayREN
Bay AreaBayREN
Bay AreaBayREN
Home Energy Advisor program
Home Energy Advisor program
Single-family and multi-family electrification programs
Rebate programs for various types of businesses
$5-$300 rebates for water efficient fixtures and appliances
$5-$300 rebates for water efficient fixtures and appliances
Funding of up to $1.5 million for resilience building project activities from September 2021 through August 2026.
Funding of up to $1.5 million for resilience building project activities from September 2021 through August 2026.
Free energy efficiency resources for homes, commercial, and multifamily properties
Free energy efficiency resources for homes, commercial, and multifamily properties
Funding varies depending on programs
Single-family and multi-family electrification programs
Funding varies depending on programs
Bay AreaBayREN Water + Energy Efficiency program Varies depending on fixture/appliance
Bay AreaBayREN
Bay Area Santa Clara Valley Water District Landscape Rebate Program
Water + Energy Efficiency program
$3,000 for residential sites, $5,000 for commercial sites
Varies depending on fixture/appliance
Table 10 Mitigation funding sources
Bay Area
Santa Clara Valley Water District Landscape Rebate Program
$3,000 for residential sites, $5,000 for commercial sites
Bay AreaBayREN
Implementing the CAAP
Bay AreaBayREN
Geography/ Agency Entity
Bay Area
Single-family and multi-family electrification programs
Funding varies depending on programs
FUNDING SOURCES CONTINUED FROM PAGE 88
Water + Energy Efficiency program
Utility Silicon Valley Clean Energy eHub
Santa Clara Valley Water District Landscape Rebate Program
Varies depending on fixture/appliance
Informational resource for home and vehicle electrification
$3,000 for residential sites, $5,000 for commercial sites
Bay Area
Utility Silicon Valley Clean Energy FutureFit Program
Santa Clara Valley Water District Greywater Rebate Program
$1,000-2,000 for heat pump water heaters
$200-$400 for Laundry to landscape program
Bay Area
Utility Silicon Valley Clean Energy FutureFit Assist
Utility
Santa Clara Valley Transportation Authority (VTA)
Transit Oriented Development Program Partnership program
Silicon Valley Clean Energy Lights On Silicon Valley
Technical assistance for EVSE for commercial and multifamily property owners
Bay Area Metropolitan Transportation Commission Transportation project grants Multiple programs
$500 rebates for solar+storage
UtilityPG&E
Bay AreaBAAQMD
UtilityPG&E
Residential Rebates (thermostats, water heaters, etc.)
Vehicle Trip Reduction Grant Program
Business Rebates (lighting, refrigeration, energy efficiency, etc.)
Bay AreaBAAQMD Carl Moyer Program
UtilityCalWater
State of California California Climate Investments
Residential and Commercial water efficiency rebate programs
$50-$1,000 rebates for home energy efficiency and resilience
$2M for FYE 2022 cycle
Rebate programs for various types of businesses
$40 million-plus for on-road fleet vehicles, school buses, and off-road vehicles
$5-$300 rebates for water efficient fixtures and appliances
Clean mobility, urban greening, and community preparedness grants
CountySanta Clara County BRACE Grants
State of California CA Public Utilities Commission
Bay AreaBayREN
State of California California Energy Commission
Bay AreaBayREN
Funding of up to $1.5 million for resilience building project activities from September 2021 through August 2026.
Energy Upgrade California
Home Energy Advisor program
Single-family and multi-family electrification programs
Funding varies by program
Free energy efficiency resources for homes, commercial, and multifamily properties
California Electric Vehicle Infrastructure Project (CALeVIP)
Energy efficiency funding and resources
Funding varies by product
Funding varies depending on programs
State of California California Energy Commission
Energy Conservation Assistance Act
Bay AreaBayREN Water + Energy Efficiency program
Low Interest Loans
Bay Area
State of California California Energy Commission CEC grants
Santa Clara Valley Water District Landscape Rebate Program
State of California Caltrans
State of California Caltrans
of
Active Transportation Program
Varies depending on fixture/appliance
Funding for Energy Efficiency and Energy Generation projects
$3,000 for residential sites, $5,000 for commercial sites
List of current grant funding opportunities
Alternative transportation, bicycle, and Safe Routes to School grants
Table 10 Mitigation funding sources (continued from page 88)
Sustainable Transportation Planning Grants
$34M statewide for FY 22/23
State of California California Energy Commission CEC grants
Implementing the CAAP
State of California Caltrans
Utility
State of California Caltrans
Utility
List of current grant funding opportunities
FUNDING SOURCES CONTINUED FROM PAGE 89
Active Transportation Program
Silicon Valley Clean Energy eHub
Sustainable Transportation Planning Grants
Silicon Valley Clean Energy FutureFit Program
State of California Calbike (nonprofit)
Utility
State of California CA Air Resources Board
Funding Sources list
Silicon Valley Clean Energy FutureFit Assist
Clean Vehicle Rebate Project
Utility Silicon Valley Clean Energy Lights On Silicon Valley
Alternative transportation, bicycle, and Safe Routes to School grants
$34M statewide for FY 22/23
Informational resource for home and vehicle electrification
$1,000-2,000 for heat pump water heaters
Various funding sources
Technical assistance for EVSE for commercial and multifamily property owners
Up to $7,000 rebate for purchase or lease of new EV
$500 rebates for solar+storage
State of California CAL FIRE Urban and Community Forestry Grant Program Grant opportunities
Utility PG&E
Residential Rebates (thermostats, water heaters, etc.)
$50-$1,000 rebates for home energy efficiency and resilience
State of California California ReLeaf urban forestry grant programs Grant opportunities
Utility PG&E
FederalU.S. DOE
Utility CalWater
Business Rebates (lighting, refrigeration, energy efficiency, etc.)
Property Assessed Clean Energy (PACE) Financing
Residential and Commercial water efficiency rebate programs
Rebate programs for various types of businesses
Funding varies by program
$5-$300 rebates for water efficient fixtures and appliances
County Santa Clara County BRACE Grants
FederalU.S. DOE
Bay Area BayREN
FederalEPA
Bay Area BayREN
Federal U.S. Dept. of Transportation
Electric Vehicle Supply Equipment Loan and Rebate Program (small businesses)
Solar Energy System tax credits
Home Energy Advisor program
Single-family and multi-family electrification programs
Surface Transportation Block Grant Program
Bay Area BayREN Water + Energy Efficiency program
Bay Area
Federal U.S. Dept. of Transportation RAISE grants
Santa Clara Valley Water District Landscape Rebate Program
Rebate of 50% of the loan loss reserve amount
Funding of up to $1.5 million for resilience building project activities from September 2021 through August 2026.
Free energy efficiency resources for homes, commercial, and multifamily properties
Tax credits for solar water heaters and PV systems
Bay Area
Santa Clara Valley Water District Greywater Rebate Program
Funding varies depending on programs
Funding for projects on public road, pedestrian and bicycle infrastructure, and transit capital projects
Varies depending on fixture/appliance
Grants for transportation projects ($1BN for FY 21)
$3,000 for residential sites, $5,000 for commercial sites
$200-$400 for Laundry to Landscape program
Bay Area Santa Clara Valley Transportation Authority (VTA) Transit Oriented Development Program Partnership program
Implementing the CAAP
ADAPTATION FUNDING SOURCES
Table 11 contains sources of grants from government sources that fund activities that align with adaptation programs. Grants have the advantages of being “free cash,” but the disadvantages are that they are typically competitive, have funding criteria that may not align exactly with the desired adaptation action, and reporting requirements. Grants are typically one-time or multi-year and not available for long-term
actions. In California, many State grants are tied to specific ballot propositions (like Proposition 1, Proposition 68) and annual Budget Allocations. In September, 2021, Governor Newsom signed a budget for California Comeback Plan’s with over $15 billion in climate changerelated funding, including $3.69 billion for climate resilience. Much of the funding will be for grants as part of programs run by state agencies and intended for disbursements to local governments for planning
studies and one-time capital investments. These sources can be substantial.
Additional funding resources in the form of searchable databases are also available to the City, including the Cool California (CARB) Funding Wizard and the California Grants Portal offered by the State of California. These databases will be monitored regularly to take advantage of all available funding opportunities.
Implementing the CAAP CONTINUED
Implementing the CAAP
CONTINUED
A NOTE ON CONSUMPTIONBASED INVENTORIES
A Consumption-Based Inventory is a method used to calculate emissions from the goods and services we consume. These sources can include land management, the production of buildings, vehicles, food, and
consumer goods and services. Figure 20 describes the relationship between emissions included in Consumption-Based and SectorBased inventories. According to ICLEI, 45 percent of global emissions are directly linked to our lifestyles. As an affluent community, we in
SECTOR-BASED GHG EMISSIONS
GHG EMISSIONS FROM EXPORTED GOODS AND SERVICES
CONSUMERS OUTSIDE THE CITY
PRODUCTION INSIDE THE CITY CONSUMERS INSIDE THE CITY
SECTOR-BASED GHG EMISSIONS
Los Altos have a responsibility to be aware of the impact our actions have and consider changing our habits based on that impact.
Conducting a Consumption-Based Inventory helps provide a complete picture of emission caused not only
CONSUMPTION-BASED GHG EMISSIONS
GHG EMISSIONS FROM HOUSEHOLD USE OF FUEL AND ELECTRICITY, AND CONSUMPTION OF GOODS AND SERVICES PRODUCED IN THE CITY
PRODUCTION OUTSIDE THE CITY
GHG EMISSIONS FROM IMPORTED GOODS AND SERVICES
CONSUMPTION-BASED GHG EMISSIONS
Figure 20 Consumption-based inventories explained
LOS ALTOS
Implementing the CAAP
CONTINUED
by activities within the City, but also emissions caused by consumption habits, and provides useful insights to inform a holistic sustainability strategy. Consumption-Based Inventories are gaining traction among local, regional and state governments across the country. This approach encompasses the full lifecycle emissions of goods and services, including those from production, pre-purchase transportation, wholesale and retail, use, and post-consumer disposal.
Estimating consumption-based emissions helps cities illustrate the strong link between consumption and climate change and provides them with a platform for addressing consumption in climate action planning efforts. Specifically, this type of analysis provides a method for designing local programs that reduce emissions through:
• Targeting carbon-intensive consumption categories
• Targeting lifecycle phases (e.g. production, use) with the highest emissions
• Supporting shifts in consumption to those activities with lower emissions
Although a Consumption-Based Inventory (CBI) was beyond the scope of this update, Los Altos will consider conducting a CBI in the future to capture all emissions, both direct and caused by consumption patterns that arise as a result of our daily activities. Such an inventory will give a clearer picture of our impact, and further improve our community’s sustainability.
CONCLUSION
The goals of this plan are to set the City on a path towards carbon neutrality and climate resilience. The goals are ambitious, but ones that we believe we can achieve. There will undoubtedly be twists and turns on this path, and we will need to stay flexible and adaptive along the way. But if we can achieve these goals - carbon neutrality, equity, sustainability, resilience - we believe that we can create a community that is healthy, connected, and vibrant. Please fully participate in implementing this CAAP and see Appendix A presenting personal actions, entitled “What Can I Do Now?" to find suggestions for simple actions each individual can take to help, as well as refering to the Fact Sheet in Appendix B for a summary of key information.

Los Altos Climate Action & Adaptation Plan
Appendices
"WHAT CAN I DO NOW?"
TRANSPORTATION
• Before leaving home in your vehicle consider walking, biking, or taking public transportation. If not possible combine the activity with another that requires using your vehicle or complete the errand by internet or voice contact.
• Encourage your child to walk or bike to school.
• Arrange a carpool for work, school and activities.
• When you need to replace a vehicle, purchase or lease a new or used electric vehicle.
• Replace your gasoline powered home landscape and maintenance equipment with electric powered equipment.
• Require that your home landscape and maintenance service providers use electric powered equipment.
ENERGY
• Have an energy audit prepared for your residence.
• Complete recommended energy audit efficiency measures for your residence.
• Turn off appliances and lights when not in use. Consider installing motion sensors for light switches.
• Adjust your residence’s thermostat a degree or two to reduce energy used for heating and cooling. Install a smart thermostat to reduce energy use when not at home or when sleeping.
• Prepare to convert your home appliances from methane gas to electric powered.
• Change your home appliances from methane gas to electric powered when planned or upon burnout. Incentives are available through BayRen and SVCE for heat pump water heaters for example.
• Install solar panels + battery storage in your residence.
• Attend green building seminars hosted by the City.
• If you’re not already, become a Silicon Valley Clean Energy customer and opt up to the GreenPrime 100% renewable service option.
RESOURCE CONSERVATION
• Recycle all plastics, paper/ cardboard, glass, cans and food waste. Carefully sort your waste into blue bin recycling (glass, plastic, cans, paper), green bin (yard and food waste), and gray bin (landfill garbage; try to limit to less than 10% of total waste). Rinse plastic and glass containers and cans before sending to recycling.
• Do not purchase food and consumables in single-use plastic containers and packaging.
• Bring your own shopping and produce bags when shopping.
• Shop in bulk bins.
• Donate unwanted reusable items.
• Repair and reuse items.
• Buy gently used products instead of new.
• Convert residential landscaping to drought tolerant native plants.
• Remove or reduce lawn area if possible. Do not replace with artificial turf.
• Convert landscape irrigation to drip systems.
• Eat more fruits and vegetables and less meat.
• Minimize food waste.
• Reduce your water use: take shorter showers (avoid baths), install low flow fixtures (shower heads, toilets and faucets) and consider installing a greywater recycling system.
• When possible, avoid taking planes.
"WHAT CAN I DO NOW?"
MUNICIPAL OPERATIONS
• Support our City’s conservation and GHG reduction efforts.
GREEN COMMUNITY
• Eliminate rain and irrigation water runoff from your residence.
• Plant one or more new trees on your property.
• Plant a vegetable garden.
• Begin backyard composting and enrich your soil with compost and mulch.
• Do not use non-organic pesticides or herbicides.
CLIMATE RISK
• Evaluate your risk for flooding, excessive heat and poor air quality.
• Consider installing A/C and air purifiers in some rooms.
• Talk to your neighborhood CERT team about local climate risk emergency measures.
• Talk with your homeowner, business, or rental insurance provider about your coverage for flood and wildfire damage.
EMERGENCY MANAGEMENT
• Make sure you have a household emergency plan - know when to evacuate and when to shelter in place.
• Stock an emergency response kit with food, water, flashlights, batteries, N-95 masks, and personal needs.
• Know your vulnerabilities and plan for how to receive necessary assistance.
RESILIENT COMMUNITY
• Get to know your neighbors if you don’t already. Talk with them about their emergency plans. If you are part of a building, neighborhood, or homeowner association, make sure you understand how you and your neighbors can communicate before and during a climate disruption or disaster. Assist those with vulnerabilities.
• Participate in Neighborhood Watch and CERT groups.
• Share tools and seldom-used items with neighbors.
• Shop local and support small businesses.
• Educate yourself and others on how to reduce your carbon footprint.
• Speak out in support of City efforts to implement the CAAP.
CAAP GOAL
Carbon Neutrality by 2035
FOCUS AREA GOALS
TRANSPORTATION
Strategy 1: Reduce City-Wide Vehicle Miles Traveled by 25% by 2035 GOALS:
• Create a Walkable and Bikeable City
• Promote Smart Growth Strategies
• Support Shared Mobility
Strategy 2: Electrify Transportation GOALS:
• Reach 80% Community-Wide Electric Vehicle Adoption by 2035
• Accelerate Community-Wide Electric Vehicle Supply Equipment Sufficient to Support 80% EVs
Strategy 3: Electrify Off-Road Mobile Sources GOAL:
• Eliminate Off-Road Fossil Fuel Engines
ENERGY
Strategy 1: Reduce Emissions from Energy Consumption GOAL:
• Encourage Energy Conservation Measures in Homes and Businesses
Strategy 2: Facilitate Building Decarbonization GOALS:
• Require All-Electric New Buildings, ADUs, and Major Retrofits
• Reduce or Eliminate Methane Gas Use in Existing Buildings by Increasing Fuel Switching
• Disincentivize Methane Gas
Strategy 3: Increase Solar Energy Production GOAL:
• Expand Community Solar and Battery Storage
RESOURCE CONSERVATION
Strategy 1: Reduce Consumption and Waste GOALS:
• Decrease Landfill Waste by 15% and Eliminate Single-Use Plastics and Construction Waste by 2035
• Reduce Water Use by 15% by 2030
• Promote a Circular Economy
MUNICIPAL OPERATIONS
Strategy 1: Operate Sustainable Municipal Buildings GOALS:
• Reduce Municipal Building Energy Use by 30% by 2035
• Install Solar + Battery Storage at City facilities
Strategy 2: Reduce Municipal VMT GOALS:
• Convert 100% of the City's Fleet to Electric Vehicles by 2030
• Develop Guidelines for Sustainable Employee Commute and Business Travel
Strategy 3: Promote Green Municipal Practices GOALS:
• Prioritize Responsible Procurement
• Utilize Digital and Remote Systems to reduce VMT
Strategy 4: Integrate Climate Action and Adaptation into City Functions GOAL:
• Incorporate Climate Action and Adaptation into City Policy, Budget, Planning, & Internal Standards
GREEN COMMUNITY
Strategy 1: Develop Nature-Based Solutions Goals:
• Expand Green Infrastructure & Improve Water Resilience
• Sequester All Remaining Carbon by 2035
CLIMATE RISK
Strategy 1: Understand and Reduce Physical Risk Goals:
• Reduce Flood Risk
• Reduce Heat Risk
EMERGENCY MANAGEMENT
Strategy 1: Integrate Adaptation Into Emergency Preparedness and Response Goals:
• Ensure Safety During Extreme Heat
• Ensure Safety During Wildfire and Unhealthy Air Events
RESILIENT COMMUNITY
Strategy 1: Educate and Protect Residents Goals:
• Establish Resilience Hubs
• Identify and Protect Vulnerable Community Members
• Improve Climate Literacy and Risk Understanding
KEY ACTIONS
TRANSPORTATION
1. Fully implement the 2022 Complete Streets Master Plan by 2035 and make adjustments as needed to comply with VMT reduction objectives
2. Create a pedestrian-friendly Downtown and other community and commercial spaces throughout the city
3. Develop and implement a new Parking Management Plan that supports strategic VMT reduction
4. Pilot shared bike, ebike, and escooter programs, and partner with adjacent cities to improve first/last mile options
5. Support Transit-Oriented Development
6. Encourage Live Near Work incentives
7. Promote Work From Home policies and infrastructure
8. Develop an electric shuttle program as an alternative to SOV travel
9. Expand transit service, connectivity, and transit stop amenities
10. Require commercial Transportation Demand Management programs
11. Work with Los Altos School Districts to reduce VMT
12. Develop and promote community carshare and carpool programs
13. Increase education and awareness of available EV resources and incentive programs
14. Actively promote EV adoption and require EV-only parking
15. Increase the number of available Level 2 EV charging stations in workplace, commercial and multifamily areas
16. Create a citywide network of DC Fast Charging (DCFC) stations
17. Expand the current Electric Vehicle charging and prewiring requirements in future Reach Code updates
18. Identify grants and incentives to install residential EV charging including DCFD, solar EV charging, and paired EV charging + battery storage systems
19. Phase out off-road fossil fuel engines
KEY ACTIONS
ENERGY
1. Support third-party residential and commercial energy efficiency audits
2. Increase residential and commercial energy efficiency
3. Adopt evolving Reach Codes and expand to include large additions and major remodels
4. Accelerate residential HVAC replacements
5. Accelerate residential water heater replacements
6. Accelerate commercial HVAC replacements
7. Accelerate commercial water heater replacements
8. Establish a fee or penalty on the use of methane gas
9. Increase community solar capacity
10. Adopt Net Zero Building requirements for new construction by 2030
RESOURCE CONSERVATION
1. Increase the landfill diversion rate
2. Eliminate non-essential single-use plastics
3. Reduce waste from demolition, construction and building materials
4. Increase community-wide water efficiency
5. Promote sustainable food choices
6. Encourage responsible goods & services consumption
MUNICIPAL OPERATIONS
1. Audit appropriate City facilities and conduct comprehensive energy efficiency upgrades
2. Build new City buildings to Net Zero standards
3. Develop battery storage options and evaluate microgrids for cost savings and resilience
4. Develop a phase-out schedule to replace all City-owned fleet vehicles with electric vehicles
5. Improve City staff use of commute alternatives to single-occupant vehicles
6. Expand Work From Home and flexible schedule policies
7. Adopt a zero-waste policy for City facilities and City-sponsored events
8. Continue to allow virtual participation in public meetings
9. Account for climate change in all new City projects
10. Incorporate climate preparedness into City programs, operations, and maintenance protocols
11. Integrate CAAP goals into the budget process
KEY ACTIONS
GREEN COMMUNITY
1. Create water-efficient buildings and landscapes
2. Develop a partnership with the Regional Water Quality Control Plant to use recycled water from the plant
3. Increase urban tree canopy
4. Expand parks and natural wooded spaces
5. Pilot carbon farming opportunities
6. Eliminate the use of non-organic pesticides and herbicides
CLIMATE RISK
1. Update city-wide flood risk assessment and capital and policy recommendations
2. Develop and implement comprehensive riparian ecosystem restoration plan and relevant floodplain management policies
3. Expand green infrastructure program to reduce impermeable surface areas and capture runoff from paved areas
4. Conduct heat study/mapping to identify areas of Urban Heat Island
5. Enact reflectivity standards for asphalt and ground level surfaces; enact reflectivity/green roof standards for roofs
6. Promote alternative building cooling strategies; enact standards
EMERGENCY MANAGEMENT
1. Develop temperature/heat safety protocols for outdoor work; determine education and enforcement mechanisms
2. Adjust/extend park and public facility hours during heat waves
3. Expand public drinking fountains/refillable water stations
4. Update wildfire warning and evacuation protocols
5. Develop an early warning system for air quality alerts
6. Ensure high-air-quality indoor spaces and purchase and distribute N-95 masks to vulnerable outdoor populations
RESILIENT COMMUNITY
1. Identify, fund, and prepare existing and new public facilities to serve as resilience hubs
2. Develop outreach to and comprehensive care strategy for vulnerable populations
3. Update Community Emergency Response Training (CERT) to include growing climate hazards
4. Launch a Community Climate Action Grant
Glossary
Carbon Dioxide Equivalent
The amount of carbon dioxide (CO2) emission that would cause the same integrated radiative forcing or temperature change, over a given time horizon, as an emitted amount of a greenhouse gas (GHG) or a mixture of GHGs1
Carbon Neutrality
Reducing as many emissions as possible, sequestering the remaining emissions through nature-based solutions, and utilizing innovative carbon sequestration solutions, community-based sequestration projects, and local carbon offsets to reach zero net emissions.
Carbon Sequestration
The process of storing carbon in a carbon pool1.
Climate Change
Climate change refers to a change in the state of the climate that can be identified (e.g., by using statistical tests) by changes in the mean and/ or the variability of its properties and that persists for an extended period, typically decades or longer1.
Climate Mitigation
A human intervention to reduce emissions or enhance the sinks of greenhouse gases1
Climate Resilience
The capacity of social, economic and environmental systems to cope with a hazardous event or trend or disturbance, responding or reorganizing in ways that maintain their essential function, identity and structure while also maintaining the capacity for adaptation, learning and transformation1.
Climate Risk
The potential for adverse consequences where something of value is at stake and where the occurrence and degree of an outcome is uncertain. In the context of the assessment of climate impacts, the term risk is often used to refer to the potential for adverse consequences of a climate-related hazard, or of adaptation or mitigation responses to such a hazard, on lives, livelihoods, health and well-being, ecosystems and species, economic, social and cultural assets, services (including ecosystem services), and infrastructure1.
Climate Vulnerability
The propensity or predisposition to be adversely affected by climate change. Vulnerability encompasses a variety of concepts and elements including sensitivity or susceptibility to harm and lack of capacity to cope and adapt.
Co-benefits
The positive effects that a policy or measure aimed at one objective might have on other objectives, thereby increasing the total benefits for society or the environment1.
Consumption-Based Inventory
A consumption-based inventory (CBI), or consumption-based emissions inventory (CBEI), is a calculation of all of the greenhouse gas emissions associated with producing, transporting, using, and disposing of products and services consumed by a particular community or entity in a given time period (typically a year). A CBEI is a way to tally up a comprehensive emissions ‘footprint’ of a community2.
Decarbonization
The process by which countries, individuals or other entities aim to achieve zero fossil carbon existence. Typically refers to a reduction of the carbon emissions associated with electricity, industry and transport1.
Drought
A period of abnormally dry weather long enough to cause a serious hydrological imbalance. Drought is a relative term, therefore any discussion in terms of precipitation deficit must refer to the particular precipitation-related activity that is under discussion1
Electric Vehicle
A vehicle whose propulsion is powered fully or mostly by electricity1
Equity
Equity is the principle of fairness in burden sharing and is a basis for understanding how the impacts and responses to climate change, including costs and benefits, are distributed in and by society in more or less equal ways. It is often aligned with ideas of equality, fairness and justice and applied with respect to equity in the responsibility for, and distribution of, climate impacts and policies across society, generations, and gender, and in the sense of who participates and controls the processes of decision-making2
Global Warming
The estimated increase in global mean surface temperature (GMST) averaged over a 30-year period, or the 30-year period centered on a particular year or decade, expressed relative to pre-industrial levels unless otherwise specified1
1 IPCC, 2018: Annex I: Glossary [Matthews, J.B.R. (ed.)]. In: Global Warming of 1.5°C. An IPCC Special Report on the impacts of global warming of 1.5°C above pre-industrial levels and related global greenhouse gas emission pathways, in the context of strengthening the global response to the threat of climate change, sustainable development, and efforts to eradicate poverty [Masson-Delmotte, V., P. Zhai, H.-O. Pörtner, D. Roberts, J. Skea, P.R. Shukla, A. Pirani, W. Moufouma-Okia, C. Péan, R. Pidcock, S. Connors, J.B.R. Matthews, Y. Chen, X. Zhou, M.I. Gomis, E. Lonnoy, T. Maycock, M. Tignor, and T. Waterfield (eds.)]. In Press
2 Urban Sustainability Directors Network website: What is a CBEI, retrieved 1.23.22
Glossary
Green Infrastructure
The interconnected set of natural and constructed ecological systems, green spaces and other landscape features. It includes planted and indigenous trees, wetlands, parks, green open spaces and original grassland and woodlands, as well as possible building and street-level design interventions that incorporate vegetation3.
Greenhouse Gas
Greenhouse gases are those gaseous constituents of the atmosphere, both natural and anthropogenic, that absorb and emit radiation at specific wavelengths within the spectrum of terrestrial radiation emitted by the Earth’s surface, the atmosphere itself and by clouds. This property causes the greenhouse effect3
Heat Island Effect
Heat islands are urbanized areas that experience higher temperatures than outlying areas4.
Microgrid
A microgrid is a self-sufficient energy system that serves a discrete geographic footprint, such as a college campus, hospital complex, business center, or neighborhood5.
Reach Code
In California, Title 24 of the Code of Regulations sets the building code standards for all jurisdictions statewide. However, local governments can adopt more stringent requirements, which are known as reach codes6
Sustainability
A dynamic process that guarantees the persistence of natural and human systems in an equitable manner3.
Smart Growth
"Smart growth" covers a range of development and conservation strategies that help protect our health and natural environment and make our communities more attractive, economically stronger, and more socially diverse7.
Transit-Oriented Development
Transit-oriented development, or TOD, includes a mix of commercial, residential, office and entertainment centered around or located near a transit station. Dense, walkable, mixed-use development near transit attracts people and adds to vibrant, connected communities8
Transportation Demand Management
Transportation demand management (TDM), or simply demand management, is defined a set of strategies aimed at maximizing traveler choices9.
Zero Net Energy Building
An energy-efficient building where, on a source energy basis, the actual annual consumed energy is less than or equal to the on-site renewable generated energy10
3 IPCC, 2018: Annex I: Glossary [Matthews, J.B.R. (ed.)]. In: Global Warming of 1.5°C. An IPCC Special Report on the impacts of global warming of 1.5°C above pre-industrial levels and related global greenhouse gas emission pathways, in the context of strengthening the global response to the threat of climate change, sustainable development, and efforts to eradicate poverty [Masson-Delmotte, V., P. Zhai, H.-O. Pörtner, D. Roberts, J. Skea, P.R. Shukla, A. Pirani, W. Moufouma-Okia, C. Péan, R. Pidcock, S. Connors, J.B.R. Matthews, Y. Chen, X. Zhou, M.I. Gomis, E. Lonnoy, T. Maycock, M. Tignor, and T. Waterfield (eds.)]. In Press
4 US EPA website: Heat Island Effect, retrieved 1.23.22
5 Microgrid Knowledge website: What is a microgrid, retrieved 1.23.22
6 BayREN website: Reach Codes & Polices, retrieved 1.23.22
7 US EPA website: About Smart Growth, retrieved 1.23.22
8 Federal Transit Administration website: Transit-Oriented Development, retrieved 1.23.22
9 Federal Highway Administration website: Transportation Demand Management, retrieved 1.23.22
10 CA Public Utilities Commission website: Zero Net Energy, retrieved 1.23.22
ACTIONS LIST
1.1 A Fully implement the 2022 Complete Streets Master Plan by 2035 and make adjustments as needed to comply with VMT reduction objectives
1.1 B Create a pedestrian-friendly Downtown and other community and commercial spaces throughout the city
1.1 C Develop and implement a new Parking Management Plan that supports strategic VMT reduction
1.1 D Pilot shared bike, ebike, and escooter programs, and partner with adjacent cities to improve first/last mile options
1.2 A Support Transit-Oriented Development
1.2 B Encourage Live Near Work incentives
1.2 C Promote Work From Home policies and infrastructure
1.3 A Develop an electric shuttle program as an alternative to SOV travel
1.3 B Expand transit service, connectivity, and transit stop amenities
1.3 C Require commercial Transportation Demand Management programs
1.3 D Work with Los Altos School Districts to reduce VMT
1.3 E Develop and promote community carshare and carpool programs
Strategy: Reduce City-Wide Vehicle Miles Traveled by 25% by 2035 Goal: Create a Walkable and Bikeable City
Work closely with Complete Streets commission to fully implement the 2022 Complete Streets Master Plan by 2035, with a focus on specific measures to reduce VMT. Reassess the development of specific citywide protected bike corridors. Maintain and expand access to businesses while promoting slow streets with biking and walking access. Improve the safety and attractiveness of walking downtown through traffic calming, dedicated pedestrian trails and streets, accelerating the development of green downtown plazas, and other strategies. Fully implement all Safe Routes to School programs in the CSMP. Consider an ordinance to reduce speed limits. 2,682
Establish Car-Free zones and one-way traffic Downtown and in other commercial and community areas to encourage non-vehicular travel. Expand sidewalk space and dedicate specific streets for pedestrian and cycling use only. Create safe, sheltered, outdoor areas for pedestrians and increase the number of bicycle racks for cyclists. Base development on 15-minute city principles.
Develop and implement a community-wide Parking Management Plan that reduces minimum requirements and sets upper limits on parking spaces for new development. Ensure the strategy is based on three principles: increasing dedicated EV and handicapped parking spaces in key commercial areas, reducing the parking footprint (turn into green space), and add specific drop-off and pick up zones at strategic locations. Plan for street and parking lot changes to accommodate conversion to passenger pick-up and drop-off stops at commercial and other public land use locations.
Develop pilot bike, ebike and escooter sharing programs by 2025. Expand programs by 2030 based on lessons learned. Explore regulations to promote the safe and responsible operation of ebikes and escooters including issuing permits to private companies and designating dedicated parking spaces at key locations. Partner with adjacent cities to enable first/last mile travel shuttles to train stations/commuter hubs, including regional networks of ebike, scooter, shuttle, and TNC routes.
Goal: Promote Smart Growth Strategies
Require increased residential and commercial density and diversity along main corridors and commercial areas, including affordable multi-family housing and mixed-use developments. Encourage Transit-Oriented Development along major bus routes within and outside of the City to attract new employers and better serve the daily needs of residents and employees. Set a target of at least a 15% increase in the percent of the city’s population living in high-density Transit-Oriented Development by 2035. Integration with the City’s Housing Element (ensure meeting RHNA commitments encourages high-density & affordable housing in transitaccessible/walkable areas). 1,278
Work with Los Altos employers and schools to develop a plan to provide affordable housing or rent assistance for employees to live close to work. Ensure new low-income and multiuse development is high density housing located no more than a 10-minute walk or bike ride from transit stops.
Require new multifamily residential developments with 10 or more units to provide Work From Home spaces. Support future conversion of commercial developments to residential uses as appropriate. Work with local Wi-Fi providers to expand coverage and speed.
Goal: Support Shared Mobility
89
786
Work with local public and private organizations to develop an electric shuttle program for cross-town traffic, including "short hops" along main streets and key commercial areas. Explore autonomous options when the program is mature and expand as needed. supportive (grouped strategy)
Engage with transportation partners like VTA to expand zero emission transit service in City limits. Explore the creation of shaded and green commuter amenities and increased bicycle parking in order to help promote a public transit culture. Develop a green mobility app that allows users to check on EV shuttle routes and arrival times, see where available bikes and scooters are and potentially reserve directly on the app. Include VTA transit routes and schedule, location of EV chargers and whether they’re free. Provide City funding or seek other funding sources to support these efforts.
Implement, mandate, enforce, actively promote, and use Transportation Demand Management strategies (TDM is defined as a set of strategies aimed at maximizing traveler choices). Require new nonresidential developments greater than 10,000 square feet or anticipated to include businesses with more than 50 employees to reduce VMT through TDM programs.
Support a rotating car-free day program at local schools and as part of other local events to raise awareness about school commute alternatives. Encourage partnerships with private schools to develop and implement school bus programs that reduce school-related SOV commutes. Work with School Districts in Los Altos and surrounding cities (Mountain View, Palo Alto, Cupertino, Los Altos Hills) to encourage EV shuttle service for students living >1mile from their neighborhood schools.
Explore opportunities with carsharing companies to add or expand service in Los Altos. Develop a target number of shared cars available to individuals. Mandate that all shared vehicles be EV. Follow progress of shared autonomous vehicle testing regionally and consider developing ordinances and policies to guide shared AV use in City limits.
Strategy: Electrify Transportation Goal: Reach 80% Community-Wide Electric Vehicle Adoption by 2035
1,559
1.4 A Increase education & awareness of available EV resources and incentive programs
Develop a yearly EV fair with participation from local
1.4 B Actively promote EV adoption and require EV-only parking Negotiate a discount program with local car dealerships to offer rebates or other incentives to car buyers purchasing new or used EVs. Require businesses to set aside a percentage of parking spaces for EVs.
Goal: Accelerate Community-Wide Electric Vehicle Supply Equipment Sufficient to Support 80% EVs
1.5 A Increase the number of available Level 2 EV charging stations in workplace, commercial and multifamily areas Increase the number of available Level 2 EV charging stations at businesses with >50 employees, multifamily homes of >10 units, and in commercial areas. supportive of 1.4 B
1.5 B Create a citywide network of DC Fast Charging (DCFC) stations
Create a network of DC Fast Charging (DCFC) stations Downtown and in other commercial areas, as well as along major vehicle corridors. Set a 1-mile target for DCFC stations. Engage local gas stations to explore conversion to DCFC centers.
of 1.4 B
1.5 C Double the current Electric Vehicle charging and pre-wiring requirements in future Reach Code updates
1.5 D Identify grants and incentives to install residential EV charging including DCFC, solar EV charging, and paired EV charging + battery storage systems
1.6 A Phase out off-road fossil fuel engines such as landscaping and construction equipment
2.1 A Support 3rd party residential and commercial energy audits
2.1 B Increase residential and commercial energy efficiency
Continue the current requirements for EV pre-wiring and Level 2 charging in new single-family development and extend to include large remodels and additions, and double the requirements for new multi-family and commercial development as part of future Reach Code updates
Identify grants and incentives available through State, federal, or local agencies that may be used to support solar EV charging and battery storage. Work with SVCE to expand existing EV resources and programs. supportive of 1.4
Strategy: Electrify Off-Road Mobile Sources Goal: Eliminate Off-Road Fossil Fuel Engines
Accelerate phase out small off-road fossil fuel engines such as landscaping equipment through bans, replacement ordinances, and/or incentives for electric alternatives. Work to reduce construction-related GHG emissions.
Strategy: Reduce Emissions from Energy Consumption Goal: Encourage energy conservation measures in homes and businesses
Provide resources to support energy audits including listing of approved providers, listing of incentives programs, and other resources. Work with approved providers to perform energy audits. supportive
Develop a program to increase energy efficiency in existing residential buildings including wall and ceiling insulation, roof replacements, new ducting and windows, lighting upgrades, and outdoor amenities upgrades. Identify outside funding and provide City funding to perform upgrades identified in energy audits performed under action 2.1 A, and ensure eligible residents and businesses take advantage of all available energy efficiency incentive programs.
Goal: Require All-Electric New Buildings and Major Retrofits
2.2 A Adopt evolving Reach Codes and expand to include large additions and major remodels Adopt Reach Codes that go beyond Title 24 standards during every code cycle, including Zero Net Energy (ZNE) requirements. Expand new building codes to include large remodels and Accessory Dwelling Units (ADUs). 10,751
2.3 A Accelerate residential HVAC replacements
Goal: Reduce or Eliminate of Methane Gas Use in Existing Buildings by Increasing Fuel Switching
Develop a program to replace methane gas HVAC (heating, ventilation, and air conditioning) units in existing residential buildings with electric alternatives. Require permits and enforce compliance for HVAC replacements. Develop a "Replace upon Burnout" and "Replace upon Sale/Remodel" ordinance for HVAC units. Adopt an ordinance making it mandatory to replace all methane gas HVAC units with electric alternatives by 2035, with exemptions for low-income residents and Seniors. Provide education and outreach to residents and property owners. 9,118
2.3 B Accelerate residential water heater replacements
Develop a program to replace methane gas hot water heaters in existing residential buildings with electric alternatives. Require permits and enforce compliance for water heater replacements. Develop a "Replace upon Burnout" and "Replace upon Sale/Remodel" ordinance for water heaters. Adopt an ordinance making it mandatory to replace all methane gas water heaters with electric alternatives by 2035, with exemptions for low-income residents and Seniors. Provide education and outreach to residents and property owners. 7,766
2.3 C Accelerate commercial HVAC replacements
2.3 D Accelerate commercial water heater replacements
Develop a program to replace methane gas HVAC units in existing commercial buildings with electric alternatives. Require permits and enforce compliance for HVAC replacements. Waive permit fees for electric HVAC units. Consider a "Replace upon Burnout" and "Replace upon Sale/Remodel" ordinance for HVAC units. Adopt an ordinance making it mandatory to replace methane gas HVAC units with electric alternatives by 2035. Provide education and outreach to property owners.
Develop a program to replace methane gas hot water heaters in existing commercial buildings with electric alternatives. Require permits and enforce compliance for water heater replacements. Waive permit fees for electric water heaters. Consider a "Replace upon Burnout" and "Replace upon Sale/Remodel" ordinance for water heaters. Adopt an ordinance making it mandatory to replace methane gas water heaters with electric alternatives by 2035. Provide education and outreach to property owners.
Goal: Disincentivize Methane Gas
2.4 A Establish a fee or penalty on the use of methane gas Work with PG&E and community partners to develop or expand a fee on the use of methane gas within City limits. Set up a City-led Task Force in 2022 to lead this effort. Funds collected will be used to fund incentives for electric appliances adoption. Potential estimated funds available each year of at least $500k.
Strategy: Increase Solar Energy Production
Goal: Expand Community Solar and Battery Storage
2.5 A Increase community solar capacity Increase solar panel requirements in new construction from 4kW to 6kW minimum, and add solar panel requirement for large additions and remodels (>4kW). Ensure residents and businesses are aware of and take advantage of incentive programs for solar panels.
3,476
3,305
2.5 B Adopt Net Zero Building requirements for new construction by 2030 2030Adopt Net Zero Building requirements following New Building Institute guidelines by 2030. Add solar requirements sufficient to power Net Zero homes to future Reach Code updates. Encourage battery storage systems of 10 kWh or more through promotion of incentive or rebate programs, educational campaigns, and/or pilot programs. Encourage participation in demand response programs to improve grid resiliency. 2
Strategy: Reduce Consumption and Waste
Goal: Decrease Landfill Waste 15% and Eliminate Single-Use Plastics and Construction Waste by 2035
3.1 A I ncrease the landfill diversion rate Increase landfill diversion rate to
3.1 B Eliminate non-essential single-use plastics Adopt a new ordinance to eliminate non-essential single-use plastics and prioritize reusable foodware and utensils. Ensure all new single-use foodware and utensils are compostable per guidelines from the Franchise Waste Hauler.
3.1 C Reduce waste from demolition, construction and building materials Develop an ordinance requiring the deconstruction of old buildings instead of demolition and the recycling/reuse of materials. Provide incentives to builders for the use of environmentally friendly construction materials. supportive
3.2 A Increase communitywide water efficiency
3.3 A Promote sustainable food choices
3.3 B Encourage responsible goods & services consumption
Goal: Reduce Water Use At Least 15% by 2030
Increase education and awareness of water efficiency programs through Calwater and other organizations. Continue to support implementation of the 2015 UWMP through enforcement of the 2015 Model Water Efficient Landscape Ordinance. Develop an ordinance requiring conversion of grass lawns to low-water landscaping. Consider an update to the building code prohibiting new grass lawns.
Goal: Promote a Circular Economy
Expand consumer education and awareness of sustainable and plant-based food choices through City media channels, speaker series, and other methods. Work with the current vendor to expand the farmers market into a year-round event. Work with local restaurants to increase organic, vegetarian, and farm-to-table menu options and reduce food waste.
Increase education & awareness of circular economy concepts, including responsible purchasing habits and the promotion of a Repair, Reuse, Recovery, and Refurbishment economy. Provide support and resources to help local businesses participate in green business programs.
Strategy: Operate Sustainable Municipal Buildings Goal: Reduce Municipal Building Energy Use 30% by 2035
4.1 A Audit appropriate City facilities and conduct comprehensive energy efficiency upgrades Audit appropriate City facilities and conduct comprehensive energy efficiency upgrades focusing on energyefficient lighting, motion sensors, appliances, and HVAC systems. Develop a 10-year phase-out program in which all existing methane gas appliances are replaced with comparable electric alternatives.
Goal: Install Solar + Battery Storage at City facilities
4.2 A Build new City buildings to Net Zero standards Ensure all new buildings are Net Zero with solar panels, battery storage and electric efficient appliances. Align with CA Public Utilities Commission Zero Net Energy goals and definitions.
4.2 B Develop battery storage options and evaluate microgrids for cost savings and resilience
4.3 A Develop a phase-out schedule to replace all City-owned fleet vehicles with electric vehicles
4.4 A Improve City staff use of commute alternatives to single-occupant vehicles
4.4 B Expand Work From Home and flexible schedule policies
Install ground- or roof-mounted solar panels at select City buildings and facilities. Explore options for microgrids capable of going into "island mode" and serving as resilience hubs during power outages.
Strategy: Reduce Municipal VMT Goal: Convert 100% of the City's Fleet to Electric Vehicles by 2030
Develop a phase-out schedule to replace all City-owned fleet vehicles with comparable electric versions by 2030. Conduct a feasibility study to determine the optimal number and location of municipal and public chargers at City facilities and properties, and install sufficient Level 2 charging to charge EV fleet and staffowned EVs.
Goal: Develop Guidelines for Sustainable Employee Commute and Business Travel
Increase options for commute alternatives, including information and materials that identify available transit and alternative transportation routes. Encourage staff to buy and use EVs through incentives, free charging at City facilities, and incentives for EV purchases.
Expand the current policy to facilitate alternative work schedule or telecommuting options for City staff to reduce daily commute trips. Evaluate flexible employee schedules that allow for at least 50% remote work while maintaining City hours of operation.
Strategy: Promote Green Municipal Practices Goal: Prioritize Responsible Procurement
4.5 A Adopt a zero-waste policy for City facilities and City-sponsored events Adopt a policy that requires City-owned buildings and facilities to be zero waste. Develop an action plan to eliminate waste through diversion and recycling. Work with event vendors and participants to eliminate waste at City-sponsored events.
4.5 B Continue to allow virtual participation in public meetings
Goal: Utilize Digital and Remote Systems to reduce VMT
Decrease community Vehicle Miles Traveled by continuing to allow virtual participation at all public meetings. Allow for public comment by virtual participants. supportive
Strategy: Integrate Climate Action and Adaptation into City Functions Goal: Incorporate Climate Action and Adaptation into City Policy, Budget, Planning, & Internal Standards
4.6 A Account for climate change in all new City projects
Establish an interdepartmental working group to integrate climate preparedness in planning, maintenance, and capital improvements though the development of work plans, screening of capital improvements, and cross-sector collaboration. Establish protocols for mitigating public health impacts from heat and air quality with regional agencies and partners.
4.6 B Incorporate climate preparedness into City programs, operations, and maintenance protocols Ensure that maintenance reflects expected future climate conditions and variability and not historical climate data for all City buildings, facilities, structures, and infrastructure.
4.6 C Integrate CAAP goals into City projects as an order of business Integrate annual CAAP goals during the budget review process at the direction of the City Manager. Plan to inventory City GHG emissions every two years using ClearPath and track against targets.
Strategy: Develop Nature-Based Solutions
Goal: Expand Green Infrastructure & Improve Water Resilience
5.1 A Create water-efficient buildings and landscapes Update building code to incentivize rainwater harvesting and greywater recycling. Install systems at municipal facilities. Develop resources to help residents purchase water-saving equipment, and encourage rainwater harvesting strategies. Adopt mandatory guidelines requiring a set of stormwater and greywater management features in new construction. Utilize reissuance of City’s National Pollution Discharge Elimination System (NPDES) permit starting July 2022 to lower threshold for regulation. Partner with local and global organizations to identify space and resources to enhance the natural environment and rural feel of the city.
5.1 B Develop a partnership with the Regional Water Quality Control Plant to use recycled water from the plant Work with the Wastewater Treatment Plant to implement upgrades to provide a drought resilient, local water supply to increase the amount of recycled water production.
Goal: Sequester All Remaining Carbon by 2035
5.2 A Increase urban tree canopy Set
5.2 C Pilot carbon farming opportunities Identify land to plant intensive urban forests following the Miyawaki Method. Explore opportunities to develop carbon farming pilots for carbon sequestration. Partner with local organizations with available greenspace.
5.2 D Eliminate the use of non-organic pesticides and herbicides Ban the use of non-organic pesticides and herbicides throughout City green spaces. Develop education and incentivization programs for residents about use of alternatives to synthetic pesticides and herbicides.
6.1 A Update city-wide flood risk assessment and capital and policy recommendations
6.1 B Develop and implement comprehensive riparian ecosystem restoration plan and relevant floodplain management policies
6.1 C Expand green infrastructure program to reduce impermeable surface areas and capture runoff from paved areas
6.2 A Conduct heat study/mapping to identify areas of Urban Heat Island
6.2 B Enact reflectivity standards for asphalt and ground level surfaces; enact reflectivity/green roof standards for roofs
6.2 C Promote alternative building cooling strategies; enact standards
7.1 A Develop temperature/heat safety protocols for outdoor work. Determine education and enforcement mechanisms.
7.1 B Adjust/extend park and public facility hours during heat waves
7.1 C Expand public drinking fountains/refillable water stations
7.2 A Update wildfire warning and evacuation protocols
7.2 B Develop an early warning system for air quality alerts
7.2 C Ensure high-air-quality indoor spaces and purchase and distribute N-95 masks to vulnerable outdoor populations
8.1 A Identify, fund, and prepare existing and new public facilities to serve as resilience hubs
8.2 A Develop outreach to and comprehensive care strategy for vulnerable populations.
8.3 A Update Community Emergency Response Training (CERT) to include growing climate hazards
8.3 B Launch a Community Climate Action Grant
Strategy: Understand and Reduce Physical Risk Goal: Reduce Flood Risk
The hydraulic analyses that form FEMA's FIRM (Flood Insurance Rate Map) are decades old. Hire a company to perform hydraulic analyses of existing creek crossings and culverts to determine how many, if any, are undersized based on changing precipitation patterns (climate is typically based on 30-year data cycles). Replace/rebuild undersized culverts and creek crossings as needed. Work with FEMA to update the FIRMs.
Work with Valley Water to revitalize and restore creeks, learning from case studies like Adobe Creek Reach 5 Restoration. Restore the riparian ecosystem of creeks flowing through Los Altos, add managed ponds and dams to slow the flow of water, and increase percolation to the ground. Increase natural floodplain management through policies and education to establish "Buffer Zones" and limit new construction.
Implement porous paving in sidewalks, parking lots and driveways, and other water percolation methods like bioswales to reduce stormwater runoff to streets.
Reduce Heat Risk
Conduct heat study/mapping to identify areas of Urban Heat Island and address with capital and policy recommendations.
Require light-colored roofs and/or a minimum specified reflectance for commercial roofs when new or at replacement. Explore and implement guidelines to resurface streets and sidewalks with heat reflective surfaces.
Promote alternative cooling strategies like shade trees, green roofs, and building awnings. Determine and enact standards for new buildings
Strategy: Integrate Adaptation into Emergency Preparedness, Response Goal: Ensure Safety During Extreme Heat
Adjust construction policies to allow extended work hours (earlier or later than usual) to avoid peak daytime heat. Adjust/extend construction hours in Ordinance 6.16 Noise Control, Section 70 Prohibited Acts during heat waves to avoid peak daytime heat. Work with community groups and residents to determine best methods of outreach and communication with outdoor workers. Educate employers and workers about existing worker rights and protections and ways to protect outdoor workers from the effects of extreme heat
Adjust park facility hours to discourage active recreation during peak periods and extend open hours to early morning/late evening. Develop community cooling centers at City and non-City sites. Ensure temporary shade structures are provided for community events.
Locate at bus stops, Downtown shopping areas, trailheads, community centers, and sport courts/fields. n/a
Goal: Ensure Safety During Wildfires & Unhealthy Air Events
Ensure existing alert systems and safety measures are updated to address increasing climate risk and vulnerable, not easily mobile populations.
Partner with regional agencies to make wildfire and air quality prediction data widely used and accessible to all, including through an early warning system. If not feasible, develop Los Altos-specific warning system based on available and accessible data.
Two-pronged strategy to retrofit and/or install air filtration systems on resilience hubs, schools, and other facilities. Separately, provide face masks to filter air for outdoor workers and other vulnerable populations who need to be outdoors before and during bad-air-quality days.
Strategy: Educate and Protect Residents Goal: Establish Resilience Hubs
Conduct interviews with facility staff to determine their resilience to extreme heat, power outages, floods, and poor air quality. Compile and analyze to help prioritize investments and coordination. Identify suitable locations for/upgrade evacuation centers to serve as resilience hubs, safe zones, cooling centers, etc., depending on the event, with the capabilities to provide disaster assistance.
Goal: Identify and Protect Vulnerable Community Members
Conduct survey of and outreach to vulnerable populations (e.g. isolated seniors, outdoor workers, long-term care residents) and the people and institutions that care for them. Collaborate with community-based organizations to develop an inventory of locations with isolated seniors and develop a plan for a social support network during heat waves, bad air quality days, and other emergencies. Plan should include orders of assistance, including temporarily moving vulnerable populations to and from resilience hubs.
Goal: Improve Climate Literacy & Risk Understanding
Form partnerships with neighborhood-based organizations and businesses to develop Neighborhood Resilience Hub programs and prepare residents and respond to climate change. Develop community outreach and engagement materials.
Establish an annual micro-grant program to support local citizen-led projects and programs that will reduce emissions, adapt to climate change and enhance equity.
APPENDIX C: TECHNICAL APPENDIX
TECHNICAL APPENDIX
Technical
Appendix
This appendix contains a brief summary of changes between 2005 and 2018 emissions, as well as the data sources, assumptions, and methodologies used in the development of the CAAP.
Los Altos’ 2018 inventory is actually comprised of two inventories, one for the community and one for municipal operations. The International Council for Local Environmental Initiatives (ICLEI) provides protocols for both, which were used for these inventories. A base year of 2018 was chosen based on data quality and availability
Based on ICLEI guidance and in keeping with the 2013 CAP, the sectors included in the community inventory were:
• Transportation
o On-road emissions
o Off-road emissions
• Energy
o Residential energy
o Commercial energy
• Solid waste
• Water & wastewater
The sectors included in the municipal inventory were:
• Building energy
• Vehicle fleet
• Employee commute
• Solid waste
• Water & wastewater
• Streetlights & traffic signals
• Fugitive emissions
The most recent emissions factors for each source category were determined, and multiplied by the activity data to arrive at metric tons of carbon dioxide equivalent (MTCO2e). Results of these inventories show that Los Altos emitted 111,320 emissions in 2018, 110,192 arising from the community and 1,128 from municipal operations.
Of the community emissions, 63,280 came from the transportation sector, 43,196 from the energy sector, 2,653 from waste, and 1,063 from water and wastewater pumping and treatment. Of the municipal operations, 445 came from employee commute to and from work, 351 came from the City’s vehicle fleet, 172 came from solid waste, 134 from energy use, and 26 from all other sources.
When comparing 2005 and 2018 emissions, an overall reduction of 73,405 emissions was achieved, a reduction of 40 percent, exceeding the City’s 2020 reduction target by 25 percent. A large percentage of emissions reductions between 2013-2018 came as a result of joining the local Community Choice Aggregation (CCA) electricity provider. Silicon Valley Clean
APPENDIX C: TECHNICAL
Energy (SVCE). In addition to joining SVCE, Los Altos’ government has upgraded all City accounts to GreenPrime, SVCE’s 100% renewable generation service. The remaining reductions came as a result of increases in fuel economy, increased renewable energy used in wastewater treatment at the regional treatment facility, and the effects of actions adopted as part of the 2013 CAP
The largest source of 2018 municipal emissions was from employees commuting to and from work, creating 445 tons of CO2e. However, the volume of emissions created decreased from 697 MTCO2e in 2005 to 445 MTCO2e in 2018, most likely attributable to the increase in vehicle fuel efficiency over that time. Next were emissions from the City’s fleet of vehicles with 351 MTCO2e, then emissions from city-owned buildings and facilities with 134 MTCO2e, and then emissions from solid waste, water and wastewater treatment, and fugitive emissions with 198 MTCO2e combined. Emissions from streetlights and traffic signals were reduced to zero with the upgrade of all City accounts to GreenPrime.
The largest source of community emissions was from transportation and mobile sources, resulting in 63,280 MTCO2e. Overall though, emissions from transportation were reduced from 96,610 MTCO2e to 63,280 MTCO2e, a decrease of 34 percent. This decrease can likely be attributed to increases in fuel efficiency, increased electric vehicle adoption, and actions taken as part of the 2013 CAP. Next were emissions from residential and commercial energy, creating 35,661 and 7,535 MTCO2e respectively, then emissions from solid waste with 2,653 MTCO2e, and then water and wastewater treatment with 1,063 MTCO2e.
Joining SVCE helped reduce emissions from energy by 34 percent between 2005 and 2018 The remaining emissions came from a combination of natural gas, non-SVCE electricity customers, and the small percentage of non-renewable electricity supplied in 2018 by SVCE.
Overall, these results reflect a shift away from electricity production as a major source of emissions, with transportation and natural gas use by buildings remaining as large sources. Emissions from solid waste continue to decrease as diversion rates increase, and emissions from water and wastewater treatment decrease as the efficiency of processing equipment and renewable energy use both increase over time.
On the municipal side, employee commute is still the largest source of emission, but is somewhat beyond the direct control of the City and can be difficult to influence. Electrification of the vehicle fleet and the greening of City-owned building and facilities has reduced municipal emissions, but there is still room for improvement in these areas which are addressed in the 2022 CAAP.
A business-as-usual (BAU) forecast was developed in order to see what the City’s emissions might be in the future. By developing a set of forecasts using the inventory results as a baseline, the City was able to better understand what the remaining sources may be and how many emissions will need to be reduced to meet their climate goals. In general, community emissions were escalated by the rate of population growth, and municipal emissions were escalated by the rate of growth in number of households. Both assumptions are consistent with ICLEI guidance. Absent any other changes, the City’s emissions would increase slowly from 111,320 to 116,346 over time as the population grows.
APPENDIX C: TECHNICAL APPENDIX CONTINUED
A Adjusted Business-As-Usual Forecast
In addition to the BAU forecast, an adjusted business-as-usual (ABAU) forecast was developed to include the impacts of federal, State, and local actions already underway, as well as the expected increase in EV adoption rates and expected increase in AC use due to climate change
An ABAU + Impacts of Existing Actions was also developed to model the effects of actions taken as part of the 2013 CAP. The following carbon intensity factors were applied to each forecast series to arrive at the ABAU and the ABAU + Impacts of Existing Actions forecasts.
Sector
Carbon Intensity Factors
Residential electricity Impacts of Title 24 + Increase in AC use
Commercial electricity Impacts of Title 24 + Increase in AC use
Community transportation EV adoption increase + Impacts of Pavley II standard
The ABAU forecast shows that, including the impacts of federal, State, and local actions and the impacts of EV adoption and AC use increase, the City’s emissions would be expected to decrease to approximately 70,800 MTCO2e by 2050
1.1 A ClearPath, CAPCOA SDT-1, CAPCOA SDT-2
-3.3 person trips/day, avg. trip length 6 miles, 3.7% increase in bicycle mode share
-Assumes 1.4% VMT reduction -Assumes 1% VMT reduction
trips x trip length x increased mode share
Baseline VMT x % reduction
Baseline VMT x % reduction
1.1 B CAPCOA SDT-4 (grouped strategy) n/a n/a
1.1 C CAPCOA PDT-1, 2 and 3
1.1 D CAPCOA TRT-12, SDT4, SDT-5 and LUT-9
1.2 A ClearPath
Assumes 5.0% VMT reduction
Assumes 1% VMT reduction
Assumes 100% of population currently medium-high population density
0.1 FTE to develop and maintain program
Assumed $25k consultant fee to design outdoor pedestrian areas
Assumed 2 miles of bike lane at $25k/mile
Assumed 5k sqft new sidewalk at $5/sqft
Assumed 20 bus stops at $2k/stop
Baseline VMT x % reduction Assumed $400k to develop PMP
Baseline VMT x % reduction Assumed $25k consultant fee to design programs
0.1 FTE to administer program
0.05 FTE/year to engage with partners
Based on at least 15% shift to high-density 0.25 FTE/year to develop and administer program
1.2 BCAPCOA LUT-6Assumes 0.4% VMT reduction Baseline VMT x % reduction 0.1 FTE/year
Assumed 500 employees are low-income Assumed $500 incentive per employee
1.2 C CAPCOA TRT-6 Assumes 3.3% commute VMT reduction
5.5 x 0.2 (% of work trips) x 1.21 (avg. work trip length/avg. trip length)
1.3 A CAPCOA TST-6 grouped strategy n/a
0.1 FTE to develop and implement program (assume program is maintained 10 years and then is self-sufficient)
0.1 FTE to work with local wifi providers
Based on a survey of other CA programs
1.3 B CAPCOA TST-2, 3 and 4 Assumes 5% VMT reduction Baseline VMT x % reduction 0.05 FTE/year to engage partners
Assumed $25k consultant fee for Green Commuter Amenities plan
Assumed $50k for green mobility app
1.3 C CAPCOA TST-6 grouped strategy n/a 0.5 FTE/year to develop, implement, and enforce TDM program
1.3 D CAP 2013 Assumes 50% of youth ride bus, 3 miles/trip
1.3 E CAPCOA TRT-9 Assumes 1% VMT reduction
Youth not riding bus x trip length x number of events/year 0.2 FTE
Baseline VMT x % reduction
1.4 A GHG reductions included in 1.4 B n/a n/a
1.4 B ClearPath
Assumes 20% increase in EV adoption beyond ABAU to 80%
Assumes 23.6 MPG average fleetwide fuel economy
Assumes 99 MPG average EV fuel economy (includes 45% hybrid)
1.5 A supportive of 1.4 B n/a
Percent change in EV x change in fuel economy x Percent of gas vehicles displaced
20 public chargers/year x percharger VMT reduction 50 private chargers/year x per-charger VMT reduction
1.5 B supportive of 1.4 B n/a n/a
1.5 C supportive of 1.4 B n/a
0.05 FTE/year to engage carsharing companies and follow AV progress
0.1 FTE/year to develop and administer programs
Assumed $3,000 to develop EV fair
Assumed $2,000 to develop webinar series
Assumed $50,000 in incentives 0.1 FTE to develop program (1-time cost) 0.1 FTE/year to administer program for 10 years
0.1 FTE to develop ordinance 0.1 FTE/year to administer program
0.2 FTE/year to develop and implement program
Assumes $50k per charger
10 new public chargers/year x per-charger VMT reduction 0.1 FTE
1.5 D supportive of 1.4 B n/a n/a
1.6 A CAP 2013 n/a n/a
0.05 FTE/year to research funding opportunities and engage with partners
0.1 FTE to develop and administer program
Assumed 1,000 leaf blowers replaced Assumed $50 incentive per leaf blower
2.1 A GHG reductions included in 2.1 B n/a n/a
2.1 B Built Environment Calculator
2.2 A Built Environment Calculator
Assumes 665 units retrofitted/year
Assumes an average of 1,462 kWh and 1,070 therm savings/year/unit
Assumes 14 new MFD or retrofits/year
Assumes 417 kWh savings per MFD
Assumes 150 new SFD or retrofits/year Assumes 165 kWh savings per SFD
Number of appliances replaced x per-appliance savings (cumulative)
Number of new or retrofitted MFD/SFD x per-MFD/SFD increase/decrease (cumulative)
0.2 FTE/year to develop and administer program
Assumed $500/audit Assumed 100 incentives/year
0.5 FTE
Assumes $1,000 per incentive Assumes 100 incentives/year
0.1 FTE to develop ordinances
2.3 A Built Environment Calculator
2.3 B Built Environment Calculator
2.3 C Built Environment Calculator
Assumes 665 HVACs replaced/year
Assumes an average of 2,370 kWh increase and 319 therm decrease/unit/year
Assumes 665 DHWs replaced/year
Assumes an average of 1,416 kWh increase and 239 therm decrease/unit/year
Assumes 43 small business and 36 medium-sized business HVACs replaced/year
Assumes all hotel HVACs replaced by 2035
Assumes an average of 4,980 kWh increase and 575 therm decrease/unit/year
2.3 D Built Environment Calculator Assumes 43 small business and 36 medium-sized business DHWs replaced/year
Assumes all hotel DHWs replaced by 2035
Assumes an average of 4,312 kWh increase and 519 therm decrease/unit/year
2.4 A n/a
2.5 A ClearPath
Units replaced x per-unit savings (cumulative)
Units replaced x per-unit savings (cumulative)
Units replaced x per-unit savings (cumulative)
0.25 FTE/year to develop and administer program
Assumed $5k for seminars and educational material
0.25 FTE/year to develop and administer program
Assumed $5k for seminars and educational material
0.25 FTE/year to develop and administer program
Assumed $5k for seminars and educational material
Units replaced x per-unit savings (cumulative) 0.25 FTE/year to develop and administer program
Assumed $5k for seminars and educational material
FTE/year to develop and administer program
FTE/year to develop and administer program
2.5 B Built Environment Calculator Increased kWh x electricity emissions factor 0.05 FTE/year to
3.1
3.1 B n/a
3.1 C grouped strategy (GHG reductions included in 3.1 A) n/a
3.2 A CAP 2013 n/a
3.3 B no methodology n/a
FTE to develop ordinance
FTE to develop ordinance
FTE/year for monitoring & compliance Assumes $1,000 per incentive Assumes 100 incentives/year
FTE/year for outreach & education
4.1 A CAP 2013 Assumes 30% reduction in energy use kWh/therm reduction x kWh/therm emissions factors Estimated $60k per building, for 10 buildings
4.2 A no data n/a n/a
4.2 B City's electricity is carbon-free; no GHG reductions n/a n/a
4.3 A ClearPath Assumes current 22 MPG for fleet Assumes fleet mileage grows at rate of household growth
FTE to develop guidelines
Assumed $40k for solar + storage installation Assumed $2.1M for 1MW of microgrid capacity
0.05 FTE/year to monitor system
Change in fuel economy x change in VMT replaced 0.1 FTE/year to administer program
4.4 A CAPCOA TRT-1 Assumes 2% VMT reduction VMT reduction x per-mile emissions factor
Assumed $500k incremental cost of EVs Assumed $100k in EVSE
Assumed total cash incentives of $10k 0.05 FTE/year to develop and administer programs
APPENDIX E TECHNICAL APPENDIX
4.5
4.5
5.2
5.2
develop ordinance
Assumes $300,000 per impervious acre managed. Memo from Geosyntec consultants (2018) estimates an average range of $100-200K/acre impervious area treated with green infrastructure. The Santa Clara Valley Urban Runoff Pollution Prevention Program's Stormwater Resource Plan (2019) lists a range of $35K-$600K/acre impervious area treated with green infrastructure. Lower costs are typically for much larger sites like stormwater detention ponds.
6.2
6.2 Cn/a
8.3
IMPLEMENTATION LEADS, PARTNERS, COSTS, AND FUNDING SOURCES
IMPLEMENTATION LEADS, PARTNERS, COSTS, AND FUNDING SOURCES
IMPLEMENTATION LEADS, PARTNERS, COSTS, AND FUNDING SOURCES
Advisor program Property Assessed Clean Energy (PACE) Financing Energy Upgrade California
2.3
IMPLEMENTATION LEADS, PARTNERS, COSTS, AND FUNDING SOURCES
IMPLEMENTATION LEADS, PARTNERS, COSTS, AND FUNDING SOURCES
$1.5 M to construct systems to manage 5 acres of runoff/5 year period, beyond what is already funded
Natural Resources Agency
Wildlife
Board
Water Resources Control Board
Urban Greening Program
Protect Fish and Wildlife from Changing Conditions
Section 319 Nonpoint Source Pollution Grants
IMPLEMENTATION
IMPLEMENTATION TIMELINE AND KPIs
IMPLEMENTATION TIMELINE AND KPIs
IMPLEMENTATION TIMELINE AND KPIs
IMPLEMENTATION TIMELINE AND KPIs
of
Up-to-date list of City projects with descriptions of sustainable procedures, project lifespan, climate parameters and emissions scenario considered
Number and percent of City plans and standards incorporating climate change.
4.6
Number and percent of city departments with staff with designated climate mitigation and/or adaptation roles.
Percent of Buildings with Rainwater Harvesting Systems.
Percent of Buildings with Greywater Systems.
Acres private Green stormwater Infrastructure as reported to the Santa Clara Valley Urban Runoff Pollution Prevention Program (SCVURPPP) and submitted as part of City’s annual stormwater report to the Water Board
Number of Systems at Municipal Facilities.
Percent of Municipal Facilities with Greywater systems
Percent of Municipal Facilities with Rainwater Harvesting. Number and amount of incentives/rebates provided
List completed, current, and published annually
Acres of wilderness/natural areas Acres of Impervious Park Area
5.2 C
5.2
Ordinance
6.1 B x Comprehensive Riparian Ecosystem Restoration Plan Developed. Pilot projects funded.
IMPLEMENTATION TIMELINE AND KPIs
Number of green infrastructure installations Acres of public impervious area managed by GSI submitted as part of City’s annual stormwater report to the Water Board.
6.1
Percent of projects completed, in construction, in designHeat Study conducted with policy and capital project recommendations.
Heat Management Plan Developed and Piloted
6.2
6.2
Number of engagements
Heat Safety Protocols Enacted. Education and Enforcement Mechanisms Piloted Education and Enforcement Mechanisms finalized 7.1
Policy enacted, staff overtime paid for 7.1
Number of drinking fountains/refillable water stations Existing public fountains identified, new sites identified, 25% of projects completed, 75% of remaining sites funded
Protocols and city documents updated
7.2
7.2
Number
8.2
APPENDIX H:
CLIMATE VULNERABILITY ASSESSMENT FOR THE CITY OF LOS ALTOS, CA
Appendix E: Climate Vulnerability Assessment for the City of Los Altos, CA
Prepared by EcoShift Consulting
Executive Summary
The City of Los Altos (Los Altos) is located on the eastern edge of the Santa Cruz mountains, roughly 15 miles East of the Pacific Ocean and 5 miles from the San Francisco Bay. Proximity to these large water bodies has made for a stable climate and will somewhat temper future climate hazards compared to other areas in California.
This Vulnerability Assessment is intended to assist Los Altos in understanding the climate risks it faces under future emissions scenarios. In keeping with California Senate Bill 379, the assessment relies on resources provided by the California Governor’s Office of Emergency Services (OES) including Cal-Adapt and the California Adaptation Planning Guide to describe how the frequency� and intensity� of climate hazards are changing. The Vulnerability Assessment is just the first step in Los Altos’ effort in planning for and adapting to climate change, outlined in Los Altos’ Climate Action & Adaptation Plan (CAAP). The Vulnerability Assessment is an appendix to the CAAP. The documents should be read together
Purpose of SB 379
Senate Bill No. 379 of the California Legislature requires local jurisdictions to address climate adaptation and resiliency strategies in either the local hazard mitigation plan or an update to the safety element of a jurisdiction’s General Plan, depending on the date of adoption of a local hazard mitigation plan. The update includes a climate vulnerability assessment “identifying the risks that climate change poses...and the geographic areas at risk,” along with a set of goals and strategies to address those risks.
TheCal-Adapttoolandprojectionsofclimatechangetakenfromothergovernment plansdescribehowclimateischanging,buttheydonotdescribewhattheimpact willbeonLosAltos.ThegoaloftheVulnerabilityAssessmentistounderstandhow andhowmuchachangingclimatewillimpactthecommunitysectors-assets, people,economy-thatmakeLosAltoswhatitis.Adaptationstrategiesdeveloped in response to the Vulnerability Assessment are described in the CAAP.
APPENDIX H: CLIMATE VULNERABILITY ASSESSMENT FOR THE CITY OF LOS ALTOS, CA CONTINUED
Introduction
Natural variability in the climate and weather produce extreme events like droughts, wildfires, and floods over long time periods While natural systems respond to and even rely on these phenomena, our dense settlement and production of greenhouse gas emissions have greatly changed the impacts of climate hazards. Increased capture of solar radiation, generally referred to as global warming or climate change, is having massive and long-term effects on climatic conditions and global systems like the water cycle, jet stream and ocean currents that transfer energy. Generally, the oceans are rising and temperatures are increasing. Disruptions in jet stream patterns have caused highly unseasonal weather Some naturally occurring hazards are expected to occur more frequently and with greater intensity, putting our infrastructure, environment, housing, and populations at greater risk.
Indicators of Climate Change in California, a report prepared by the Office of Environmental Health Hazard Assessment, describes the rapidity with which climate change has impacted the state Included are the following statements 1
● Average maximum temperatures have increased by 2.2°Farenheit over the past century
● The 2012 to 2016 drought was the most extreme since instrumental records began, producing a moisture deficit not seen in the last 1,200 years. It is consistent with a trend of California becoming increasingly dry
● Glaciers in the Sierra Nevada have decreased in area dramatically, with several of the largest glaciers decreasing by half
● The amount of water stored in the state’s snowpack has been highly variable from year to year, dropping to a record low 5% of the historical average in 2015 Snowmelt runoff during April through July has declined
● The area burned by wildfires across the state is increasing.
● Over the past 80 years, California’s forests have been changing in response to decreasing water availability, driven by warmer temperatures Small trees and oaks have increased, while pines have decreased.
While efforts at the State and County levels have addressed climate risks and methods to mitigate them, this document is the first to consider the climate risk to Los Altos on the local level, in accordance with SB 379 Although future climate conditions are not certain, models developed by the scientific community and recommended by the California Governor’s Office of Emergency Services (OES) provide a range of possible changes to the climate and serve as the technical basis for understanding Los Altos’ climate risk
1 Office of Environmental Health Hazard Assessment, California Environmental Protection Agency (2018). Indicators of Climate Change in California. Sacramento, California.
APPENDIX H: CLIMATE VULNERABILITY ASSESSMENT
FOR THE CITY OF LOS ALTOS, CA CONTINUED
Background
California has been divided into 16 different climate zones based on shared characteristics to understand the energy needs for heating and cooling throughout the year Los Altos is in California Climate Zone 4, which uses San Jose as a reference city. The climate in Zone 4, of which Los Altos is at the very northern boundary, is inland enough to have hot summers but is influenced by the ocean which moderates high and low temperature extremes Much of the year falls within the comfort zone of 68-80F Typically, winters are cool and wet However, Los Altos is in “ i h d ” f h S C i li i i i i i i ll as w
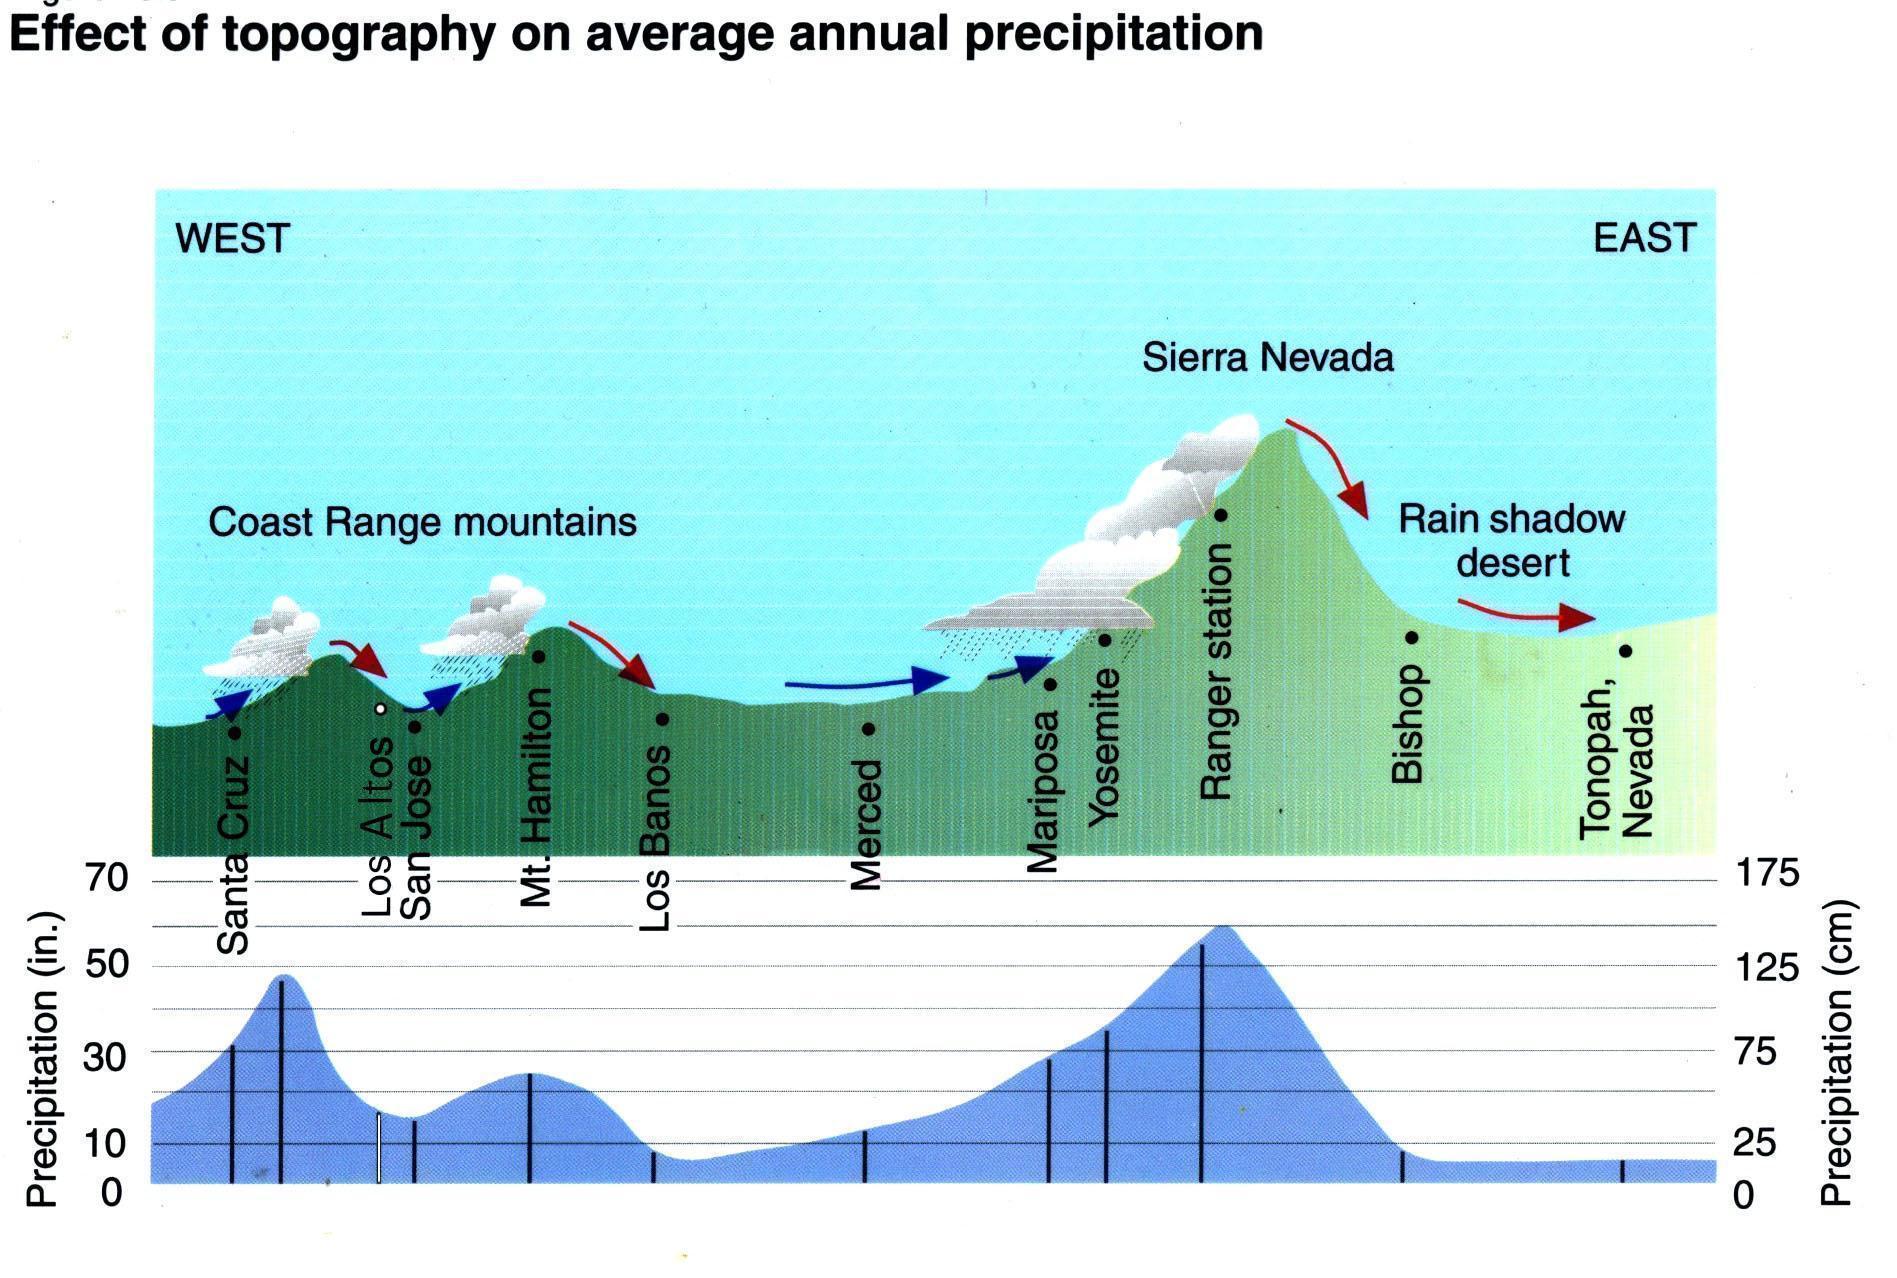
Figure 1: Relationship Between Topography and Precipitation in Simplified Cross Section of California showing how Los Altos is in a rain shadow of the Santa Cruz Mountains (Modified from: C Ahrens, Essentials of Meteorology , 2nd Edition)
Climate Hazard History in Los Altos
Los Altos has experienced many climate hazards since its incorporation almost 75 years ago and more in recorded history The frequency of these hazards provides a baseline for considering future hazards, even if Los Altos continues to change and the rate of climate change is increasing. Greenhouse gas emissions will change the frequency and intensity of experienced climate hazards but will not introduce new hazards altogether Many of these experienced hazards are enumerated in Table 1 of Federally declared disasters. Table 1 indicates the relative prevalence of climate
APPENDIX H: CLIMATE VULNERABILITY ASSESSMENT
FOR THE CITY OF LOS ALTOS, CA CONTINUED
hazards that reach the level of Federal disaster declaration Severe winter storms that caused flooding were the most frequent climate event followed by wildfires. Since the Federal government declares disasters at a county-wide scale, the severity of damage to Los Altos specifically is difficult to ascertain from this data set alone.
hazards that reach the level of Federal disaster declaration. Severe winter storms that caused flooding were the most frequent climate event followed by wildfires. Since the Federal government declares disasters at a county-wide scale, the severity of damage to Los Altos specifically is difficult to ascertain from this data set alone
Incident
Biological
Biological
Coastal Storm
Coastal Storm
COVID-19
COVID-19
COVID-19 PANDEMIC
COVID-19 PANDEMIC
COASTAL STORMS, FLOODS, SLIDES & TORNADOES
COASTAL STORMS, FLOODS, SLIDES & TORNADOES
Drought DROUGHT
Drought DROUGHT
March 13, 2020 EM-3428-CA
March 13, 2020
EM-3428-CA
March 22, 2020 DR-4482-CA
March 22, 2020 DR-4482-CA
February 9, 1983 DR-677-CA
February 9, 1983 DR-677-CA
January 20, 1977 EM-3023-CA
January 20, 1977
EM-3023-CA
Earthquake LOMA PRIETA EARTHQUAKE October 18, 1989 DR-845-CA
Earthquake LOMA PRIETA EARTHQUAKE
Fire GRASS, WILDLANDS, & FOREST FIRES
CROY FIRE
Fire GRASS, WILDLANDS, & FOREST FIRES
CROY FIRE
SUMMIT FIRE
SUMMIT FIRE
WILDFIRES
WILDFIRES
SCU LIGHTNING COMPLEX FIRE
SCU LIGHTNING COMPLEX
FIRE
WILDFIRES
WILDFIRES
SEVERE STORMS, FLOOD, MUDSLIDES & HIGH TIDE
SEVERE STORMS, FLOOD, MUDSLIDES & HIGH TIDE
Flood
Flood
SEVERE STORMS & FLOODING
SEVERE STORMS & FLOODING
SEVERE WINTER STORMS, FLOODING, AND MUDSLIDES
Freezing SEVERE FREEZE
SEVERE WINTER STORMS, FLOODING, AND MUDSLIDES
Freezing SEVERE FREEZE
Hurricane HURRICANE KATRINA EVACUATION
Hurricane HURRICANE KATRINA
EVACUATION
SEVERE WINTER STORMS, FLOODING, LANDSLIDES, MUD FLOWS
SEVERE WINTER STORMS, FLOODING, LANDSLIDES, MUD FLOWS
SEVERE WINTER STORMS, FLOODING LANDSLIDES, MUD FLOW
October 18, 1989
DR-845-CA
July 18, 1985 DR-739-CA
July 18, 1985
DR-739-CA
September 25, 2002 FM-2465-CA
September 25, 2002
FM-2465-CA
May 22, 2008 FM-2766-CA
May 22, 2008
FM-2766-CA
June 28, 2008 EM-3287-CA
June 28, 2008
EM-3287-CA
August 21, 2020 FM-5338-CA
August 21, 2020 FM-5338-CA
August 22, 2020 DR-4558-CA
August 22, 2020 DR-4558-CA
January 7, 1982 DR-651-CA
January 7, 1982
DR-651-CA
February 21, 1986 DR-758-CA
February 21, 1986
DR-758-CA
April 1, 2017 DR-4308-CA
Severe Storm(s)
Severe Storm(s)
SEVERE WINTER STORMS, FLOODING LANDSLIDES, MUD FLOW
SEVERE STORMS, FLOODING, MUD AND LANDSLIDES
SEVERE STORMS, FLOODING, MUD AND LANDSLIDES
SEVERE WINTER STORMS AND FLOODING
SEVERE WINTER STORMS, FLOODING, AND MUDSLIDES
SEVERE WINTER STORMS AND FLOODING
SEVERE WINTER STORMS, FLOODING, AND MUDSLIDES
February 11, 1991 DR-894-CA
April 1, 2017
February 11, 1991
DR-4308-CA
DR-894-CA
September 13, 2005 EM-3248-CA
September 13, 2005
EM-3248-CA
January 10, 1995 DR-1044-CA
January 10, 1995 DR-1044-CA
March 12, 1995 DR-1046-CA
March 12, 1995 DR-1046-CA
January 4, 1997 DR-1155-CA
February 9, 1998 DR-1203-CA
January 4, 1997 DR-1155-CA
February 9, 1998 DR-1203-CA
February 14, 2017 DR-4301-CA
February 14, 2017 DR-4301-CA
Table 1: Relative prevalence of climate hazards that reach the level of Federal disaster declaration
FEMA declares disasters on a county level, even if the disaster only affected part of the county. Pandemics and earthquakes, though shown in Table 1, are not climate hazards so are not discussed in this report Notably absent from the table are several
APPENDIX H: CLIMATE VULNERABILITY ASSESSMENT
FOR THE CITY OF LOS ALTOS, CA CONTINUED
Table 1: Relative prevalence of climate hazards that reach the level of Federal disaster declaration
FEMA declares disasters on a county level, even if the disaster only affected part of the county. Pandemics and earthquakes, though shown in Table 1, are not climate hazards so are not discussed in this report Notably absent from the table are several multi-year droughts, based on how FEMA calculates event losses The only FEMA-declared emergency classified as a drought - in all of California’s historyoccurred in 1977. However, Santa Clara County has experienced three additional extended year droughts: 1987-1992, 2007-2009, 2012-2017 As of this writing (summer 2021), California is experiencing persistent severe drought
Based on this history and Cal-Adapts projections, this vulnerability assessment has been framed around three climate-related groups of hazards:
1 Temperature, Extreme Heat & Drought
2. Precipitation & Flooding
3 Wildfires & Air pollution
Reports produced by other jurisdictions may include different climate variables and climate hazards, or categorize the variables and hazards differently based on their climate conditions
Temperature, Extreme Heat & Drought
Average temperatures and the number of extreme heat days are projected to increase throughout the century, according to Cal-Adapt. The number of extreme heat days are projected to be almost 300% more in a high emissions scenario than in a medium emissions scenario
Whether or not droughts get worse depends on the definition of drought. One definition is a prolonged period with below-average or no precipitation The length of dry spells is expected to increase as much as 15%, while average annual precipitation is not expected to change. Higher temperatures combined with less consistent rain will impact both water supply and outdoor water demand.
Climate Hazards like droughts, heat waves, and air pollution are stressors that are usually less dynamic than floods or wildfires. Droughts occur on a slower timeline and can last longer than other climate hazards Droughts may not cause a loss of property or impair infrastructure like other hazards, but prolonged droughts impact the environment, the economy, and residents’ quality of life. The Santa Clara County Operational Area (OA) Hazard Mitigation Plan declares:
Historical drought data regarding Santa Clara County OA indicate four significant droughts over the last 40 years, with drought occurring in 12 of those 40 years Based on risk factors and this history, droughts likely will continue to occur in the Santa Clara County OA. Moreover, as temperatures increase, probability of future droughts will
APPENDIX H: CLIMATE VULNERABILITY ASSESSMENT
FOR THE CITY OF LOS ALTOS, CA CONTINUED
likely increase as well Therefore, droughts likely will occur in Santa Clara County at varied severities in the future, even after conclusion of the current [2012-2017]drought 2
Similarly, across Santa Clara County, several extreme heat events were experienced in the past 20 years, including during 2000, 2006, and 2009 None of these were Federally-declared disasters. Yet heat waves have become stronger across the region, including mid-summer night-time heat waves and increases in day-time heat waves Though heat waves are invisible, they can have great impacts on human health, particularly for vulnerable populations
Precipitation & Flooding
Los Altos has experienced numerous severe winter storms that have caused flooding, and multiple climate models predict at least one severe storm a year under high emissions scenarios by the end of the century (See the section Future Changes to Climate Hazards, below). Interestingly, while severe storms will happen more frequently, they will not be much more intense according to projections produced by Cal-Adapt Similarly, the average annual precipitation is not expected to change
Floods are caused by the duration, intensity, and spatial distribution of precipitation interacting with terrain and land use characteristics like ground cover. In other words, floods are not exclusively a climate hazard They are the result of a climate phenomenon in interaction with physical conditions These local conditions that influence flooding range from short-term characteristics such as soil moisture to long-standing features like the size of storm sewers. Similarly, the impact of floods depend on what is flooded: The storms of 1998 caused overtopping of Adobe Creek, flooding properties and damaging structures in Los Altos Redwood Grove Nature Preserve, but producing much less damage than if somehow downtown were flooded
Wildfires & Air Pollution
Despite increased temperatures, wildfires are not projected to be a significantly worse threat in the future for Los Altos, based on the average area burned by wildfires. That indicator of wildfires is projected to decrease as Los Altos urbanizes. Regionally, Los Altos and the surrounding area is not high risk, though the relative risk for natural areas in the Santa Cruz mountains is projected to increase slightly CAL FIRE’s somewhat outdated maps do not consider Los Altos or most of the areas around Los Altos to be very high fire hazard severity zones because they are urban. The closest very high fire hazard areas are in southern Cupertino and Saratoga. Some areas west of Los Altos are in a high hazard severity zone.
However, the analysis is limited to direct wildfire impact in Los Altos – acres burned Secondary impacts like air pollution can be significant and prolonged
2 Santa Clara County Operational Area Mitigation Plan , Office of Emergency Services, p 117, http://sanjose granicus com/MetaViewer php?event id=2690&meta id=642821, accessed June 8, 2021
APPENDIX H: CLIMATE VULNERABILITY ASSESSMENT
FOR THE CITY OF LOS ALTOS, CA CONTINUED
In some ways, wildfires are an interesting analog to floods, influenced both by weather and local conditions. The Santa Clara County Climate Adaptation Guidebook describes this complexity “Weather is one of the most significant factors in determining the severity of wildfires; [however,] natural fire patterns are driven [both] by conditions such as drought, temperature, precipitation, and wind, and also by changes to vegetation structure and fuel (i.e.) biomass availability.” Just as floods are exacerbated by high soil moisture, wildfires are more destructive when they occur on top of strong droughts
Of course, wildfires can start from any number of human sources and not only during dry weather Like floods, wildfires present the greatest risk to life and property when they cross the wildland urban interface into developed areas. However, the spread and duration of wildfires is less predictable than floods. Wildfires are most likely to spread through embers directed by wind and the air currents of the fire itself
These air currents can bring particulate matter hundreds of miles from the fire. During the SCU Fire and even the Paradise Fire, Los Altos was impacted by poor air quality which kept people in their homes 3 Summer can already produce poor air quality due to photochemical (sunlight) smog and the long-term suspension of particulate matter that rain in the winter and spring dissolves These periods of air pollution increase the health risk for people with pre-existing respiratory conditions and/or who experience occupational hazards through outdoor work.
3 As shared in the Apr 23, 2021 focus group
APPENDIX H: CLIMATE VULNERABILITY ASSESSMENT FOR THE CITY OF LOS ALTOS, CA CONTINUED
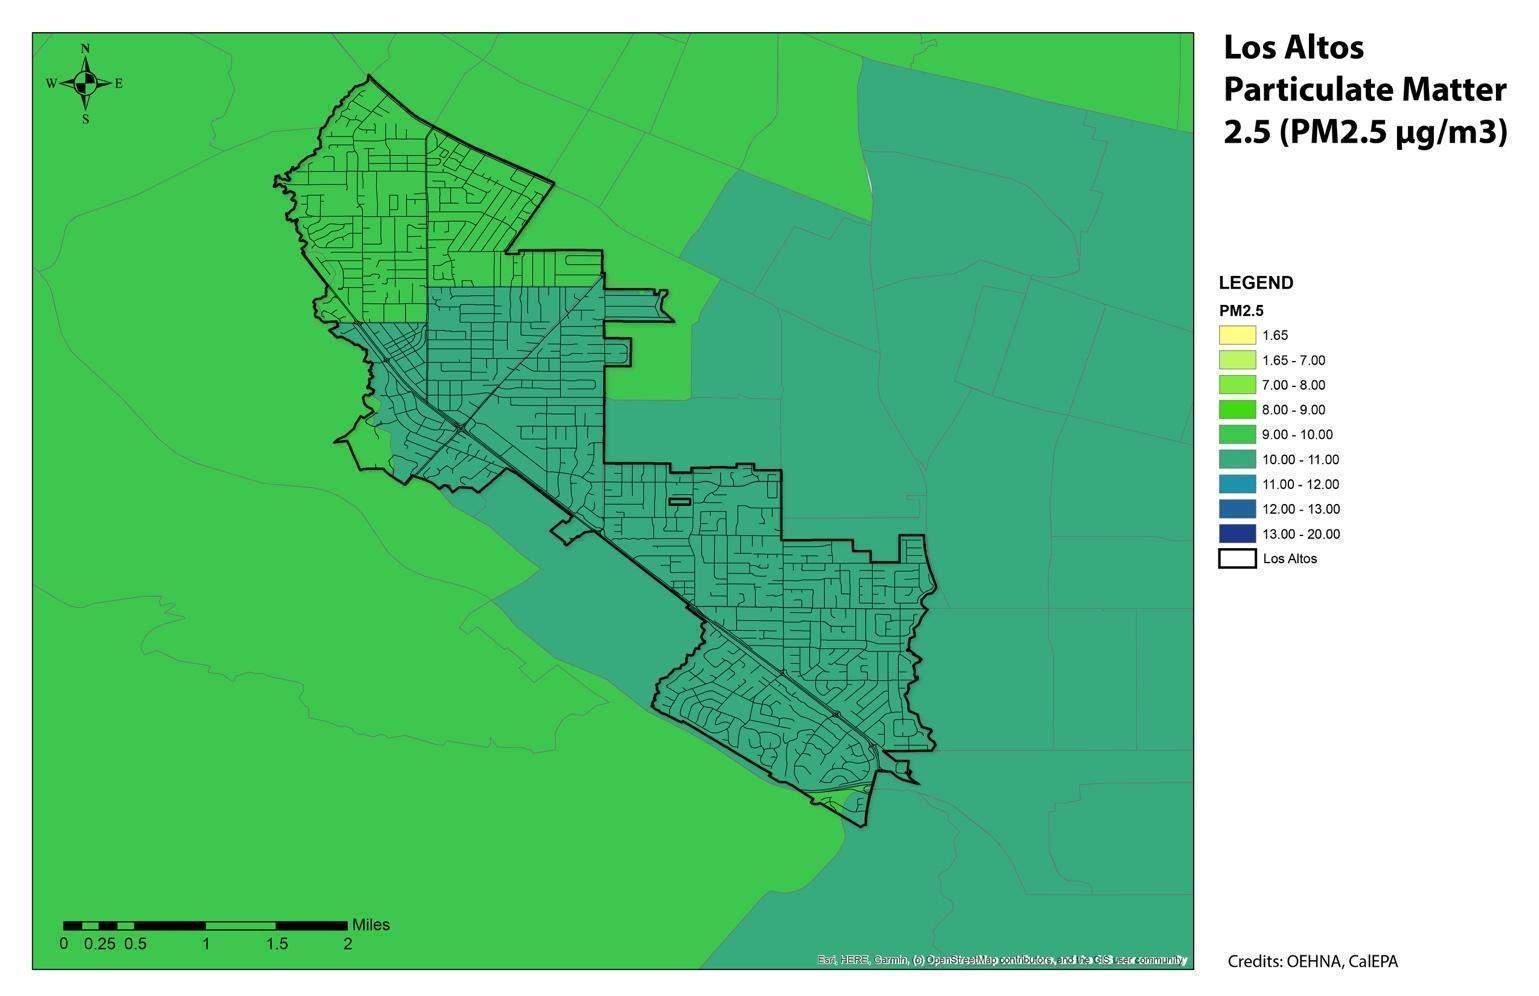
Figure 2: Average concentration of particulate matter 2.5 in Los Altos and surrounding area
Although a verdant city, Los Altos has only average air quality. The Bay Area as well as the Central Valley south of Sacramento are all non-attainment areas for ambient air quality standards Figure 2 shows the concentration of Particulate Matter 2 5, a specifically harmful irritant According to OEHHA, “PM2 5 can have adverse effects on the heart and lungs, including lung irritation, exacerbation of existing respiratory disease, and cardiovascular effects. The US EPA has set a new [in the last decade] standard for ambient PM2 5 concentration of 12 μg/m3, down from 15 μg/m3 ” Most of Los Altos is higher than 10 μg/m3 The EPA classifies the whole of Santa Clara County as “moderate” in the category of PM 2 5 It should be noted that ozone, another indicator of air quality, has improved considerably throughout the Bay Area since the 1960s. Given the moderate baseline air quality, added pollution from wildfires even far from Los Altos can create unhealthy levels of PM2 5
4
THE CITY OF LOS ALTOS, CA CONTINUED
Future Changes to Climate Hazards
There are several sources of information about future climate hazards and their impact on Los Altos. Described below is information from several State, County, and local documents and tools. These sources are not exhaustive, nor are they entirely in agreement, however, together they provide a helpful composite.
California State Hazard Mitigation Plan
The California State Hazard Mitigation Plan is the state’s primary document which describes historical and current hazards and articulates goals to mitigate those hazards to reduce injury, death, and damage. The Hazard Mitigation Plan is helpful background for the Vulnerability Assessment, although hazard mitigation is not exactly the same as climate adaptation. Specifically, the goal of hazard mitigation planning is to understand the probability and impact of natural and man-made hazards and to outline actions to reduce or eliminate the loss of life and property from those hazards. Some of the hazards in the hazard mitigation plan are natural hazards and most of those natural hazards are climate related. The plan lists fire, flood, and earthquake as the primary hazards based on number of events, deaths, and cost. Climate change, it says, will result in “more frequent incidence of severe events, such as extreme rainfall, wind, wildfire, extreme heat, and extended drought.”4
California’s Fourth Climate Change Assessment – San Francisco Bay Area Region Report
California’s fourth climate change assessment was produced in 2018. Given the size and physical diversity of California, the assessment was divided into region-specific reports. The San Francisco Bay Area Region report describes that temperatures in the Bay Area rose almost 2°F between 1950 and 2005 and are expected to rise significantly by mid-century. If emissions continue through the end of the century, temperature changes will be major, with an increase of 7.2°F. However, inland areas will heat up more than coastal areas, both generally and when comparing the hottest day of the year in each area.
According to the report, precipitation will continue to vary significantly year to year, based on the occurrence and path of winter jet stream flows which produce “atmospheric rivers.” Winter storms from the atmospheric rivers will continue to produce significant snowfall in the Sierra Nevada and heavy rainfall capable of causing floods. Under a high emissions scenario, the wettest day of the year in 2100 may produce 30% more rain. The Bay Area may experience precipitation “whiplash” year to year.
APPENDIX H: CLIMATE VULNERABILITY ASSESSMENT
FOR THE CITY OF LOS ALTOS, CA CONTINUED
Eveniftotalprecipitationincreases, changesinthetimingandformofprecipitation (rainorsnow) along with expected increasesintemperature are likelytocause longeranddeeperdroughts.AverageSierrasnowpackisexpectedtodecline between30%and60%bymid-centuryandover80%bytheendofthecentury under a high emissions scenario.
Future fireactivityisexpectedtoincreaseasclimate warms; however,the distributionofriskisuncertainbecauseitdependsonchangesinurban development.Wherethewildland-urbaninterfaceexpands, fireriskswillincrease. Rural and suburban areas that urbanize will see adecline in fire risk.
Santa Clara County Operational Area Hazard Mitigation Plan
TheSantaClaraCountyOperationalAreaHazardMitigationPlanisthecounty-wide hazardmitigationplanforSantaClaraCounty.Theplandescribesbrieflyhow climatewillimpactthefrequencyandseverityofclimatehazards.Specifically,it describesthatthenumberandlengthofheatwavesisexpectedtoincrease,asare thenumberofsingle-dayextremeheatdays.Accordingtothedocument, “precipitationprojectionsforCaliforniaremainuncertain,”however,thecombination oftemperatureincreasescombinedwiththetimingandformofprecipitationis expectedtochangestream flowandriver flooding.Wildfireriskasdefinedbyarea burnedinSantaClaraCountyisnotexpectedtochangesignificantlybymid-century. The average area burned is expected to decrease by10-20% by 2085.
Los Altos Hazard Mitigation Plan Annex
TheLosAltosHazardMitigationPlanAnnexisaLosAltos-specificadditiontothe SantaClaraCountyHazardMitigationPlan.TheLosAltosHazardMitigationPlan Annexnotonlyliststhehistoryofdeclareddisasters,italsoranksnaturalhazards basedontheirprobabilityandtheirimpact.AccordingtotheHazardMitigationPlan Annex,thehazardwiththehighestriskscore(probabilityximpact)isearthquake(48) followedbysevereweather(33), flood(18),drought(9),damandleveefailure(6), wildfire(3)andlandslide(3).Severeweatherincludesseverestormsfrom atmosphericriversorthunderstorms,extremeheatandfrosts/freezes,highwinds, and so-called space weather, which refers to disruptive variations in the sun’s energy.
Theriskscorerankingisusefulforunderstandinghowthehazardscomparetoone another.Whileearthquakesareanaturalhazard,itisnotconsideredinthisclimate Vulnerability Assessment. 5
5With the exception of sea level rise increasing the liquefaction risk in coastal areas outside of Los Altos, there is no relation between atmospheric phenomena and earthquake risk. More simply, whether we reverse or continue climate change will not increase or decrease the risks of earthquakes. Earthquakes are well considered in the Hazard Mitigation Plan for Santa Clara County and its Los Altos Annex.
APPENDIX H: CLIMATE VULNERABILITY ASSESSMENT
FOR THE CITY OF LOS ALTOS, CA CONTINUED
Rankings of the CAAP Task Force
The CAAP Task Force is a group of City staff and Environmental Commission members who guided the development of the CAAP. They are involved in many aspects of Los Altos operations, planning, and environmental management and so were asked what climate hazards they were most concerned about in the future. They ranked their concern (high, medium, low) for primary and secondary climate hazards. Primary climate hazards are phenomena that are climate variables. Temperature and precipitation define climate. Secondaryclimate hazards are hazards resulting from changes in primary climate hazards in relation to community sectors like the natural environment, the economy, and the public. All twelve respondents on that Task Force completed the survey ranking hazards of concern. Responses are shown below
The CAAP Task Force was most concerned about increasing temperatures and changes in precipitation patterns. Each of the hazards of high and medium concern were related to the impacts of heat, with drought receiving the highest average score and extreme heat, wildfire, and air pollution receiving the next highest scores. The hazard with the highest score, drought, is driven both by heat and by precipitation. Air pollution, wildfires, and urban heat island are hazards that are not entirely a natural phenomenon.
Table 2: Average Scores and Ranking for Primary Climate Hazards according to the CAAP Task Force
Table 3 Average Scores and Ranking for Secondary Climate Hazards according to the CAAP Task Force
APPENDIX H: CLIMATE VULNERABILITY ASSESSMENT
FOR THE CITY OF LOS ALTOS, CA CONTINUED
Cal-Adapt & Adaptation Planning in California TheOESissuedthe CaliforniaAdaptationPlanningGuide(APG) tohelp municipalitiesandallstakeholdersinvolvedinthevulnerabilityassessmentprocess withrecommendationsandtoolstodevelopascientificallygrounded,relevant,and actionable adaptation plan.
OneofthepublicresourcesprovidedbyOEStobeusedinconsultwiththe(APG)is aweb-basedclimateprojectiontoolcalledCal-Adapt. Cal-Adaptprovides historicalandprojectedclimateinformation,including“localsnapshots”of severaldifferentclimatephenomenaunderdifferentemissionsscenariosthrough 2100. TheglobalclimatemodelsselectedbyOESareparticularlywellmatchedto California’s climate.
Cal-Adaptwasusedforthisvulnerabilityassessmenttopredictwhatfuture temperatureandprecipitationLosAltoswillexperiencebasedonscenariosoffuture globalemissionsorRepresentativeConcentrationPathways,RCP4.5andRCP8.5, adoptedbytheInternationalPanelonClimateChange.Theseemissionsscenarios arebasedonmodelsofpopulationgrowth,economicgrowth,foodproduction, technologicaladvancement,politicalactivitiestocurbgreenhousegasemissions andotherfactors.RCP2.6representsa“verystringent”pathway,inwhichemissions startdecliningby2020andgotozeroby2100.ItisnotincludedinCal-Adapt.RCP 4.5representsaglobalgrowthscenarioinwhichemissionscontinueto2040and thendecline.RCP8.5representsa“businessasusual”scenarioinwhichemissions continueunabated.Becausethesescenariosandmodelsareglobal,theydonot consider how Los Altos reduces its emissions.
Cal-Adaptplugstheseglobalemissionsscenariosintoglobalclimatemodels (GCMs)toproducelocalinformationaboutareasinCalifornia,includingLosAltos. Cal-Adaptdescribestheprocessonits GuidanceonUsingClimateProjections webpage, from which the text below is reproduced.
Climatescientistscreateprojectionsoffutureclimateusingpowerful toolscalledglobalclimatemodels.Globalclimatemodelsarecomplex piecesofcomputersoftwarethatcrunchthroughthousandsof mathematicalequationsrepresentingthescientifictheoryofhowthe climatesystemworks.Theycanbeusedtosimulateclimateoverpast periods,ortorunexperimentsinwhichscientistsimposecertain conditionsonthemodeltoseehowtheclimatesystemresponds.A futureclimateprojectionistheproductofglobalclimatemodel experimentsinwhichscientistsimposeuponthemodelsomescenario ofthefutureatmosphericconcentrationofgreenhousegases[eg.RCP 4.5 and RCP 8.5].
Whenclimatescientistsrunaclimatemodel,theydividetheareaof studyintoagrid,andthemodelperformscalculationsforeach
APPENDIX H: CLIMATE VULNERABILITY ASSESSMENT
FOR THE CITY OF LOS ALTOS, CA CONTINUED
individualcellwithinthegrid.Theoutputfromthosecalculationscan thenbevisualizedonamap,similartothevisualizationsinCal-Adapt [showninFigures3-9].Inclimatemodelprojections,foranygiven snapshotintime,eachgridcellisrepresentedbyasinglevaluefor temperature, precipitation, or other climate variable of interest.
individualcellwithinthegrid.Theoutputfromthosecalculationscan thenbevisualizedonamap,similartothevisualizationsinCal-Adapt [showninFigures3-9].Inclimatemodelprojections,foranygiven snapshotintime,eachgridcellisrepresentedbyasinglevaluefor temperature, precipitation, or other climate variable of interest.
individualcellwithinthegrid.Theoutputfromthosecalculationscan thenbevisualizedonamap,similartothevisualizationsinCal-Adapt [showninFigures3-9].Inclimatemodelprojections,foranygiven snapshotintime,eachgridcellisrepresentedbyasinglevaluefor temperature, precipitation, or other climate variable of interest.
Thegridcellsinmostglobalclimatemodelsareverylarge—from100to 600kilometers[roughly100to375miles]squared.Thiscoarse resolutionisOKwhenscientistsarestudyingclimateontheglobal scale,butitisnotveryusefulwhenwearetryingtounderstandclimate changeonsmallerscales.Weknowthatpresent-dayclimatevaries greatlyfromregiontoregioninCalifornia,andsoweexpectfuture climatetovaryaccordingly.Butthatdetailislostintheglobalclimate models,inwhichallofCaliforniamayberepresentedbyjustafewgrid cells.Tobeabletoplanforthefuture,weneedtoproduce higher-resolutionprojectionsoffutureclimate.Climatescientistsdojust thatbyusingvarioustechniquesto"downscale"globalclimatemodel outputto finerspatialscales.ThedatainCal-Adaptistakenfroma selectionofglobalclimatemodelsanddownscaledtoabout 7-kilometer [roughly 4.5 mile] resolution.
Thegridcellsinmostglobalclimatemodelsareverylarge—from100to 600kilometers[roughly100to375miles]squared.Thiscoarse resolutionisOKwhenscientistsarestudyingclimateontheglobal scale,butitisnotveryusefulwhenwearetryingtounderstandclimate changeonsmallerscales.Weknowthatpresent-dayclimatevaries greatlyfromregiontoregioninCalifornia,andsoweexpectfuture climatetovaryaccordingly.Butthatdetailislostintheglobalclimate models,inwhichallofCaliforniamayberepresentedbyjustafewgrid cells.Tobeabletoplanforthefuture,weneedtoproduce higher-resolutionprojectionsoffutureclimate.Climatescientistsdojust thatbyusingvarioustechniquesto"downscale"globalclimatemodel outputto finerspatialscales.ThedatainCal-Adaptistakenfroma selectionofglobalclimatemodelsanddownscaledtoabout 7-kilometer [roughly 4.5 mile] resolution.
Thegridcellsinmostglobalclimatemodelsareverylarge—from100to 600kilometers[roughly100to375miles]squared.Thiscoarse resolutionisOKwhenscientistsarestudyingclimateontheglobal scale,butitisnotveryusefulwhenwearetryingtounderstandclimate changeonsmallerscales.Weknowthatpresent-dayclimatevaries greatlyfromregiontoregioninCalifornia,andsoweexpectfuture climatetovaryaccordingly.Butthatdetailislostintheglobalclimate models,inwhichallofCaliforniamayberepresentedbyjustafewgrid cells.Tobeabletoplanforthefuture,weneedtoproduce higher-resolutionprojectionsoffutureclimate.Climatescientistsdojust thatbyusingvarioustechniquesto"downscale"globalclimatemodel outputto finerspatialscales.ThedatainCal-Adaptistakenfroma selectionofglobalclimatemodelsanddownscaledtoabout 7-kilometer [roughly 4.5 mile] resolution.
Understanding Cal-Adapt Graphs
Understanding Cal-Adapt Graphs
Understanding Cal-Adapt Graphs
The Cal-Adapt graphs presented in this Vulne of data illustrating how variables like temper and wildfire are expected to change as clima images describes how information on the Los
The Cal-Adapt graphs presented in this Vulne of data illustrating how variables like temperat and wildfire are expected to change as clima images describes how information on the Los
The Cal-Adapt graphs presented in this Vulnerability Assessment display several types of data illustrating how variables like temperature, extreme heat, drought, precipitation, and wildfire are expected to change as climate change continues. The next series of images describes how information on the Los Altos graphs are displayed.
The line in grey represents historical observed values for each year shown on the graph. The year-to-year differences represent the natural variation in climate. Although the planet is warming over the long term,
The line in grey represents historical observed values for each year shown on the graph. The year-to-year differences represent the natural variation in climate. Although the planet is some years are still than others.
The line in grey represents historical observed values for each year shown on the graph. The year-to-year differences represent the natural variation in climate. Although the planet is warming over the long term, some years are still cooler or warmer than others.
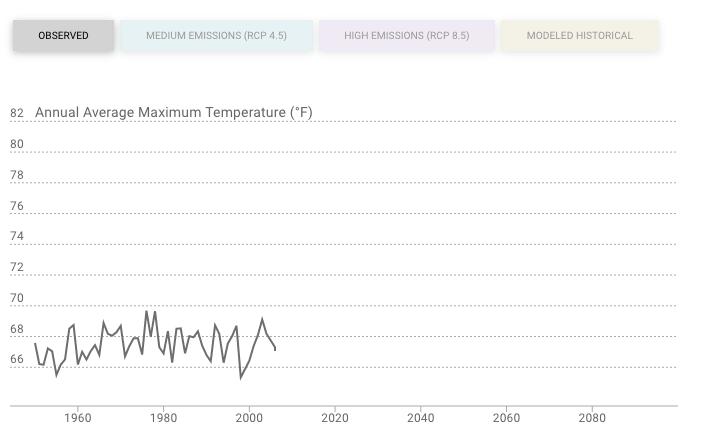
The co missions scenarios, .5 repres
The colored areas of the graph below represent projections under different emissions scenarios, RCP 4.5 representing continued global emissions until 2040 and RCP 8.5 representing continued global emissions through the end of the century
RCP 4.5 is shown in a light blue
RCP 4.5 is shown in a light blue or teal color.
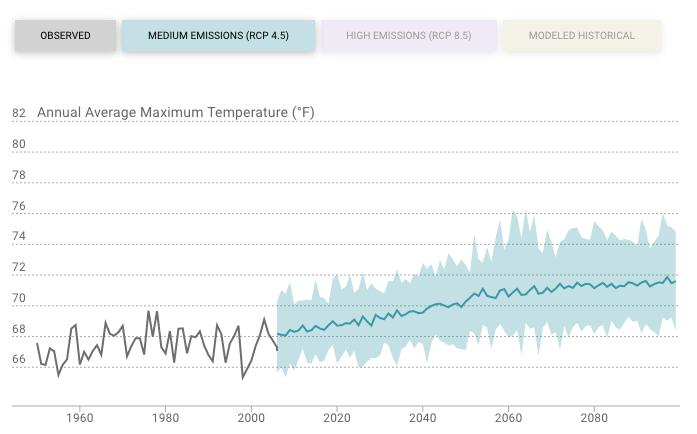
APPENDIX H: CLIMATE VULNERABILITY ASSESSMENT
FOR THE CITY OF LOS ALTOS, CA CONTINUED
The blue line represents the most likely outcome for whatever variable is being graphed. Because it is produced by averaging multiple climate models, it smooths out the year-to-year variability that each model predicts. The line does not indicate that year-to-year variability will disappear.
The shaded blue or teal area around the line represents the full range of climate projections for the variable across all the models. If one model predicts a high value and one model predicts a low value, that information is shown in the shaded area.
In sum, under a medium emissions scenario, Los Altos may experience any value within the shaded blue area and is most likely to experience the value on the blue line.
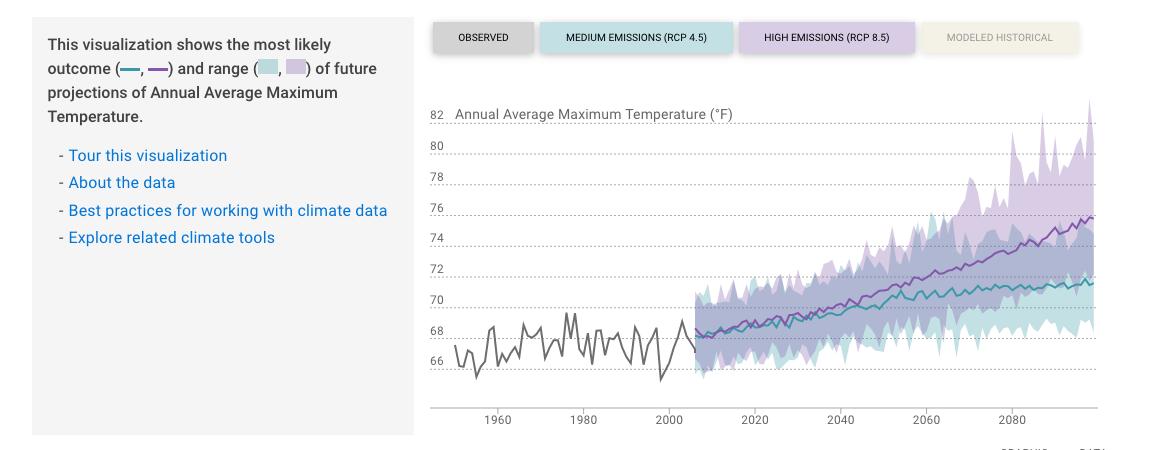
precipitation, there is not a significant visual difference between the blue and purple shaded areas, indicating that the range of values for precipitation is more or less the same in either emissions scenario.
APPENDIX H: CLIMATE VULNERABILITY ASSESSMENT
FOR THE CITY OF LOS ALTOS, CA CONTINUED
Precipitation & Flooding
Figure3showstheobservedandprojectedannualprecipitationforLosAltos.The graphindicatesthatthereisexpectedtobelittlechangeinannualaverage precipitationinamediumorhighemissionsscenarioforbothLosAltosandSanta ClaraCounty(notshown),aremarkablerealityconsideringthatmanyareasacross Californiaandthecountryareprojectedtoexperiencemuchgreaterdroughtinthe future.AsshowninTable5,averageannualprecipitationisprojectedtoincrease marginally.
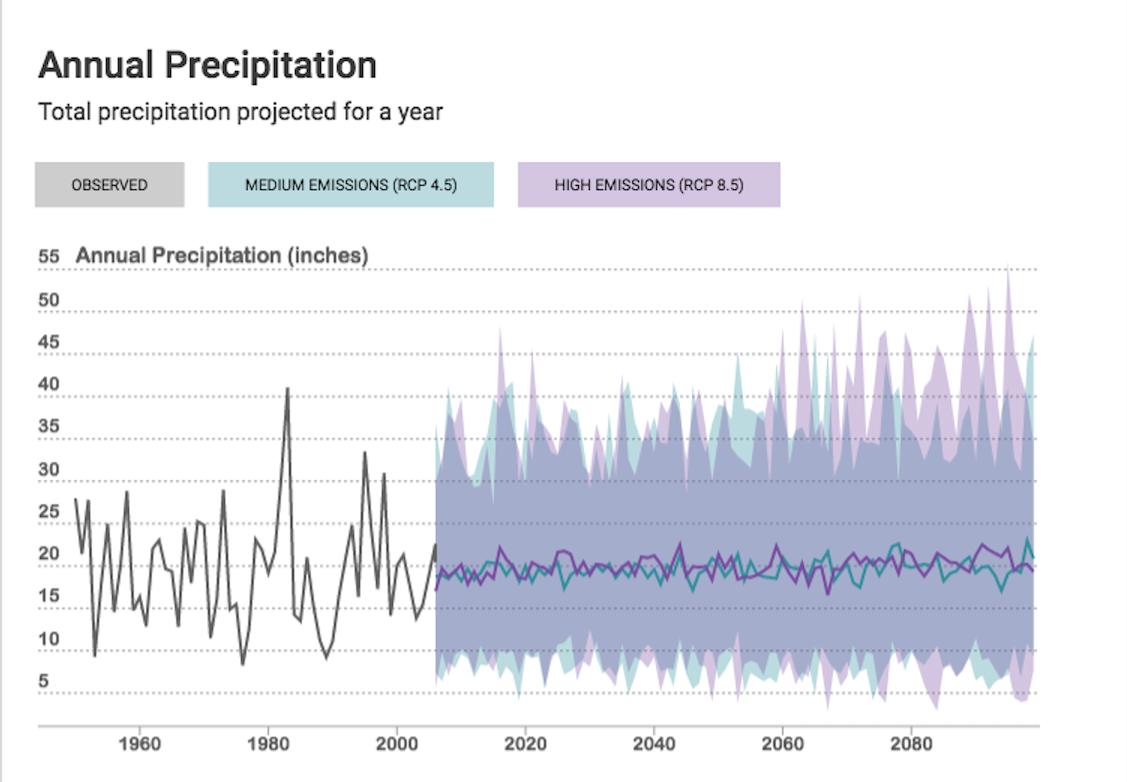
Figure 3: Annual total precipitation, observed and projected under medium and high emissions scenarios. The shaded area represents the range of likely annual precipitation totals in each scenario; the colored lines represent the most likely precipitation total in each scenario. Produced using Cal-Adapt.
APPENDIX H: CLIMATE VULNERABILITY ASSESSMENT
FOR THE CITY OF LOS ALTOS, CA CONTINUED
End-Century 2070-2099
High (RCP 8.5)
21.3 14.7 - 28.6 inches
Table 4: Annual total precipitation, observed and projected under medium and high emissions scenarios over 30-year periods according to Cal-Adapt. The numbers in the average column represent the averages of the most likely outcome over the 30-year periods. The numbers in the range of averages column represents the averages from all climate models over the 30-year periods. The range of averages is generally greater in the high emissions scenario, indicating the greater uncertainty under high emissions.
Even if annual precipitation is expected to remain consistent as an annual average, the timing of rainfall is expected to vary from the existing seasons. Winters may be wetter and spring and autumn may be drier. The variability may include more intense, infrequent rainfall causing riverine flooding, preceded and followed by longer dry spells without any precipitation. The maximum 1-day precipitation event is expected to increase marginally.
Flooding is likely to increase as a result of an increased number of days with extreme rainfall events. That increased risk may be compounded with a slight increase in the number of wildfires in areas uphill and upstream from Los Altos that reduce the ability of plants and soils to absorb rainfall. Conversely, back-to-back extreme rainfall events in late winter may fall on areas already saturated and unable to absorb rainfall. The result in either case is a change in the intensity and pattern of flooding. Determining flood risk requires hydrologic and hydraulic analyses that are outside the scope of this assessment- the last study performed for FEMA was in 1977, indicating that a new analysis should be performed.
APPENDIX H: CLIMATE VULNERABILITY ASSESSMENT FOR THE CITY
OF LOS ALTOS, CA CONTINUED
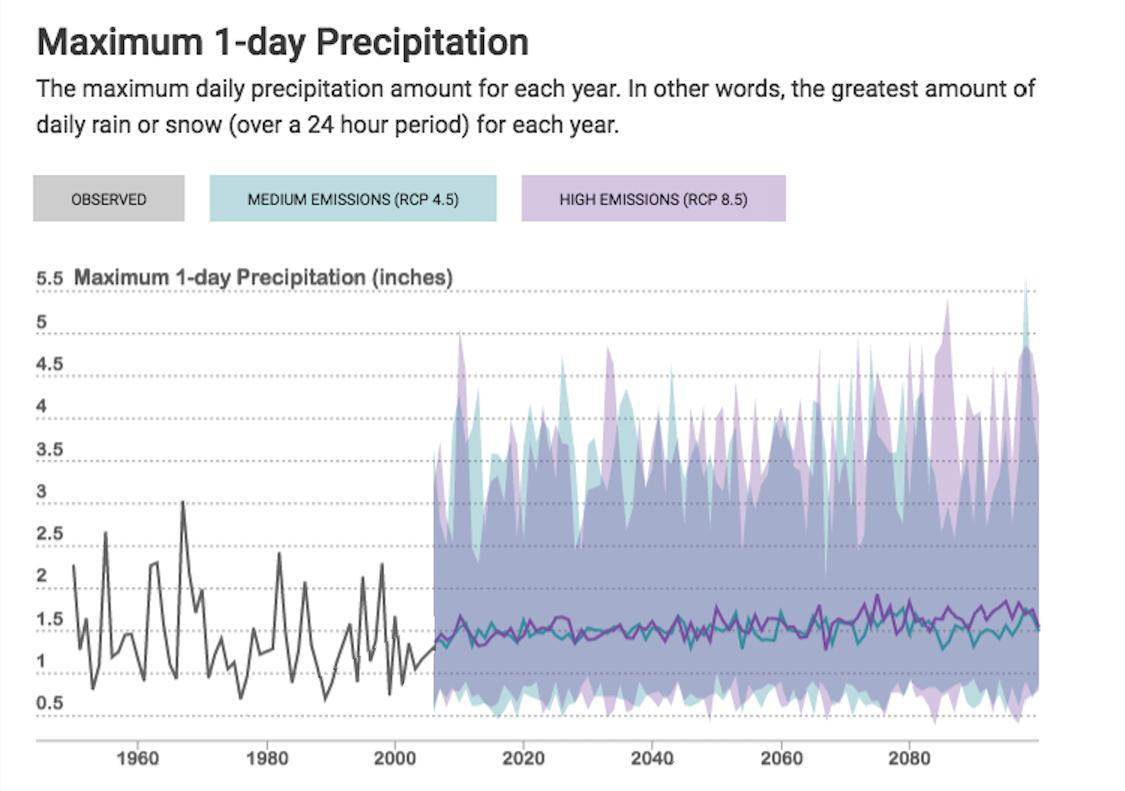
Figure 4: Maximum 1-day precipitation, observed and projected under medium and high emissions scenarios. The shaded area represents the range of likely precipitation totals in each scenario; the colored lines represent the most likely total in each scenario. Produced using Cal-Adapt.
Table 5: Maximum 1-day precipitation, observed and projected under medium and high emissions scenarios over 30-year periods according to Cal-Adapt. The numbers in the average column represent the averages of the most likely outcome over the 30-year periods. The numbers in the range of averages column represents the averages from all climate models over the 30-year periods.
APPENDIX H: CLIMATE VULNERABILITY ASSESSMENT
FOR THE CITY OF LOS ALTOS, CA CONTINUED
Figure5showsaslightlydifferentrepresentationoffutureprecipitationunderahigh emissionsscenarioand,usingfourmodelsrecommendedbyCal-Adapt,showsan increaseinthenumberofextremeprecipitationeventsannually. Through mid-century,allofthemodelspredictsomeyearswithnoextremeprecipitation eventsannually. Bytheendofthecentury,threeofthefourmodelspredictseveral extremeeventsannually–itwillbemorelikelythannottoexperienceatleastone extremeeventannually.Sincetheannualprecipitationisnotexpectedtoincrease,it canbeassumedthattherewillbeadecreaseintheamountofprecipitation occurring during non-extreme precipitation events.
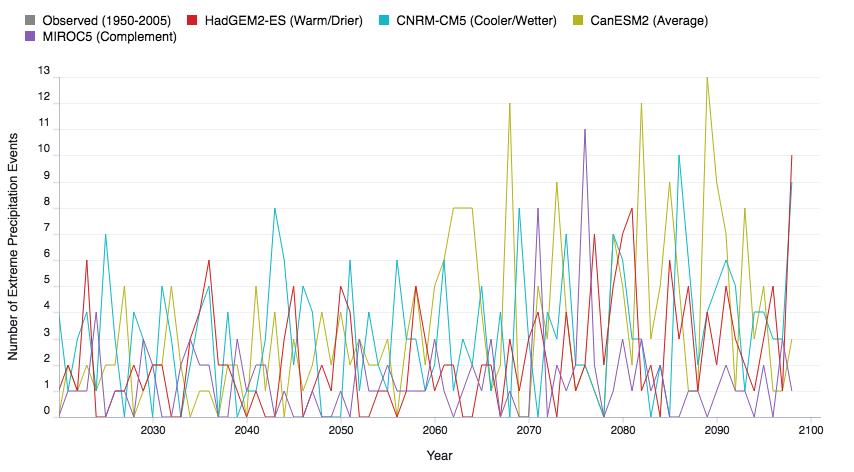
Figure 5: Number of extreme precipitation events projected under high emissions scenarios according to 5 different global climate models (GCMs) recommended by Cal-Adapt.
Temperature, Extreme Heat & Drought
As shown in Figure 6, the annual average maximum temperature is expected to increase over the rest of the 21st century Under the high emissions scenario (RCP 8.5), temperature is projected to increase nearly 8 degrees F, nearly twice as much as under a medium emissions scenario (RCP 4.5). Table 6 indicates the certainty of temperature increases. Even the low end of the range of averages is higher than the observed average, 1961-1990.
APPENDIX H: CLIMATE VULNERABILITY ASSESSMENT FOR THE CITY OF LOS ALTOS, CA CONTINUED
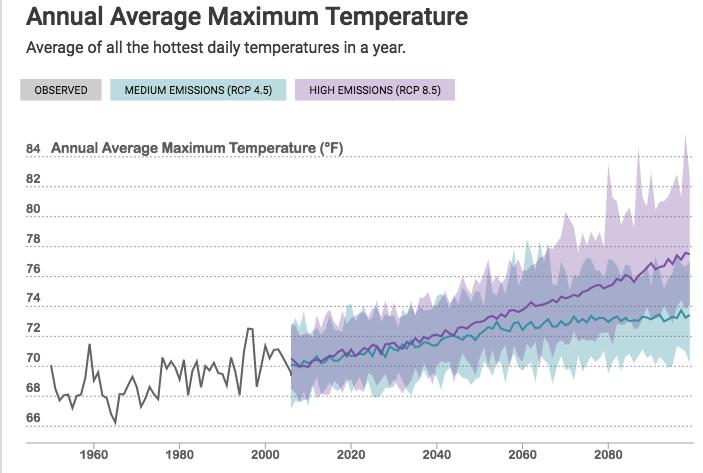
Figure 6: Annual average maximum temperatures, observed and projected under medium and high emissions scenarios. The shaded area represents the range of likely temperatures in each scenario; the colored lines represent the most likely temperature in each scenario. Produced using Cal-Adapt.
Table 6: Annual Average Maximum Temperature, observed and projected under medium and high emissions scenarios over 30-year periods according to Cal-Adapt. The numbers in the average column represent the averages of the most likely outcome over the 30-year periods. The numbers in the range of averages column represents the averages from all climate models over the 30-year periods.
APPENDIX H: CLIMATE VULNERABILITY ASSESSMENT
FOR THE CITY OF LOS ALTOS, CA CONTINUED
Drought
Asaproductofincreasingtemperaturesandincreasingprecipitationvariability, includinglessspringandautumnprecipitation,droughtmayincrease.Themaximum length of dry spell is expected to increase by 10-15% as shown in the table below.
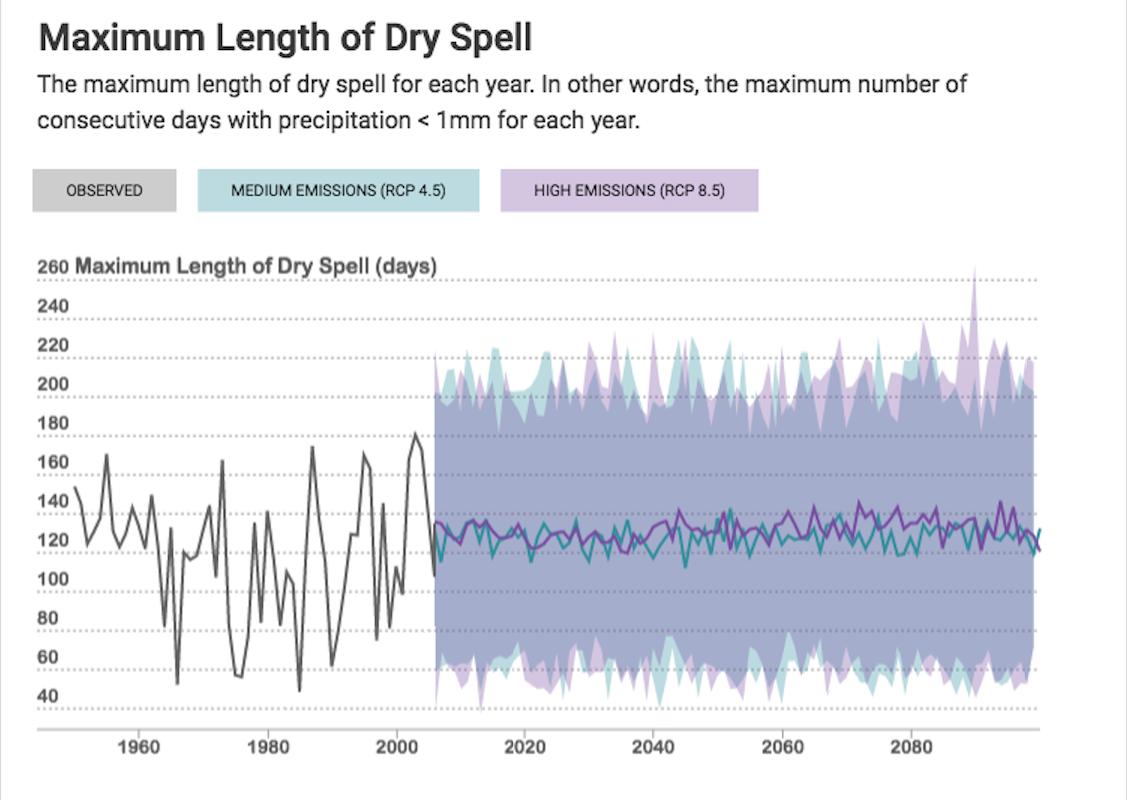
Figure 7: Maximum length of dry spell, observed and projected under medium and high emissions scenarios. The shaded area represents the range of likely number of days of dry spell totals in each scenario; the colored lines represent the most likely maximum length in each scenario. Produced using Cal-Adapt.
APPENDIX H: CLIMATE VULNERABILITY ASSESSMENT
FOR THE CITY OF LOS ALTOS, CA CONTINUED
Table 7: Maximum length of dry spell, observed and projected under medium and high emissions scenarios over 30-year periods according to Cal-Adapt. The numbers in the average column represent the averages of the most likely outcome over the 30-year periods. The numbers in the range of averages column represents the averages from all climate models over the 30-year periods. Under a high emissions scenario, the range of averages at the end of century (112-172 days) is significantly wider than the range of averages mid-century (125-151 days), indicating the uncertainty of the impact of high emissions longer term.
Average temperatures and days with extreme heat are expected to increase, increasing evaporation and evapotranspiration (release of water vapor by plants) in turn. Residential water use for landscaping may increase in response. Defining drought as simply the length of a dry spell obscures the complexity of Los Altos’ water supply and use. Future droughts will be defined not just by precipitation and temperature, but by water supply storage levels across the water system and water use by end users. In other words, drought is not an entirely natural phenomenon.
Extreme Heat/Heat Waves
Heat waves are expected to increase in severity, frequency, and duration.
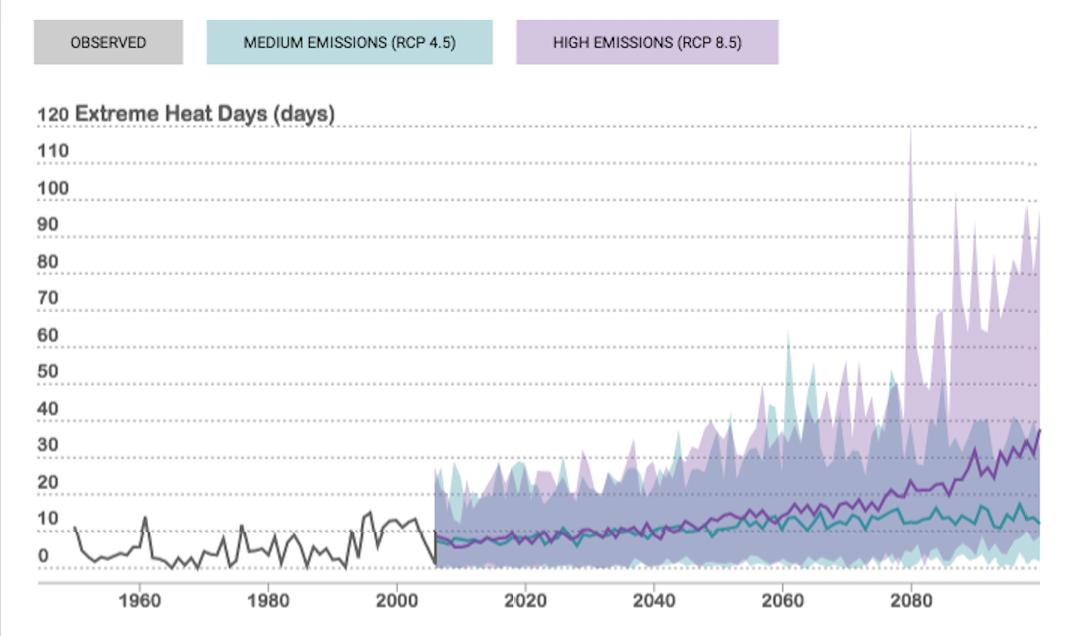
Figure 8: Number of extreme heat days, observed and projected under medium and high emissions scenarios. The shaded area represents the range of likely number of extreme heat days in each scenario; the colored lines represent the most likely number of extreme heat days in each scenario. Produced using Cal-Adapt.
APPENDIX H: CLIMATE VULNERABILITY ASSESSMENT FOR THE
CITY OF LOS ALTOS, CA CONTINUED
Baseline 1961-1990
Mid-Century 2035-2064
End-Century 2070-2099
Mid-Century 2035-2064
End-Century 2070-2099
(RCP 4.5)
(RCP 4.5)
7-17 days
9-23 days
Table 8: Number of extreme heat days, observed and projected under medium and high emissions scenarios over 30-year periods according to Cal-Adapt. The numbers in the average column represent the averages of the most likely outcome over the 30-year periods. The numbers in the range of averages column represents the averages from all climate models over the 30-year periods.
As shown in Figure 8, the number of extreme heat days (defined as days with high temperatures above 90.2F for Los Altos) is expected to increase above 10 by mid-century By the end of the century, Cal Adapt projects more than three times as many days of extreme heat under the medium emissions scenario and as many as 40 days of extreme heat under the high emissions scenario.
Wildfires & Air Pollution
Remarkably, given the expected increases in average and extreme temperatures, the area of Los Altos burned by wildfires is projected to decrease,� according to Cal Adapt, under both medium and high emissions scenarios.
APPENDIX H: CLIMATE VULNERABILITY ASSESSMENT
FOR THE CITY OF LOS ALTOS, CA CONTINUED
End-Century 2070-2099
End-Century
(RCP 8.5)
14.9 - 22.7 acres
Table 9: Number of average acres burned, modeled and projected under medium and high emissions scenarios over 30-year periods. The average number of acres burned is expected to decrease under both medium emissions and high emissions scenarios.
Table 9: Number of average acres burned, modeled and projected under medium and high emissions scenarios over 30-year periods. The average number of acres burned is expected to decrease under both medium emissions and high emissions scenarios.
Additional Sources for Wildfire
Additional Sources for Wildfire
Since the Cal-Adapt projections and the Local Hazard Mitigation Plan Annex indicated that wildfire was low risk and yet wildfire was a relatively high concern of the CAAP Task Force, additional research was conducted on the future risk of wildfires. Sources identified were the Santa Clara County Climate Adaptation Guidebook, Caltrans Vulnerability Assessment for District 4 (San Francisco Bay Area), and CAL FIRE.
Since the Cal-Adapt projections and the Local Hazard Mitigation Plan Annex indicated that wildfire was low risk and yet wildfire was a relatively high concern of the CAAP Task Force, additional research was conducted on the future risk of wildfires. Sources identified were the Santa Clara County Climate Adaptation Guidebook, Caltrans Vulnerability Assessment for District 4 (San Francisco Bay Area), and CAL FIRE.
According to the Santa Clara County Climate Adaptation Guidebook, climate change is projected to increase the frequency of wildfires, the extent of burned areas, and the duration of wildfire seasons. “Wildfire seasons are projected to begin earlier in the spring due to drier and warmer spring conditions on average. ” However, this increase in wildfire seems to be minor in the areas surrounding Los Altos and other already urbanized areas, as shown in the CALFIRE maps of Santa Clara County.
According to the Santa Clara County Climate Adaptation Guidebook, climate change is projected to increase the frequency of wildfires, the extent of burned areas, and the duration of wildfire seasons. “Wildfire seasons are projected to begin earlier in the spring due to drier and warmer spring conditions on average. ” However, this increase in wildfire seems to be minor in the areas surrounding Los Altos and other already urbanized areas, as shown in the CALFIRE maps of Santa Clara County.
APPENDIX H: CLIMATE VULNERABILITY ASSESSMENT
FOR THE CITY OF LOS ALTOS, CA CONTINUED
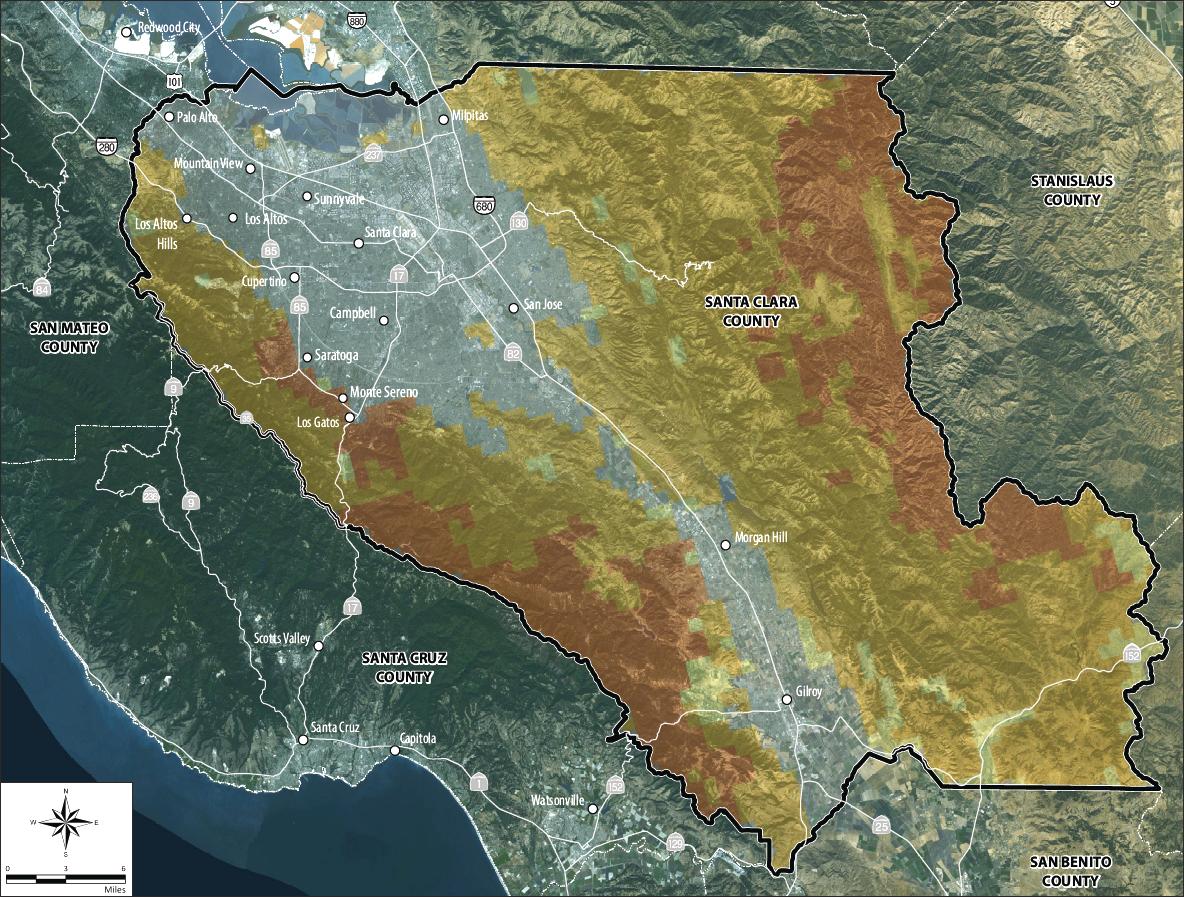
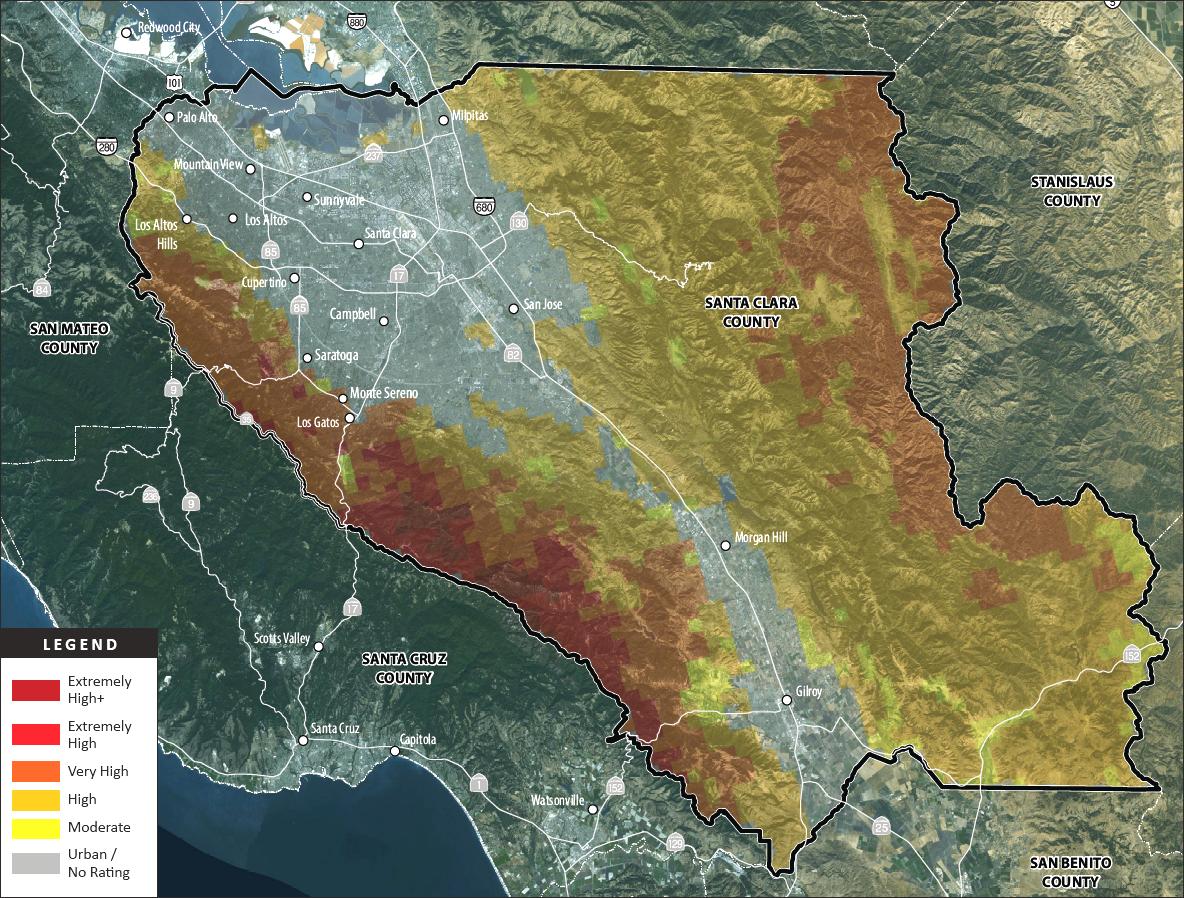
Figure 9: Maps of Santa Clara County indicating current (above) and future (below) wildfire risk level, according to CAL FIRE.
APPENDIX H: CLIMATE VULNERABILITY ASSESSMENT
FOR THE CITY OF LOS ALTOS, CA CONTINUED
InFigure10,somemountainousareaswestofLosAltosmovefrom“moderate”to “high”riskandalargeareasouthwestofLosAltosmovesfrom“high”to“veryhigh” risk.
InFigure10,somemountainousareaswestofLosAltosmovefrom“moderate”to “high”riskandalargeareasouthwestofLosAltosmovesfrom“high”to“veryhigh” risk.
ThesectionofCaltrans’ VulnerabilityAssessment
concentrations. Similarly, dry, warm weather can result in greater amounts of dust being blown and suspended in air. 6
concentrations. Similarly, being blown and suspended
focusingonwildfirerisk showsthelikelihoodof wildfirein2085increasingin someareasofSantaClara County,butnot LosAltosortheentireSan Francisco Peninsula.
Insummary,evenifLosAltosisn’tasvulnerabletodirectimpactsfromwildfires,it should be prepared for the indirect impact of air pollution.
Impacts on Los Altos’ Assets/Community Sectors
ThesectionofCaltrans’ VulnerabilityAssessment focusingonwildfirerisk showsthelikelihoodof wildfirein2085increasingin someareasofSantaClara County,butnot LosAltosortheentireSan Francisco Peninsula.
Natural Environment
landscapes (yards, parks, street trees)
Figure 10: Caltrans’ Vulnerability Assessment focusing on wildfire risk showing the likelihood of wildfire in 2085.
Local Assets
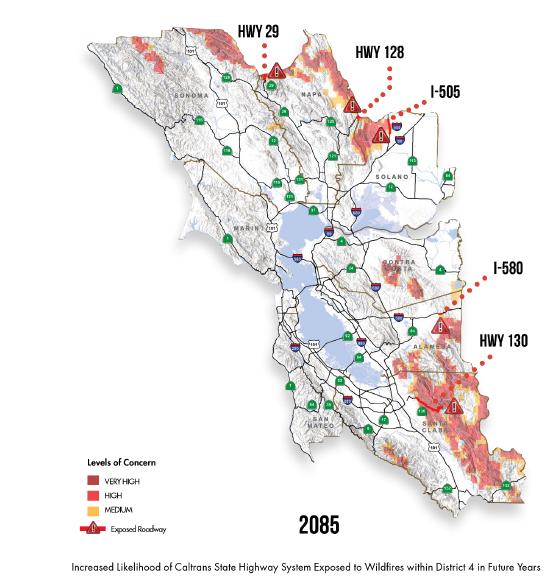
Insummary,evenifLosAltosisn’tasvulnerabletodirectimpactsfromwild should be prepared for the
Impacts on Los Altos’
Informationabouttheimpactsofclimatehazardswassupplementedbyasurveyof theCAAPTaskForceandafocusgroupwithCitysta Specifically,theCAAPTaskForcewasaskedtorankwhatnaturalandbuiltassets andfacilitiesandwhatsectorsoftheeconomyweremostimportanttoLosAltos’ quality of life. Results receiving
Informationabouttheimpactsofclimatehazardswassupplementedbyasurveyof theCAAPTaskForceandafocusgroupwithCitystaff andnon-profitleaders. Specifically,theCAAPTaskForcewasaskedtorankwhatnaturalandbuiltassets andfacilitiesandwhatsectorsoftheeconomyweremostimportanttoLosAltos’ quality of life. Results receiving 40% or more are shown below.
Figure 10: Caltrans’ Vulnerability Assessment focusing on wildfire risk showing the likelihood of wildfire in 2085.
Air Pollution/Air Quality
Air Pollution/Air Quality
Managed landscapes (yards, trees)
Air & air quality
Natural habitat (soil, plants, Creeks, rivers and other water
Local Assets
Aformerorchard,LosAltoshasanincrediblecanopyofnativeandnon-nativetrees onstreets,inparks,andinhomeowner’syards.Thosetrees,alongwithacreekand theSantaCruzmountains,gracethesealoftheCity.AccordingtotheCity’swebsite, thereareapproximately12,000treesonLosAltosstreetscreatingastunningtree canopy,whichhelpstopromotebetterairquality,coolersummers,naturalshade and less reliance on air conditioning.” 7
The minor increase in risk of wildfire in areas surrounding Los Altos may relatively worsen air quality in Los Altos, however, climate projections focus on the relative risk of areas to wildfire, not to air quality impacts based on prevailing wind patterns. Air quality was not a climate variable for which Cal-Adapt produced projections. The California State Hazard Mitigation Plan describes how air pollution could deteriorate in the future
Aformerorchard,LosAltoshasanincrediblecanopyofnativeandnon-nativetrees onstreets,inparks,andinhomeowner’syards.Thosetrees,alongwithacreekand theSantaCruzmountains,gracethesealoftheCity.AccordingtotheCity’swebsite, thereareapproximately12,000treesonLosAltosstreetscreatingastunningtree canopy,whichhelpstopromotebetterairquality,coolersummers,naturalshade and less reliance on air conditioning.”
The minor increase in risk of wildfire in areas surrounding Los Altos may relatively worsen air quality in Los Altos, however, climate projections focus on the relative risk of areas to wildfire, not to air quality impacts based on prevailing wind patterns. Air quality was not a climate variable for which Cal-Adapt produced projections. The California State Hazard Mitigation Plan describes how air pollution could deteriorate in the future
Inadditiontotrees,yardsandparksarewellregardedbyresidents.ShoupParkand theRedwoodGroveNaturePreservewerementionedmultipletimesby respondentsasassetsthatprovidearealsenseofnature.TheHillsideTrail connecting both parks features a boardwalk along Adobe Creek.
Climate change has the potential to worsen PM concentrations in California due to increased incidence of wildfire as well as the increased temperature and reduced precipitation in many locations. Smoke and ash produced by fire increase PM concentrations. Similarly, dry, warm weather can result in greater amounts of dust being blown and suspended in air. 6
Inadditiontotrees,yardsandparksarewellregardedbyresidents.ShoupParkand theRedwoodGroveNaturePreservewerementionedmultipletimesby respondentsasassetsthatprovidearealsenseofnature.TheHillsideTrail connecting both parks features
Climate change has the potential to worsen PM concentrations in California due to increased incidence of wildfire as well as the increased temperature and reduced precipitation in many locations. Smoke and ash produced by fire increase PM
6 California State Hazard Mitigation Plan, California Office of Emergency Services, 2018, SECTION 9.1 - PAGE 583
Insummary,evenifLosAltosisn’tasvulnerabletodirectimpactsfromwildfires,it should be prepared for the indirect impact of air pollution.
6 California State Hazard Mitigation 583
7 https://www.losaltosca.gov/publicworks/page/tree-maintenance
7 https://www.losaltosca.gov/publicworks/page/tree-maintenance,accessed May 6, 2021
Impacts
APPENDIX H: CLIMATE VULNERABILITY ASSESSMENT
concentrations. Similarly, dry, warm weather can result in greater amounts of dust being blown and suspended in air. 6
FOR THE CITY OF LOS ALTOS, CA CONTINUED concentrations. Similarly, dry, warm weather can result in greater amounts of dust being blown and suspended in air. 6
Insummary,evenifLosAltosisn’tasvulnerabletodirectimpactsfromwildfires,it should be prepared for the indirect impact of air pollution.
Insummary,evenifLosAltosisn’tasvulnerabletodirectimpactsfromwildfires,it should be prepared for the indirect impact of air pollution.
Impacts on Los Altos’ Assets/Community Sectors
Impacts on Los Altos’ Assets/Community Sectors
Informationabouttheimpactsofclimatehazardswassupplementedbyasurveyof theCAAPTaskForceandafocusgroupwithCitystaff andnon-profitleaders. Specifically,theCAAPTaskForcewasaskedtorankwhatnaturalandbuiltassets andfacilitiesandwhatsectorsoftheeconomyweremostimportanttoLosAltos’ quality of life. Results receiving 40% or more are shown below.
Informationabouttheimpactsofclimatehazardswassupplementedbyasurveyof theCAAPTaskForceandafocusgroupwithCitystaff andnon-profitleaders. Specifically,theCAAPTaskForcewasaskedtorankwhatnaturalandbuiltassets andfacilitiesandwhatsectorsoftheeconomyweremostimportanttoLosAltos’ quality of life. Results receiving 40% or more are shown below. Natural Environment
Natural Environment
parks, street trees)
Local Assets
Local Assets
Aformerorchard,LosAltoshasanincrediblecanopyofnativeandnon-nativetrees onstreets,inparks,andinhomeowner’syards.Thosetrees,alongwithacreekand theSantaCruzmountains,gracethesealoftheCity.AccordingtotheCity’swebsite, thereareapproximately12,000treesonLosAltosstreetscreatingastunningtree canopy,whichhelpstopromotebetterairquality,coolersummers,naturalshade and less reliance on air conditioning.” 7
Aformerorchard,LosAltoshasanincrediblecanopyofnativeandnon-nativetrees onstreets,inparks,andinhomeowner’syards.Thosetrees,alongwithacreekand theSantaCruzmountains,gracethesealoftheCity.AccordingtotheCity’swebsite, thereareapproximately12,000treesonLosAltosstreetscreatingastunningtree canopy,whichhelpstopromotebetterairquality,coolersummers,naturalshade and less reliance on air conditioning.” 7
Inadditiontotrees,yardsandparksarewellregardedbyresidents.ShoupParkand theRedwoodGroveNaturePreservewerementionedmultipletimesby respondentsasassetsthatprovidearealsenseofnature.TheHillsideTrail connecting both parks features a boardwalk along Adobe Creek.
Inadditiontotrees,yardsandparksarewellregardedbyresidents.ShoupParkand theRedwoodGroveNaturePreservewerementionedmultipletimesby respondentsasassetsthatprovidearealsenseofnature.TheHillsideTrail connecting both parks features a boardwalk along Adobe Creek.
6 California State Hazard Mitigation Plan, California Office of Emergency Services, 2018, SECTION 9.1 - PAGE 583
https://www.losaltosca.gov/publicworks/page/tree-maintenance,accessed May 6, 2021
6 California State Hazard Mitigation Plan, California Office of Emergency Services, 2018, SECTION 9.1 - PAGE 583
7 https://www.losaltosca.gov/publicworks/page/tree-maintenance,accessed May 6, 2021
APPENDIX H: CLIMATE VULNERABILITY ASSESSMENT
FOR THE CITY OF LOS ALTOS, CA CONTINUED
Adobe Creek along with Stevens Creek, Permanente Creek and Hale Creek are significant natural features that provide habitat corridors that connect beyond Los Altos’ boundaries and contribute to groundwater recharge. Their importance is demonstrated by a pending (2021) lawsuit regarding pollution from a permit for Lehigh Quarry expansion upstream
In such a verdant city, it is not surprising that many respondents in the CAAP Task Force mentioned air quality as an important asset Outdoor recreation and outdoor living are prized and are dependent on comfortable temperatures and clean air
Description of Impacts & Sensitivities
Temperature, Extreme Heat & Drought
The biggest impact of extreme temperatures and extended heat waves on the natural environment will be heat stress on plants with the potential for slow native species die-out and replacement by non-native species These tipping points will depend on many factors including species and age.
Managed landscapes will require greater care and watering California Water Service predicts roughly 3.5% increase in mean temperature by 2040 and will correspond to a roughly 2% increase in demand 8 Home gardeners and city staff may find formerly tried and true ornamental plants less reliable – or untenable due to new ordinances or demand management measures. Having dealt with drought, Parks & Facilities staff has a reasonable capacity to manage the landscape for temperature increases and increased drought The capacity of native, non-native, and ornamental plants to survive in a hotter, drier climate is not known
Precipitation & Flooding
Severe precipitation and repeated flooding may increase stream bank erosion and flooding and erosion of managed landscapes. As the probability of multiple severe winter storms increases toward the end of the century, downed trees may be more common as trees rooted in soils saturated from previous storm events contend with heavy winds.
Wildfires & Air Pollution
Acres burned in Los Altos is expected to decrease. Increases in acres burned in the Santa Cruz mountain areas surrounding Los Altos are expected to be minor Thankfully, Redwood Grove is being managed by Parks & Facilities staff for wildfire, as redwoods are not native to Los Altos and so require extra care. The greatest wildfire risk to Los Altos is expected to be from wildfires in and even beyond the Santa Cruz mountains creating unhealthy levels of air pollution in Los Altos
Environment 8
APPENDIX H: CLIMATE VULNERABILITY ASSESSMENT
FOR THE CITY OF LOS ALTOS, CA CONTINUED Assets
(roads, sidewalks, buses, trains, parking spots & bike racks)
Utilities (power, drinking water, stormwater & sewer, natural gas, phone, internet)
Description of Local Assets
Buildings
The built environment includes all the public and private buildings, structures, and infrastructure that people in Los Altos rely on for shelter, commerce, and the functions of daily life. (Commercial assets are described in the Economy section.)
Los Altos is primarily a bedroom community where most residents live in single-family homes, although there is multi-family housing as well. Many elderly residents live in retirement communities and senior centers. Housing was the asset most chosen by CAAP Task force members as most important
Los Altos has more than a dozen school facilities across multiple campuses, as well as more than thirty child care/day care facilities, preschools, and tutoring centers that provide care and education to the youth of the City
Focus group participants shared that theatres, galleries, and other cultural assets contribute to quality of life and should also be included as built environment assets.
In addition to the assets listed above, Los Altos has buildings for daily and emergency government services. Critical facilities include an Emergency Operations Center (EOC) co-located in the Municipal Service Center, the City Hall and Police Department, and Fire Stations There are no hospitals located in Los Altos
Infrastructure
Transportation assets include, most importantly, roads and bridges that connect drivers, bikers, and pedestrians to different neighborhoods, shopping centers, the freeway, and areas outside the City Public parking supports commercial areas
Water supply is a complex multi-jurisdictional hybrid natural and built system, including groundwater supply, surface water, and recycled water sources While the sources are natural, the management includes sophisticated, interconnected built assets. CalWater (California Water Services) Los Altos Suburban District water supply comes from both wells and purchases from Santa Clara Valley Water District
APPENDIX H: CLIMATE VULNERABILITY ASSESSMENT
FOR THE CITY OF LOS ALTOS, CA CONTINUED
(SCVWD)whichpartiallyimportswaterfromtheFederalCentralValleyProjectand SanFranciscoPowerandUtilityCorporation’sRegionalWaterSystem.TheLosAltos SuburbanDistrictincludesLosAltos,Cupertino,andotherareas.Thereareahandful of water pumping stations in Los Altos.
LosAltoshasaminoritystakeinthePaloAltoRegionalWaterQualityControlPlant (WQCP)alongwithPaloAlto,MountainView,EastPaloAlto,StanfordUniversity,and LosAltosHills.TheCityalsoownsawastewaterpumpstationtoconveywasteto the WQCP.
StormwatermanagementisprovidednaturallybyLosAltos’fourcreeksaswellas bythePermanenteCreekDiversionChannelandthestormsewersystem–storm drains, catch basins and pipes below the street.
Description of Impacts & Sensitivities
Temperature, Extreme Heat & Drought Increasesintemperatureandextendedheatwaveswillchangethecoolingneedsof allbuildingtypesandmaytaxtheenergygrid.PacificGas&Electric’sPublicSafety PowerShutoffs(PSPS)toreducewildfirerisksduringheatwaveswillrequire alternativeandoff-gridenergysourcestocoolhomes,commercial,andgovernment buildings.Therecentlyconstructed/renovatedLosAltosHighSchoolandtheLos AltosCommunityCenterarehigh-performancebuildingsthatmaybebetterableto maintain comfortable temperatures during extreme heat.
Ingeneral,homeownersinLosAltoshavethe financialresourcestoadoptnew technologiestomanageheatandproduceandstorerenewableenergy.Fixed income homeowners and renters have less of an adaptive capacity.
Assistedcarefacilitieshavebackupgenerators.Seniorcentersdonot,accordingto discussionswiththeCity’semergencymanagementcoordinator.TheCityrelieson Santa Clara County to provide cooling centers, in the form of public libraries.
Mosttransportationinfrastructurewillbeunaffectedbyextremeheatanddrought. Riskofasphaltsofteningislimitedtoextendedtemperaturesabove100°F.Safety powershutoffsandbrownoutscausedbyheatcancauseoutagesoftrafficsignals andstreetlights.Extremeheatwillincreaseuseofprivatevehiclesattheexpenseof walking, biking, and taking public transit.
Temperaturechangesandextremeheatthroughouttheregionwillimpactthe availabilityofthewatersupplyinSCVWD’ssystem,whichsuppliesasmuchas65% ofthewaterintheLosAltosSuburbanDistrict.9 LosAltoswaterissourcedlocally andimported,althoughnotfromsnow-fedHetchHetchy.10 IftheLosAltos
9 2015 Urban Water Management Plan Los Altos Suburban District, p. 47
10 Santa Clara County Operational Area Hazard Mitigation Plan, Office of Emergency Services, 2017, p. 113.
APPENDIX H: CLIMATE VULNERABILITY ASSESSMENT
FOR THE CITY OF LOS ALTOS, CA CONTINUED
Suburban District is partially protected from the risk of decreased snowpack in the Sierra Nevada mountains, nevertheless supply is projected to decrease by 3-18% by mid-century and 10-28% by 2100 11The projected decrease underscores how many of the critical systems and natural resources of Los Altos extend beyond its borders where climate change may produce more extreme impacts.
Water supply issues are heavily regulated and very much in the public eye, in contrast to the climate risk of extreme heat. To a degree, water suppliers are already preparing for climate change CalWater is developing new water supplies to improve reliability The impacts from climate change to Los Altos water availability may come indirectly through external adaptive measures like increased regulations, including updates to the State’s Model Water Efficient Landscape Ordinance, prohibitions, and demand management measures, rather than severe restrictions
Safety power shut offs and brownouts caused by heat can disrupt pumps in the water supply and wastewater systems.
Precipitation & Flooding12
Severe precipitation and repeated flooding may increase stream bank erosion and flooding, causing scour under the numerous bridges and creek crossings Buried pipes may be exposed and/or damaged Storm sewers may get backed up and cause localized flooding. With multiple heavy storms occurring yearly by the end of the century, wear and tear on roads and within pipes may require repair and replacement more frequently than planned for
Los Altos has experienced limited flooding of homes or structures, although there are many buildings that have a 0 2 percent annual chance of flooding, according to FEMA flood maps Hydrologic and hydraulic modeling outside of this report scope would be needed to understand how the risk of flooding in specific areas may increase in the future.
Los Altos already has a Green Stormwater Infrastructure Plan which includes an assessment of flood-prone storm drain catchments among its prioritization criteria. With some changes, this document and the capital planning that results from it can integrate climate risks to adapt to the risks from precipitation changes
Wildfires & Air Pollution
Wildfires pose a greater hazard to structures, including homes and above ground assets, than to underground assets Air pollution from wildfires outside of Los Altos
11 2015 Urban Water Management Plan Los Altos Suburban District, p. 70. Projections estimated based on climate change impacts on the mix of groundwater, local surface water, and purchased imports relative to the historic average of available supply.
12 Although Los Altos is not coastal and so not directly at risk from sea level rise, sea level rise will have an impact on groundwater supply and the Palo Alto Regional Water Quality Control Plan
APPENDIX H: CLIMATE VULNERABILITY ASSESSMENT
FOR THE CITY OF LOS ALTOS, CA CONTINUED
does not have a significant impact on buildings and infrastructure, simply requiring changing filters on buildings and vehicle fleets more frequently.
Economy
The impact of climate hazards on the economy are hard to predict. Climate extremes will generally cause more wear and tear of physical assets, leading to shorter lifespans and faster replacement cycles for buildings and infrastructure Increased spending on maintenance will be needed. Disasters cause a drop and then rise in expenditures, following Federal assistance and insurance payouts, though in sum disasters produce both environmental and economic losses
Description of Local Assets
Los Altos has several areas of economic activity, as listed in the economic element of the General Plan Listed roughly from north to south, these are Sherwood Gateway (including the Village Court Shopping Center), El Camino Real, Downtown, Rancho Shopping Center, Loyola Corners, Woodland Plaza, and Foothill Plaza
When asked what sectors of the economy were most important to quality of life, most survey participants responded that School District/City Spending (60%) and Restaurants (60%) were most important Half of survey participants responded that real estate, development, and construction as a single sector were important Fewer than half of respondents selected retail, the service sector, or tech/IT.
Property taxes on Los Altos housing provides the key revenue source for City finances. At the same time, the affordable housing shortage throughout the Bay Area extends to Los Altos, affecting the disposable income available for other purchases.
Description of Impacts & Sensitivities
Temperature, Extreme Heat & Drought
Temperature, extreme heat, and drought are most likely to cause a negative effect on the economy as residents and businesses spend more on air conditioning (and California-wide on food) to maintain the same quality of life Outdoor living is important to quality of life and outdoor comfort is an important free asset for downtown restaurants and retail businesses.
Decreasing comfort negatively impacts worker productivity and may disrupt outdoor businesses like landscaping and construction Temperature-related mortality is also a projected loss. Power outages and brownouts caused by extreme heat will also negatively impact the economy through everything from loss of perishable items to adding uncertainty to business operations Expensive solutions for managing electricity unreliability like diesel generators add environmental externalities. At the same time, the COVID-19 pandemic has been longer lasting and more far reaching than most of the direct climate hazards of the near future
APPENDIX H: CLIMATE VULNERABILITY ASSESSMENT
FOR THE CITY OF LOS ALTOS, CA CONTINUED
Precipitation & Flooding
Property damage and temporary disruption of utilities and infrastructure can create temporary or extended loss of operations for businesses, particularly for businesses with non-durable goods Even perceptions of flood risk and flood safety can influence the housing market
Wildfires & Air Pollution
Temporary disruption of utilities and infrastructure from wildfire-related PSPS can create temporary or extended loss of operations When poor air quality keeps people in their home, they are less likely to spend in Los Altos’ commercial centers.
Vulnerable Populations
Description of Impacts & Sensitivities
Temperature, Extreme Heat & Drought
Projected temperature changes will impact the seasonality and frequency of outdoor recreation, biking and walking, and even passive enjoyment of the outdoors. Outdoor comfort will increase in winter, spring, and fall and decrease in summer. Parks, yards, and other outdoor areas will become undesirable during heat waves, and parking lots and streets may become dangerous to certain populations during extreme heat.
From medical and sociological research, we know that certain populations are more vulnerable to extreme heat However, not all of these populations exist in Los Altos Based on CAAP Task Force survey respondents, the vulnerable populations present in Los Altos include the elderly, people with chronic or pre-existing medical conditions, people with disabilities, children, and people with limited English proficiency If projected temperature changes are experienced, incidences of heat stroke, hospitalization, and heat-related mortality will increase first and foremost within these groups.
While only 40% of Task Force survey respondents selected “people who work outside” as a vulnerable group, a subsequent focus group confirmed that day laborers in landscaping and construction are a vulnerable population who may commute into Los Altos to work outdoors. Los Altos does not have experience providing services or communications to this population, so managing their health risk will be a challenge
The focus group additionally identified seniors who are “house rich, cash poor, ” and may potentially be impacted by increased costs of energy as temperatures increase. Assisted care facilities have backup generators, but senior centers do not Santa Clara County libraries act as the city’s cooling centers
APPENDIX H: CLIMATE VULNERABILITY ASSESSMENT FOR THE CITY OF LOS ALTOS, CA CONTINUED
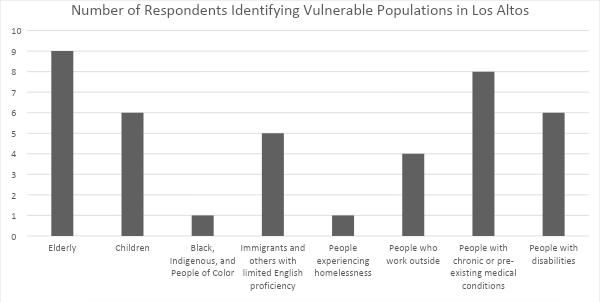
Figure 11: Graph showing how CAAP Task Force members responded to question asking them to identify which vulnerable populations are present in Los Altos
Precipitation & Flooding
Vulnerable populations often have fewer resources and/or limited mobility. Preparations for flooding, evacuations, and clean-ups are all made more difficult by these circumstances.
Wildfires & Air Pollution
While flooding is likely to be limited to areas near the City’s four creeks, the impacts of wildfires may be felt citywide. Like flooding though, preparations, evacuations, returns, and clean up are all more difficult for vulnerable populations: people with limited mobility and functionality, people with chronic or pre-existing medical conditions which could be exacerbated by poor air quality, and people with limited financial resources.
Long before emergency situations, air pollution will directly impact people with respiratory conditions and people who work outside. Wildfires far outside of Los Altos can create unhealthy levels of PM 2.5, especially since existing air quality is only moderate to start with. Air pollution can limit the mobility and quality of life of sensitive groups.
The N-95 masks which are now easy to obtain and with which people are now very familiar with as a result of the Covid-19 pandemic may mean that air quality will not limit activity for vulnerable groups as much as it might have without the pandemic.
APPENDIX H: CLIMATE VULNERABILITY ASSESSMENT FOR THE CITY OF LOS ALTOS, CA CONTINUED
Summary
Los Altos appears better off than many other areas in California with regards to climate change. Los Altos is not directly coastal so it will not experience the impacts of sea level rise, but its relative proximity to the Pacific Ocean and San Francisco Bay should temper climate extremes in the near term. Earthquakes are projected to be a relatively more common and more damaging hazard than any single climate hazard.
Many of the impacts of climate change on Los Altos will not be direct but instead reverberations from nearby Los Altos depends on the natural environment, the water supply system, and the energy grid outside of its borders, so the availability and affordability of water and energy within Los Altos are likely to be jeopardized by climate change across the Bay Area and California as a whole.
Within Los Altos itself, by mid-century particularly under a high emissions scenario, the number of extreme heat days are projected to increase substantially Heat and poor air quality from wildfires outside of Los Altos are most likely to impact the quality of life, particularly for vulnerable populations, and increase energy demands for additional building air cooling/filtering. Extreme heat, poor air quality, and blackouts or PSPS that occur simultaneously will present novel emergency situations that have the potential to strain or overwhelm City resources.
Similarly and more uncertain will be the resilience of Los Altos' natural and maintained landscapes. The annual precipitation amounts in Los Altos are not likely to change, but will become less consistent and in combination with expected temperature increases will in turn increase the amount of water that plants need. Considering water pressure outside of Los Altos, it is likely that water customers will face financial incentives and regulatory pressure to reduce daily water use.
In the winter and spring, seasonal storms which Los Altos has experienced in the past are likely to continue. Rainfall amounts that used to occur once every several years are projected to occur multiple times a year by the end of the century, increasing the need for maintenance and repair of stormwater infrastructure on building sites and across the city.
Los Altos’ government, residents, and businesses are somewhat prepared after living through years of drought and the COVID pandemic. The scale of climate change and the need to reach new vulnerable populations during heat waves may be challenging.