



This project has been funded wholly or in part by the United States Environmental Protection Agency (EPA) under assistance agreement 5D-02D56623-0 to the City of Birmingham. The contents of this document do not necessarily reflect the views and policies of the EPA, nor does the EPA endorse trade names or recommend the use of commercial products mentioned in this document.
Thank you to Alabama Power Co, the Birmingham Airport Authority, Central Alabama Water, Spire Natural Gas, and the Regional Planning Commission of Greater Birmingham for providing essential data for the completion of the Greenhouse Gas Inventory.
Alabama Clean Fuels Coalition
Cahaba River Society
The Nature Conservancy GASP
Birmingham Planning Commission
City of Birmingham Dept of Transportation
City of Birmingham Dept of Planning Engineering and Permits
Jefferson County Government
Shelby County Government
Freshwater Land Trust
Energy Alabama
PROJECT TEAM
Thomas Yuill
Deputy Director, Office of Resilience and Sustainability, City of Birmingham
Hunter Garrison
CACAP Toolkit Lead Project Manager, Climate Action Manager, Office of Resilience and Sustainability, City of Birmingham

Kristin Cushman
CEO, Blue Strike Environmental
Sol Shepherd
Energy and Climate Analyst, Blue Strike Environmental
Zane Cintas
Energy and Climate Analyst, Blue Strike Environmental
Rich Swanson
Director of Energy and Climate, Blue Strike Environmental
Rose Freidin
Graphic Designer, Blue Strike Environmental
Brennan Herdt
Energy Consultant, Tetra Tech
Margot Shrift
Environmental Planner, Tetra Tech
Taylor Cooper
Senior Consultant, Clarus Consulting Group
Sandrea McAlpine
Program Assistant, Clarus Consulting Group
Amber Dillard
Senior Project Specialist, American Institutes for Research
Evelyn Shu
Climate Change Researcher, American Institutes for Research
We wish to express our deepest gratitude to the city staff and individuals throughout the MSA who participated in our survey and meetings. We also extend our sincere appreciation to every individual who offered their insights, expertise, and support in shaping this Central Alabama Climate Action Plan— THANK YOU.

TABLE
TABLE
TABLE
TABLE
TABLE
TABLE
TABLE
TABLE
TABLE
TABLE
TABLE
TABLE
TABLE
TABLE
TABLE K2: Measure 14 Implementation
TABLE L2: Measure 14 Costs
and Milestones
TABLE M2: Measure 14 Intersection with Other Funding Availability
TABLE N2: Measure 15 Implementation Timeline and Milestones
TABLE O2: Measure 15
TABLE P2: Measure 15 Intersection with
TABLE Q2: Measure 16 Implementation
TABLE R2: Measure 16
TABLE S2: Measure 16 Intersection with
TABLE T2: Measure 17
TABLE X2: Measure 18 quantified emission reductions as compared to
TABLE Y2: Measure 18
TABLE
TABLE
TABLE
TABLE C3:
TABLE
TABLE E3: Pollutants Analyzed for Each
TABLE F3: Estimated reductions in co-pollutants associated with all co-pollutants within the MSA
TABLE G3: Comparative Assessment of GHG
TABLE H3: Identified Key Roles Matrix
TABLE I3: Key Roles and Responsibilities for CACAP Toolkit
TABLE
TABLE
TABLE L3: Historical Industry Employment for
(2014–2022)
TABLE M3: Industry Employment for Priority Occupations, MSA (2022–2032)
TABLE N3: Priority Occupations and Matching SOC Codes
TABLE O3: Gap Analysis of Missing Roles
TABLE P3: Predicted Future Jurisdictional Support to fill Missing Roles
FIGURE
FIGURE
FIGURE
FIGURE
FIGURE
FIGURE
FIGURE


Climate change is a pressing global challenge that requires collective action and sustainable solutions to safeguard our planet's future. Greenhouse gas (GHG) emissions which are emitted from the cars we drive, the energy we consume, and the products we buy are having a harmful effect on our environment and are increasing temperatures at an unsustainable pace.
The next few years are critical in limiting global temperature to a 1.5°C increase and mitigating the most severe impacts of climate change. To do so, global emissions need to be halved by 2030, and net zero emissions must be achieved before 2050. According to the most recent report from the Intergovernmental Panel on Climate Change, the Earth has warmed 1.09°C since 1850 and many changes such as sealevel rise and glacier and arctic ice melt are now irreversible. Global temperature rise is likely to reach 1.5°C by the mid-2040s which will further stress our environmental systems and, at a local level, will result in more frequent and intense heat waves, floods, drought, wildfire, and air pollution. As a global community, we are rushing to find ways to mitigate the worst of what is to come. As a local community, we are seeking ways to thrive despite the disruptions to our lives and well-being.

In developing this Central Alabama Climate Action Plan Toolkit (CACAP Toolkit), the Birmingham Metropolitan Statistical Area (MSA) acknowledges that the effects of climate change are no longer abstract. They are already affecting the community's infrastructure, health services, housing, and day-to-day operations. Increasing extreme weather events, shifts in temperature and precipitation, summer water shortages, and more frequent energy outages reflect the urgent need for more sustained climate action.
The CACAP Toolkit provides a long-term, strategic framework for reducing GHG emissions while also enhancing resilience to current and future climate-related risks. Unlike the 2024 Priority Climate Action Plan (PCAP), which focused on short-term, high-impact actions, particularly in the transportation sector, this CACAP Toolkit broadens the scope to include a full range of climate solution sectors.
The MSA’s 2025 CACAP Toolkit is meant to serve as a guiding document, providing a Toolkit for all counties and municipalities within the MSA to use as they tackle climate change. It is designed as a comprehensive set of strategies to reduce GHG emissions in a manner consistent with state guidelines and regulations, and to identify cost-effective opportunities for existing and future residents, businesses, and development projects to create a more sustainable community. The CACAP Toolkit is intentionally a living document that can be revised as needed with clear and transparent metrics by which progress can be both assessed and measured. Although the MSA will be flexible, it will remain steadfast to the objectives ahead. This CACAP Toolkit represents a bold, holistic step forward in building a sustainable and climate-resilient future for Central Alabama. Each municipality will engage with the CACAP Toolkit differently, based on the resources, staffing capacity, and funding available to them.

Building on the baseline data and stakeholder input, the Strategy Development phase focused on crafting a CACAP Toolkit that reflects unique priorities for each county within the MSA while aligning with broader state and federal climate goals. This phase involved identifying key strategies to reduce GHG emissions, enhance energy efficiency, integrate renewable energy, and strengthen climate resilience. Scenario modeling tools were utilized to project the potential impacts of proposed strategies, helping to refine approaches that best support environmental stewardship.
Different county types serve distinct populations, face unique regulatory and environmental challenges, and require tailored solutions to meet policy goals effectively. A one-size-fits-all approach can lead to inefficiencies, missed opportunities, or unintended negative consequences. Therefore, the CACAP Toolkit codes each strategy and its relevance or varied impact using three distinctive housing community types. This framework will help each county understand which strategies are relevant to their specific land use type.
URBAN
Dense, multi-modal environments
RURAL
Low-density, resource-limited areas
SUBURBAN
Suburban or transitioning communities
Table A is a snapshot of the Toolkit and provides further context for which strategies are feasible, which will create high GHG reductions, which might not be relevant to a specific county, and is intended to track where the priorities are. Cities and counties scan this list and pull out the strategies that they feel fits within their timeframe and budget. A full list of strategies outlined in the CACAP Toolkit can be found in Appendix A
TABLE A: SAMPLE OF STRATEGIES OUTLINED IN THE TOOLKIT
1.1 Conduct a deep retrofit at the City of Birmingham's City Hall
1.2 Create Climate Policies for large facilities such as convention centers, hotels, and amphitheaters, beginning with the Birmingham Jefferson Convention Center
1.3 Promote the adoption of induction furnaces by Birmingham area ductile iron pipe manufacture
2.1 Adopt or encourage energyefficient building codes for new construction
2.2 Launch "Solarize the MSA" by building a crowd funding campaign which bundles multiple solar projects under one RFP.
2.3 Transition tools, small engines, and other equipment to electric alternatives. Implement incentives and rebates for the community to do the same
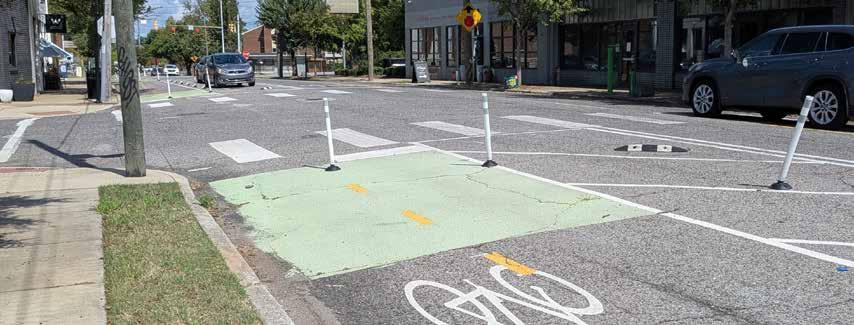
The CACAP Toolkit includes 18 measures, 68 strategies, and 139 associated actions, all designed to serve as a clear roadmap for implementation. Of the plan’s 18 measures, 10 prioritize GHG mitigation in sectors including energy and buildings, land use and transportation, industrial efficiency, and waste and recycling; while the remaining 8 focus on adaptation and resilience and include agriculture and open space, water management, climate preparedness, and creating an implementation Task Force. Within the measures, certain strategies have emerged as the most impactful climate actions for each county within the MSA. These high-priority strategies, identified for their cost-effectiveness and potential impact, are highlighted as the “Top 10 Biggest Bang for Your Buck by County” , as shown in Table B , to help policymakers focus their efforts where they will achieve the greatest results.
1
2
3
Incorporate Smart Growth principles
Attract or establish a regional compost facility
Install Renewable energy projects; Lobby for the reduction of Alabama Power’s Surcharge Capacity
Reservation Charge
4
Prioritize strategies that will increase density within a ½ mile of the BRT corridors
Incorporate Smart Growth principles
Establish a local recycling center
Support for the reduction of Alabama Power’s Surcharge Capacity
Reservation Charge
Develop more centralized, mixed-use development
Support the enforcement of water quality audits
Establish a local recycling center
Support for the reduction of Alabama Power’s Surcharge Capacity
Reservation Charge
Adapt zoning codes to allow for conservation subdivisions in rural areas
Support the enforcement of water quality audits
Establish a local recycling center
Support for the reduction of Alabama Power’s Surcharge Capacity
Reservation Charge
Adapt zoning codes to allow for conservation subdivisions in rural areas
Support the enforcement of water quality audits
Establish a local recycling center
Support for the reduction of Alabama Power’s Surcharge Capacity
Reservation Charge
Adapt zoning codes to allow for conservation subdivisions in rural areas
Support the enforcement of water quality audits
Establish a local recycling center
Support for the reduction of Alabama Power’s Surcharge Capacity
Reservation Charge
Adapt zoning codes to allow for conservation subdivisions in rural areas
Support the enforcement of water quality audits
Establish a local recycling center
Support for the reduction of Alabama Power’s Surcharge Capacity
Reservation Charge
Adapt zoning codes to allow for conservation subdivisions in rural areas
5
Establish wasteto-energy systems at all landfills
6 Adopt a Model Waste Franchise Agreement MSA wide
Establish waste-toenergy systems at all landfills
Establish waste-toenergy systems at all landfills
Adopt a Model Waste Franchise Agreement MSA wide Adopt a Model Waste Franchise Agreement MSA
Establish waste-toenergy systems at all landfills
Establish waste-toenergy systems at all landfills
Establish waste-toenergy systems at all landfills
a
Establish waste-toenergy systems at all landfills
Waste Franchise Agreement MSA wide Adopt a Model Waste Franchise Agreement MSA wide 7 Consider industrial Carbon Capture and Sequestration tools to mitigate GHG reductions Consider industrial Carbon Capture and
The MSA GHG Inventory provides a comprehensive assessment of all emissions generated within the region’s geographic boundary. As a foundational element of the CACAP Toolkit, this Inventory establishes a clear, data-driven baseline to guide strategies for reducing emissions, improving air quality, and building climate resilience. The year 2023 was chosen as it is the most recent year with full data available for all emission sources and sinks within the boundaries of all counties.
The total emissions produced within the MSA boundary during the 2023 calendar year was 21.5 million metric tonnes of carbon dioxide equivalent emissions (MMTCO₂e).
Figure A presents the percentage distribution of GHG emissions across all producing sectors within the MSA, excluding the AFOLU (Agriculture, Forestry, and Other Land Use) sector, which sequesters carbon. Transportation sources contribute the largest share at 31% of total emissions, process and fugitive emissions account for 22%, followed by stationary energy use in the residential (14%), industrial (14%), and commercial (13%) sectors. Solid waste contributes 3%, and finally upstream impacts of activities and water/wastewater systems contribute 3% and 0.19%, respectively.
The MSA emitted an estimated 18 metric tons of GHGs per person, placing it above the national average of 14 metric tons per capita.
FIGURE A: EMISSIONS SOURCE BREAKDOWN IN MSA BOUNDARIES.

Securing the necessary funding to effectively execute the CACAP Toolkit demands a range of funding strategies and avenues. An integral component of the financial approach is identifying potential external funding sources, particularly for actions that require additional support. Recognizing that certain measures might surpass the MSA's current resources, tapping into external funding becomes essential. Within this framework, specific funding sources are identified where known. The implementation year for each measure is selected based on a prioritization score. An imminent implementation year signifies a high prioritization score for that measure, while a later year means a comparatively lower score. The cost estimates are indicative only; they are based on preliminary assessments, comparisons with similar programs, and expert input and are meant to provide a rough evaluation. It should be noted, however, that the MSA can rely heavily on the influx of state and federal grants to support many of these measures.
While the proposed CACAP Toolkit measures can be intimidating, the cost of inaction is much higher. Investments now will substantially reduce long-term operation costs, reduce recovery costs from climate-related disasters, and promote growth in local jobs and the economy. The goals are ambitious, but achievable. There will undoubtedly be twists and turns on this path, and the MSA will need to stay flexible and adapt along the way. The overarching goal of the CACAP Toolkit is to bring community benefits and financial resources to create better air quality and quality of life to every resident who lives within Central Alabama.
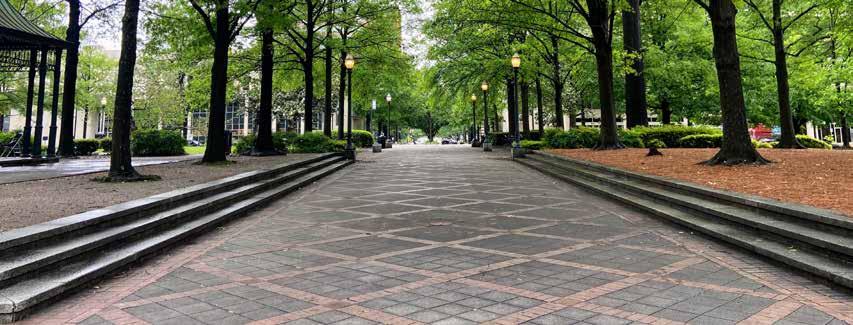

The MSA, also known as Greater Birmingham or the Birmingham MSA, is a major urban region in north central Alabama, centered around the City of Birmingham (the City). As of 2025, the MSA includes seven counties: Bibb, Blount, Chilton, Jefferson, St. Clair, Shelby, and Walker. According to the 2020 Census, the MSA had a population of 1,180,631, making it the 50th largest metro area in the U.S. and the largest in Alabama. It is also part of the Piedmont Atlantic Megaregion, a vast economic corridor home to around 19 million people. It is classified as part of the Southeast, Deep South, and Upland South due to its location in the Appalachian foothills. The entire MSA falls under the Appalachian Regional Commission’s definition of Appalachia, highlighting its geographic and cultural ties to the region.
The MSA has a diversified economy, including banking, finance, healthcare, education, and heavy industry. Major employers include the University of Alabama at Birmingham (UAB), Regions Financial Corporation, and Blue Cross and Blue Shield of Alabama. The region is a transportation hub, with major interstates such as I-65, I-20, I-59, and I-22 intersecting in the area. Birmingham-Shuttlesworth International Airport serves as the main air travel gateway. The region is also home to leading educational institutions, including UAB, Samford University, and Miles College, as well as natural attractions such as Red Mountain, Oak Mountain State Park, and the Cahaba River that provide outdoor recreation opportunities.
Although the CACAP Toolkit was developed collaboratively to serve the entire MSA, the City played a pivotal role in bringing it to life. Established in 2024, the City’s Office of Resilience and Sustainability serves as a central force for advancing climate action, development, and sustainable infrastructure. The office was created to lead efforts that align MSA communities with Alabama’s broader environmental priorities, fostering a coordinated and resilient regional response.

Climate actions are not isolated events. They require collaboration and cross-cutting strategies across multiple-jurisdictions, public agencies, nonprofits, commercial businesses and residential communities. This CACAP Toolkit emerged as a result of an extensive review of both environmental state mandates, the commitments of local and regional jurisdictions, and existing public private partnership structures. The City leveraged existing planning commitments where feasible and integrated new strategy elements to tailor this CACCAP Toolkit uniquely to the MSA. The following documents were reviewed:
•Birmingham 2050 Regional Transportation Plan
•B-Active Plan: Regional Active Transportation Plan
•The Plan for Walker County – Creating Alignment and a Common Vision 2015
•Shelby County Comprehensive Plan
•Shape Bham
•2014 Birmingham Housing and Neighborhood Study
•Birmingham Comprehensive Plan - Chapter 6
•Imagine Birmingham: Community Framework Plans
•Red Rock Ridge and Valley Trail System Master Plan
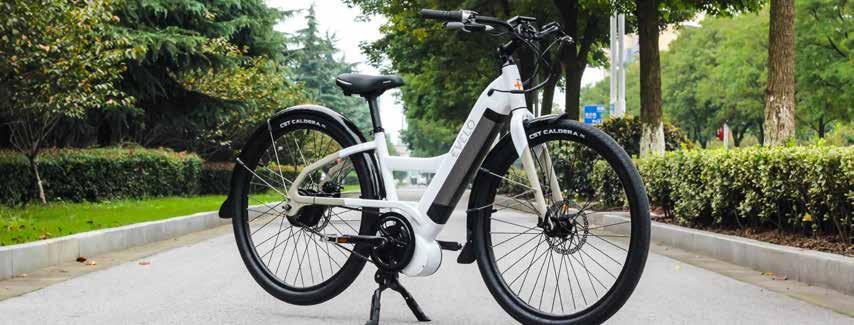
The Climate Pollution Reduction Grant (CPRG) program, administered by the U.S. Environmental Protection Agency (EPA), is an initiative funded by the Inflation Reduction Act of 2022 to provide grants to states, local governments, Tribes, and territories for the development and implementation of ambitious plans for reducing GHG emissions and other harmful air pollutants. The CPRG program’s primary objective is to reduce GHG emissions, thereby mitigating climate change. It provides financial support for devising and executing measures to reduce emissions. Alongside GHG reduction, CPRG endeavors to revive ecosystems, enhance infrastructure, stimulate economic growth, and enhance public health by alleviating the pollution burden disproportionately borne by communities. In addition to GHG emission reductions, the EPA aims to achieve four overarching objectives:
• Address damaging climate pollution while promoting the creation of employment opportunities and reducing energy expenses for households
• Expedite efforts to rectify environmental impacts and empower community-led solutions
• Improve air quality by curbing harmful air pollutants in residential, occupational, recreational, and educational environments

To realize these objectives, the CPRG program comprises two primary phases:
This phase focuses on the development of a PCAP and CACAP, both of which are funded through CPRG Planning Grants. The PCAP focuses on short-term, high-priority emission reduction measures, while the CACAP provides a more comprehensive roadmap for long-term strategies.
2. Implementation
This phase entails the execution of the PCAP and CACAP objectives by CPRG Planning grant recipients; to accomplish these objectives, eligible participants may apply for competitive CPRG Implementation Grants. Overarching CRPG program goals for this phase include:
• Implementation of ambitious measures to achieve significant cumulative GHG reductions by 2030 and 2050
• Pursuit of measures yielding substantial community benefits, such as the reduction of criteria air pollutants and hazardous air pollutants
• Complementary utilization of other funding sources to maximize GHG reductions and community benefits
• Pursuit of innovative policies and programs that are replicable and scalable across multiple jurisdictions
The MSA’s PCAP satisfied the first deliverable, set forth in the CPRG Planning Grant. It became the framework for this CACAP Toolkit, which satisfied the remaining Planning Grant deliverable.
The CACAP Toolkit serves as an actionable, community-informed roadmap to reduce GHG emissions and climate impact across all major sectors. These measures are informed by a comprehensive GHG Emissions Inventory, and each measure is accompanied by detailed assessments of both qualitative and quantitative cobenefits, including a robust co-pollutant reduction analysis. The CACAP Toolkit also evaluates implementation authorities, funding pathways, and workforce development needs to ensure effective execution.
The CACAP Toolkit is the product of a sustained and collaborative process that engages multiple levels of government, integrates meaningful community input, and incorporates feedback from a wide range of stakeholders. It reflects the unique local context of the planning region and is designed to be both ambitious and implementable. Ultimately, this CACAP Toolkit strengthens and expands the MSA’s understanding of its GHG sources and sinks and sets both near-term and long-term emission reduction targets.
The CACAP Toolkit is rooted in a community-driven planning process, centered on engagement with nonprofit and business community members, youth, and key stakeholders. This participatory approach ensured that GHG reduction measures were both locally informed and culturally aligned with local priorities and values. Each measure within the CACAP Toolkit was evaluated for its feasibility, effectiveness, and consistency with existing policies and best practices in climate resilience.
The CACAP Toolkit project team was led by the City’s Office of Resilience and Sustainability with a strong commitment to engage with jurisdictions within the MSA. The planning process included biweekly meetings with a dedicated project team. A Steering Committee was assembled to actively engage municipal leadership throughout the planning process, ensuring that the measures, strategies, and actions reflect the priorities and expertise of those responsible for local governance. This group provided critical guidance, facilitated interdepartmental collaboration, and helped align the plan with existing policies and initiatives. Their involvement ensured that the planning process remained grounded in practical implementation pathways and responsive to the needs of the broader community.
The Climate Action Tracker (Tracker) is being used to track annual progress of the CACAP Toolkit. The Tracker acts as an internal tracking system for staff roles and responsibilities, timelines and funding approaches. The Tracker combines stakeholder feedback with strategy development to determine and clearly identify what additional gaps in data or funding is needed. The Tracker functions like a workbook and serves as the single point for planning, reporting and ongoing performance monitoring. The Tracker: (1) establishes a “starting point” for future comparisons; (2) tracks strategies and actions identified in the CACAP Toolkit; (3) ensures contributions and actions of multiple city and county leaders; and (4) summarizes results and impacts. The Tracker can be used to assign various action and reporting requirements to key departments responsible for reporting.

The Tracker provides initial priority rankings and timelines for each CACAP Toolkit strategy. As a primary step, each strategy is ranked by its potential impact on GHG emission reductions:
TIER 1 FOUNDATIONAL
GHG emission reductions that are drawn out as immediate priorities, regardless of funding available or political will
TIER 2 SUPPORTIVE
Indicate strategies that have less GHG reduction potential but are still critical elements in reducing environmental impacts
TIER 3 COMPLIMENTARY
Educational strategies that are a cornerstone to the CACAP Toolkit’s ability to succeed
The second step involves assigning co-benefits to each strategy to better evaluate its feasibility and effectiveness. These co-benefits are weighted numerically and categorized according to their level of impact, high, medium, or low. Each cobenefit is then assigned a specific percentage based on its contribution to reducing GHG emissions.
• GHG Reduction potential: 55%
• Cost-Effectiveness (net present value, impact versus dollar spent): 25%
• Community Benefits (clean air, livable community, resiliency, etc.): 20%

Community engagement was a critical component of the CACAP Toolkit planning process. Community members are the ones that experience the effects of its plan, projects and policies. In the process of creating the CACAP Toolkit, the project team worked (and will continue to collaborate) with local organizations, small businesses, and public and private stakeholders within the seven-county MSA. The stakeholder engagement events have included survey reports, focus group discussions, and public workshops. Participants' comments and suggestions have been integrated into the CACAP Toolkit to the best of the project team’s abilities. As this CACAP Toolkit is implemented, collaboration between the project team and these stakeholders will remain essential because they are, as members of the community, best equipped to inform the CACAP Toolkit team of the challenges the community faces. The full Final Findings Report can be found in Appendix B
For this project, the MSA completed its very first comprehensive GHG Inventory of all emission sources and sinks. The Inventory quantifies GHG emissions across major sectors using internationally recognized accounting protocols, ensuring accuracy, transparency, and comparability with other communities. It covers direct emissions from within the MSA (Scope 1), indirect emissions from purchased energy (Scope 2), and other indirect emissions from the supply chain and related activities (Scope 3). Each scope has associated sectors and sources. Sectors are defined as broad categories of activity that group similar types of emissions. Within each sector, sources identify the specific processes, equipment, or activities that generate GHGs, enabling consistent classification, analysis, and tracking over time.
The 2023 calendar year serves as the base inventory year, marking the MSA’s first-ever community-wide GHG inventory. All future inventories will build upon this baseline to track progress over time. 2023 was chosen as it is the most recent post-COVID year with complete data.
The GHG Inventory covers the following sectors:
TRANSPORTATION & MOBILE SOURCES
SOLID WASTE
WATER & WASTEWATER
COMMERCIAL ENERGY
INDUSTRIAL ENERGY
RESIDENTIAL ENERGY
PROCESS & FUGITIVE EMISSIONS
UPSTREAM IMPACTS OF ACTIVITIES
DESCRIPTION
Emissions from on-road and off-road vehicles, public transit, rail, air travel, water travel, and other mobile equipment powered by fossil fuels.
Methane released from waste decomposition in landfills, along with emissions from waste combustion and handling.
Emissions associated with the extraction, treatment, distribution, and disposal of potable water and wastewater, including fugitive emissions from treatment processes.
Emissions from electricity and natural gas consumed by commercial buildings and facilities.
Emissions from fuel combustion and electricity consumption in industrial facilities and manufacturing operations.
Emissions from fuel combustion for space heating, water heating, cooking, and other household uses, as well as electricity-related emissions.
Local distribution fugitive emissions, reported leakage from natural gas operations, and process emissions from industrial factories and operations.
Indirect emissions from the production, refining, and transportation of fuels and electricity used within the MSA.
AGRICULTURE, FORESTRY, AND OTHER LAND USE (AFOLU)
Emissions and removals associated with fertilizer and manure, as well as land use, land-use change, agricultural activities, and forestry management.

The Inventory follows the reporting protocol outlined by ICLEI as referenced in the US Community Protocol2 and Local Government Operations Protocol3. It is analyzed using ICLEI’s proprietary online ClearPath tool. ClearPath is a leading software in GHG analysis for governments. Local governments are expected to evaluate emissions of the six internationally recognized GHGs under the Kyoto Protocol 4 , namely Carbon dioxide (CO₂), Methane (CH 4), Nitrous oxide (N₂O), Hydrofluorocarbons (HFCs), Perfluorocarbons (PFCs), and Sulfur hexafluoride (SF6)5. To ensure consistency and comparability, GHG emissions are expressed in terms of carbon dioxide equivalent (CO₂e), which accounts for the varying impacts of different GHGs. The Global Warming Potential (GWP) metric is used to calculate CO₂e by comparing the heat-trapping ability of each gas to that of carbon dioxide (CO₂) over a specific time horizon, typically 100 years. The GWPs used in this inventory are from the IPCC Fifth Assessment Report (AR5)6 , provided in Table C
2 ICLEI - Local Governments for Sustainability USA. (2023). U.S. community protocol for accounting and reporting of GHG emissions, version 1.2. Retrieved from https://icleiusa.org/us-community-protocol
3 ICLEI - Local Governments for Sustainability USA, California Air Resources Board, & California Climate Action Registry. (2010). Local government operations protocol for the quantification and reporting of GHG emissions inventories, version 1.1. Retrieved from https://icleiusa.org/ resources/local-government-operations-lgo-protocol
4 United Nations. (1998). Kyoto Protocol to the United Nations Framework Convention on Climate Change. Retrieved from https://unfccc.int/resource/docs/convkp/kpeng.pdf
5 As referenced in the US Community Protocol, the high GWP GHGs perfluorocarbons and sulfur hexafluoride are not required to complete an accurate inventory. The City reported no refrigerant loss, and therefore no hydrofluorocarbons do not appear in the inventory. All other GHGs are measured and reported.
6 Intergovernmental Panel on Climate Change. (2014). Climate change 2014: Mitigation of climate change. Contribution of Working Group III to the Fifth Assessment Report of the Intergovernmental Panel on Climate Change. Cambridge University Press. Retrieved from www.ipcc.ch/report/ar5/wg3

The total emissions produced within the MSA boundary during the 2023 calendar year was 21.5 million metric tonnes of carbon dioxide equivalent emissions (MMTCO₂e).
Table D shows a breakdown of emission by sector for seven counties within the MSA.
TABLE D: TOTAL MSA WIDE EMISSIONS BY SECTOR IN MMTCO₂e

Figure B illustrates GHG emissions (in MMTCO₂e) across key sectors. Transportation & Mobile Sources is the largest contributor, accounting for 7.92 MMTCO₂e. Other significant sources include Process & Fugitive Emissions (5.77), Residential Energy (3.69), Industrial Energy (3.60), and Commercial Energy (3.40). Smaller contributions come from Solid Waste (0.83), Upstream Impacts of Activities (0.68), and Water & Wastewater (0.05). Notably, AFOLU sequesters 4.47 MMTCO₂e, and is a carbon sink.
B: BAR CHART OF EMISSION SECTORS IN THE MSA (MMTCO₂e)
Figure C presents the percentage distribution of GHG emissions across all producing sectors within the MSA, excluding the AFOLU sector, which sequesters carbon. Transportation sources contribute the largest share at 31% of total emissions, process and fugitive emissions account for 22%, followed by stationary energy use in the residential (14%), industrial (14%), and commercial (13%) sectors. Solid waste contributes 3%, and finally upstream impacts of activities and water/wastewater systems contribute 3% and 0.16%, respectively.
C: EMISSIONS SOURCE BREAKDOWN IN MSA BOUNDARIES
31% TRANSPORTATION & MOBILE SOURCES 3% UPSTREAM IMPACTS OF ACTIVITIES
22% PROCESS & FUGITIVE EMISSIONS
INDUSTRIAL ENERGY
Understanding GHG emissions on a per-person basis helps put the region’s climate impact into perspective. In 2020, the MSA was home to just over 1.18 million people. In 2023 total GHG emissions across the MSA were estimated at 21.5 MMT CO₂e.
When averaged across the population, this amounts to roughly 18 metric tons of emissions per person. This figure reflects the combined impact of how people in the region live, travel, use energy, and manage waste.
For context, the national average in the United States is around 14 metric tons per person, while the statewide average for Alabama is closer to 22 metric tons per person. That places Birmingham’s per capita emissions above the national average, but below the state average.
Forests and land use play an important role in a community’s GHG profile by both releasing and absorbing carbon. Activities such as tree harvesting, land clearing, and changes in vegetation can result in emissions, while forest growth and conservation efforts can remove carbon from the atmosphere.
The ICLEI LEARN tool 7 estimates the net impact of these land-based carbon flows within the community boundary. The analysis is based on the National Land Cover Database (NLCD), which estimates land cover and biomass data to quantify sources and sinks. Land use change emissions insights provide a more complete picture of the community’s carbon balance and support land use planning that aligns with climate goals.
7 ICLEI – Local Governments for Sustainability USA. (n.d.). Land Emissions and Removals Navigator (LEARN) tool. ICLEI USA. https://icleiusa.org/learn-tool
Wildfires and insects are a major driver of land use emissions for the MSA. These events caused immediate carbon releases through biomass combustion and resulted in long-term emissions due to the conversion of forested areas to non-forest land. This shift has reduced the land’s carbon sequestration capacity.
Table E below shows a simplified report of forest land use emission categories based on Intergovernmental Panel on Climate Change (IPCC) categories. The total net flux of land use is an emission of -6.3 MMT CO₂e per year. This is primarily due to the shifting landscape change from forests to non-forests.
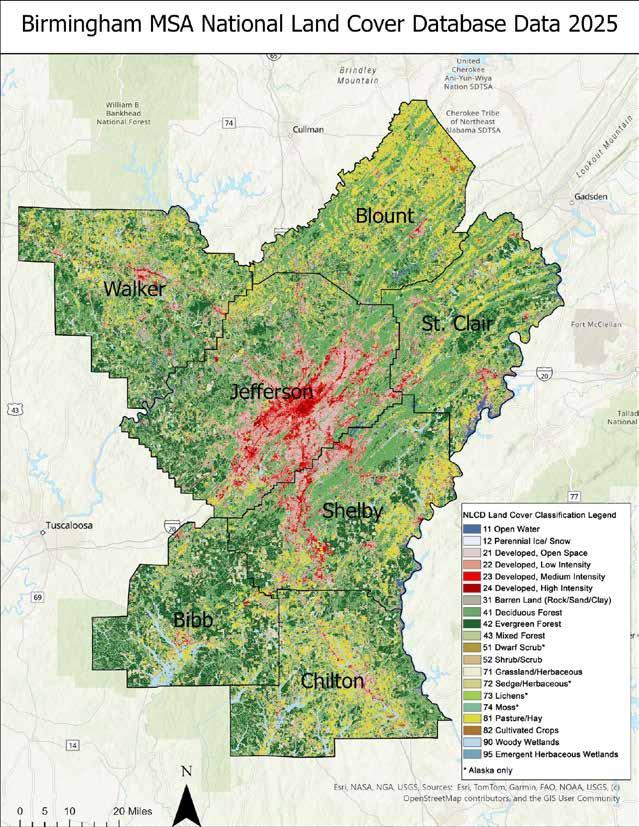
Figure D presents the 2025 NLCD dataset8 for the MSA, illustrating spatial patterns in land cover that underpin emissions modeling in the LEARN tool. NLCD serves as a foundational geospatial input for LEARN’s estimation of GHG fluxes resulting from land use change, enabling the detection of key transitions—such as urban encroachment, forest conversion, or canopy gain/loss—at a consistent national scale. Within the LEARN framework, this classification data is combined with standardized carbon stock factors and
8 U.S. Geological Survey. (2024). Annual NLCD Collection 1 Science Products [Data set]. U.S. Geological Survey. https://doi.org/10.5066/P94UXNTS USGS+2USGS+2
9 U.S. Geological Survey. (2024). Annual NLCD Collection 1 Science Products [Data set]. U.S. Geological Survey. https://doi.org/10.5066/P94UXNTS USGS+2USGS+2
3. NEAR-TERM AND LONG-TERM GHG REDUCTION TARGETS

In 2021, the United States formally rejoined the Paris Agreement and submitted a new Nationally Determined Contribution (NDC), committing to reduce GHG emissions 50–52% below 2005 levels by 2030 and to achieve net-zero emissions economywide by 2050. The commitments are supported by landmark legislation, including the Bipartisan Infrastructure Law and the Inflation Reduction Act, which together provide substantial investments in clean energy, transportation electrification, building efficiency, and industrial decarbonization.
The MSA will comply with these national climate goals as foundational benchmarks for regional planning and emissions reduction. In doing so, the MSA aligns with the broader national trajectory toward a carbon pollution-free electricity grid by 2035, expanded deployment of electric vehicles (EV) and charging infrastructure, reduced methane emissions, and increased investment in communities.
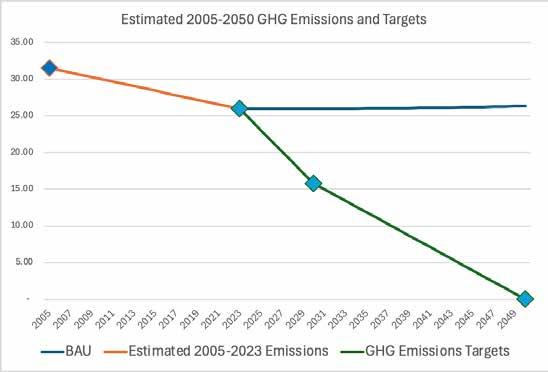
To support this alignment and guide local target-setting, GHG emissions for the MSA were estimated for the period 2005 through 2023. Because comprehensive local emissions data before 2023 were limited, historical estimates were derived by applying a combination of Alabama’s statewide utility emissions trends, and national trends for other sectors proportionally to the region. This approach enabled a consistent and policy-aligned estimation of regional emissions trajectories. Calendar year 2005 was necessary to be estimated for a baseline year to remain consistent with federal climate targets and serves as the reference point for setting the MSA’s mid-term 2030 reduction benchmark. The 2050 target remains net-zero emissions across all sectors, in alignment with national commitments. A comprehensive GHG inventory and land use emissions can be found in Appendix C .

Table F summarizes the estimated emissions trajectory for the MSA, including an estimated 2005 base year, the 2023 comprehensive GHG emission baseline, the 2030 interim target, and the 2050 net-zero objective.
Figure E shows estimated emissions between 2005 and 2023, the 2023–2050 BAU forecasts, and compared with the GHG Emission Targets.
FIGURE E: ESTIMATED 2005–2050 EMISSIONS AND TARGETS
Figure E: Estimated 2005-2050 Emissions and Targets
4.1 BAU Projections Methodologies
The Business-as-Usual (BAU) Forecast represents expected emissions in the absence of additional climate action, based on demographic and sectoral growth trends This BAU Forecast was developed in the ICLEI ClearPath tool. To develop this baseline, population growth was applied uniformly across all sectors, reflecting the strong link between community expansion and rising demand for energy, transportation, housing, and services Within the Residential, Commercial, and Industrial Energy sectors, the EPA’s Energy Consumption Projections tool10 was used to project electricity, natural gas, and propane consumption That tool is developed for the entire State of Alabama, but a confident assumption that those projections will be consistent for the MSA Within the transportation sector specifically, default carbon intensity growth rates from the U S Community Protocol, derived from federal CAFE standards, were incorporated to capture improvements in vehicle efficiency over time This approach provides a consistent, standardized framework for projecting future emissions, while highlighting the extent to which anticipated population increases are likely to drive upward pressure on overall GHG emissions This BAU only includes carbon emissions and removes carbon sinks from land usage

The Business-as-Usual (BAU) Forecast represents expected emissions in the absence of additional climate action, based on demographic and sectoral growth trends. This BAU Forecast was developed in the ICLEI ClearPath tool. To develop this baseline, population growth was applied uniformly across all sectors, reflecting the strong link between community expansion and rising demand for energy, transportation, housing, and services. Within the Residential, Commercial, and Industrial Energy sectors, the EPA’s Energy Consumption Projections tool10 was used to project electricity, natural gas, and propane consumption. That tool is developed for the entire State of Alabama, but a confident assumption that those projections will be consistent for the MSA. Within the transportation sector specifically, default carbon intensity growth rates from the U.S. Community Protocol, derived from federal CAFE standards, were incorporated to capture improvements in vehicle efficiency over time. This approach provides a consistent, standardized framework for projecting future emissions, while highlighting the extent to which anticipated population increases are likely to drive upward pressure on overall GHG emissions. This BAU only includes carbon emissions and removes carbon sinks from land usage.
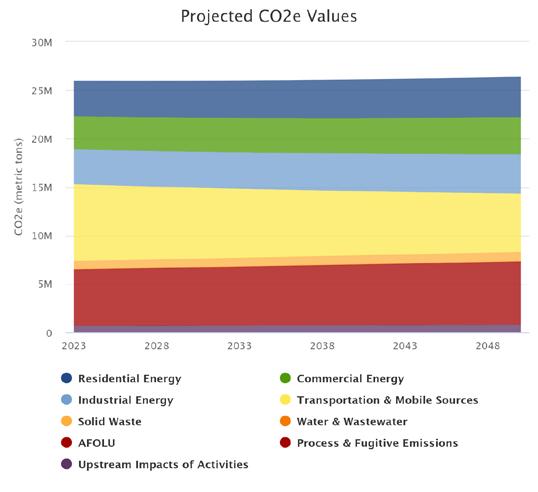
Table G presents projected emissions for key forecast years 2030 and 2050 under the BAU scenario. These values illustrate how community-wide GHG emissions are expected to change over time when population growth and transportation sector carbon intensity adjustments are applied. Figure F provides a visual breakdown of all major emission sources, showing their relative contributions and expected changes between the 2023 baseline year and 2050. Together, the table and figure highlight not only the overall scale of projected emissions growth but also the sectors most responsible for driving these trends.
10 U.S. Environmental Protection Agency. (n.d.). Download the State Inventory and Projection Tool. U.S. Environmental Protection Agency. Retrieved August 21, 2025, from https://www.epa.gov/ statelocalenergy/download-state-inventory-and-projection-tool

F: MSA-wide BAU Emission change
COMMERCIAL ENERGY
TRANSPORTATION & MOBILE SOURCES
WATER & WASTEWATER
PROCESS & FUGITIVE EMISSIONS
5.1 GHG Emission Reduction Measures Summary Mitigation, adaptation, and resilience tackle climate risk from complementary angles: mitigation cuts the drivers of climate change by

5. GHG EMISSION REDUCTION MEASURES AND IMPLEMENTATION SCENARIO PROJECTIONS
Mitigation, adaptation, and resilience tackle climate risk from complementary angles: mitigation cuts the drivers of climate change by reducing GHG emissions or increasing carbon sinks; adaptation modifies buildings, infrastructure, and behaviors to live with current and expected impacts; and resilience is the capacity of people and systems to withstand shocks, keep operating, and recover quickly.
The measures identified in this plan, as reflected in Table H, were categorized according to their primary benefit. Mitigation measures provide specific, measurable reductions in GHG emissions that will be tracked in future inventories. Adaptation and resilience measures do not generate direct GHG reduction benefits and, therefore, are not assessed with the same quantitative rigor. Instead, they are evaluated based on their ability to reduce community vulnerability, strengthen systems, and enhance long-term capacity to respond to climate-related challenges.
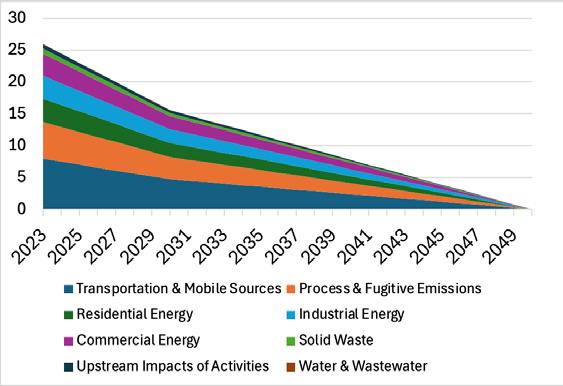
The following implementation scenarios demonstrate how varying levels of action influence long-term GHG emission trajectories for the MSA. These scenarios are shown in Table I and Figure G below. Under the BAU scenario, where no additional mitigation measures are adopted beyond existing policies, annual emissions remain relatively flat through 2030 and slightly increase by 2050 due to population and economic growth, stabilizing around 26.36 MMTCO₂e.
The Conservative Scenario reflects the estimated reductions from the suite of strategies and measures identified in this plan, assuming partial implementation and adoption rates consistent with historical trends and current funding levels. Under this scenario, annual emissions fall modestly to 25.89 MMTCO₂e by 2025, decline more significantly to 24.19 MMTCO₂e by 2030, and reach 21.69 MMTCO₂e by 2050.
The Aggressive Scenario illustrates a transformative pathway consistent with achieving the U.S. national carbon mitigation targets. This scenario assumes accelerated adoption of EVs (100% by 2050), a full transition of the electric grid to renewable energy sources, and the electrification of all building end uses currently reliant on natural gas. These actions, combined with ambitious implementation of the measures outlined in this plan, result in substantial near-term reductions, bringing emissions down to 24.04 MMTCO₂e in 2025 and 15.57 MMTCO₂e by 2030, and ultimately achieve net-zero emissions by 2050.
I:
TRANSPORTATION & MOBILE SOURCES
PROCESS & FUGITIVE EMISSIONS
INDUSTRIAL ENERGY
SOLID WASTE
WATER & WASTEWATER
5.3 GHG Emission Reduction Measures
Energy use is an essential component of community resilience, particularly as climate change introduces more frequent and severe disruptions to energy supply and demand This positions the energy and building sector as a high-impact opportunity for driving efficiency, reducing GHG emissions, and electrifying systems As part of this effort, the CACAP Toolkit calls for a strategic movement toward renewable energy projects that not only reduce emissions but also support long-term grid reliability. By investing in distributed energy resources (DER) such as solar and battery storage, the region can decrease dependence on centralized fossil fuel systems and enhance its ability to withstand and recover from grid interruptions These projects can also stimulate local economic development and create jobs while ensuring that homes, businesses, and essential services remain operational during extreme weather events or grid stress periods
Measure 1: Electrification at Municipal and Industrial Buildings
Measure 1A: Replace Fossil-fuel-based Systems in Selected Municipal owned Buildings and Operations with Electric Alternatives by 2031

Energy use is an essential component of community resilience, particularly as climate change introduces more frequent and severe disruptions to energy supply and demand. This positions the energy and building sector as a high-impact opportunity for driving efficiency, reducing GHG emissions, and electrifying systems. As part of this effort, the CACAP Toolkit calls for a strategic movement toward renewable energy projects that not only reduce emissions but also support long-term grid reliability. By investing in distributed energy resources (DER) such as solar and battery storage, the region can decrease dependence on centralized fossil fuel systems and enhance its ability to withstand and recover from grid interruptions. These projects can also stimulate local economic development and create jobs while ensuring that homes, businesses, and essential services remain operational during extreme weather events or grid stress periods.

ELECTRIFICATION AT MUNICIPAL AND INDUSTRIAL BUILDINGS
REPLACE FOSSIL-FUEL-BASED SYSTEMS IN SELECTED MUNICIPAL OWNED BUILDINGS AND OPERATIONS WITH ELECTRIC ALTERNATIVES BY 2031
MEASURE 1: ELECTRIFICATION AT MUNICIPAL AND INDUSTRIAL BUILDINGS
DESCRIPTION
This measure will deliver electrification-focused retrofits at two flagship facilities, City Hall and the Birmingham Jefferson Convention Center (BJCC), by converting heating, ventilation, and air conditioning (HVAC) and domestic hot water to highefficiency heat pumps with modern controls and replacing gas-powered maintenance and landscaping equipment with electric models.
RESPONSIBLE PARTIES
LEAD :
The City’s Office of Resilience and Sustainability
SUPPORTING:
City’s Department of General Services
The Birmingham City Hall is cooled by a large, aging, watercooled chiller and cooling tower. The building is heated by natural gas-fired boilers that distribute heated water to air handlers in the building. Retrofitting the building with high-efficiency variable refrigerant flow (VRF) heat pumps would increase cooling efficiency for the building and allow the building to forgo fossil-fuel based heating. If done in conjunction with a solar photovoltaic (PV) installation, as analyzed in strategy 2A.5, and a lighting retrofit, as analyzed in strategy 3.3, City Hall can dramatically reduce its Scope 1 and Scope 2 GHG emissions and serve as a template for decarbonization retrofits throughout the MSA. This plan provides analysis of the potential GHG reductions from a VRF retrofit based on the limited information available about the HVAC operation of City Hall.
STRATEGY
Create electrification policies for large facilities such as convention centers, hotels, and amphitheaters, beginning with the BJCC by 2030. Achieving widespread electrification requires robust, targeted policy support. Electrification-focused policies are critical for setting clear mandates, updating building and zoning codes, requiring electric vehicle (EV) infrastructure, and phasing out gas-powered systems over time. These policies can also provide financial incentives, rebates, and technical assistance to lower the cost and complexity of adoption for these venues. By prioritizing electrification in policy design, facility operators can drive market transformation, ensure access to clean technologies, and accelerate progress toward climate and energy goals.

REPLACE FOSSIL-FUEL-BASED SYSTEMS IN SELECTED MUNICIPAL OWNED BUILDINGS AND OPERATIONS WITH ELECTRIC ALTERNATIVES BY 2031
Transition 50 tools, small engines, and other equipment to electric alternatives by 2031. This is a practical step toward reducing emissions, noise pollution, and fossil fuel dependency in public operations. By electrifying municipal landscaping and maintenance equipment, cities and counties can lead by example while improving air quality and worker safety. To encourage widespread adoption, implementing communityfacing incentives and rebate programs can help residents, small businesses, and contractors replace gas-powered equipment with cleaner electric models. These efforts support local climate goals and promote more sustainable, low-impact practices across neighborhoods.

PROMOTE INDUSTRIAL ELECTRIFICATION IN DUCTILE IRON PIPE MANUFACTURING STARTING IN 2026
MEASURE 1: ELECTRIFICATION AT MUNICIPAL AND
DESCRIPTION
Industrial electrification in ductile iron pipe manufacturing presents several challenges that stem from both technical and economic factors. The process traditionally relies on high-temperature furnaces and energy-intensive casting operations, which are difficult to electrify due to the extreme heat required and the limited availability of large-scale, reliable electric alternatives. Retrofitting existing facilities to support electrification involves high upfront capital costs, complex infrastructure upgrades, and potential disruptions to production. Additionally, the availability and cost of renewable electricity can vary regionally, creating uncertainties in operational expenses.
LEAD: Designated Municipal or Regional Department, e.g., Office of Resilience and Sustainability
SUPPORTING: Local industry partners, economic development agencies
STRATEGY
Secure two (2) MSA pipe melt shops committed to induction conversions (or first-furnace installs) by 2030, with published milestones and quarterly progress dashboards. American Cast Iron Pipe Co., located in the City, has already announced a $285M multi-year induction melt investment replacing its cupola, underscoring regional feasibility and supplier readiness that can be leveraged immediately.

Transitioning the Miller Steam Plant from coal to natural gas poses significant challenges, including the need for costly infrastructure upgrades such as boiler modifications and new gas delivery systems, as well as ensuring a reliable and affordable fuel supply. Regulatory approvals and permitting can be lengthy, while fluctuating natural gas prices create financial uncertainty. Although natural gas reduces emissions compared to coal, methane leakage and legacy coal ash disposal remain environmental concerns. DESCRIPTION
RESPONSIBLE PARTIES
LEAD : The City’s Office of Resilience and Sustainability and Alabama Power
TRANSITION THE MILLER STEAM PLANT AWAY FROM COAL BY 2040
Work with Alabama Power to encourage the full conversion of the Miller Steam Plant’s four power-generating boilerturbine-generator system units to natural gas by 2040. This presents an important opportunity to engage in dialogue about cleaner energy transitions in the region. While natural gas is not a zero-emissions solution, it can serve as a transitional fuel that significantly reduces GHG emissions and air pollutants compared to coal. Initiating conversations around this potential conversion allows local leaders, utilities, and community stakeholders to explore strategies that align with climate goals, improve air quality, and enhance public health, while also considering economic impacts and grid reliability. This collaboration can lay the groundwork for broader energy diversification efforts and demonstrate a shared commitment to advancing a more sustainable energy future for the MSA.
1C.1 (Scenario 2) Hybrid Strategy Scenario
This halfway model envisions decommissioning two of the four existing units at the Miller Steam Plant while replacing the lost generation capacity with renewable energy sources such as solar and wind. By combining partial fossil fuel phase-out with renewable expansion, this approach balances the urgency of emission reductions with the practical needs of maintaining grid stability and economic continuity. It provides a measured transition pathway that allows for workforce adaptation, infrastructure investment, and regional collaboration with Alabama Power. Through this hybrid strategy, stakeholders can accelerate progress toward decarbonization goals while ensuring that local communities and industries remain resilient during the clean energy shift.
ENERGY AND BUILDINGS
TRANSITION THE MILLER STEAM PLANT AWAY FROM COAL BY 2040
In this ambitious scenario, the Miller Steam Plant’s coal-fired generation is either fully replaced with renewable energy sources such as solar, wind, and battery storage systems or considers the integration of nuclear energy solutions by 2040. This transition would position the region as a leader in the Southeast’s clean energy transformation, driving innovation, job creation, and long-term environmental benefits. While technically and economically complex, a full renewable model eliminates direct GHG emissions from power generation and significantly improves local air quality and public health outcomes. Achieving this goal would require substantial investment in grid infrastructure, energy storage capacity, and regional transmission planning, along with policy and regulatory collaboration to ensure reliability. This scenario offers a vision of a fully decarbonized energy system, one that demonstrates what a sustainable and forward-looking energy future could look like for Alabama and the broader region.

American Cast Iron Pipe Company (ACIPCO)
McWane, Inc.
American Steel Pipe (division of ACIPCO)
Favor Steel & Fabricating
The City’s Department of General Services holds clear and authoritative responsibility for overseeing City Hall retrofits. This includes not only managing the planning and execution of structural upgrades and energy efficiency improvements but also controlling the allocation and oversight of project budgets. Their authority allows them to make critical decisions related to design standards, contractor selection, compliance with building codes, and integration of sustainability measures.
Ultimately, the responsibility for implementing climate policies falls to the facility owners and operators. In the case of BJCC, it is owned by the City. These stakeholders are in charge of ensuring that their buildings meet applicable local, state, and federal environmental standards, including energy efficiency requirements, emissions reductions, and reporting obligations. Beyond compliance, many owners and operators choose to proactively adopt voluntary sustainability strategies. Their commitment and actions play a crucial role in advancing broader climate objectives and setting industry benchmarks for environmental leadership in the built environment.
For example, the City’s Public Works Horticulture & Urban Forestry Department leads the utilization of maintenance equipment. This department is authorized to manage internal budgets in line with City Council approval.
The City’s Office of Resilience and Sustainability will take the lead in promoting and advancing this initiative. Tasked with shaping the City’s environmental and climate strategies, the office has been formally empowered to implement this effort under the directive of the Mayor’s Office. This authority enables them to coordinate across city departments, engage with community stakeholders, and partner with local industry leaders to drive meaningful change. With the full support of the Mayor’s Office, the Office of Resilience and Sustainability is positioned to serve as both the strategic driver and the central point of accountability for implementation.

Alabama Power, a subsidiary of Southern Company, owns and operates the Miller Steam Plant, one of the largest coal-fired power plants in the United States. As the plant’s owner and operator, Alabama Power exercises direct authority over all aspects of its operations. This includes making key decisions related to maintenance, capital investments, emissions controls, fuel sourcing, and long-term planning. Their control extends to compliance with federal and state environmental regulations, implementation of new technologies, and the overall strategic direction of the facility. As a result, Alabama Power/Southern Company holds significant influence over both the current performance and future trajectory of the Miller Steam Plant.
Implementation of these measures is projected to begin in 2026, with an estimated minimal duration of four years, depending on funding availability and building access. The timeline below outlines key milestones and actions as shown in Table J

The MSA encompasses seven counties: Jefferson, Shelby, Walker, Blount, St. Clair, Bibb, and Chilton. Anchored by the City, the MSA includes a mix of urban, suburban, and rural communities, with varying landscapes.
Progress on this measure will be evaluated through several key metrics, each of which is designed to be measurable and provide transparent tracking of project implementation:
kWh Reduction; Decrease in electricity used for cooling (baseline vs. post-upgrade)
GHG Emissions Reduction; CO₂e avoided annually from lower energy use
Maintenance Cost Savings; Year-over-year decrease in operational/repair costs
Project Completion Timeline; Milestones met vs. planned implementation schedule
1A.1 City Hall Retrofit.
This electrification measure will reduce the GHG emissions associated with the current fossil fuel combustion used for building heating (Scope 1) and the reduction in electrical generation emissions from the improvement to the building cooling efficiency (Scope 2). The Scope 1 GHG reduction was calculated from the natural gas combustion needed to offset the heating provided by a 100-ton VRF system. The Scope 2 GHG reduction was calculated using the EPA’s Emissions & Generation Resource Integrated Database (eGRID) tool to determine the GHG emissions per kilowatt-hour (kWh) for the site's zip code. The electrical grid in this area depends on coal and natural gas power plants for most of its power. As a result, the reduction in cooling energy will reduce the GHG emissions of the site by 0.956 pounds (lbs.) CO₂e per kWh. The VRF system has an expected lifespan of 25 years with a replacement of the compressors after 10 to 15 years. If implemented in 2030, the GHG reductions will be maintained through 2050 with proper maintenance and component replacements. The costs of maintenance for the proposed system will be similar to the maintenance costs of the existing system, and so are not included in the estimated strategy cost shown in Table L

To estimate emission reductions from electrifying large commercial emitters such as convention centers, large hotels, and event venues, this strategy assumes these facilities represent 10% of the MSA’s total commercial natural gas use. This equates to 840,362 MMBtu annually. End uses of fossil energy are distributed across space heating (60%), water heating (30%), and cooking/process loads (10%), with assumed equipment efficiencies of 0.85, 0.75, and 0.40 respectively. Electrified replacements are modeled using a Coefficient of Performance (COP) of 2.8 for space heating, 2.5 for water heating, and an induction cooking delivery efficiency of 0.85. The resulting electric load is converted from MMBtu to MWh and multiplied by grid emissions factors of 0.483, 0.40, and 0.10 MT CO₂ per MWh for 2025, 2030, and 2050 respectively. Annual reductions are calculated as the difference between baseline fossil emissions and new electricity-based emissions. Propane use and any building envelope or system upgrades that reduce thermal demand are not included in this estimate.
No significant GHG emissions reductions are associated with this strategy.
Replacing the coke-fired cupola furnaces at steel plants with induction furnaces reduces the energy needs of those plants due to the increased thermal efficiency of induction furnaces, transfers the energy source to electricity that can be more easily decarbonized, and eliminates harmful air pollutants from coke combustion. A cupola iron furnace combines coke (refined coal), scrap metals, magnesium, and other aggregates at high temperatures to produce cast iron. Induction furnaces produce 95 percent less direct GHG emissions than cupola furnaces because of their higher thermal efficiency and use of noncarbon energy sources. GHG savings for this measure assumes a life span of a furnace of over 20 years with an annual production rate of 1,700 tons of steel. The analysis was based on prior analysis of this type of furnace replacement done by the Department of Energy (DOE) in support of their Industrial Demonstrations Program.

Scenario 1: Conversion to Natural Gas. In this transitional scenario, all four coalfired generating units at the Miller Steam Plant convert to natural gas by 2040. Using the facility’s reported emission factor of 1,065 lb CO₂/MWh (0.483 t CO₂/MWh) as the baseline, and assuming a post-conversion intensity of 0.372 t CO₂e/MWh, this shift would reduce total electricity-related emissions in the MSA by approximately 2.0 MMT CO₂e per year once fully implemented. The analysis assumes a linear conversion between 2026 and 2040, constant annual generation of 18.06 TWh, and equal output from each of the plant’s four generating units. This approach maintains grid reliability and regional energy self-sufficiency while achieving roughly a 23 percent reduction in power-sector emissions. Although natural gas is not a zero-emission resource, it offers an interim pathway toward deeper decarbonization by displacing coal combustion and facilitating integration of renewable energy over time.
Scenario 2: Partial Decommissioning and Renewable Replacement. This intermediate scenario envisions retiring two of Miller’s four units (50 percent of generating capacity) and replacing their output with renewable sources such as solar, wind, and battery storage systems. The remaining two coal units continue to operate at the reported baseline intensity of 0.483 t CO₂/MWh, while the renewable portion contributes no direct emissions. The resulting mixed output effectively halves the facility’s emissions, yielding an estimated 4.36 million metric tons CO₂e per year reduction at full implementation. A 2026–2040 linear ramp is assumed to reflect phased retirements and renewable buildout. This pathway balances emissions reduction with operational and economic considerations, allowing the local energy grid to diversify the energy mix while maintaining system reliability and managing workforce transitions.
Scenario 3: Full Replacement with Renewable Energy. In the most ambitious scenario, all four coal units at the Miller Steam Plant are retired and replaced entirely with renewable generation and storage capacity by 2040. This transformation eliminates all direct stack emissions from power generation within the MSA, reducing electricity-related emissions by approximately 8.72 million metric tons CO₂e per year at the completion of all projects. The analysis assumes constant demand (18.06 TWh/yr), equal output per unit, and a linear transition between 2026 and 2040. This conversion scenario is attributed to the aggressive scenario.
MEASURE 1: ELECTRIFICATION AT MUNICIPAL AND INDUSTRIAL BUILDINGS
Table K shows the expected GHG reduction in MT CO₂e for 2025, 2030, and 2050. Appendix D outlines the technical documentation supporting GHG measure benefits analysis.
TABLE K: MEASURE 1 QUANTIFIED EMISSION REDUCTIONS AS COMPARED TO BAU EMISSIONS (MT CO₂e)

The cost estimates are indicative only; they are based on preliminary assessments, comparisons with similar programs, and expert input and are meant to provide a rough order of magnitude evaluation as shown in Table L
CATEGORY DESCRIPTION
STRATEGY
1A.1 City Hall Retrofit
STRATEGY
1A.2 Climate Policy
Replace a 100-ton cooling system with VRF; costs based on a 2011 study from the Bonneville Power Association and inflation adjusted. $177,500
The Office of Resilience and Sustainability will partner with BJCC to deliver a concise Climate Policy, a practical framework covering baseline benchmarking, HVAC electrification (heat pumps, advanced controls) and measurement/reporting, with each venue funding its own implementation. The City owns and operates the BJCC: its exhibition hall alone is roughly 220,000 sq ft, with a much larger campus (arena, theaters, meeting rooms). Using typical commercial retrofi t baselines, HVAC & Domestic Hot Water electrification is estimated at ~$12–$21/ sf; for a 200k–400k sq ft center, that implies ~$2.4M–$8.4M in capital costs. Lighting and controls are often already addressed, allowing near-term focus on mechanical systems, controls integration, and commissioning.
$5.8M
STRATEGY
1A.3 Electric Alternatives
Cities and counties should purchase 10 leaf blowers per year for 5 years (50 total) for the Horticulture Department to utilize, at an estimated $400 per blower, excluding any equipment used by contracted vendors. This yields a program cost of $4,000 per year and $20,000 total over five years for city-managed units. Community-facing incentives would be delivered separately through a grant program, so no rebate outlays are included in this equipment budget.
$20,000

1:
Securing the necessary funding to effectively execute the CACAP Toolkit demands a range of funding strategies and avenues. An integral facet of this financial approach is identifying potential external funding sources, particularly for actions that require additional support. Recognizing that certain strategies might surpass the MSA's current resources, tapping into external funding becomes essential. Within this framework, specific funding sources are identified where known as shown in Table M
State Energy Program Alabama Department of Economic and Community Affairs (ADECA)
Residential Heat Pump Program
Rural Energy for America Program
Energy Efficiency and Conservation Block Grants
Community Development Department grants
Green Banks & Clean Energy Financing Support
Supports energy efficiency and electrification upgrades in public and commercial buildings.
Alabama Power Offers a $1,000 rebate for eligible customers who replace gas furnaces with electric heat pumps that meet standards
United States Department of Agriculture (USDA)
U.S. Department of Energy (DOE)
Supports up to 50% grants for energy efficiency and renewable energy projects, including electric HVAC systems
Receive direct allocations to support electrification in public buildings
Municipalities in the MSA
Residential
Agricultural producers and rural small businesses
Municipalities in the MSA
U.S. Department of Housing and Urban Development (HUD)
EPA
Supports projects that integrate EV charging, energy-efficient community facilities, or clean transportation investments
Allocates hundreds of billions through financing intermediaries to enable project-level investment in clean energy, including electrification measures
Municipalities in the MSA
Municipalities in the MSA

MEASURE 2: RENEWABLE
Install 25 MW of new solar PV capacity across residential, commercial, institutional, and municipal sites by 2030 through a coordinated “Solarize the MSA” bulk-purchase initiative. The program will reduce costs through aggregated procurement, target high-visibility sites such as the UAB’s parking structures, integrate solar with rural irrigation systems, and deploy resilient solar at emergency response facilities. DESCRIPTION
RESPONSIBLE PARTIES
LEAD: Alabama Farmers Federation and designated Municipal or Regional Department, e.g., Office of Resilience and Sustainability
SUPPORTING:
UAB, municipal governments, Alabama Cooperative Extension, participating solar installers, and Energy Alabama
MEASURE 2
EXPAND RENEWABLE ENERGY THROUGH A MIX OF SOLAR, WASTE-TO-ENERGY, AND DISTRIBUTED ENERGY INITIATIVES
MEASURE 2A
EXPAND SOLAR GENERATION ACROSS THE MSA THROUGH A REGIONAL BULK-PURCHASE CAMPAIGN, WITH A GOAL OF 25 MEGAWATT (MW) BY 2030.
Launch a "Solarize the MSA" initiative to create a communitydriven crowdfunding campaign that bundles multiple solar projects across the region into a single, large-scale Request for Proposals. By aggregating demand from residents, businesses, and institutions, the program can lower installation costs through bulk purchasing and attract competitive bids from qualified solar providers. This collective approach not only accelerates the adoption of solar energy but also increases access and affordability for participants by leveraging shared financing and outreach. The initiative can serve as a regional model for collaborative clean energy deployment, while helping the MSA meet its renewable energy and emissions reduction goals. Conduct three rounds by 2030.
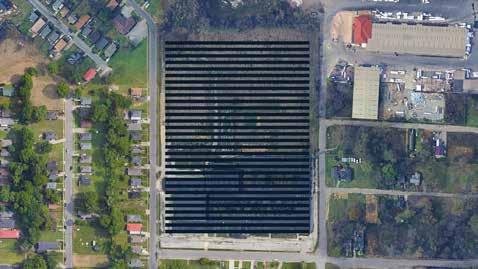
Designate 35th Avenue Superfund site as an opportunity for a renewable energy microgrid for all industry and residential communities in and around the superfund site. The Superfund site covers 11 acres and offers enough space and solar exposure to support a seven (7) MW ground-mounted PV system. The EPA’s Superfund Redevelopment Program has funded and supported similar projects in Massachusetts, Missouri, and New Jersey. To date, the EPA has backed 106 alternative energy projects with a combined installed capacity of approximately 512 MWs.
Figure H shows the layout of a potential PV installation at the 35th Ave Super Fund site. This system would produce 9.88 million kWh per year and offset the midday grid power generation.

Co-Benefits GHG Reductions Cost Effective Community Benefits Land Use Type Urban Suburban Rural
ENERGY AND BUILDINGS
Designate 35th Avenue Superfund site as an opportunity for a renewable energy microgrid for all industry and residential communities in and around the superfund site The Superfund site covers 11 acres and offers enough space and solar exposure to support a seven (7) MW ground-mounted PV system The EPA’s Superfund Redevelopment Program has funded and supported similar projects in Massachusetts, Missouri, and New Jersey To date, the EPA has backed 106 alternative energy projects with a combined installed capacity of approximately 512 MWs.
Figure H shows the layout of a potential PV installation at the 35th Ave Super Fund site This system would produce 9.88 million kWh per year and offset the midday grid power generation
The electric utility, Alabama Power, describes the process for interconnecting large, distributed energy resources in the “Operation of Distributed Energy Resources (DER) in Parallel with the Distribution System Policy.” That policy requires several studies that need to be conducted by the utility prior to interconnection approval:
The electric utility, Alabama Power, describes the process for interconnecting large, distributed energy resources in the “Operation of Distributed Energy Resources (DER) in Parallel with the Distribution System Policy ” That policy requires several studies that need to be conducted by the utility prior to interconnection approval:
Affected System Study - Analysis of other entities that may be affected by interconnection of the DER.
38
Protection System Study - Determines whether DER Interconnection and Parallel Operation would adversely impact coordination or reliability of the utility’s existing protection system(s) and scheme(s).
Distribution System Study - Determines whether DER Interconnection and Parallel Operation will adversely impact ability of the interconnecting distribution circuit to continue to provide reliable and adequate service to existing end-use Customers.
Network Study - Determines the amount of DER that can safely and reliably be added to a Network Secondary Distribution System.
Transmission System Study - Models the DER impact to the transmission system.

MEASURE 2A EXPAND SOLAR GENERATION ACROSS THE MSA THROUGH A REGIONAL BULK-PURCHASE CAMPAIGN, WITH A GOAL OF 25 MEGAWATT (MW) BY 2030.
Establish solar/charging infrastructure to support irrigation in rural regions within the MSA by identifying and working with local farms to transition irrigation systems to renewable energy. The irrigation pumps on small farms generate high electrical power loads and often run during daylight hours to maintain soil moisture levels in the heat of the summer. These loads can be directly off set by solar PV power production. Much of the existing irrigation infrastructure in the region relies on diesel powered pumps. By establishing a procedure and precedent for using solar panels to power irrigation pumps, the Alabama Farmers Federation can decrease the operating costs for small farmers and improve the air quality in the area.
Ideal candidates for solar power will have an irrigation pumping station with 100 to 150 horsepower (hp) of pumping capacity. Crops like corn and soybeans have the highest water demand in the summer when solar resources are most abundant. A 75-kilowatt (kW) ground-mount PV array would off set the daily usage of the pumping station. Table N shows the expected monthly production of a 75-kW PV array.
MEASURE 2: RENEWABLE ENERGY
MEASURE 2A EXPAND SOLAR GENERATION ACROSS THE MSA THROUGH A REGIONAL BULK-PURCHASE CAMPAIGN, WITH A GOAL OF 25 MEGAWATT (MW) BY 2030.
The interconnection process for Alabama Power customers is described in the utility’s “Distributed Energy Resources Technical Interconnection Requirements Guidebook (2025).” A 75-kW PV system is classified as a Tier II DER, which has a simplified interconnection study and does not need a protection system study.
A distribution system study, network study, and transmission system study will be required and can be expedited by designing the system to reduce grid risks. According to the “System Impacts from Interconnection of Distributed Resources (2025)” technical report by the National Renewable Energy Laboratory (NREL), the factors to consider in these studies include:
Steady-state and transient stability analysis
Load/generation coincidence
Incorporation of renewable resource forecasting
Frequency responsive
Voltage and Volt-Ampere Reactive (VAR) regulation
Additional power quality concerns (harmonics, flicker, direct current [DC] injection)
Equipment grounding
Load and generation imbalance
Generation interaction with controllable loads
The risks associated with these factors can be mitigated by identifying appropriate loads to tie to the PV generation and by sizing the associated PV system to match the load. By sizing the PV system to directly offset the usage of the irrigation pumps, the DER will avoid a load and generation imbalance. By targeting farms with summer, day-time irrigation loads, the DER will have coincident load and generation. By using equipment with UL1741SA or UL1741SB certification by a Nationally Recognized Testing Laboratory (NRTL), as required by Alabama Power, the DER will avoid voltage or frequency regulation issues. Any proposed system meeting these specifications will have a strong case for interconnection approval.
*Estimated using the PVWatts tool from NREL

MEASURE 2A EXPAND SOLAR GENERATION ACROSS THE MSA THROUGH A REGIONAL BULK-PURCHASE CAMPAIGN, WITH A GOAL OF 25 MEGAWATT (MW) BY 2030. ENERGY AND BUILDINGS
MEASURE 2: RENEWABLE ENERGY
Support UAB to install a solar powered parking structure on campus. The MSA can pave the way for increased solar adoption in the MSA by identifying large, high-profile energy users that can install PV to demonstrate the ease and costeffectiveness of PV ownership. One of the largest energy users in the region is the UAB Medical Center.
Hospitals have large consistent electrical power loads to meet the rigorous cooling and ventilation needs of medical equipment and patients. The robust electrical infrastructure used to handle these large loads can accommodate DER installations without affecting the stability of the electrical grid. According to NREL, a common interconnection screening threshold is 15 percent of the line section annual peak load for aggregate generation. Below this threshold, no detailed analysis of grid impacts is needed. The UAB Medical Center can install significant PV generation capacity while staying below the 15 percent threshold. This CACAP Toolkit identified two parking lots as potential locations for PV at the UAB Medical Center.

ENERGY AND BUILDINGS
Figure I shows the layout of a potential 280-kW PV installation at the University Blvd Parking Lot. This system would produce 379,278 kWh per year and offset the midday grid power generation, which currently consists of 75 percent coal and natural gas generation.
20TH ST PARKING GARAGE
Figure J shows the layout of a potential 156-kW PV installation at the 20th Street Parking Garage This system would produce 209,075 kWh per year and offset the midday grid power generation, which currently consists of 75 percent coal and natural gas generation.
MEASURE 2A EXPAND SOLAR GENERATION ACROSS THE MSA THROUGH A REGIONAL BULK-PURCHASE CAMPAIGN, WITH A GOAL OF 25 MEGAWATT (MW) BY 2030.
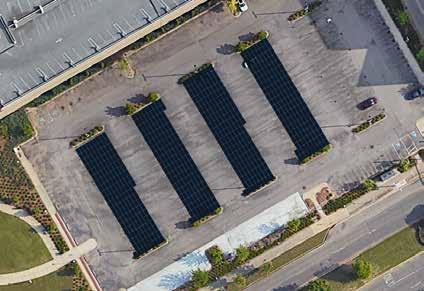


ENERGY AND BUILDINGS
MEASURE 2A EXPAND SOLAR GENERATION ACROSS THE MSA THROUGH A REGIONAL BULK-PURCHASE CAMPAIGN, WITH A GOAL OF 25 MEGAWATT (MW) BY 2030.
Implement a DER program to reduce peak demand. Implement energy management and energy storage systems at municipal locations to charge during low-use periods and release energy during peak demand hours.
The MSA can lead their community toward increased solar PV adoption by installing PV systems on large, publicly facing buildings owned by municipal entities within the MSA. Renewable energy installations developed by municipal entities have a wide range of potential funding sources including the Coalition for Green Capital (CGC), Local Governments for Sustainability, federal grants, and green municipal bonds. The impact of these installations can be magnified with the inclusion of public-facing generation displays that communicate the financial and environmental benefits of distributed renewable energy. Two potential systems were analyzed as a part of this CACAP Toolkit.

ENERGY AND BUILDINGS
CITY HALL
Figure K shows the layout of a potential 100-kW PV installation at Birmingham City Hall. This system would produce 137,159 kWh per year and offset the carbon-intensive midday grid power generation. This measure can provide additional benefits to building electrification as analyzed in strategy 1A.1 of this CACAP Toolkit.
MEASURE 2A EXPAND SOLAR GENERATION ACROSS THE MSA THROUGH A REGIONAL BULK-PURCHASE CAMPAIGN, WITH A GOAL OF 25 MEGAWATT (MW) BY 2030.
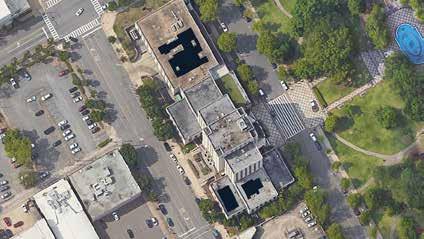
CHARGE EV BUS FLEET AT BIRMINGHAM-JEFF ERSON COUNTY TRANSIT AUTHORITY (BJCTA) CENTRAL STATION
Figure L shows the layout of a potential 260-kW PV installation at the BJCTA Central Station. This system would produce 350,205 kWh per year. This measure can provide additional benefits to fleet electrification as analyzed in Strategy 2A.4 of this CACAP Toolkit.
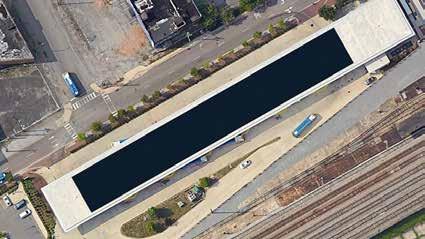

MEASURE 2A
EXPAND SOLAR GENERATION ACROSS THE MSA THROUGH A REGIONAL BULK-PURCHASE CAMPAIGN, WITH A GOAL OF 25 MEGAWATT (MW) BY 2030.
Promote the installation of resilient renewable energy systems at facilities that provide emergency response services to MSA citizens. Provide administrative and regulatory support to pursue grants and utility interconnection.
The South Hampton Elementary School at 565 Sheridan Road in Birmingham currently acts as a tornado shelter for the surrounding community. It can be upgraded to a resilient community emergency center through the following actions:
Expand the school's cooling capacity so it can act as an emergency cooling center.
Create a heatwave response plan to transport community members to the school in the event of a power outage during an extreme heatwave.
Install a 100-kW PV array connected to a 350-kWh battery storage system to provide emergency power for community cooling and food preparation for five days. A potential layout of a canopy PV array in the parking lot is shown in
Figure M
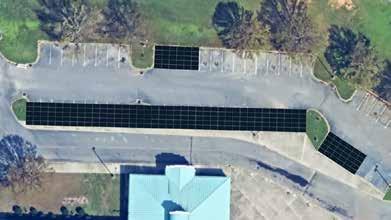
Alabama Power’s monthly solar Capacity Reservation Charge has drawn criticism for discouraging residential solar adoption across the state. The fee, which adds approximately $5 per kilowatt of installed solar capacity (or around $25–$30 per month for a typical home system), is charged on top of standard electricity rates. This makes solar less financially viable for homeowners, undercutting the savings that typically incentivize clean energy investments. The solar Capacity Reservation Charge does not apply to commercial customers, which allows the MSA to target these buildings right away.

EXPAND SOLAR GENERATION ACROSS THE MSA THROUGH A REGIONAL BULK-PURCHASE CAMPAIGN, WITH A GOAL OF 25 MEGAWATT (MW) BY 2030.
Alabama Power’s monthly solar Capacity Reservation Charge has drawn criticism for discouraging residential solar adoption across the state. The fee, which adds approximately $5 per kilowatt of installed solar capacity (or around $25–$30 per month for a typical home system), is charged on top of standard electricity rates. This makes solar less financially viable for homeowners, undercutting the savings that typically incentivize clean energy investments. The solar Capacity Reservation Charge does not apply to commercial customers, which allows the MSA to target these buildings right away.

MEASURE 2: RENEWABLE ENERGY
DESCRIPTION STRATEGY
Capture methane from decomposing waste at two (2) major MSA landfills and convert it to electricity or renewable natural gas.
RESPONSIBLE PARTIES
LEAD: Local landfill operators
SUPPORTING: Alabama Department of Environmental Management (ADEM)
MEASURE 2B
INSTALL LANDFILL GAS-TO-ENERGY SYSTEMS AT TWO (2) REGIONAL LANDFILLS, BY 2040
Establish waste-to-energy systems at two (2) landfills to install advanced landfill gas collection infrastructure to capture methane generated by the anaerobic decomposition of organic waste. This methane, a potent GHG, can be processed and converted into renewable energy through combustion in reciprocating engines or turbines for electricity, or refined into renewable natural gas suitable for pipeline injection or vehicle fuel. These systems typically include extraction wells, moisture and contaminant removal, compression, and gas treatment technologies to meet environmental and energy quality standards. By converting a continuous waste byproduct into a valuable energy source, landfill gas-to-energy systems significantly reduce methane emissions, support decarbonization goals, and enhance energy resilience, all while aligning with federal incentives and emerging clean energy markets.

Cities and counties have the legal authority to implement energy projects at regional landfills because they typically own, operate, or regulate these facilities as part of their solid waste management responsibilities.
The Birmingham Land Bank (Land Bank) and the City can implement a renewable energy project on the 35th Ave. superfund site in partnership with the EPA through a coordinated legal and regulatory framework. The EPA retains authority over site cleanup and must approve any reuse to ensure it doesn't compromise the remediation. Once a site is deemed "ready for reuse," the Land Bank and the City, empowered by local or state law to manage and redevelop properties, can lead the project by securing permits, attracting developers, and overseeing implementation. EPA provides technical guidance, while the local entity executes the project within the bounds of cleanup requirements and institutional controls.
The Alabama Farmers Federation does not hold formal regulatory authority but exercises significant influence through its grassroots membership, policy advocacy, and legislatively authorized programs. The Federation uses a democratic process to develop policy positions, which are adopted by delegates at an annual meeting and guide lobbying efforts at the state and federal levels. The Federation’s ability to “implement” initiatives stems from a combination of member-backed policy action, lobbying success, and explicit legal authorizations, rather than regulatory power. The Alabama Cooperative Extension System has the authority to implement programs in the MSA which empowers it to deliver research-based education through land-grant universities. Covering all seven counties in the MSA, it operates through county offices and regional agents. Backed by federal, state, and local funding, it has the authority to plan and implement initiatives in agriculture, nutrition, youth development, and urban community outreach across both rural and urban areas of the region.

2A.4
UAB derives its authority to implement policies and initiatives through its governance by the UAB’s System Board of Trustees. This Board, established by the Alabama Constitution and state law, holds comprehensive control over UAB’s operations, including academic programs, budgeting, capital planning, and administrative appointments. While the Board sets overarching policies and strategic direction, it delegates day-to-day governance responsibilities to the UAB’s System Chancellor and the President.
2A.5
Alabama Power has the authority to implement distributed energy projects through regulatory oversight by the Alabama Public Service Commission (PSC), which governs investor-owned utilities under state law. The PSC must review and approve any distributed energy initiatives, including pilot programs, rate structures, and customer participation terms. Alabama Power operates these projects and is required to comply with interconnection standards and compensation rules for DER like solar and battery systems.
2A.6
Energy Alabama engages in legal efforts to improve transparency at the Alabama PSC and challenges solar fees that hinder rooftop adoption. Refusing utility funding to maintain its independence, the organization stands out as a bold voice championing sustainable energy policy across the state.
2A.7
Cities and counties have limited authority over Alabama Power’s “Capacity Reservation Charge,” since utility rates are regulated by the PSC under state law. However, local governments can still influence implementation indirectly through zoning, permitting, and building codes related to distributed energy systems like rooftop solar.
2.B.1
The Alabama Department of Environmental Management (ADEM) is responsible for issuing landfill permits, setting operational and environmental standards, conducting inspections, and enforcing both state and federally delegated waste regulations under the Resource Conservation and Recovery Act. While cities manage the day-to-day operations of municipal landfills, they do so under ADEM-issued permits and are required to comply with its regulatory framework. Additionally, local governing bodies, such as city councils or county commissions, have the authority to approve certain landfill permit changes, particularly those involving significant expansions or changes in service area.

MILESTONES
Implementation of this measure is projected to begin in 2026 with an estimated minimal duration of two years, depending on funding availability and building access. The timeline below outlines major tasks and key milestones as shown in Table O
2A.1
Solarize the MSA 2026–2030
2A.2 35th Avenue 2026–2030
2A.3 Rural Regions 2026–2030
2A.4 UAB 2027–2030
Target residential community for rooftop solar; Conduct three rounds by 2030
Conduct audits of local zoning codes to ensure cities and counties are "Solar Ready" ensuring that solar panels are legal in appropriate categories
Utilize brownfield sites within the MSA for solar power generation Ensure the community is engaged throughout the process
Identify and work with local farms to transition irrigation systems to renewable energy using agro voltaics
Identify location as University Blvd Parking Lot/ Garage
Identify location as UAB Hospitals 20th St Parking Garage
Coordinate with MEAN to introduce utility-scale battery storage systems
2A.5 DER Program 2027–2030
2A.6 Emergency Response 2028–2029
2A.7
Capacity Reservation Charge
2B
Budget funds to cover investment costs for purchase and installation of renewable energy and battery storage.
Target City Hall
Target Healthcare industry Charge EV bus fleet during off-peak hours.
Target the Food Bank of Central Alabama
Target Resilient Community Centers at tornado shelters
Consider adopting clean energy zoning ordinances that would require new and/or existing buildings to meet certain clean energy milestones through the use of onsite renewables or clean energy purchasing
Advocate for removal of Alabama Power’s Capacity Reservation Charge
Waste-toEnergy 2027–2040 Target all landfills in the MSA
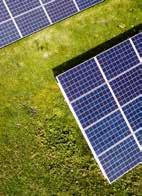
The MSA encompasses seven counties: Jefferson, Shelby, Walker, Blount, St. Clair, Bibb, and Chilton. Anchored by the City, the MSA includes a mix of urban, suburban, and rural communities, with varying landscapes.
Progress on this measure will be evaluated through several key metrics, each of which is designed to be measurable and provide transparent tracking of project implementation:
Number of participants; Solarize the MSA
Number of landfills; Partial or full transition
GHG emissions reduced; avoided
Number of projects; MW added
Solar Capacity Installed: what is the rated capacity in kW (direct current) for the following areas:
• Superfund Redevelopment
• Agricultural
• Medical
• Municipal
• Emergency Services
The renewable energy measures would reduce the GHG emissions associated with the current electrical consumption and the fossil fuels that would be used in generators during an emergency power outage. The project team estimated the performance of PV arrays using the PVWatts tools from the NREL.
The project team estimated the GHG reductions using the EPA’s eGRID tool to determine the GHG emissions per kWh for the site’s zip code. The electrical grid in this area depends on coal and natural gas power plants for most of its power. As a result, solar production will reduce the GHG emissions of the site by 0.956 lbs CO₂e per kWh. PV and battery storage systems have an expected life span of 20 years with energy production degrading by 1 percent per year, after year 10. The systems will need to be rehabbed after 20 years to maintain GHG reductions through 2050. Table P shows the expected GHG reduction in MT CO₂e for 2025, 2030, and 2050.

MEASURE 2: RENEWABLE ENERGY
The quantification of emissions reductions from the installation of landfill gas-to-energy (LFGTE) systems is based on modeled methane generation at one major landfill within the MSA, which currently lacks a gas collection system. According to U.S. EPA reporting protocol (Subpart HH), the landfill generates approximately 10,497 metric tons of methane annually. Methane capture efficiency is assumed to be 75%, consistent with U.S. EPA's Landfill Methane Outreach Program (LMOP) and Subpart HH guidance for well-managed collection systems. Captured methane is assumed to be combusted in an energy recovery system, converting CH₄ to CO₂ and generating electricity that displaces fossil fuel-based power. The GWP of methane is assumed to be 28, based on the IPCC Fifth Assessment Report (AR5). Under these assumptions, direct avoided emissions from methane capture at one landfill are estimated at approximately 220,000 metric tons of CO₂e per year. Additional emissions reductions of approximately 21,500 metric tons CO₂e per year are credited from avoided fossil fuel generation, assuming 35% conversion efficiency and a grid emissions factor of 0.4 MTCO₂e/MWh. Scaling this analysis to two comparable landfills results in a total estimated reduction of approximately 440,000 MTCO₂e per year from direct methane capture, and up to 480,000 MTCO₂e per year when including grid displacement benefits. These estimates reflect both the mitigation of high-GWP fugitive methane emissions and co-benefits from renewable energy generation. Sources include U.S. EPA’s LMOP technical documentation, Subpart HH GHG reporting guidance, and IPCC AR5 GWP values.
TABLE P: MEASURE 2 QUANTIFIED EMISSION REDUCTIONS AS COMPARED TO BAU EMISSIONS (MT CO₂e)

MEASURE 2: RENEWABLE ENERGY
The cost estimates are indicative only; they are based on preliminary assessments, comparisons with similar programs, and expert input and are meant to provide a rough order of magnitude evaluation as shown in Table Q.
CATEGORY DESCRIPTION
STRATEGY
2A.1
Solarize the MSA
2A.2 35th Avenue
2A.3 Rural Regions
This strategy focuses on launching and promoting a three-phase, community-driven solar campaign, “Solarize the MSA”, to encourage residential and commercial solar and battery storage adoption by leveraging bulk pricing and partnerships, such as with Sun Shares. Because cities and counties would not be administering the solar installations directly, its primary role would be promotional and organizational. We assume administrative coordination, event hosting, and webpage development would be absorbed by existing staff responsibilities at no new cost.
The only city and county-incurred costs would be related to public communications: graphic design, website updates, social media promotion, and print materials. These are estimated at approximately $1,000 per campaign phase (Phases I: 2026, II: 2029, totaling $2,000 through 2029. $2,000
Install a 7-MW ground mount PV system. Cost is based on similar projects that have been completed by the EPA for $1.7 per watt of solar capacity. $12,000,000
Install two 75-kW ground mount PV systems. Cost is based on a case study for a 50-kW agricultural PV installation with an installed cost of $3.23/watt in 2023. $485,000
Install carport PV systems at two parking lots at the UAB Medical Center. Cost is based on quotes provided to the City of Athens, Georgia, for city-wide PV projects at $3.1/watt in 2024.
Install rooftop PV systems at City Hall and BJCTA Central Station. Cost is based on quotes provided to the City of Athens, Georgia, for city-wide PV projects at $3.1/watt in 2024. $1,116,000
Install a carport PV system and battery storage system at a city or county emergency shelter. Cost is based on case studies for resilient community centers in Atlanta, Georgia, and Pinole, California. $485,000

Securing the necessary funding to effectively execute the CACAP Toolkit demands a range of funding strategies and avenues. An integral facet of this financial approach is identifying potential external funding sources, particularly for actions that require additional support. Recognizing that certain strategies might surpass the MSA's current resources, tapping into external funding becomes essential. Within this framework, specific funding sources are identified where known as shown in Table R.
A state-authorized financing institution empowered to support energy infrastructure projects by offering flexible, bond-backed funding and equipment procurement
RE-Powering America’s Land Initiative
Energy Efficiency and Conservation Block Grants
Greenhouse Gas Reduction Fund/ Green Banks
Alabama State Energy Program
AlabamaSAVES Revolving Loan Program
State Tax Incentives
PACE (Property Assessed Clean Energy)
EPA Supports renewable energy reuse of contaminated or underutilized lands, including Superfund and brownfield sites. Offers technical assistance, feasibility studies, and links to project case studies and benefits
DOE Funds renewable energy installations on government buildings, landfill methane capture, energy-efficiency upgrades, and clean transportation infrastructure
EPA Includes billions for clean energy projects through green investment institutions, some targeting municipalities
ADECA
Offers grants and technical support for energy efficiency and renewable energy projects statewide, including grants for facilities retrofits or generating systems
ADECA Offers subordinated loans that finance commercial, nonprofit, or industrial renewable projects—either up to 100% of project costs or up to 25%, whichever is lesser
Alabama Offers state solar and geothermal tax credits and other efficiency-based incentives to support project economics
Property owners (where available)
Enables financing renewable installations on commercial and nonprofit properties via property tax liens.
Cities can qualify to access financing provided they meet eligibility criteria specified under the Powering Growth Act
Municipalities within the MSA
Municipalities within the MSA
Municipalities within the MSA
Municipalities within the MSA
Commercial, nonprofit, or industrial
Residential, commercial, industrial, and municipal
Commercial and nonprofit properties
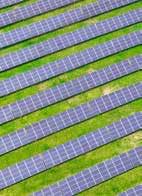
Implement a comprehensive, regionwide program to reduce energy use and GHG emissions in privately owned residential and commercial buildings.
RESPONSIBLE PARTIES
LEAD: Designated Municipal or Regional Department, e.g., Office of Resilience and Sustainability
SUPPORTING: ADECA, Alabama Power, Alabama Cooperative Extension, Chambers of Commerce, local governments, community-based organizations, building industry associations, lenders, and approved contractors.
EXECUTE A REGIONAL ENERGY EFFICIENCY PROGRAM FOR RESIDENTIAL AND COMMERCIAL BUILDINGS BY 2030
Provide low-interest loans and targeted incentives for energy efficiency upgrades such as insulation, air sealing, highefficiency HVAC and water heating, efficient windows and doors, and smart controls. Zero-interest financing would be available for income-qualified households.
Promote programs for electrifying residential and commercial properties and improve energy efficiency through insulation, efficient heating/cooling systems, and energy audits. Collaborate with utilities, state agencies, community-based organizations, trade associations, and financial institutions to expand access to services, leverage incentives, and streamline contractor engagement beginning in 2026. Partnerships will be used to coordinate marketing, training, and quality assurance for both residential and commercial market segments.

EXECUTE A REGIONAL ENERGY EFFICIENCY PROGRAM FOR RESIDENTIAL AND COMMERCIAL BUILDINGS BY 2030
Convert the Birmingham City Hall to LED, starting with a quick lighting audit to baseline fixture counts, hours, and kWh. Specify LED products with occupancy and daylight controls (and networked controls where useful) to lock in savings, quality, and warranties.
Adopt or encourage advanced energy codes for new construction and major renovations beginning in 2026. Offer incentives such as expedited permitting, reduced fees, or public recognition for projects meeting defined highperformance criteria or achieving third-party certifications (e.g., LEED, PHIUS).
By delivering these strategies under one administrative umbrella, the program will create a consistent point of access for property owners, improve market uptake, and generate significant, measurable GHG reductions across the region’s building stock.
3.1
Cities and counties can offer low-interest loans only if state law authorizes it (via constitution, statutes, and the city or county charter) and the loans serve a public purpose. They typically create programs by ordinance or act through a redevelopment/housing/industrial authority, using tools like revolving loan funds, interest-rate buy-downs with banks, or conduit bond proceeds. City Councils of County Commissions must confirm compliance with anti-gift/lendingof-credit limits, debt caps, usury exceptions for public bodies, and grant/Procurement rules.
3.2
Low-Income Home Energy Assistance Program LIHEAP operates under federal authority granted to the U.S. Department of Health and Human Services, which allocates funds to states to support households with energy costs. States administer the program by setting guidelines and distributing funds to local agencies. These local partners have the authority to implement the program by processing applications, providing bill assistance, and delivering crisis energy services. Alabama Power’s “Small Business Solutions” program has the authority to implement services and incentives through approval from the PSC, which regulates all investor-owned utilities in the state. The PSC authorized specific rate riders and incentives that allow Alabama Power to offer deposit refunds, energy audits, and efficiency upgrades to qualifying small businesses. Operating within this regulatory framework, the company delivers these solutions as part of its broader commercial customer service offerings.
3.3
Cities and counties have the authority to implement energy efficiency projects through statedelegated municipal powers, which allow each municipality to manage public buildings, set local codes, and control public spending. Municipalities have the legal ability to enter contracts, adopt ordinances, and allocate budgets for public improvements, including upgrades that reduce energy consumption in facilities, infrastructure, and operations.
3.4
Cities and counties get building-code authority from their state, granted under Dillon’s Rule. Within those limits, a municipality can adopt new construction codes by ordinance, usually by referencing model codes and adding local amendments. If the state sets a minimum statewide code, local municipalities may go stricter (a “reach code”) only if not preempted. Adoption typically includes public notice/hearings, an effective date with grandfathering for pending permits, and enforcement by the building official through plan review, permits, inspections, and certificates of occupancy.

Implementation of this measure is projected to begin in 2026 with an estimated minimal duration of four years depending on funding availability and building access. The timeline below outlines major tasks and key milestones as shown in Table S.
Define eligibility criteria for households Decide on loan terms, interest rates, repayment periods, and maximum loan amounts
Partner with the state to implement similar programs for customers using utility and census data to target energy efficiency efforts at a granular level
Partner with Alabama Power's "Small Business Solutions" program which includes free energy audits for eligible businesses
Assign an owner and define scope (buildings/ areas, timeline, budget)
Establish incentives or streamlined permitting processes for new developments that achieve LEED or PHIUS certification

The MSA encompasses seven counties: Jefferson, Shelby, Walker, Blount, St. Clair, Bibb, and Chilton. Anchored by the City, the MSA includes a mix of urban, suburban, and rural communities, with varying landscapes.
Progress on this measure will be evaluated through several key metrics, each of which is designed to be measurable and provide transparent tracking of project implementation:
Number of zero-interest loans issued; Track through finance office
Number of streamlined permits; Track through permit office
Achieve 100% LED lighting; Complete
Number of website impressions; Specific to one-stop-shop page
Table T shows the total quantified emission reductions as compared to BAU emissions for this measure.
Residential Energy Efficiency Loan Program.
GHG emission reductions associated with this strategy were quantified by estimating the impact of energy efficiency retrofits implemented through a low-interest loan program for residential households, with zero-interest options available to eligible participants. It was assumed that 2% of residential households within the MSA would undertake retrofits resulting in an average 20% reduction in energy consumption across both electricity and direct fossil fuel use. These savings were applied to the residential sector’s total baseline emissions of 3.69 MT CO₂e, derived from electricity, natural gas, LPG11, and fuel oil consumption. Emission reductions from electricity savings were calculated using the MSA’s reported grid emission factor of 1,065 lbs CO₂ per MWh, equivalent to 0.0004833 MT CO₂e per kWh. This analysis yielded an estimated annual reduction of 73,805 MT CO₂e.
11 LPG (Liquefied Petroleum Gas): A fuel made up mainly of propane and butane, produced during natural gas processing and oil refining. It is commonly used for heating, cooking, and vehicles.

3.2
Electrification and Building Envelope Improvements.
This strategy includes two complementary actions: partial electrification of building heating systems and improvements to building envelopes that enhance overall energy performance. For the purposes of quantification, it was assumed that 1% of residential and commercial buildings within the MSA would convert from fossil fuel-based space heating (natural gas, propane, and distillate fuel oil) to electric alternatives. In addition, it was assumed that a separate 1% reduction in electricity consumption would be achieved across both sectors through targeted measures such as insulation upgrades, air sealing, and HVAC improvements. Baseline energy use data for the two sectors, comprising over 12 billion kWh of electricity and more than 19 million MMBtu of fossil fuel energy annually, was used to calculate the resulting reductions. Emission reductions were calculated using the same grid factor described above. The combined impact of these actions is estimated to result in an annual GHG reduction of approximately 70,339 MT CO₂e.
Completion of LED Lighting Retrofit at City Hall.
The quantification of GHG emission reductions for this strategy was based on the full conversion of lighting systems at Birmingham City Hall to high-efficiency LED fixtures. City Hall was assumed to comprise 300,000 square feet of floor area. A conservative energy savings estimate of 2.2 kWh per square foot per year was applied based on standard lighting energy benchmarks for municipal buildings undergoing LED retrofits. This equates to an annual electricity savings of 660,000 kWh. Applying the grid emissions factor, the resulting GHG emission reduction from this measure is estimated to be approximately 319 MT CO₂e per year.
Adoption of Enhanced Energy Efficiency Codes for New Construction. Emission reductions associated with this strategy were estimated by evaluating the energy savings potential from new buildings constructed in accordance with enhanced energy efficiency codes or green building standards. It was assumed that 5 million square feet of new residential and commercial floor area will be constructed within the MSA between the present and 2030. These buildings were assumed to exceed baseline energy code requirements by 30 percent, resulting in annual energy savings of 1.8 kWh per square foot. The total projected electricity savings of 9 million kWh per year was converted to avoided emissions using the grid emission factor. This results in an estimated annual reduction of approximately 4,350 MT CO₂e.
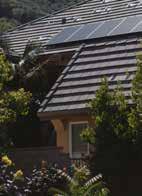
MEASURE 3: ENERGY EFFICIENCY
TABLE T: MEASURE 3 QUANTIFIED EMISSION REDUCTIONS AS COMPARED TO BAU EMISSIONS (MT CO₂e)
MEASURE COSTS
The cost estimates are indicative only; they are based on preliminary assessments, comparisons with similar programs, and expert input and are meant to provide a rough order of magnitude evaluation as shown in Table U.
TABLE U: MEASURE 3 COSTS
CATEGORY DESCRIPTION
STRATEGY 3.1 Energy Efficiency Loan and Incentive Program
The participating municipality can set this up through the finance department. It would take staff time to design the program, establish interest rate, and promote through proper channels
STRATEGY 3.2 Partnerships for Program Delivery It would take staff time to build out promotional materials and upload them through proper communication channels. $0
STRATEGY 3.3 LED Lighting
STRATEGY 3.4
High-Performance Building Codes and Incentives
Using a planning range of $5–$9 per sq ft, and assuming City Hall is about 300,000 sq ft with roughly 75% already complete, the remaining 75,000 sq ft of LED retrofit work would total $375,000–$675,000. For budgeting, applying a low-mid value of $7/sq ft yields an estimate of $525,000 for the outstanding scope. This figure reflects fixtures, controls, and installation, and excludes design/engineering, after-hours premiums, and unforeseen conditions. $525,000
This would require staff time to write the code and bring it to the City Council or County Commission for approval. $0
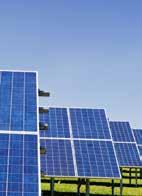
Securing the necessary funding to effectively execute the CACAP Toolkit demands a range of funding strategies and avenues. An integral facet of this financial approach is identifying potential external funding sources, particularly for actions that require additional support. Recognizing that certain strategies might surpass the MSA's current resources, tapping into external funding becomes essential. Within this framework, specific funding sources are identified where known as shown in Table V.
Energy Efficiency & Conservation Block Grant
State Energy Program
ADECA
SAVES Revolving Loan Program & Local Energy Loan Programs
Alabama Weatherization Assistance Program
Utility-Sponsored Rebates
Offers competitive funding to implement projects like energy audits, building retrofits, street lighting upgrades, and clean transportation improvements
ADECA Administers funds from the U.S. Department of Energy to support energyefficiency retrofits, such as modernizing HVAC or lighting systems in municipal buildings
Alabama Offers revolving loans enabling both retrofit projects and energy-efficient equipment upgrades
ADECA Targets households for energy efficiency upgrades like insulation and HVAC improvements
Alabama Power
Offers tools like home energy reports, checkup tools, and “Smart Financing” for home energy upgrades such as weatherization, HVAC, and generators
Municipalities within the MSA
Municipalities within the MSA
Municipalities within the MSA
Municipalities within the MSA
Residential

Transportation and land use form a feedback loop: development patterns determine travel demand, and transportation networks shape subsequent development. High-capacity transit and walkable street design support compact, mixed-use districts that shorten trips, cut emissions, and improve access to jobs and services, while wide roads, large setbacks, and abundant parking drive outward growth and car dependence. Effective policy aligns the two such as zoning for higher densities and mixed uses near frequent transit, reducing or removing parking minimums, adopting complete streets, and adding safe bike/pedestrian first–last mile connections, so public and private investments reinforce each other. Initiatives are strengthened by coupling these moves with affordable housing, small-business space, and community-led planning in station areas and corridors.

INCORPORATE SMART GROWTH PRINCIPLES INTO ZONING CODES AND FUTURE LAND USE PLANNING IN FIVE (5) MUNICIPALITIES BY 2030
MEASURE 4: ELECTRIFICATION AT MUNICIPAL AND INDUSTRIAL
Implement a regional program to update zoning codes and redevelopment policies to increase housing density, promote mixed-use neighborhoods, and revitalize underused parcels in existing urban areas. The program will focus on enabling a defined number of zoning code amendments in participating cities and counties, incorporating Smart Growth principles to improve walkability, reduce sprawl, and lower GHG emissions from transportation. The program will partner with land bank authorities to acquire, clear, and redevelop a targeted number of vacant or tax-delinquent parcels into affordable housing and community-serving uses. By concentrating growth in areas with existing infrastructure and transit access, the program will reduce infrastructure costs, improve housing affordability, and support long-term emissions reductions.
LEAD : MSA, Municipal planning departments and planning commissions
SUPPORTING:
Land bank authorities, ADECA, community-based organizations, regional planning agencies
Promote increased walkability and compact, mixed-use development around existing urban centers to reduce car dependency, lower GHG emissions, and support local economic vitality. Encouraging higher density development in appropriate areas also allows for more efficient infrastructure investments and enhanced access to transit, jobs, and services. At the same time, preserving open space for agricultural uses, natural conservation, and recreation helps maintain the region’s ecological integrity, supports local food systems, and provides residents with critical opportunities for outdoor activity and climate resilience. Integrating these Smart Growth strategies ensures that growth is balanced and aligned with long-term environmental and community well-being.

IMPLEMENTATION OF AUTHORITY AND RESPONSIBILITIES
Local planning commissions and planning departments play a critical advisory role by making recommendations to individual City Councils on land use, zoning, and development decisions. These bodies are responsible for reviewing upcoming considerations around zoning changes, proposed developments, and infrastructure plans to ensure they align with the community’s goals and regulations. As cities and counties update their comprehensive land use plans, these planning entities should encourage zoning policies that incorporate smart growth principles. By integrating these strategies into future land use plans and zoning ordinances, local governments can guide growth in a way that supports economic vitality, reduces sprawl, and promotes resilient communities.
The Land Bank derives its legal authority from the Alabama Land Bank Act. Under that statute, the Land Bank is empowered to acquire tax- delinquent and underutilized properties, clear titles, and transfer or dispose of land in a manner that serves the public interest, with provisions for quiet title actions, extinguishment of liens, and strategic redevelopment.
Implementation of this measure is projected to begin in 2026, with an estimated minimal duration of four years, depending on funding availability and building access. The timeline below outlines major tasks and key milestones as shown in Table W.
TABLE W: MEASURE 4 IMPLEMENTATION TIMELINE AND MILESTONES
Modify and amend zoning codes to allow for more attainable housing types such as duplexes, townhomes, and cottage courts to increase density and walkability near town centers, parks, and key destinations
Adapt zoning codes to allow for conservation subdivisions in rural areas to create more walkable communities while preserving forest and agricultural lands
Revise zoning ordinances to encourage mixed-use developments in blighted areas, promoting a blend of residential, commercial, and recreational spaces

MEASURE 4: ELECTRIFICATION AT MUNICIPAL AND INDUSTRIAL
The MSA encompasses seven counties: Jefferson, Shelby, Walker, Blount, St. Clair, Bibb, and Chilton. Anchored by the City, the MSA includes a mix of urban, suburban, and rural communities, with varying landscapes.
Progress on this measure will be evaluated through several key metrics, each of which is designed to be measurable and provide transparent tracking of project implementation:
Total Square Footage Developed: Residential, commercial, industrial, or mixed-use
Vacancy or Infill Rate: Share of development occurring on previously unused or underused land
Parcel Redevelopment Rate: Percentage of blighted or vacant parcels improved
Land Bank Acquisitions: Number of parcels purchased each year
Table X shows the total quantified emission reductions as compared to BAU emissions for this measure.
Promote Increased Walkability and Compact, Mixed-Use Development. This strategy reduces transportation emissions by encouraging compact, mixed-use, walkable development patterns around existing urban centers in five municipalities of the MSA. Land use reform and Smart Growth zoning reduce car dependency by shortening trip lengths and increasing mode share for walking, biking, and transit. Based on research from Smart Growth America, the Federal Highway Administration, and meta-analyses of land use elasticities by Ewing & Cervero, compact development is associated with long-term reductions of 5–12% in household VMT relative to conventional suburban growth. For the MSA, a moderate adoption scenario is assumed, with land use changes resulting in a 3% reduction in on-road VMT by 2030 and an 8% reduction by 2050. These percentages were applied to the baseline onroad transportation emissions. The result is an estimated annual reduction of 199,146 MTCO₂e by 2030 and 531,057 MTCO₂e by 2050.

MEASURE COSTS
The cost estimates are indicative only; they are based on preliminary assessments, comparisons with similar programs, and expert input and are meant to provide a rough order of magnitude evaluation as shown in Table Y.

TRANSPORTATION
Securing the necessary funding to effectively execute the CACAP Toolkit demands a range of funding strategies and avenues. An integral facet of this financial approach is identifying potential external funding sources, particularly for actions that require additional support. Recognizing that certain strategies might surpass the MSA's current resources, tapping into external funding becomes essential. Within this framework, specific funding sources are identified where known as shown in Table Z.
PROGRAM
Community Development Block Grants
ADECA Comprehensive land use planning
Updates to zoning ordinances and subdivision regulations Infrastructure mapping and development forecasting
Municipalities within the MSA
Smart Growth Grants
Reconnecting Communities & Neighborhood Access Grants
Land and Water Conservation Fund
Area Development Program
EPA
Helps communities plan and implement smart growth strategies that foster vibrant, walkable neighborhoods while protecting the environment and public health
DOT Supports planning and capital projects with regional or local significance; Complete Streets, transit hubs, bike/ped infrastructure, freight
ADECA Supports land acquisition, open space protection, and the development of outdoor recreational facilities
ARC Appalachian Regional Commission (ARC)
Appalachian Regional Initiative for Stronger Economies
Eligible activities encompass land use planning, downtown revitalization, and infrastructure improvements
ARC Planning grants up to $500,000 are available for initiatives that may include land use planning components, especially those that foster collaboration across state lines
Municipalities within the MSA
Municipalities within the MSA
Municipalities within the MSA
Municipalities of the MSA that fall within the ARC’s region
Municipalities of the MSA that fall within the ARC’s region

TRANSPORTATION
PROGRAM AGENCY PURPOSE
READY Grants to Grow
Investments Supporting Partnerships in Recovery Ecosystems
Flex-E grant program
ARC Provides $9 million in total funding, with grants ranging from $100,000 to $500,000 for implementation projects, and up to $100,000 for planning projects
ARC Provides planning grants up to $50,000 for asset-based development planning and activities that intersect with land use planning
ARC Supports projects in planning and implementation stages, emphasizing community or organizational capacity such as needs assessments, strategic planning, leadership development, and coalition-building
ELIGIBLE USES
Municipalities of the MSA that fall within the ARC’s region
Municipalities of the MSA that fall within the ARC’s region
Municipalities of the MSA that fall within the ARC’s region
Building Communities Program
Federal Transit Authority "Areas of Persistent Poverty"
RPCGB Supports comprehensive plans, corridor studies, zoning/ form-based code updates, and integration of land use with transportation
RPCGB Provided $495,000 to support transit and land-use planning in the MSA
Surface Transportation Block Grant Metropolitan Planning Organizations (MPO)
Allocates to a variety of regional priorities—including land-use integration, bicycle/pedestrian infrastructure, and transit-supportive development—through sub-allocated shares.
Flex-E grants are reimbursement-based and require a 20% local match, with activities expected to be completed—often within about six months
Planning, engineering, and capital projects
Eligible projects must align with goals in the MPO’s Long Range Transportation Plan

The MSA will focus on a transportation decarbonization strategy focused on expanding EV adoption through targeted municipal, business, community, and partnership initiatives. The MSA can consider transitioning its fleet to electric models, guided by cost-benefit analyses that weigh lifetime fuel and maintenance savings against upfront costs. To support broader adoption, the MSA will leverage incentives and cost-sharing to lower installation barriers, particularly benefiting residents without home charging access. Promoting rebate programs will encourage home charger installation and off-peak charging, reducing both costs and grid strain. Partnerships, such as UAB’s plan to fully electrify its bus fleet and install a solar array for on-site charging, further demonstrate regional leadership in clean transportation. Together, these efforts reduce GHG emissions, lower operational costs, and build EV infrastructure.
LEAD : Municipal facility departments, planning commissions and UAB’s Director of Transportation
SUPPORTING:
Designated Municipal or Regional Department
Set a goal of net zero for 100% passenger vehicles and a 50% reduction in emissions for heavier vehicles (Fire, EMS, Public Works) by 2035. A strategic, data-driven approach is essential to maximize the return on investment in EV adoption. For municipal and fleet operations, a cost-benefit analysis can identify which vehicles are most costeffective to replace with electric models. This analysis should consider factors such as fuel and electricity costs over the vehicle’s lifetime, capital investment requirements, maintenance savings, vehicle range and performance, and available government incentives. While EVs tend to have higher upfront costs, studies consistently show that their total cost of ownership is often lower than that of internal combustion engine vehicles after several years of use, primarily due to lower fuel and maintenance costs.
5.2
Expand 75 Level 2 EV charging stations to employers by 2035. The focus is on businesses with substantial parking capacity, such as corporate campuses, office parks, and industrial facilities, where large volumes of commuter traffic present the highest opportunity for GHG emissions reduction. The program would be supported through an incentive-based funding model, including cost-sharing mechanisms, grants, or tax credits to offset installation and equipment costs for participating employers. By lowering the financial barrier to entry, the program enables businesses to become active partners in advancing transportation decarbonization. Widespread EV adoption depends on the availability of convenient, reliable, and accessible charging infrastructure. Workplace charging plays a critical role, especially for residents of multifamily housing who may not have access to home charging options. By providing daytime charging at employer locations, this strategy helps address key adoption barriers such as range anxiety and charging access.
5.3
Promote Alabama Power's EV Home Charger Rebate program to educate customers on reduced rates for off-peak charging. By incentivizing the installation of Level 2 home chargers and encouraging participation in time-of-use rate plans, the program not only reduces upfront costs for EV owners but also shifts energy demand to off-peak hours, when electricity generation is typically cleaner and more efficient. Educating customers about this rebate and the associated lower rates for overnight charging can drive broader EV adoption and reduce strain on the electric grid during peak times. As more drivers take advantage of these incentives, the result is a decrease in gasoline consumption and a reduction in transportation-related emissions.
Electrify UAB’s Blazer Express bus fleet by 2035. To support this transition, the university will explore constructing a 94kW solar array on a campus parking deck to provide clean, onsite energy for EV charging. Additionally, a phase-out plan to replace fossil fuel-powered buses with electric alternatives will be incorporated into the 2027 Blazer Fleet’s Service Agreement. These efforts demonstrate UAB’s commitment to sustainable campus transportation and cross-sector climate leadership. STRATEGY

IMPLEMENTATION OF AUTHORITY AND RESPONSIBILITIES ADDITIONAL APPROVALS AND JURISDICTIONAL CONSIDERATIONS
Specific to the MSA’s transition to EVs, fleet managers in each city and county should develop their own version of a Fleet Electrification Plan. As an example, the City’s Equipment Management Department oversees the operations of the City's fleet management. This department is responsible for maintaining a fleet of over 2,300 vehicles, including police cars, fire trucks, ambulances, and public works vehicles. The department also manages an automated fuel system and has been recognized for its commitment to sustainability, operating over 25 EVs and more than 50 hybrid vehicles.
5.2
Cities and counties across the MSA could implement an incentive-based funding model for employers, using the right partners. Generally, municipalities do not have authority to provide a direct thing of value to individuals. If municipalities were partnered with a community-based organization, the organization could administer the funds, or even directly install the infrastructure.
5.3
Cities and counties across the MSA could expand outreach materials to promote these rebates.
5.4
UAB can play a pivotal role in transitioning a portion of its fleet to all-EVs by leveraging its contractual relationship. One effective approach is to incorporate specific language into future service agreements that outline sustainability goals or mandate a phased transition to zeroemission vehicles. UABs contract bus fleet contract is set to expire on December 31, 2025.
In cases where GHG reduction measures affect properties or entities outside direct MSA control, the following additional steps may be required:
Privately Owned Properties: Where applicable, cities and counties will seek written permission from individual property owners prior to implementing measures such as EV charging infrastructure.
Utility Interconnection and Code Compliance: For grid-connected projects, cities and counties will coordinate with utility providers to secure interconnection approval. All infrastructure development will also comply with applicable building and electrical codes, including local and state requirements when relevant.

IMPLEMENTATION TIMELINES AND MILESTONES
Implementation of this measure is projected to begin in 2026, with an estimated minimal duration of nine years, depending on funding availability and building access. The timeline below outlines major tasks and key milestones as shown in Table A1.
Develop a municipal Fleet Electrification Plan that identifies vehicle replacement schedules, charging infrastructure needs and deployment timeframes and phasing, and estimated capital and operating costs (Consider excluding police vehicles)
5.1
Prioritize the replacement of vehicles that are already at or well beyond their reasonable service life of 7 to 8 years and have been in service for over 10 years
Redistribute cost savings from reduced EV maintenance and maintenance facility to subsidize future GHG emission reduction projects
Identify participating employers (largest being UAB, Alabama Power, and the City)
Ensure each city and county within the MSA has a publicly available charger
Partner with Alabama Power. Alabama Partners for Clean Air, and Clean Fuels Coalition to co-author grants and to distribute funds and manage installations
Promote through ongoing outreach programs such as Commute Smart
Partner with UAB to explore the feasibility of constructing a 94kW solar array for a parking deck on UAB’s campus
Include a phase out plan to transition buses to all electric as part of the 2027 Service Agreement

This measure could be implemented anywhere a reasonably large employer site is located in the MSA. For instance, the largest employers are UAB, Alabama Power, and the City.
Progress on this measure will be evaluated through several key metrics, each of which is designed to be measurable and provide transparent tracking of project implementation:
Total kWh Delivered; Cumulative energy dispensed over a given period
Number of Participating Employers; Count of distinct employers enrolled and active in the program during the period.
Number of Chargers Deployed; Total installed and operational chargers under the program
Number of EVs purchased; Number of eligible EVs purchased or leased by participating municipality
Table B1 shows the total quantified emission reductions as compared to BAU emissions for this measure.
Transition Municipal Fleet to Electric Vehicles.
This strategy supports the phased electrification of the municipal fleet, targeting the replacement of 90% of cars, 50% of light trucks, and 10% of vans with battery-EVs by 2035. The associated emission reduction is based on an estimate from the PCAP, which identifies a net annual reduction of 1,025 MTCO₂e beginning in 2025. This estimate reflects the difference between avoided tailpipe emissions from Internal Combustion Engine (ICE) vehicles and the additional emissions from electricity consumption, assuming Alabama’s average grid emission factor of 0.483 MTCO₂e per MWh. The estimate is applied as a constant annual reduction through 2050. As local fleet composition and grid emissions evolve, the reduction potential should be revisited to reflect updated conditions.
MEASURE 5: FLEET
This strategy estimates the emissions benefits associated with the installation of 75 workplace charging stations across the MSA by 2035, assuming an average of two L2 charging ports per station. Annual electricity consumption is conservatively estimated at 4 MWh per port, resulting in a total of 600 MWh per year. Based on an average EV energy intensity of 0.30 kWh/mi, this infrastructure would enable approximately 2 million electric vehicle miles traveled (eVMT) annually. These miles are assumed to displace gasoline vehicle travel at 25 mpg. Tailpipe emissions avoided are calculated using the U.S. EPA emission factor of 8.887 kg CO₂ per gallon of gasoline, resulting in 711 MTCO₂e avoided per year. Power-sector emissions from EV charging are estimated at 290 MTCO₂e per year, resulting in a net annual reduction of 421 MTCO₂e by 2035. Emission reductions are assumed to scale linearly from 2026 through 2035, after which they remain constant.
This strategy quantifies the emissions reductions associated with increased residential EV adoption resulting from promotion of Alabama Power’s EV home charger rebate program. The analysis assumes this initiative increases EV adoption by 0.3% of total lightduty vehicle (LDV) gasoline VMT within the MSA by 2035. Applying this to the regional baseline of approximately 14.84 billion VMT per year, this equates to 44.5 million electric miles. The displaced gasoline usage is estimated at 1.78 million gallons per year, and associated tailpipe emissions avoided total 15,830 MTCO₂e per year. Additional electricity consumption is estimated at 13,359 MWh per year, which results in 6,453 MTCO₂e of added power-sector emissions, based on the same 0.483 t/MWh factor. The resulting net annual reduction is 9,376 MTCO₂e by 2035. This estimate assumes a linear ramp-up in adoption from 2026 through 2035, after which reductions remain constant. The overall emissions benefit is sensitive to grid decarbonization and the level of adoption lift achieved.

5.4
Electrify UAB Blazer Express Shuttle Fleet. This strategy evaluates the emissions reduction potential of replacing 14 diesel-powered Blazer Express buses operated by the UAB with electric buses by 2035. Annual mileage per bus is assumed to be 35,000 miles, and baseline fuel economy is estimated at 4 mpg. Battery-electric buses are assumed to operate at an average energy intensity of 2.0 kWh/ mi. Under these parameters, electrification displaces approximately 122,500 gallons of diesel per year, avoiding 1,251 MTCO₂e of tailpipe emissions based on a diesel emission factor of 10.21 kg CO₂ per gallon. Charging the electric fleet is estimated to require 980 MWh per year, resulting in 473 MTCO₂e of added emissions. The net annual reduction is 777 MTCO₂e by 2035. The estimate assumes a linear phase-in from 2026 through 2035, with full reductions realized thereafter. As vehicle performance and grid emissions evolve, this analysis should be updated to reflect actual operating data.
TABLE B1. MEASURE 5 QUANTIFIED EMISSION REDUCTIONS AS COMPARED TO BAU EMISSIONS (MT CO₂e)
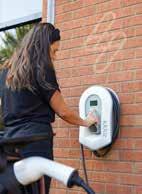
MEASURE 5: FLEET ELECTRIFICATION
The cost estimates are indicative only; they are based on preliminary assessments, comparisons with similar programs, and expert input and are meant to provide a rough order of magnitude evaluation as shown in Table C1.
As an example, the City has approximately 900 light-duty cars in its fleet; 25 are already electric, leaving 875 to replace with EVs. At an average cost of $55,544 per vehicle, the remaining transition totals about $48,601,000 between now and 2035, roughly $4.86 million per year. This estimate excludes the EV charging infrastructure needed at the Public Works Yard. Because the City already plans for vehicle replacements on a 10-year life cycle, much of this expense is effectively part of normal fleet turnover; the key focus should be on timing, cash flow, and any incremental costs or savings versus conventional replacements. $48,601,000
Total range is $750 to $2,600 for infrastructure and installation. Avg: $1,675. Participating counties can leverage regional grants for this, however, for the sake of budgeting, we have added as if grants are not successful
Research from ChargePoint, Heliox, and Siemens catalogs; Battery-electric transit bus (35–40 ft): $0.95M–$1.2M each x 14 buses = $14M Depot charging hardware (150–180 kW dispensers) + install: $120k–$200k per bus; $150,000 * 14 buses = $16,100,000

MEASURE 5: FLEET
Securing the necessary funding to effectively execute the CACAP Toolkit demands a range of funding strategies and avenues. An integral facet of this financial approach is identifying potential external funding sources, particularly for actions that require additional support. Recognizing that certain strategies might surpass the MSA's current resources, tapping into external funding becomes essential. Within this framework, specific funding sources are identified where known as shown in Table D1.
PROGRAM
Active Transportation Infrastructure Investment Program
MAX Transit maintenance grants
Transportation Alternatives Program
EV Charging Infrastructure Program
DOT Aims to integrate various modes of transportation, including pedestrian and bicycle infrastructure, to create a more connected and accessible urban environment.
BJCTA Provides $800 –$1,200/year per car
Municipalities within the MSA
Volkswagen Environmental Mitigation Trust
DOT Offers an 80/20 funding match, covering up to 80% of eligible project costs, with a maximum federal contribution of $800,000 per project
ADECA Provides grants for the installation of EV charging stations, particularly in areas not covered by the federal National Electric Vehicle Infrastructure (NEVI) program. This includes support for Level 2 and DC fast chargers, which are essential for fleet operations
ADECA Available for replacing qualified medium- and heavy-duty diesel vehicles with new diesel or alternative fuel vehicles, including EVs
Municipalities within the MSA
Municipalities within the MSA
Municipalities within the MSA
Municipalities within the MSA

TRANSPORTATION
MEASURE 5: FLEET ELECTRIFICATION
PROGRAM AGENCY PURPOSE
Alabama Power's Make Ready Program
Low or No Emission Vehicle Program
Alabama Power
Offers rebates through its Make Ready Program to support the electrical infrastructure required for EV charging at commercial and fleet facilities
ELIGIBLE
Municipalities within the MSA
EV Funding Finder tool
Federal Transit Administration (FTA)
Joint Office of Energy and Transportation
Provides funding to state and local governmental authorities for the purchase or lease of zeroemission and low-emission transit buses, including the acquisition, construction, and leasing of required supporting facilities
Helps identify federal funding programs, including grants, loans, and tax incentives, suitable for various fleet electrification projects
Municipalities within the MSA
Municipalities within the MSA

Over the past five years, the MSA has made significant progress in expanding alternative transportation options, adding approximately 160 miles of trails and on-road bicycle infrastructure. However, despite these advancements, conventional bicycle use across the region remains challenging. The area’s hilly terrain makes many destinations difficult to reach by bike, while the rural character of outlying communities presents logistical hurdles for long-distance travel. Electric bicycles (E-Bike) offer a promising solution to these barriers, helping to reduce travel times and make cycling more accessible by easing the strain of elevation changes and extended distances.
As part of the PCAP submitted in March 2024, the City worked with a local non-profit partner to launch an E-Bike Voucher program to aid residents in purchasing an E-Bike. To date, the initiative has distributed 75 E-Bike vouchers in partnership with the Birmingham Housing Authority. The program uses a limited-time lottery application system, managed by a third-party consultant, to promote access. This approach helps ensure that residents are not disadvantaged by factors such as internet connectivity or work schedules when applying.
LEAD :
Designated Municipal or Regional Department, e.g., Office of Resilience and Sustainability
SUPPORTING:
Regional Planning Commission of Greater Birmingham (RPCGB), Freshwater Land Trust, Alabama Clean Fuels Coalition, and local housing authorities
To ensure that E-Bikes sold under the voucher program are safe and properly assembled, the use of Vouchers to local participating bicycle retailers restricts the purchase of E-Bikes from online vendors. To stimulate the local economy, vouchers will be limited to bike shops operating within the MSA. For example, Redemptive Cycles, a non-profit community-oriented bike shop and the only bike shop currently within the city limits, accepts vouchers on behalf of the City. This will also ensure that repairs and replacement parts are easier for voucher recipients to acquire. Cities and counties should limit the selection of E-Bike types to those which could feasibly serve commuting and alternative transportation purposes by restricting the purchase of full-suspension E-Mountain Bikes or drop-bar road racing style E-Road Bikes. This successful program can be replicated throughout the MSA, and specific county-related partners can be developed to further disseminate this network of E-Bikes.

DISTRIBUTE 75 E-BIKE VOUCHERS TO RESIDENTS ANNUALLY
MEASURE 6: ELECTRIC BIKE (E-BIKE) VOUCHERS
Building on the success of the initial E-Bike Voucher Program, which has already distributed 75 E-bikes to community members, cities and counties should work to expand the initiative to distribute 75 E-Bike vouchers annually moving forward. This expansion will be guided in partnership with city and county Housing Authorities and other potential partners to ensure that the vouchers are distributed to residents who stand to benefit most, particularly those in communities with limited access to affordable transportation. The program supports broader goals related to climate action and public health. The increased distribution of E-Bikes will empower more residents to adopt sustainable, low-emission travel options, reduce transportation costs, and improve connectivity within and across neighborhoods.

Implementation of this measure is projected to begin in 2026 with an estimated minimal duration of 5 years, depending on funding availability and building access. The timeline below outlines major tasks and key milestones as shown in Table E1.
While cities and counties typically lack the authority to offer direct financial incentives or items of value to individuals, collaboration with community-based organizations presents a viable solution. These organizations could serve as intermediaries to administer funds on behalf of the city or county or even directly implement infrastructure projects. This approach would allow municipalities to support workforce-related initiatives and infrastructure improvements in compliance with legal constraints, while amplifying community impact through trusted local partners.
An expanded E-Bike initiative in the MSA would be most effectively led through a collaborative partnership between the cities and counties and regional partners such as the Regional Planning Commission for Greater Birmingham (RPCGB). Cities and counties bring the authority to shape mobility policy and infrastructure, while RPCGB can align the initiative with regional transportation planning and secure federal or state funding. Additional support from organizations like the Freshwater Land Trust, Alabama Clean Fuels Coalition, and local housing authorities would help expand access to E-Bike infrastructure, promote education, and ensure deployment.
Use the E-Bikes as first-and-last mile solutions to travel to Transit Oriented Development (TOD) where they can connect to the federally funded Birmingham Xpress Bus Rapid Transit (BRT) system
Identify Community Based Organization to manage the program
Prioritize residents identified by the regional Housing Authorities
Limit the use of Vouchers to local bicycle retailers only and restrict the purchase of E-Bikes from online vendors
Submit a grant application to Transportation Alternative Program to pay for distributed E-Bike charging stations

The MSA encompasses seven counties: Jefferson, Shelby, Walker, Blount, St. Clair, Bibb, and Chilton. Anchored by the City, the MSA includes a mix of urban, suburban, and rural communities, with varying landscapes.
Progress on this measure will be evaluated through several key metrics, each of which is designed to be measurable and provide transparent tracking of project implementation:
Number of Vouchers Distributed; Total vouchers issued to participants
Voucher Redemption Rate; Percentage of issued vouchers that resulted in EV purchases
Geographic Distribution; Locations (ZIP codes or census tracts) where vouchers were used, highlighting urban vs. rural or priority communities
Table F1 shows the total quantified emission reductions as compared to BAU emissions for this measure.
Expand the initial E-Bike Voucher Program to distribute E-Bike vouchers annually.
This strategy assumes cities and counties will distribute 75 E-Bike vouchers each year to residents, enabling a long-term shift from car-based travel to low-emission personal mobility. The GHG emission reductions are based on the assumption that each recipient uses their E-Bike to replace approximately 1,000 VMT per year, a conservative estimate derived from mode shift studies conducted by the National Institute for Transportation and Communities (NITC) and the Rocky Mountain Institute (RMI). The emissions factor applied is 0.404 kg CO₂e per mile, as reported by the EPA for average gasoline passenger vehicles. Under these assumptions, each E-Bike user reduces emissions by 0.404 metric tons CO₂e per year. At 75 participants annually, the program results in an annual reduction of 30.3 metric tons CO₂e. Because the program adds new participants each year, and E-Bikes have multi-year lifespans, cumulative reductions grow over time, reaching approximately 909 metric tons CO₂e by 2030 and 7,878 metric tons CO₂e by 2050. This quantification assumes that once an e-bike is distributed, it remains in use and continues to displace VMT over its effective lifespan.

The cost estimates are indicative only; they are based on preliminary assessments, comparisons with similar programs, and expert input and are meant to provide a rough order of magnitude evaluation as shown in Table G1.
TABLE G1: MEASURE 6
6.1 E-Bike Voucher Program
The goal of this program is to distribute 75 E-Bike vouchers. However, this is influenced by the grant funding that can be secured. Est $700 per bike. Based on success in 2025 - 75 bikes $52,500

Securing the necessary funding to effectively execute the CACAP Toolkit demands a range of funding strategies and avenues. An integral facet of this financial approach is identifying potential external funding sources, particularly for actions that require additional support. Recognizing that certain strategies might surpass the MSA's current resources, tapping into external funding becomes essential. Within this framework, specific funding sources are identified where known as shown in Table H1.
PROGRAM AGENCY PURPOSE
Community Grant Program
Community Foundation of Greater Birmingham
Supports community-oriented sustainability programs like e-bike voucher initiatives
Energy Efficiency and Conservation Block Grant
U.S. Department of Energy (DOE)
Clean Air Grants HUD
Federal Infrastructure Programs
ADECA
Funds to support projects that reduce VMT via clean transportation—an e-bike voucher program fits well under this umbrella. Funds are generally administered through the state, so the MSA can apply via ADECA
Support infrastructure that benefits residents. E-bike vouchers—and associated safety infrastructure— could qualify under accessible mobility and public health
Electrification grant programs under the Infrastructure Investment and Jobs Act might be applicable if routed through state or regional planning agencies
ELIGIBLE
Supports nonprofits and government entities in Blount, Jefferson, Shelby, and St. Clair counties
Municipalities within the MSA
Municipalities within the MSA
Municipalities within the MSA

TRANSPORTATION
WRITE A TOD CORRIDOR PLAN THAT TARGETS AN INCREASE IN TRANSPORTATION CONNECTIVITY, DENSE HOUSING AROUND THE BRT SYSTEM, AND OUTLINES A PATHWAY FOR EXPANDED BIKE LANES BY 2031.
MEASURE 7: TRANSPORTATION ORIENTED DEVELOPMENT (TOD) AREA PLANNING
TOD presents a transformative opportunity for the MSA to shape a more connected, and sustainable future. Through strategic land use planning, TOD can reduce dependency on single-occupancy vehicles, lower GHG emissions, and improve access to mobility for all residents, especially those who rely on public transportation. According to the U.S. Census, more than 78% of workers across the MSA drive alone to work, a rate that exceeds the national average.
In a prior internal analysis, the City determined that for the BRT system to be financially viable, a minimum residential density of 15 housing units per acre is necessary within a ¼-mile radius of each BRT station. However, across the MSA, the majority of BRT station areas currently fall well below this threshold, with most offering fewer than 7 units per acre. This region-wide lack of housing density has led to a coordinated effort among jurisdictions within the MSA to adopt land-use strategies that support increased development around transit infrastructure.
RESPONSIBLE PARTIES
LEAD :
Designated Municipal or Regional Department, e.g., Office of Resilience and Sustainability
SUPPORTING:
RPCGB, Alabama Department of Transportation (ALDOT), Birmingham Department of Transportation (BDOT), and BJCTA
Outside of the City, the fixed-route system along with BRT does not adequately serve most suburban and rural areas with fixed-route service coverage ending near city limits. Many residents in places like Center Point, Alabaster, and Trussville lack transportation access altogether. Shelby and St. Clair counties have minimal demand-response or paratransit services. In response, the planning scope is being expanded beyond the original ¼-mile station buffers to encompass a broader ½-mile radius throughout the BRT corridor within the MSA. This expansion enables a more comprehensive and strategic regional approach to landuse planning. The goal is to guide future development that will significantly increase housing density, enhance transit ridership, and ensure the long-term sustainability of the BRT system across the entire metropolitan area.

WRITE A TOD CORRIDOR PLAN THAT TARGETS AN INCREASE IN TRANSPORTATION CONNECTIVITY, DENSE HOUSING AROUND THE BRT SYSTEM, AND OUTLINES A PATHWAY FOR EXPANDED BIKE LANES BY 2031.
MEASURE 7: TRANSPORTATION ORIENTED DEVELOPMENT (TOD) AREA PLANNING
Write a Comprehensive TOD Corridor Plan to Incorporate large-scale TOD projects while also supporting smaller-scale, neighborhood-based intermodal facilities. These localized hubs, modeled after Dutch Mobility Hubs, could offer a variety of transportation options and amenities, helping to connect users more efficiently and address first- and last-mile challenges. These hubs can include bike-share docks, e-scooters, secure bicycle parking, EV charging stations, rideshare pick-up/drop-off zones, real-time transit displays, and shaded seating areas. Strategically placed near schools, libraries, shopping areas, and local bus stops, these micro-centers offer a seamless link between regional transit and the neighborhoods where people live and work.
Explore expansions that can be accomplished to facilitate connectivity to destinations along the East-West corridor and future North-South corridor. Currently, the BRT system serves as the most widely used public transit option in the MSA. Operating along a ten-mile East-West corridor, it connects 25 neighborhoods through 32 strategically located stops. However, the absence of a North-South route creates a critical gap in the region’s transit network, limiting access for residents in the City’s northern and southern quadrants. To address this disparity, the Comprehensive TOD Corridor Plan will evaluate how this lack of connectivity impacts regional mobility and determine strategies to establish a North-South BRT corridor. As part of this effort, an existing conditions analysis will identify areas along the current East-West corridor best suited for TOD, while also exploring opportunities to expand and link these areas to key destinations along both the current and proposed corridors.

WRITE A TOD CORRIDOR PLAN THAT TARGETS AN INCREASE IN TRANSPORTATION CONNECTIVITY, DENSE HOUSING AROUND THE BRT SYSTEM, AND OUTLINES A PATHWAY FOR EXPANDED BIKE LANES BY 2031.
Build additional portions of critical trail infrastructure such as those identified in the Red Rock Trail System Action Plan and B-ACTIVE Plan. These corridors identified in these plans are part of a 15-year strategic plan to develop 19 miles of new trails, ultimately creating a 36-mile loop that connects Birmingham, Fairfield, Homewood, and Irondale. The plan emphasizes access, aiming to bring trails and green spaces within reach of all residents.
Utilize a voucher program to reduce or eliminate public transportation fares, incentivizing residents to use public transit and eliminating financial barriers to transit access. A key initiative within this program will involve partnering with the BJCTA to distribute transit vouchers. The MSA will collaborate with the Housing Authorities specific to their jurisdiction to identify eligible recipients. Leveraging existing data and outreach infrastructure will ensure that the vouchers are directed toward those with the greatest need and the highest potential to benefit from improved mobility.

MEASURE 7: TRANSPORTATION ORIENTED DEVELOPMENT (TOD) AREA
IMPLEMENTATION OF AUTHORITY AND RESPONSIBILITIES
7.1
Under Alabama law, the Planning Commission for each city and county is the official planning agency, preparing the Comprehensive Plan and making land-use and rezoning recommendations to guide physical development and transportation. The City Councils or County Commissions, as the legislative body, has the power to adopt and amend zoning ordinances and maps, including station-area/TOD overlays, mixed-use districts, and parking standards.
7.2
The BJCTA does not have the direct authority to implement new bus lanes, as it does not control local streets or roadways. Instead, bus lane implementation requires collaboration with the governing jurisdictions, such as the City, Jefferson County, or the ALDOT, which are responsible for roadway ownership and modifications. However, BJCTA plays a critical role in planning, advocating for, and supporting the development of dedicated transit infrastructure. Through partnerships with local governments, regional planners, and federal agencies, BJCTA can help initiate feasibility studies, secure funding, and integrate bus lanes into broader mobility and transit improvement efforts across the MSA.
7.3
The Freshwater Land Trust is a nonprofit, accredited conservation organization with the authority to protect and manage land through voluntary legal agreements such as conservation easements and land ownership. While it does not have regulatory or enforcement power like a government agency, it plays a key role in preserving ecologically significant land and waterways across Central Alabama. The Trust can acquire land, hold conservation easements in perpetuity, and develop public trail systems, such as the Red Rock Trail System, through partnerships with landowners, local governments, and other stakeholders. Its authority lies in its ability to steward conserved lands, ensure compliance with easement terms, and lead collaborative projects that support long-term environmental health and public access to natural spaces.
7.4
The BJCTA holds the authority to set fare rates for all transit services it operates, including fixedroute buses, paratransit services, and the BX BRT system. Fare decisions are made by BJCTA’s Board of Directors and typically involve internal analysis, public notice, and community input before any changes are finalized. These fare policies must comply with federal regulations, including Title VI requirements, to ensure accessibility. Through this process, BJCTA evaluates affordability, service costs, and ridership trends to determine fare structures that support both operational sustainability and community needs.

IMPLEMENTATION TIMELINES AND MILESTONES
Implementation of this measure is projected to begin in 2026, with an estimated minimal duration of five years, depending on funding availability and building access. The timeline below outlines major tasks and key milestones as shown in Table I1.
7.1
Prioritize strategies that will increase density within a ½ mile of the BRT corridors and economic zones
Adopt architectural pattern books of pre-approved housing designs for small scale single-family, duplexes, triplex, quadplexes, townhomes and other "missing middle" housing types to increase housing attainability near activity centers, downtowns, and transit corridors
Incorporate Smart Growth principles into zoning codes and future land use planning efforts throughout the MSA by encouraging increased walkability and density around urban centers and preserving open space for agricultural uses, preservation, and recreational uses
Design mobility hubs near BRT stations (choose one location); Identify implementation features at the mobility hub (bus bays, bike storage, designated parking areas), charging stations, priority spaces, wayfinding, and dedicated pick-up and drop-off zones
Increase the number of bus shelters along route
Expand the Birmingham On-Demand Micro transit system where viable, based on housing density to better support BJCTA Fixed-Routes
Link neighborhoods to major destinations, such as downtown Birmingham, UAB, Red Mountain Park, and Ruffner Mountain
Establish a 100-mile network of bicycle and pedestrian infrastructure, aiming to create a cohesive and safe system for non-motorized travel 7.4
Work with MSA specific Housing Authorities to release 1,000 vouchers single working mothers who need to commute to work
Encourage employers to purchase Metro Area Express (MAX) passes for employees which offer discounted fares

MEASURE 7: TRANSPORTATION ORIENTED DEVELOPMENT (TOD) AREA PLANNING
The MSA encompasses seven counties: Jefferson, Shelby, Walker, Blount, St. Clair, Bibb, and Chilton. Anchored by the City, the MSA includes a mix of urban, suburban, and rural communities, with varying landscapes.
Progress on this measure will be evaluated through several key metrics, each of which is designed to be measurable and provide transparent tracking of project implementation:
Transit Ridership Increase;
Change in public transit usage in and around the TOD area
Mode Shift;
Reduction in single-occupancy vehicle use; increase in walking, biking, and transit trips
Density of Development;
Housing units or commercial square footage per acre
Mixed-Use Ratio;
Balance of residential, retail, office, and civic uses within the TOD
Table J1 shows the total quantified emission reductions as compared to BAU emissions for this measure.
Write a Comprehensive TOD Corridor Plan.
Developing a TOD corridor plan that supports compact, mixed-use development and Dutch-style neighborhood mobility hubs is expected to significantly reduce VMT by encouraging residents to live and work near high-capacity transit. Based on EPA and CTOD (Center for Transit-Oriented Development) studies, households within TOD areas can reduce daily driving by 20–40%. For this analysis, conservatively assumed that 1,500 households would relocate to TOD zones by 2030, each reducing vehicle travel by approximately 10 miles per day. Using a gasoline VMT-specific emission factor, and applying a 10% conservatism factor for leakage and overlap, this strategy is estimated to reduce emissions by 1,991.154 MT CO₂e annually by 2030. Source references include EPA’s Location Efficiency and Housing Type (2011) and CTOD’s Effects of TOD on Housing, Parking, and Travel (2008).

MEASURE 7: TRANSPORTATION ORIENTED DEVELOPMENT (TOD) AREA PLANNING
Establish a North–South BRT Corridor.
The creation of a North–South BRT corridor is projected to generate a substantial mode shift from single-occupancy vehicles to public transit, particularly as it connects to the existing East–West BRT system. Using BRT ridership benchmarks from the Institute for Transportation and Development Policy (ITDP) and TCRP (Transit Cooperative Research Program) Report 118, this strategy assumes that 7,000 new daily riders would be added by 2030. If 65% of these new trips replace car travel, with an average roundtrip length of 7 miles, and assuming 300 service days per year, the projected annual GHG emissions avoided total 3,473.964 MT CO₂e. An operations-related haircut of 10% was included to account for non-car travel displacement and modest emissions from additional transit service. Supporting sources include ITDP’s BRT Standard (2016), FTA’s Evaluating Public Transportation Health Benefits (2010), and TCRP Report 118.
Build Additional Trail Infrastructure.
Expanding segments of the Red Rock Trail System and the B-ACTIVE Plan is expected to shift a portion of short car trips to active transportation, particularly walking and biking. Based on FHWA (Federal Highway Administration) and Rails-to-Trails literature, conservative modeling assumes that approximately 0.0167% of annual gasolinepowered VMT will be displaced by active transportation as a result of the trail buildout. Applying this factor to Birmingham’s total gasoline VMT baseline and the standard emissions factor, the estimated emissions reduction is 1,001.774 MT CO₂e per year by 2030. This estimate represents a modest, infrastructure-driven behavioral shift and assumes no induced demand. Primary sources include FHWA’s Active Transportation and Demand Management (2016) and Rails-to-Trails Conservancy’s Active Transportation Transforms America (2019).

7:
7.4
Utilize a Transit Fare Voucher Program.
Eliminating or reducing public transit fares through a voucher program is expected to increase transit ridership, particularly among lower-income residents. Based on empirical evidence from fare-free transit pilots in the U.S. and abroad, system-wide ridership increases of 15–60% have been documented. This analysis conservatively applies a 15% increase in daily ridership by 2030 to a baseline of 37,000 daily trips (excluding anticipated 7.2 corridor ridership), with 60% of new trips assumed to replace car travel. Assuming an average roundtrip length of 6.5 miles, 300 transit days per year, and a 5% haircut for operational emissions and leakage, this program is estimated to reduce emissions by 2,493.183 MT CO₂e annually. Sources include TCRP Report 95 (2004), the National Academies’ Investigation of Free Transit Programs (2022), and CityLab reporting on fare-free transit case studies.
TABLE J1: MEASURE 7 QUANTIFIED EMISSION REDUCTIONS AS COMPARED TO BAU EMISSIONS (MT CO₂e)

MEASURE 7: TRANSPORTATION ORIENTED DEVELOPMENT (TOD) AREA
The cost estimates are indicative only; they are based on preliminary assessments, comparisons with similar programs, and expert input and are meant to provide a rough order of magnitude evaluation as shown in Table K1.
Looking at both direct implementation costs and indirect or induced costs over time; Community Engagement & Outreach
$50,000–$75,000 Public meetings, surveys, translation, materials Conceptual Design for Mobility Hubs $100,000–$150,000 Includes renderings, site plans, cost estimates
Expanding Birmingham On-Demand in housingdense areas to feed BJCTA fixed routes would cost about $2.2M–$3.3M per zone per year for a modest service (≈6 vehicles, ~14 hrs/day, 7 days/wk) or $3.35M–$5.02M for a more robust service
Wichita’s planner’s guide shows $17.2k/mi (no parking) and $27.7k/mi (with parking) for painting + symbols only, excluding design/ traffic control/contingency. Bellingham’s cost calculator, using higher unit prices and including more linework, puts bike lanes (with parking) at ~$77.6k/mi. For quick budgeting, many cities carry ~$50k/mi as a mid-range placeholder
This initiative would be led by BJCTA with coordination from city and county staff
$200,000
$3M x 2 Zones
$0

MEASURE 7: TRANSPORTATION ORIENTED DEVELOPMENT (TOD) AREA PLANNING
Securing the necessary funding to effectively execute the CACAP Toolkit demands a range of funding strategies and avenues. An integral facet of this financial approach is identifying potential external funding sources, particularly for actions that require additional support. Recognizing that certain strategies might surpass the MSA's current resources, tapping into external funding becomes essential. Within this framework, specific funding sources are identified where known as shown in Table L1.
Strengthening Mobility and Revolutionizing Transportation (SMART) grants program
Transportation Alternatives Program (TAP)
U.S. DOT Awarded approximately $1.5 million in 2023 to advance smart community technologies and improve transportation efficiency
AL DOT Funds projects that enhance pedestrian and bicycle infrastructure
Commute Smart Program RPCGB
"Birmingham OnDemand" City of Birmingham
Rebuilding American Infrastructure
Rebuild Alabama Act Grants
U.S. DOT
Offers incentives for commuters to use alternative transportation modes, such as carpooling, biking, or public transit, aiming to reduce traffic congestion and improve air quality
Provides flexible, app-based rides, expanding access to essential services and employment opportunities.
Supports the Civil Rights Crossroads project, aiming to improve connectivity and infrastructure
AL DOT
Sets aside a minimum of $10 million annually from the state's gas tax revenue for local transportation projects
Municipalities within the MSA
Municipalities within the MSA
Municipalities within the MSA
Internal to the City
Complete Streets, transit hubs, bike/ped infrastructure, freight
Municipalities within the MSA
TRANSPORTATION
MEASURE 7: TRANSPORTATION ORIENTED DEVELOPMENT (TOD) AREA PLANNING
PROGRAM
TOD Planning Grants FTA Covers up to 80% of capital costs for new BRT lines, with the local sponsor providing the remaining 20% match
Congestion Mitigation and Air Quality Improvement (CMAQ) Program
Surface Transportation Block Grant Program
AL DOT Funds up to 100% for certain transit capital investments that reduce emissions, including BRT projects
MPO Allocates federal formula funds toward major regional transit investments
Municipalities within the MSA
Municipalities within the MSA
Municipalities within the MSA

IMPLEMENT A REGIONAL VMT REDUCTION PROGRAM BY 2028
Implement a coordinated regional program to reduce per capita VMT by expanding active transportation options, requiring transportation demand management (TDM) in new large developments, and improving first- and last-mile connections to transit. The program will install protected bike facilities, E-Bike charging stations, repair stations, and covered bike parking at priority public locations, transit hubs, and commercial centers. It will require nonresidential developments over 25,000 square feet to submit and follow TDM plans that encourage transit, carpooling, and flexible work schedules. It will deploy car-sharing and bike-sharing systems in urban centers and employment hubs to provide affordable alternatives to single-occupancy vehicle travel. It will reintroduce the Safe Routes to School program to improve walking and biking access for students, including infrastructure upgrades, traffic calming, and education campaigns. It will also construct priority trail segments identified in the Red Rock Trail System Action Plan and B-ACTIVE Plan to create continuous, safe, and connected regional walking and biking routes. By delivering these actions together under one program, the measure will provide safe, convenient alternatives to driving, reduce transportation-related GHG emissions, and improve community health and mobility across the MSA. DESCRIPTION
LEAD : Participating municipalities and regional planning agencies
SUPPORTING:
Municipal planning and transportation departments, local school districts, Freshwater Land Trust, community-based organizations, private mobility providers
Prioritize active transportation and support a growing community of E-Bike users, including the installation of E-Bike charging infrastructure, bike fix-it stations, and covered bike parking, in key public areas. These amenities enhance convenience, safety, and accessibility for cyclists, particularly in high-traffic zones such as trailheads, transit hubs, commercial centers, and recreational corridors. Charging stations encourage the use of E-Bikes by reducing range anxiety, while fix-it stations provide essential tools for on-the-go repairs, reducing downtime due to minor mechanical issues. Covered bike parking further protects bicycles from weather-related damage and theft, making cycling a more attractive, practical, and sustainable mode of transportation. Implementing this infrastructure not only supports local mobility goals but also advances environmental and public health benefits by reducing vehicle emissions and encouraging physical activity.

Require all new non-residential developments exceeding 25,000 square feet to implement TDM strategies aimed at reducing VMT. Developers should utilize the City’s TDM workbook as a best practice to design and adopt effective measures, such as promoting transit use, carpooling, biking, and flexible work schedules, that align with the MSA’s sustainability and mobility goals. This approach supports reduced traffic congestion, lower emissions, and a more efficient transportation system.
Explore the development of a comprehensive car-sharing and bike-sharing program that serves communities across the MSA. Such a program would enhance mobility options, reduce single-occupancy vehicle use, and support first- and last-mile connections to transit. By prioritizing accessibility in urban centers and employment hubs, a regional sharing system can promote transportation, reduce emissions, and contribute to a more sustainable and connected metro area.

8.4
Re-introduce the Safe Routes to School program to promote safe, active transportation options for students traveling to and from school. This initiative focuses on improving infrastructure such as sidewalks, crosswalks, and signage while also supporting education and engagement efforts that encourage walking and biking. By fostering healthier habits, reducing traffic congestion, and enhancing safety around schools, the program contributes to stronger, more connected communities across the region.

IMPLEMENTATION OF AUTHORITY AND RESPONSIBILITIES MEASURE 8: VEHICLE MILES TRAVELED
8.1
RPCGB serves as the official Metropolitan Planning Organization for the MSA. In this role, RPCGB holds the authority to develop and approve two critical planning documents: the Transportation Improvement Program and the Regional Transportation Plan. These plans establish short- and long-term priorities for transportation investments across the region. RPCGB is also responsible for prioritizing and allocating federal transportation funding in collaboration with local governments, ensuring that resources are directed toward projects that support regional mobility, safety, and sustainability.
8.2
Cities and counties hold the direct authority to implement development requirements such as TDM measures for large non-residential projects. These requirements would be enacted through local zoning ordinances, development codes, or site plan review processes, typically overseen by the Planning Department, Zoning Board, City Council or County Commission. Once adopted, enforcement would occur during the development review and permitting stage, ensuring that new projects comply with the established standards before receiving final approval to proceed.
8.3
Cities and counties hold the direct authority to implement car share and bike share measures within their jurisdictions. This authority allows municipalities to plan, approve, and regulate shared mobility programs as part of their broader transportation and land use strategies. Cities can establish permitting frameworks, designate curb space or docking areas, and enter into contracts or public-private partnerships with car share or bike share providers. They may also set operational requirements related to safety and data sharing. Through these tools, cities and counties can integrate shared mobility into the transportation network to reduce congestion, lower emissions, and expand access to affordable, flexible travel options.
8.4
Developing a Safe Routes to School program is typically led by city and county governments and local school districts. City and county departments such as Transportation and Public Works handle infrastructure improvements like sidewalks, crosswalks, and bike lanes, while schools manage on-campus logistics and parent communication.

TRANSPORTATION
MEASURE 8: VEHICLE MILES TRAVELED REDUCTIONS
IMPLEMENTATION TIMELINES AND MILESTONES
Implementation of this measure is projected to begin in 2026, with an estimated minimal duration of five years, depending on funding availability and building access. The timeline below outlines major tasks and key milestones as shown in Table M1.
Use the RPCGB 's VMT estimates to identify high impact transportation emissions across the MSA
8.1 Bike infrastructure
8.2 Transportation Demand Management
8.3 Car/Bike sharing programs
2026–2031
8.4 Safe Routes to School program
2026–2031
Focus on the BX line, spanning a 10-mile east-west corridor, connecting the Woodlawn Transit Center in the east to the CrossPlex Transit Center in the west, and includes 32 stops serving 25 neighborhoods
Add bike lanes, bike parking, and other facilities to support cycling as a viable transportation option
Encourage all municipalities within the MSA to adopt similar TDM workbooks
Expand TDM workbook to include points for installing EV charging
Consider transitioning regional van pool and car share programs to all electric
2026–2031
2026–2031
Expand education and outreach campaigns and events to promote walking, biking and taking transit
Where safe infrastructure exists, pilot volunteer-based walk buses and bike buses to help children safely get to school by alternative modes
Implement traffic calming measures, crosswalks, sidewalks, and bike lanes near schools
Minimize car trips to school, which helps cut down on congestion and vehicle emissions
Prioritize projects in communities where infrastructure may be lacking
MEASURE 8: VEHICLE MILES TRAVELED REDUCTIONS
The MSA encompasses seven counties: Jefferson, Shelby, Walker, Blount, St. Clair, Bibb, and Chilton. Anchored by the City, the MSA includes a mix of urban, suburban, and rural communities, with varying landscapes.
Progress on this measure will be evaluated through several key metrics, each of which is designed to be measurable and provide transparent tracking of project implementation:
Number of E-Bike Charging Stations Installed; Specify stations vs. ports
Number of Car/Bike Share Stations; Total active carshare pods and bikeshare docks/hubs
Number of Schools Participating; Track students reached and program type per school
Table N1 shows the total quantified emission reductions as compared to BAU emissions for this measure.
Bike infrastructure.
Explore installation of E-Bike charging infrastructure, fix-it stations, and covered bike parking at convenient public locations such as trails, hubs, and commercial areas. This strategy is designed to encourage mode shift from single-occupancy vehicles to E-Bikes by expanding supportive infrastructure across key public destinations. Research from the Rocky Mountain Institute indicates that E-Bike usage has the potential to replace up to 25 percent of short car trips, yielding a total citywide VMT reduction of approximately 3 percent under optimal adoption conditions (Rocky Mountain Institute, 2021). Given the early-stage and exploratory nature of the intervention, a conservative assumption was applied in estimating that only 0.7 percent of total regional light-duty vehicle VMT would be avoided. Applied to the MSA's baseline of approximately 14.84 billion gasoline-powered VMT annually, this reduction equates to an avoided 103.9 million vehicle miles. Using the U.S. EPA tailpipe emission factor for gasoline vehicles (EPA, 2023 MOVES Model), this results in an estimated reduction of 41,977 MT CO₂e per year by 2030 and beyond.
Transportation Demand Management.
Require new non-residential developments greater than 25,000 square feet to reduce VMT through TDM programs using the City of Birmingham's TDM workbook. This measure mandates that new, large-scale non-residential development projects incorporate TDM strategies as outlined in the City of Birmingham’s official TDM guidance. Based on projected development patterns in the MSA, an estimated 1 million square feet of eligible new commercial space is expected to be constructed annually. Assuming an average office density of 250 square feet per employee, this development would accommodate approximately 4,000 workers. Commuter activity for these employees, based on 230 workdays per year and a 20-mile daily round-trip average, results in roughly 18.4 million VMT annually. Peer-reviewed analyses of TDM program outcomes, including the California Air Pollution Control Officers Association (CAPCOA) guidelines, indicate that such measures typically achieve commuter VMT reductions between 5 and 12 percent (CAPCOA, 2021). An 8% reduction rate was conservatively applied, resulting in a VMT reduction of 1.47 million miles per year. Using the EPA’s VMT-to-emissions conversion factor, this corresponds to an annual reduction of 594 MT CO₂e.
Car/Bike sharing programs.
Explore options in developing a car-sharing and/or bike-sharing program that extends throughout the MSA (extension of TR 3.2.1). The introduction of a regionally accessible car-sharing or bike-sharing program is expected to reduce vehicle ownership and private car usage among program participants. National studies have demonstrated that carshare users can reduce their annual driving by 6 to 16 percent, with the most significant reductions observed among those who fully replace private vehicle ownership (Shaheen et al., University of California Berkeley Transportation Sustainability Research Center, 2020). To model a conservative scenario appropriate for a mid-sized metropolitan area, it was assumed that 8,000 residents, representing approximately 1 percent of the MSA’s adult population, would participate in the program. An average reduction of 1,000 VMT per user per year was applied, resulting in a total of 8 million vehicle miles avoided annually. Based on EPA emissions factors, this translates to an estimated reduction of 3,232 MT CO₂e per year upon full program implementation.

MEASURE 8: VEHICLE MILES TRAVELED REDUCTIONS
8.4
Safe Routes to School program. Re-Introduce SRTS program.
The re-establishment of the SRTS program aims to reduce school-related vehicle trips by encouraging students to walk or bike through investments in safety infrastructure, education, and community engagement. Based on implementation data from the National Center for Safe Routes to School and the Transportation Research Board (NCHRP Report 803, 2015), schools that adopt SRTS measures typically see measurable reductions in drop-off and pick-up vehicle activity. It was assumed that 50 schools in the MSA would adopt the program. If each participating school successfully eliminates 150 vehicle trips per day, each averaging 2 miles in round-trip length, over 180 school days per year, the resulting VMT reduction would be approximately 5.4 million miles. Applying the EPA’s emission factor for gasoline vehicles, the estimated annual reduction totals 2,182 MT CO₂e.
TABLE N1: MEASURE 8 QUANTIFIED EMISSION REDUCTIONS AS COMPARED TO BAU EMISSIONS (MT CO₂e)

MEASURE 8: VEHICLE MILES TRAVELED REDUCTIONS
The cost estimates are indicative only; they are based on preliminary assessments, comparisons with similar programs, and expert input and are meant to provide a rough order of magnitude evaluation as shown in Table O1.
STRATEGY
8.1 Bike infrastructure
A good planning estimate for installing e-bike charging infrastructure, bike fix-it stations, and covered bike parking at public locations such as trails, hubs, and commercial areas would likely range from $130,000 to $270,000 for a network of 10 well-equipped sites. This estimate assumes each site includes one dual-outlet e-bike charger ($2,200–$6,000 installed), one self-service repair stand with pump and tools ($1,300–$2,800 installed), and one covered bike shelter for 8–12 bikes ($9,500–$18,000 installed). The total cost will vary depending on factors such as site preparation needs, electrical distance from panels, trenching requirements, the durability and branding of equipment, and the inclusion of vandal-resistant or weatherproof features. Bulk purchasing can reduce per-unit prices, while utility rebates or federal transportation grants could significantly offset costs
$180,000
STRATEGY
8.2 Transportation Demand Management
STRATEGY
8.3
Car/Bike sharing programs
STRATEGY
8.4
Safe Routes to School program
This would be embedded in current staff deliverables. Currently, the City has a TDM workbook that could expand to include this and be adopted by other municipalities
It would require strong contracts and performance monitoring to ensure that service quality, pricing, and coverage align with public goals. Assume this deliverable would be embedded into current staffing and it would require internal collaboration within the MSA. All costs associated would be absorbed by a third party
Infrastructure upgrades such as traffic calming measures, highvisibility crosswalks, sidewalks, and bike lanes near schools could cost $250,000 to $750,000 per site. Efforts to minimize car trips to school (8.4.2) through outreach campaigns, travel planning, and incentives would likely require internal communications from the Unified School District. To target communities, this would require internal staff time and maybe $1,000 for design and printing if needed or translation services
$0
$0
$500,00

Securing the necessary funding to effectively execute the CACAP Toolkit demands a range of funding strategies and avenues. An integral facet of this financial approach is identifying potential external funding sources, particularly for actions that require additional support. Recognizing that certain strategies might surpass the MSA's current resources, tapping into external funding becomes essential. Within this framework, specific funding sources are identified where known as shown in Table P1.
Carbon Reduction Program
Congestion Mitigation and Air Quality Improvement Program
Surface Transportation System Funding Alternatives
Value Pricing Pilot Program
Safe Streets and Roads for All
Advanced Transportation Technology and Innovation Program
Rebuilding American Infrastructure
Federal Highway Administration (FHA)
FHA
FHA
FHA
DOT
FHA
DOT
Supports projects that reduce transportation emissions, including investments in public transit, bicycle and pedestrian infrastructure, and congestion management strategies
Provides flexible funding to state and local governments for transportation projects that help meet the requirements of the Clean Air Act, including those aimed at reducing VMT
Supports pilot projects to test alternative revenue mechanisms, such as mileagebased user fees, which directly relate to VMT reduction strategies
Encourages implementation and evaluation of value pricing pilot projects to manage congestion and improve air quality, potentially leading to VMT reductions
Funds regional, local, and Tribal initiatives to prevent roadway deaths and serious injuries, which can include projects that reduce VMT through improved safety measures and infrastructure
Supports the development and deployment of advanced technologies to improve safety, efficiency, and performance of the transportation system, which can include VMT reduction components
Funds capital investments in surface transportation projects that will have a significant local or regional impact, including those that aim to reduce VMT through improved infrastructure and connectivity
Municipalities within the MSA
Municipalities within the MSA
Municipalities within the MSA
Municipalities within the MSA
Municipalities within the MSA
Municipalities within the MSA
Municipalities within the MSA

Water issues represent one of the most pressing environmental and public health challenges of our time. Across urban and rural communities alike, aging infrastructure, pollution, overuse, and climate change are straining the availability and quality of freshwater resources. Contaminants such as industrial chemicals, agricultural runoffs, and untreated wastewater can degrade drinking water supplies and harm aquatic ecosystems. Extreme weather events, droughts, floods, and rising temperatures, intensify the stress on water systems and increase the urgency for adaptive solutions. Addressing these complex challenges requires a multifaceted approach that includes modernizing infrastructure, strengthening water governance, protecting natural watersheds, and engaging communities in sustainable water stewardship.

WATER MANAGEMENT
REDUCE WATER USAGE WITHIN MUNICIPAL OPERATIONS 3% ANNUALLY UNTIL 2030
MEASURE 9: WATER REDUCTION
DESCRIPTION
The MSA can strengthen its regional waterreduction efforts through a coordinated package of actions that reach households, businesses, and public facilities across the MSA. Core elements include retrofitting municipal buildings (e.g., motion-sensor faucets, expanding droughttolerant landscaping and high-efficiency irrigation, greywater initiatives, and seeding community rebates for smart sprinklers.
RESPONSIBLE PARTIES
LEAD: Designated Municipal or Regional Department, e.g., Office of Resilience and Sustainability
SUPPORTING: Central Alabama Water
Purchase and install 100 motion sensor faucets in all municipal buildings. Using motion sensor faucets for handwashing can significantly reduce water consumption by limiting flow to only the moments when water is actually needed. Unlike manual faucets, which often remain running during the entire handwashing process, including while lathering, sensoractivated faucets automatically shut off when hands are removed from the sink area. This leads to a typical reduction of 50% to 70% in water use per handwashing event. While a manual faucet might use over a gallon of water per wash, a motion sensor faucet can reduce that to around 0.4 to 0.6 gallons. In addition to conserving water, sensor faucets improve hygiene by eliminating the need to touch handles and help prevent water waste from being accidentally left on, offering both environmental and operational benefits.

REDUCE WATER USAGE WITHIN MUNICIPAL OPERATIONS 3% ANNUALLY UNTIL 2030
Transition to drought-tolerant landscaping at all municipal buildings within the MSA by 2030 which represents a strategic move to significantly reduce irrigation demands and promote long-term water conservation on public grounds. By replacing traditional, water-intensive turf and plantings with native and climate-adapted vegetation, cities and counties can drastically cut outdoor water use, which often accounts for a substantial portion of municipal water consumption. Drought-tolerant landscapes require less frequent watering, are more resilient to dry conditions, and typically need fewer chemical inputs, contributing to both environmental sustainability and cost savings. This proactive measure supports regional water efficiency goals, enhances the aesthetic and ecological value of public spaces, and sets an example for residents and private property owners to adopt similar sustainable landscaping practices.
Provide incentives for the installation of smart sprinkler systems, both residentially and commercially, through the Central Alabama Water rebate program. Smart sprinkler systems use weather data, soil moisture sensors, and programmable schedules to deliver water only when and where it is needed, significantly reducing overwatering and runoff. By offering financial rebates to customers who install these high-efficiency irrigation technologies, the MSA will encourage broader adoption of sustainable practices that conserve water without compromising landscape health.

Offer expedited and reduced-cost permits to new developments and major renovations that incorporate greywater systems or rainwater harvesting infrastructure. By prioritizing these projects in the permitting process and lowering associated costs, the MSA creates a financial and time-saving incentive for developers to invest in watersaving technologies. Greywater systems reuse water from sinks, showers, and laundry for non-potable purposes like irrigation, while rainwater harvesting captures and stores rainfall for later use, both significantly reducing demand on the water supply. This approach not only supports long-term water conservation goals but also fosters innovation in green infrastructure, positioning Central Alabama as a forwardthinking leader in sustainable urban development.

IMPLEMENTATION OF AUTHORITY AND RESPONSIBILITIES
Implementation of this measure is projected to begin in 2026, with an estimated minimal duration of three years, depending on funding availability and building access. The timeline below outlines major tasks and key milestones as shown in Table Q1.
Central Alabama Water Authority holds the authority to implement water-related initiatives within its designated service area. This includes managing the treatment and distribution of potable water, maintaining infrastructure such as pipelines and pumping stations, and ensuring compliance with state and federal water quality standards. The authority is also empowered to plan and execute capital improvement projects, respond to system emergencies, and adopt conservation or sustainability measures as needed. Through its regulatory and operational responsibilities, Central Alabama Water Authority plays a critical role in safeguarding public health and supporting regional growth.

MEASURE 9: WATER REDUCTION
The MSA encompasses seven counties: Jefferson, Shelby, Walker, Blount, St. Clair, Bibb, and Chilton. Anchored by the City, the MSA includes a mix of urban, suburban, and rural communities, with varying landscapes.
Progress on this measure will be evaluated through several key metrics, each of which is designed to be measurable and provide transparent tracking of project implementation:
Number of Faucets Installed; Total installed across all municipal facilities
Water Use Reduction; Gallons of water saved per building or per year compared to 2025 baseline
Installation Completion Rate; Percentage of buildings completed within project timeline
Maintenance Frequency; Number of sensor-related maintenance calls or repairs per month/year
Table R1 shows the total quantified emission reductions as compared to BAU emissions for this measure.
Motion Sensor Faucets.
Purchase and install 100 motion sensor faucets in all municipal buildings. This strategy assumes the installation of 100 motion-sensor faucets across municipal buildings, which are expected to reduce unnecessary water use by limiting faucet run-time. Based on available data from the EPA’s WaterSense program and supporting studies on sensor faucets, each fixture is estimated to save approximately 1,000 gallons of water per year. While published values vary depending on aerator flow rate and user behavior, this estimate is conservative and falls within the documented range of 700–1,500 gallons annually. The carbon mitigation associated with this water savings was calculated by applying a potable water electricity intensity of 10,740 kWh per million gallons (MG), or 0.01074 kWh/gal. This energy savings was then multiplied by Alabama’s grid emission factor of 0.000483 metric tons CO₂e per kWh, resulting in a total reduction of 0.518742 metric tons CO₂e per year from this measure.

Transition to drought-tolerant landscaping for all municipal buildings within the MSA, this strategy models the replacement of conventional landscaping with drought-tolerant, low-wateruse plantings across approximately 300,000 square feet of municipal property. Using guidance from the Alabama Cooperative Extension’s “Drought-Tolerant Landscapes for Alabama” and studies such as the Southern Nevada Water Authority’s long-term sub-metering project, a conservative savings estimate of 15 gallons per square foot per year was applied. This results in an annual water savings of 4.5 million gallons. The associated GHG reduction is calculated using the same potable water electricity intensity (10,740 kWh/MG) and grid emission factor (0.000483 tCO₂/kWh), yielding a total mitigation of 23.343390 metric tons CO₂e per year.
Promote Central Alabama Water's rebate program for water-efficiency fixtures communitywide. This strategy assumes that 75 water-efficient fixtures, such as low-flow faucets or aerators, are distributed annually through a utility-partnered rebate or incentive program. Each fixture is assumed to save approximately 700 gallons per year, based on EPA WaterSense performance criteria. The total water savings from these installations is therefore estimated at 52,500 gallons per year. Using the standardized energy intensity of 10,740 kWh/MG and the Alabama grid emission factor, this water conservation effort results in a projected GHG reduction of 0.27233955 metric tons CO₂e per year.
Offer expedited and/or reduced cost permits to new developments and major renovations that include greywater or rainwater harvesting infrastructure, this strategy encourages non-potable water reuse by offering streamlined permitting for projects that include rainwater harvesting or greywater systems. It is conservatively estimated that this incentive will result in 250,000 gallons of potable water offset per year, based on early program uptake across a small number of buildings. This planning-level estimate is informed by EPA case studies of building-scale rainwater and greywater reuse systems, which typically offset irrigation or toilet flushing demands. As with the other strategies, the emissions reduction was calculated using a potable water electricity intensity of 10,740 kWh/MG and the Alabama grid emission factor of 0.000483 tCO₂/kWh. The resulting GHG mitigation is 1.296855 metric tons CO₂e per year.

MEASURE COSTS
The cost estimates are indicative only; they are based on preliminary assessments, comparisons with similar programs, and expert input and are meant to provide a rough order of magnitude evaluation as shown in Table S1.
TABLE R1: MEASURE 9 QUANTIFIED EMISSION REDUCTIONS AS COMPARED TO BAU EMISSIONS (MT CO₂e)
TABLE S1: MEASURE 9 COSTS

Securing the necessary funding to effectively execute the CACAP Toolkit demands a range of funding strategies and avenues. An integral facet of this financial approach is identifying potential external funding sources, particularly for actions that require additional support. Recognizing that certain strategies might surpass the MSA's current resources, tapping into external funding becomes essential. Within this framework, specific funding sources are identified where known as shown in Table T1.
Water Infrastructure Finance and Innovation Act
Clean Water and Drinking Water State Revolving Funds
Community Development Block Grants
Tax Credit for Rainwater Harvesting
Assistance for Low-Income Residents
EPA Provides low-interest loans for Central Alabama Water projects such as the rehabilitation of the Lake Purdy Dam, replacement of aging water mains, and removal of lead service lines, aiming to enhance the reliability and safety of the drinking water supply for approximately 770,000 residents
ADEM Offers low-interest loans for water infrastructure projects support drinking water, wastewater, and stormwater infrastructure upgrades
ADECA
Provides for various infrastructure projects, including water and sewer system improvements
Alabama Offers a non-city/county-specific 20% tax credit for residential rainwater harvesting system installations
Central Alabama Water Offers reduced water/sewer rates for qualifying customers
Municipalities within the MSA
Municipalities within the MSA
Municipalities within the MSA
Residential
Residential

DESCRIPTION
This initiative will serve as a pilot project, demonstrating both the environmental and economic benefits of integrating clean energy into essential municipal services. The initiative will provide technical assistance, funding strategies, and best practices, ensuring that communities of all sizes can achieve energy resilience while reducing GHG emissions.
RESPONSIBLE PARTIES
LEAD: Jefferson County Environmental Services
SUPPORTING: Central Alabama Water and the City’s Office of Resilience and Sustainability
RETROFIT WASTEWATER TREATMENT FACILITIES WITH RENEWABLE ENERGY AND ENERGY-EFFICIENT TECHNOLOGIES, WITHIN THE JEFFERSON COUNTY ENVIRONMENTAL SERVICES (JCES) PORTFOLIO OF FACILITIES, BEGINNING WITH THE VILLAGE CREEK WATER RECLAMATION FACILITY BY 2035 AND DEVELOP A PROGRAM THAT WOULD FACILITATE OTHER INFRASTRUCTURE OWNERS TO CONVERT TO RENEWABLE ENERGY BY 2036
Retrofit wastewater treatment facilities with renewable energy and energy-efficient technologies. Energy-efficient treatment processes can optimize performance and extend the lifespan of critical systems. Investing in these improvements delivers both immediate cost savings and long-term environmental benefits. Building on this best practice, a comprehensive program will be developed to guide and support other facilities in converting wastewater treatment operations to renewable energy.

IMPLEMENTATION OF AUTHORITY AND RESPONSIBILITIES
IMPLEMENTATION TIMELINES AND MILESTONES
Implementation of this measure is projected to begin in 2026, with an estimated minimal duration of three years, depending on funding availability and building access. The timeline below outlines major tasks and key milestones as shown in Table U1.
Jefferson County Environmental Services (JCES) owns and operates one of the largest wastewater systems in Alabama, managing nine major water reclamation facilities (including Village Creek, Valley Creek, Five Mile Creek, Turkey Creek, Warrior, Cahaba River, Leeds, Trussville, and Prudes Creek) along with an extensive network of over 3,100 miles of sewer lines and 170 pump stations. This infrastructure provides wastewater collection and treatment for much of the metropolitan area, serving hundreds of thousands of residents and businesses across Jefferson County.
Work with JCES to target Village Creek Water Reclamation Facility
Develop a comprehensive program to guide and support other cities and counties in converting their wastewater treatment operations to renewable energy
The MSA encompasses seven counties: Jefferson, Shelby, Walker, Blount, St. Clair, Bibb, and Chilton. Anchored by the City, the MSA includes a mix of urban, suburban, and rural communities, with varying landscapes.
Progress on this measure will be evaluated through several key metrics, each of which is designed to be measurable and provide transparent tracking of project implementation:
Annual energy consumption (kWh/year); Total electricity used before and after retrofit
Energy use per unit of wastewater treated; kWh/million gallons or kWh/m³
Percentage of facility energy met by on-site renewables; e.g., solar, biogas-to-energy
Energy efficiency improvement (%); Percentage reduction in kWh used compared to baseline
Table V1 shows the total quantified emission reductions as compared to BAU emissions for this measure.
Village Creek Water Reclamation Facility.
The Village Creek Water Reclamation Facility, operated by JCES, is the largest wastewater facility in the MSA, with a permitted capacity of approximately 132 Million Gallons per Day (MGD). For this analysis, the annual flow was conservatively estimated at 70 MGD average, or about 25,550 million gallons per year. Using the U.S. EPA benchmark of 1,400 kWh per million gallons treated (EPA, Benchmarking Energy Efficiency at Wastewater Treatment Plants, 2013), Village Creek’s electricity consumption was estimated at roughly 35.8 million kWh annually. Applying the Alabama-specific grid emission factor of 0.483 metric tons CO₂e per MWh (Alabama Power reported emission intensity, 2023), baseline annual emissions equal approximately 17,300 MT CO₂e. Based on EPA’s Net Zero Energy Roadmap for Wastewater Facilities, which shows that large plants can realistically achieve 30–40% reductions through a combination of biogas recovery, combined heat and power (CHP), advanced aeration systems, and solar photovoltaics, a 35% reduction potential was applied. This results in an estimated annual reduction of 13,790 MT CO₂e at Village Creek alone.

MEASURE 10: WASTEWATER
MEASURE COSTS
The cost estimates are indicative only; they are based on preliminary assessments, comparisons with similar programs, and expert input and are meant to provide a rough order of magnitude evaluation as shown in Table W1.
10.1.2
Regional Program for Other Facilities.
Beyond Village Creek, JCES operates additional large plants such as Valley Creek (85 MGD capacity) and Five Mile Creek (20 MGD), along with six smaller municipal facilities. Additional wastewater treatment plants are operated across Shelby, St. Clair, Walker, Blount, Bibb, and Chilton counties, including medium-sized facilities in Pelham, Alabaster, Helena, Jasper, Pell City, and Columbiana, and smaller systems in Jemison, Brent, Centreville, Thorsby, and others. Collectively, these non-Village Creek plants represent an estimated baseline electricity demand of 28.4 million kWh/year, equating to 13,600 MT CO₂e/ year. To reflect differences in facility scale and retrofit potential, reduction factors were applied by tier: 35% for large facilities (Valley Creek, Five Mile Creek), 25% for medium facilities (1–10 MGD), and 15% for small facilities (<1 MGD). These percentages align with U.S. DOE and EPA findings that large plants can maximize biogas and solar resources, while smaller systems are generally limited to low-cost aeration and pumping efficiency measures. Applying these tiered assumptions produces an additional annual reduction of approximately 7,687 MT CO₂e across the MSA’s wastewater sector.

WATER MANAGEMENT
Securing the necessary funding to effectively execute the CACAP Toolkit demands a range of funding strategies and avenues. An integral facet of this financial approach is identifying potential external funding sources, particularly for actions that require additional support. Recognizing that certain strategies might surpass the MSA's current resources, tapping into external funding becomes essential. Within this framework, specific funding sources are identified where known as shown in Table X1.
Clean Water State Revolving Fund
ADEM
Provides low-interest loans for wastewater treatment and collection projects
Water Infrastructure Finance and Innovation Act
Technical Assistance for Rural Communities
Community Development Block Grants
Energy-Efficient Retrofits of Wastewater Treatment Facilities
Rural Development Programs
EPA Offers low-interest loans for large-scale water infrastructure projects
EPA Provides technical assistance to rural communities to help plan and secure funding for wastewater projects
ADECA Supports infrastructure projects, including sewer system improvements
ADECA Offers funding for energy-efficient upgrades to wastewater treatment facilities
USDA Supports the construction and improvement of wastewater systems in rural areas with populations less than 10,000
Eligible projects include municipal wastewater facilities, nonpoint source pollution control, and green infrastructure initiatives. Funds are capitalized through federal grants and state matching funds, with repayments recycled to fund additional projects
Municipalities within the MSA
Municipalities within the MSA
Grants are awarded based on community needs, with priority given to projects that benefit low- and moderate-income residents
Central Alabama Water
Central Alabama Water

The MSA faces significant stormwater management challenges due to a combination of aging infrastructure, rapid urban development, and increasingly severe weather events. Across the region, heavy rainfall frequently overwhelms drainage systems, leading to localized flooding, property damage, and environmental concerns. In the City, for example, the stormwater network spans over 2,000 miles of pipes and nearly 27,000 drains, many of which struggle to handle runoff in low-lying neighborhoods like Ensley and Collegeville. Hoover has also experienced serious stormwater impacts, with hundreds of residents reporting flood damage in recent years. Both cities have responded by developing comprehensive Stormwater Management Program Plans in alignment with Clean Water Act requirements. These plans focus on infrastructure upgrades, pollution control, and public education. However, regional needs remain vast, with the City estimating over $1 billion in required drainage improvements. As climate variability increases the frequency and intensity of rain events, coordinated investment and collaboration across the MSA will be essential to protect communities, maintain water quality, and build long-term resilience.
LEAD: Designated Municipal or Regional Department, e.g., Office of Resilience and Sustainability
SUPPORTING:
Black Warrior Riverkeeper; Cahaba Riverkeeper
EXPAND STRICT STORMWATER ENFORCEMENT, FORMALIZE QUARTERLY RIVERKEEPER AUDITS, REQUIRE NATURE-BASED/FLOOD-RESILIENT DESIGN, AND BEGIN ZONING TO ELIMINATE MINIMUM PARKING STARTING IN 2026
Continue to enforce the PostConstruction Stormwater Ordinance in the MSA. This ordinance requires developers to implement long-term stormwater management practices, such as retention basins, green infrastructure, and permeable surfaces, that control runoff volume and improve water filtration after construction is complete. Ongoing enforcement ensures that these measures are properly installed, maintained, and integrated into site design, helping to mitigate erosion, pollutant discharge, and downstream flooding.

EXPAND STRICT STORMWATER ENFORCEMENT, FORMALIZE QUARTERLY RIVERKEEPER AUDITS, REQUIRE NATURE-BASED/FLOOD-RESILIENT DESIGN, AND BEGIN ZONING TO ELIMINATE MINIMUM PARKING STARTING IN 2026
Lobby for the enforcement of quarterly water quality audits in partnership with the Riverkeeper and Cahaba River Society non-profit groups. These audits would provide consistent, science-based monitoring of pollutants, sediment levels, and overall ecosystem health, ensuring early detection of potential contamination or regulatory violations. Collaborating with Riverkeeper and Cahaba River Society leverages their expertise in advocacy, citizen science, and community engagement, fostering transparency and public trust in water resource management. By advocating for this policy at the municipal and regional levels, stakeholders can promote accountability among industrial, agricultural, and urban contributors to water pollution, while reinforcing long-term environmental stewardship and compliance with the Clean Water Act.
Prioritize the installation of nature-based solutions in areas of high need, particularly within or near the 100-year floodplain. Implementing features such as wetland restoration, green roofs, vegetated buffers, and stormwater parks can reduce runoff, enhance natural water absorption, and provide critical ecological benefits. Focusing investments on floodprone zones ensures that limited resources are directed where they will have the greatest impact, protecting lives, properties, and essential services. By addressing historical underinvestment and aligning with climate adaptation goals, this approach supports resilience and fosters healthier, more sustainable neighborhoods.

EXPAND STRICT STORMWATER ENFORCEMENT, FORMALIZE QUARTERLY RIVERKEEPER AUDITS, REQUIRE NATURE-BASED/FLOOD-RESILIENT DESIGN, AND BEGIN ZONING TO ELIMINATE MINIMUM PARKING STARTING IN 2026
Consider eliminating minimum parking requirements from local zoning codes to reduce the amount of impervious surface created during development and promote more sustainable land use. Traditional parking minimums often lead to oversized parking lots that increase stormwater runoff, contribute to urban heat island effects, and consume valuable space that could otherwise be used for green infrastructure, housing, or public amenities. Removing or reducing these mandates encourages developers to tailor parking supply to actual demand, fosters walkable and transit-oriented communities, and aligns zoning practices with climate resilience and smart growth principles. This approach can also support more affordable development by lowering construction costs and freeing up land for higher value uses.

IMPLEMENTATION OF AUTHORITY AND RESPONSIBILITIES
IMPLEMENTATION TIMELINES AND MILESTONES
Implementation of this measure is projected to begin in 2026, with an estimated minimal duration of four years, depending on funding availability and building access. The timeline below outlines major tasks and key milestones as shown in Table Y1.
Cities and counties hold the authority to implement stormwater management policies through its planning and engineering permit processes. By integrating stormwater requirements into development reviews and construction permits, municipalities ensure that new projects comply with local, state, and federal regulations related to runoff control, water quality, and infrastructure impact. This authority allows municipal departments to enforce design standards, such as green infrastructure, detention systems, and erosion controls, as part of site development and redevelopment approvals.
Compare local guidelines with best practices from peer cities that have successfully adopted green infrastructure standards (e.g., Portland, Philadelphia, or Atlanta)
Catalog minimum parking ratios by use (e.g., retail,
Identify where requirements exceed observed demand

The MSA encompasses seven counties: Jefferson, Shelby, Walker, Blount, St. Clair, Bibb, and Chilton. Anchored by the City, the MSA includes a mix of urban, suburban, and rural communities, with varying landscapes.
Progress on this measure will be evaluated through several key metrics, each of which is designed to be measurable and provide transparent tracking of project implementation:
Impervious Surface Area Reduced (sq. ft or %); Tracks how much hard surface is removed or avoided
Green Infrastructure Area Added (sq. ft or %); Bioswales, pervious surfaces, rain gardens, or tree planting installed in place of excess parking
Land Value Captured or Redeveloped (sq. ft or %); Former parking areas reused for housing, commercial space, or public amenities
Heat Island Effect Mitigation; Measurable through surface temperature mapping in formerly paved areas replaced with green infrastructure

MEASURE 11:
Table Z1 shows the total quantified emission reductions as compared to BAU emissions for this measure.
Parking requirements.
The GHG emission reductions associated with eliminating parking minimums were quantified by combining reductions in VMT with avoided embodied emissions from asphalt paving. The VMT methodology follows the California Air Pollution Control Officers Association’s Quantifying Greenhouse Gas Mitigation Measures Handbook , which builds on Caltrans (2012) and Chatman (2013). It assumes that reducing parking supply below Institute of Transportation Engineers (ITE) estimated residential demand lowers household reliance on automobiles for commuting. The percent reduction is calculated as the product of the parking scarcity factor (shortfall in supply relative to ITE demand), the share of project VMT generated by residents, the statewide average share of household VMT that is commute-based (37 percent, Caltrans 2012), and the observed reduction in commute driving under conditions of limited parking (37 percent, Chatman 2013). This fractional reduction is applied to baseline residential VMT, and avoided emissions are calculated using MSA’s tailpipe emission factor, consistent with factors used in other transportation measures. Embodied savings are estimated by multiplying the number of stalls not constructed by 30 m² per stall (including aisles) and an asphalt emission factor of 30 kg CO₂e per m², then amortizing the result over a 30year pavement design life. This approach conservatively quantifies the most direct and well-supported benefits of parking reform, fewer vehicle trips and less paved surface area, while excluding speculative or indirect co-benefits, ensuring consistency and methodological transparency across the inventory.
TABLE Z1: MEASURE 11 QUANTIFIED EMISSION REDUCTIONS AS COMPARED TO BAU EMISSIONS (MT CO₂e)
The cost estimates are indicative only; they are based on preliminary assessments, comparisons with similar programs, and expert input and are meant to provide a rough order of magnitude evaluation as shown in Table A2.
Modest installations range from approximately $1 to $5 per square foot, making a 100–400 sq ft rain garden cost around $100–$2,000; assume $1,000 per sq ft or 10 projects (2 sq ft) over 5 years = $100,000

WATER MANAGEMENT
Securing the necessary funding to effectively execute the CACAP Toolkit demands a range of funding strategies and avenues. An integral facet of this financial approach is identifying potential external funding sources, particularly for actions that require additional support. Recognizing that certain strategies might surpass the MSA's current resources, tapping into external funding becomes essential. Within this framework, specific funding sources are identified where known as shown in Table B2.
Sewer Overflow & Stormwater Reuse Grants
Alabama Section 319 Clean Water Implementation Grants
Community Disaster Resilience Zones
EPA Helps towns upgrade stormwater systems and deploy green infrastructure
ADEM
Provides watershed-based nonpoint source pollution projects, ideal for bioswales, rain gardens, and permeable surfaces
FEMA
Pre-Disaster Mitigation Grant
FEMA
PROTECT
(Promoting Resilient Operations for Transformative, Efficient, and Cost-Saving Transportation)
Bipartisan Infrastructure Law (BIL)
DOT
Designates high-risk communities for coordinated investment, unlocking federal resources for flood mitigation and green infrastructure
Finances planning and implementation of naturebased flood risk reduction, such as wetland restoration, upstream detention basins, and greenways
Provides formula and discretionary grants for projects that enhance transportation resilience to flooding, sea-level rise, and extreme weather. Ideal for integrating green infrastructure
EPA Distributes BIL waterinfrastructure funds for drinking water, wastewater, and stormwater projects
Municipalities within the MSA
Municipalities within the MSA
Municipalities within the MSA
Municipalities within the MSA
Municipalities within the MSA
Municipalities within the MSA

This sector encompasses the sustainable management and conservation of natural resources. It focuses on reducing waste, recycling, and promoting the sustainable use of resources through such mechanisms as reduced consumption (source reduction, reuse), waste diversion (recycling, composting), and responsible purchasing (environmentally preferable purchasing policies). Although associated emissions reductions for waste and recycling strategies may be lower than those anticipated in other foundational sector areas, the Waste and Recycling sector provides some of the most visible opportunities at a community level, municipal operations level and day-to-day behavioral activities that can successfully engage, activate and mobilize the community in taking daily sustainability action.

WASTE AND RECYCLING
INCREASE WASTE AND RECYCLING DIVERSION BY ADOPTING A NEW MODEL FRANCHISE AGREEMENT BY 2028 AND LAUNCHING A ZERO-WASTE CAMPAIGN FOCUSED ON PROCUREMENT FROM 2026 TO 2030
MEASURE 12: WASTE AND RECYCLING
Reducing landfill waste through enhanced diversion programs is a strategy to conserve natural resources and advance the region’s long-term environmental goals. Landfills generate methane, a potent GHG, through the anaerobic decomposition of organic materials like food scraps, yard waste, and untreated wood. Beyond disposal emissions, the extraction, manufacturing, and transportation of raw materials used in packaging and construction are carbonintensive processes. By diverting recyclable and recoverable materials, communities can significantly cut emissions and reduce the demand for virgin resource extraction and energy use in manufacturing.
A consistent, region-wide approach to resource conservation begins with a clear framework for public outreach and education. Community behavior change depends on reliable, accessible information, yet residents often receive conflicting or incomplete guidance, which limits participation in diversion programs. To address this, a Model Waste Management Franchise Agreement could establish a unified structure across the MSA. This standardized legal agreement between municipalities and private haulers would ensure consistent waste, recycling, and disposal services, improving service delivery, promoting regulatory compliance, and supporting environmental goals.
Introduce and enforce policies that prioritize the purchase of environmentally friendly and recycled-content products for municipal operations. Cities and counties can lead by example in sustainability by introducing and enforcing procurement policies that prioritize environmentally friendly and recycled-content products. By shifting purchasing practices to include items such as recycled paper, nontoxic cleaning supplies, and energy-efficient equipment, local governments can reduce their environmental footprint, support green markets, and demonstrate a commitment to responsible resource use. These policies not only advance climate and waste reduction goals but also encourage broader adoption of sustainable products within the community.
TIER 3 COMPLIMENTARY
PRIORITY SCORE 3
CO-BENEFITS
RESPONSIBLE PARTIES
LEAD: Designated Municipal or Regional Department, e.g., Office of Resilience and Sustainability
SUPPORTING: Third party haulers, landfills, and outreach partners
LAND USE TYPE

INCREASE WASTE AND RECYCLING DIVERSION BY ADOPTING A NEW MODEL FRANCHISE AGREEMENT BY 2028 AND LAUNCHING A ZERO-WASTE CAMPAIGN FOCUSED ON PROCUREMENT FROM 2026 TO 2030
Adopt a zero-waste commitment. This signals a bold and proactive approach to sustainability, aiming to eliminate waste sent to landfills and incinerators by redesigning systems and behaviors. This commitment focuses on reducing consumption, maximizing recycling and composting, and encouraging product reuse and repair. By setting measurable targets and timelines, cities and counties can drive innovation in waste management, foster circular economy practices, and engage residents and businesses in long-term environmental stewardship. A zerowaste goal not only reduces GHG emissions and conserves resources but also creates local economic opportunities through recycling industries and green jobs.
Adopt a Model Waste Franchise Agreement MSA wide to create consistency in residential and commercial services. Currently, the seven counties within the MSA operate under a patchwork of waste hauling agreements, with each municipality contracting independently and offering varying levels of service and pricing.
• Waste types covered (residential, commercial, industrial, recycling, composting, etc.)
• Curbside pickup, bulky item pickup, seasonal services
• Service frequency (e.g., weekly trash, biweekly recycling)
• Provision of carts/bins
• Education and Outreach

INCREASE WASTE AND RECYCLING DIVERSION BY ADOPTING A NEW MODEL FRANCHISE AGREEMENT BY 2028 AND LAUNCHING A ZERO-WASTE CAMPAIGN FOCUSED ON PROCUREMENT FROM 2026 TO 2030
Expand the City’s residential waste hauling services to align with the standards and rates established in the Model Waste Management Franchise Agreement. Currently, the City’s Public Works Department manages residential waste collection, while commercial properties must contract independently with private haulers. This fragmented system leads to inconsistent service levels, confusion about proper waste sorting, and reduced participation in recycling and diversion efforts. A key objective is to invest in the infrastructure necessary to implement a three-stream collection system—trash, recycling, and compost—to improve waste separation, enhance diversion rates, and support the City’s broader sustainability goals.

IMPLEMENTATION OF AUTHORITY AND RESPONSIBILITIES
Local third-party waste haulers are private or contracted entities authorized to collect, transport, and in some cases process or dispose of solid waste, recyclables, construction debris, and organic materials within a specific jurisdiction. Their authority typically comes through municipal contracts, permits, or franchise agreements issued by city or county governments.
City and county governments legally define the scope of services they expect through formal ordinances, service agreements, and procurement contracts with third-party haulers. These documents outline in detail the types of waste to be collected—such as municipal solid waste, recyclables, organics, or hazardous materials—as well as the frequency of service, geographic coverage, performance standards, and public health requirements.

Implementation of this measure is projected to begin in 2026, with an estimated minimal duration of four years depending on funding availability and building access. The timeline below outlines major tasks and key milestones as shown in Table C2.
Assign a weight (e.g., 20–30% of total evaluation) based on how sustainability aligns with your organizational mission
Conduct bi-annual waste audits in each municipality to identify non-recyclable items and construction and demolition materials
Install water refill station(s) to replace water fountains in the City's CrossPlex and City Hall in order to influence behavior change and act as a model for other municipal buildings across the MSA
Identify municipal vendors who are responsible for bringing in Styrofoam and transition to more sustainable packaging options
Embed zero waste education through city and county communications such as newsletters, employee onboarding, and train-the-trainer sessions with department managers
Launch a Green Business Program; provide tax breaks or other incentives to get businesses started 12.2
Establish recycling centers in each county
Reduce waste associated with events hosted at government facilities; Require City and county sponsored events to be "single-use plastic free" (i.e. plastic utensils, cups, bottles, etc. will not be permitted)
Pass a "No Burn" trash ordinance
Launch a reuse "Last Chance" store at one or more of the local landfills
Partner with local bike shops to host bike repair clinics in each county within the MSA on an annual basis

12.3
Model Franchise Agreement Phase 1
12.4
Model Franchise Agreement Phase 2
2026–2030
2026–2030
Work with franchised hauler to offer recycling services to all waste customers and to establish curbside composting programs (excluding the City's residential service); design rates to ensure service buy in
Track diversion rates on a quarterly basis from regional recycling operators and private landfill
Provide adequate composting and recycling bins within city and county facilities and at other heavily used public access locations such as city and county parks and individual downtowns. Ensure signage about proper disposal of waste is clear and available in English and Spanish
Develop policies to reduce construction and demolition waste through building reuse, deconstruction, and material diversion and reuse
Divert organic food waste combined with green waste (leaves, branches, etc.) using waste-to-energy anaerobic digestion serving the entire MSA
Create more consistency with the bulky item pick up schedule to reduce illegal dumping
Continue to encourage the City's opt in recycling program
Work to attract or establish a regional compost facility, beginning with a pilot
Establish a 2026 waste diversion rate baseline and a goal to increase diversion rate 10% by 2030 CONTINUED FROM

The MSA encompasses seven counties: Jefferson, Shelby, Walker, Blount, St. Clair, Bibb, and Chilton. Anchored by the City, the MSA includes a mix of urban, suburban, and rural communities, with varying landscapes.
Progress on this measure will be evaluated through several key metrics, each of which is designed to be measurable and provide transparent tracking of project implementation:
Diversion Rate;
Percentage of total waste diverted from landfill through recycling, composting, or reuse
Waste Amount;
Total waste amount sent to landfill per year; begin a baseline using 2025
Recycling Infrastructure;
Number of new recycling bins installed and maintained across municipal and public spaces
Community Engagement;
Number of outreach events held, and participants reached through education efforts
Table D2 shows the total quantified emission reductions as compared to BAU emissions for this measure.
Introduce and Enforce Green Procurement Policies for Municipal Operations. This strategy assumes that municipal purchasing policies focused on recycled-content and environmentally preferable products will result in modest reductions in the disposal of paper and packaging materials. These reductions are modeled as a decrease in the quantity of degradable organics sent to landfill, which drive nearly all methane emissions from solid waste. Specifically, assuming that paper and packaging waste reductions would lower the amount of landfilled organics by 1% of the disposed stream, and that municipal operations influence approximately 5% of the region’s total waste. Using EPA’s 2018 national Mixed Solid Waste (MSW) composition data and IPCC default Degradable Organic Carbon (DOC) values, an estimated 92.7% of landfill methane emissions can be attributed to degradable organics such as paper, food, yard trimmings, and wood. Applying these assumptions to the MSA’s total solid waste emissions (519,645 MT CO₂e/year), this strategy results in a reduction of approximately 240.9 MT CO₂e per year. This approach is consistent with EPA’s WARM tool, which identifies paper source reduction as a key GHG mitigation opportunity due to its high methane generation potential when landfilled.

12.2
This strategy models the GHG impact of a community-wide Zero Waste campaign aimed at increasing public participation in recycling and composting programs, improving access to diversion infrastructure, and promoting education around material sorting. These improvements are assumed to reduce the volume of degradable organics landfilled by 3% of the disposed stream across the entire MSA. As in 12.1, this strategy relies on EPA’s national waste composition data and IPCC DOC values to estimate that approximately 92.7% of methane emissions from landfills stem from degradable organics. Applying this diversion impact to the region’s total solid waste emissions results in an estimated reduction of 14,451.3 MT CO₂e per year. This calculation aligns with EPA WARM’s proportional emissions framework, which treats avoided landfill disposal of organic materials as directly mitigating methane generation.
This strategy assumes that a unified franchise agreement across the MSA will standardize residential and commercial services—particularly around organics collection, recycling access, contamination enforcement, and performance monitoring. These service enhancements are projected to reduce the amount of degradable organics sent to landfill by 5% of the disposed stream across 100% of the MSA. Given that these organic materials are responsible for an estimated 92.7% of landfill methane emissions, the total annual reduction from this strategy is estimated at 24,085.5 MT CO₂e per year. This methodology reflects guidance from the U.S. EPA and state-level programs like California’s SB 1383 implementation, which demonstrate the GHG mitigation potential of performance-based solid waste contracting that increases organics diversion.
12.4
Expand the City of Birmingham’s Hauling Services to Match Model Agreement.
This strategy applies the model franchise services (outlined in 12.3) to the portion of the MSA served by the City of Birmingham, assumed here to represent 35% of the region’s total waste stream. The resulting service expansion, including parity in rates, container standards, and the addition of organics collection, is estimated to reduce landfilled degradable organics by 2% of the disposed stream within that 35%. Using the same emissions attribution logic from previous strategies (92.7% of solid waste emissions from organics), this intervention yields an estimated reduction of 3,372.0 MT CO₂e per year. The proportional mitigation method is consistent with the EPA WARM tool and IPCC modeling framework, which attribute avoided landfill methane generation to upstream organics diversion.

TABLE D2: MEASURE 12 QUANTIFIED EMISSION REDUCTIONS AS COMPARED TO BAU EMISSIONS (MT CO₂e)
MEASURE COSTS
The cost estimates are indicative only; they are based on preliminary assessments, comparisons with similar programs, and expert input and are meant to provide a rough order of magnitude evaluation as shown in Table E2.
TABLE E2: MEASURE 12 COSTS
This estimate assumes that cities and counties will conduct one waste audit per year at city and county facilities beginning in 2026, for a total of 12 audits through 2050. Professional third-party waste audits typically cost between $4,000–$6,000 per facility or engagement, depending on the number of buildings and complexity. This estimate assumes a moderate level of service at $5,000 per year, including onsite waste stream characterization, data analysis, and a brief report with findings and recommendations. City and county staff time to coordinate with the auditor or implement. Recommendations are not included, as this is assumed to be covered by existing responsibilities. Tax breaks would be an avoided income and are not seen as an expense $48,000

CONTINUED FROM
CATEGORY DESCRIPTION
STRATEGY
12.2
Zero Waste campaign
Assumes $1,500–$3,500 each for refill station; estimated 8 per facility (2,500 * 8*2=$40,000) plus installation $1,000 * 16 = $16,000. Vendor audit would require staff time and an assumed 10% increase in purchasing costs for compostable/recyclable packaging ($50,000). Staff time would be needed to embed zero waste education. The hauler would charge the events for food waste collection at the 4 events, but staff time would be needed to coordinate. Site prep & signage: $25,000–$75,000 per recycling center (assuming drop-off bins, paved area, fencing) (7 counties * $50,000 = $350,000). Staff time would be needed to write a ban and no burn policy language. And $100,000 should be set aside for seed money to launch a reuse center
$556,000
STRATEGY
12.3
Model Franchise Agreement Phase 1
Contract modifications, outreach, and rate-setting studies: ($50,000 for third party to craft language in model contract) Diversion rates should be provided by the hauler so there are no costs associated with tracking diversions. Dual-bin stations (indoor): $400–$800 each installed
Outdoor heavy-duty stations: $1,000–$2,500 each installed
Initial deployment: Assume 150–200 locations → $150,000–$350,000 capital $200,000
STRATEGY
12.4
Model Franchise Agreement Phase 2
Outreach & education: Designing and distributing flyers, digital campaigns, or workshops ($5,000–$25,000/ year depending on scale); Feasibility & siting study for pilot: Environmental, zoning, and market assessments ($25,000–$75,000); Estimated range: $30,000–$75,000 for baseline establishment, then $15,000–$40,000 per year for monitoring and reporting
$54,000

Securing the necessary funding to effectively execute the CACAP Toolkit demands a range of funding strategies and avenues. An integral facet of this financial approach is identifying potential external funding sources, particularly for actions that require additional support. Recognizing that certain strategies might surpass the MSA's current resources, tapping into external funding becomes essential. Within this framework, specific funding sources are identified where known as shown in Table F2.
PROGRAM
EPA Recycling Education and Outreach Grant Program
Solid Waste Infrastructure for Recycling (SWIFR)
EPA (Inflation Reduction Act funding)
USDA Rural Utilities Service – Solid Waste Management Grants
EPA / IRA
Funds recycling education, signage, and contamination reduction campaigns; Grants up to $2M for large-scale outreach and education
Provides capital grants to improve post-consumer materials management infrastructure; Bins, carts, sorting equipment, signage, transfer station improvements; grants typically $500,000–$4M
Municipalities within the MSA
Municipalities within the MSA
Alabama Recycling Fund (ARF) Grants
U.S. Department of Agriculture
ADEM
Provides technical assistance and training to improve solid waste facilities and systems in rural communities; Planning, equipment training, and program design; grants generally $50,000–$150,000
Supports community recycling programs, infrastructure development, and illegal dump remediation
Municipalities within the MSA
Municipalities within the MSA

The MSA boasts a remarkable landscape that blends urban development with rich natural beauty. Nestled at the southern end of the Appalachian Mountains, the region features rolling hills, forested ridges, and an extensive network of rivers and streams, most notably the Cahaba and Black Warrior Rivers. This geographic diversity supports a range of open spaces, from historic urban parks like Railroad Park and Ruffner Mountain Nature Preserve in the MSA, to scenic greenways, such as the Shades Creek Greenway.
CO-BENEFITS KEY
GHG REDUCTION POTENTIAL COST EFFECTIVE
COMMUNITY BENEFITS

MEASURE 13: OPEN
Converting vacant lots into rain gardens, tree plantings, and meadows can manage stormwater, reduce heat, and enhance biodiversity while improving neighborhood livability. A Comprehensive Urban Community Forestry Plan will guide long-term canopy management, conservation, and tree planting to support climate and public health goals. Meanwhile, showcasing sustainable landscaping with native plants in city/countyowned spaces will reduce maintenance costs, protect waterways, and demonstrate municipal leadership in environmental stewardship.
RESPONSIBLE PARTIES
LEAD:
City’s Department of Planning, Engineering & Permits or similar
SUPPORTING:
City’s Department of Public Works’ Horticulture and Urban Forestry Division, Park and Recreation Board, and Land Bank
TRANSFORM 500 SQUARE FEET OF UNDERUTILIZED SPACES AND PUBLIC LANDSCAPES ANNUALLY INTO NATURAL SPACES USING NATIVE LANDSCAPING; INCLUDE IMPLEMENTATION TIMELINE IN THE COMMUNITY FORESTRY PLAN
Convert vacant lots into green system interventions, such as rain gardens, tree plantings, and low-maintenance meadows. These underutilized spaces offer valuable opportunities to manage stormwater naturally, reduce urban heat, and increase biodiversity, all while transforming blighted or neglected parcels into community assets. By implementing nature-based solutions on vacant land, the MSA can address flooding, improve air and water quality, and create visually appealing green spaces that promote health and well-being. These interventions also support long-term sustainability goals by requiring minimal upkeep and offering scalable models for neighborhood greening across the region.

TRANSFORM 500 SQUARE FEET OF UNDERUTILIZED SPACES AND PUBLIC LANDSCAPES ANNUALLY INTO NATURAL SPACES USING NATIVE LANDSCAPING; INCLUDE IMPLEMENTATION TIMELINE IN THE COMMUNITY FORESTRY PLAN
STRATEGY
Develop a Comprehensive Urban Community Forestry Plan and perform canopy assessments to guide tree canopy management and conservation efforts; tie to carbon sequestration. Developing a plan is essential for guiding long-term tree canopy management, conservation, and urban greening efforts. As cities and counties grow and land use intensifies, maintaining and expanding urban tree canopy becomes critical, not only for enhancing neighborhood aesthetics and public health, but also for achieving broader environmental and climate goals. A well-designed forestry plan enables cities and counties to strategically manage their tree resources and protect existing canopy from development pressures or climate stressors.
Utilize city/county-owned or operated open spaces to showcase sustainable landscaping and low-impact design planting strategies. By incorporating native trees, shrubs, and groundcovers into public parks, medians, rights-of-way, and civic landscapes, cities and counties can reduce maintenance needs, improve stormwater management, and support local biodiversity. Native plants are well-adapted to the region’s climate and soil conditions, requiring less water and fewer chemical inputs, which helps protect local waterways such as the Cahaba and Black Warrior Rivers from pollution.

MEASURE 13: OPEN SPACE UTILIZATION
IMPLEMENTATION OF AUTHORITY AND RESPONSIBILITIES
The primary authority overseeing open space planning and policy, especially as codified in a land-use strategy, are the Planning and Engineering Departments within each city or county. For example, the City of Birmingham’s Department of Planning, Engineering and Permits leads the development and implementation of open space provisions as part of the City's Comprehensive Plan, specifically under “Chapter 5: Open Space, Parks, and Recreation,” which established zoning districts for managing open space such as neighborhood greenways, regional parks, and natural areas.
Managing and maintaining actual parkland and recreational open spaces within cities and counties falls on the Parks and Recreation Department. As an example, the City of Birmingham uses the Park and Recreation Board, a body appointed by the City Council, to oversee more than 2,000 acres across 100+ park sites, including recreation centers, golf courses, swimming pools, athletic fields, and picnic areas. The Department of Public Works’ Horticulture & Urban Forestry Division handles landscaping, tree trimming, right-ofway upkeep, and greenhouse operations across the city’s parks and major thoroughfares.
City Councils or County Commissions can pass ordinances and zoning amendments that designate areas as parks, conservation lands, or open space districts. Through the adoption or modification of the comprehensive plan, they set long-term priorities for preservation, recreation, and development. These decisions can limit certain land uses, require green buffers, or establish conservation easements.
Cooperative extensions are part of the land-grant university system and funded through a mix of federal, state, and county resources. This mandate gives them authority to provide education, technical assistance, and applied research on land stewardship, agriculture, and natural resource management. While they cannot legally zone or acquire land, their expert guidance often informs the policies and practices adopted by governing bodies.

IMPLEMENTATION TIMELINES AND MILESTONES
Implementation of this measure is projected to begin in 2026, with an estimated minimal duration of two years, depending on funding availability and building access. The timeline below outlines major tasks and key milestones as shown in Table G2.
The MSA encompasses seven counties: Jefferson, Shelby, Walker, Blount, St. Clair, Bibb, and Chilton. Anchored by the City, the MSA includes a mix of urban, suburban, and rural communities, with varying landscapes.
Progress on this measure will be evaluated through several key metrics, each of which is designed to be measurable and provide transparent tracking of project implementation:
Number of trees planted; Percentage of native
Number of new landscaping plants planted; Percentage of native
Number a vacant lots transitioned; Total square foot
The cost estimates are indicative only; they are based on preliminary assessments, comparisons with similar programs, and expert input and are meant to provide a rough order of magnitude evaluation as shown in Table H2.

Table I2 shows the total quantified emission reductions as compared to BAU emissions for this measure.
Convert vacant lots to green system interventions. Birmingham has an estimated several hundred vacant parcels, with real estate listings suggesting 600–700 acres of undeveloped land in circulation. For this strategy, the analysis assumes 500 vacant lots averaging 0.2 acres each (100 acres total), of which 80% (≈80 acres) are feasible for greening. Beginning in 2025, 24 acres are converted, with 40% of that area planted with trees and 60% transitioned to low-mow meadows. This yields 4,800 trees planted across vacant lots in the first year. Tree carbon sequestration is calculated using U.S. Forest Service i-Tree defaults of 4.2 tCO₂/acre-canopy/yr at maturity, with a 15-year ramp-up. Meadow conversions generate operational savings immediately by avoiding mowing fuel (0.53 tCO₂/acre/yr), synthetic fertilizer use (0.16–0.19 tCO₂e/ acre/yr), and irrigation electricity (0.74 tCO₂/acre/yr), based on EPA emission factors for gasoline, IPCC Tier-1 fertilizer defaults , and U.S. average water energy intensity of 2,300 kWh/MG. Combined, vacant lot interventions yield 23 tCO₂e/yr reductions by 2025, rising above 200 tCO₂e/yr by 2050 as canopy matures and meadow acreage expands.
Develop a comprehensive Urban Community Forestry Plan.
This strategy represents a citywide canopy program, separate from vacant lot conversions. The scenario assumes 500 new trees are planted annually across parks, streets, and rights-of-way, with a 70% survival rate by year five. Average canopy at maturity is estimated at 25 m² per tree (0.006 acres), and sequestration is quantified at 4.2 tCO₂/ acre/yr with a 15-year ramp-up . By 2030, cumulative canopy from successive plantings yields 18 tCO₂/yr in annual sequestration, rising above 230 tCO₂/yr annually by 2050. Energy co-benefits from shade could add further reductions if planting is targeted to buildings, though those effects are not quantified here.

Utilize city-owned open spaces for sustainable landscaping. City demonstration sites emphasize sustainable landscaping practices by replacing turf with native meadows and low-mow areas. This analysis assumes 10 acres converted in 2025, 30 acres by 2030, and 50 acres by 2050. Emission reductions come from avoided mowing fuel (≈0.53 tCO₂/acre/yr), reduced fertilizer inputs (0.16–0.19 tCO₂e/acre/ yr), and avoided irrigation (0.74 tCO₂/acre/yr), for a combined 1.45 tCO₂e/acre/yr reduction . Soil carbon gains from meadow establishment add 0.3–1.0 tCO₂/acre/yr over several decades . Together, these operational and soil benefits yield 14.5 tCO₂e/yr reductions in 2025, 43 tCO₂e/yr by 2030, and 72 tCO₂e/yr by 2050.
TABLE I1: MEASURE 13 QUANTIFIED EMISSION REDUCTIONS AS COMPARED TO BAU EMISSIONS (MT CO₂e)
Securing the necessary funding to effectively execute the CACAP Toolkit demands a range of funding strategies and avenues. An integral facet of this financial approach is identifying potential external funding sources, particularly for actions that require additional support. Recognizing that certain strategies might surpass the MSA's current resources, tapping into external funding becomes essential. Within this framework, specific funding sources are identified where known as shown in Table J2.

&
MEASURE 13: OPEN SPACE UTILIZATION
TABLE J2: MEASURE 13 INTERSECTION WITH OTHER FUNDING AVAILABILITY
Federal RAISE Grants DOT
American Rescue Plan Act
U.S. Department of the Treasury
Enhances connectivity, ADA access, sidewalks, and cycling infrastructure—melding transportation with open space improvement
Covers playground upgrades, play areas, athletic facility improvements, seating, signage, and expanded sidewalks to boost accessibility and usability
Forever Wild Land Trust Taxpayer funded Buys and preserves land for recreation and conservation purposes
Land and Water Conservation Fund
Outdoor Recreation Legacy Partnership
Open Space Lands Acquisition and Development Grants
Alabama Power Foundation—Good Roots Grants
U.S. Department of the Interior through the National Park Service
U.S. Department of the Interior through the National Park Service
Provides matching grants for state and local governments to acquire land and water areas for public recreation and conservation. It’s authorized at up to $900 million annually through the Great American Outdoors Act
Supports creation and revitalization of parks and outdoor spaces in urban areas. It’s a 50/50 matching grant
Alabama Offers state-financed grants for local governments to acquire or develop public parks and open spaces. Acquisition grants can be up to $1.725 million, and development grants up to $600,000
Alabama Power Awards up to $1,000 for tree planting and beautification projects by cities, counties, schools, and nonprofits
Municipalities within the MSA
Municipalities within the MSA
Municipalities within the MSA
Municipalities within the MSA
Municipalities within the MSA
Municipalities within the MSA
Municipalities within the MSA

ESTABLISH 10 FRESH FOOD DISTRIBUTION LOCATIONS ANNUALLY ACROSS THE MSA FOR THE NEXT FIVE YEARS
MEASURE 14: AGRICULTURAL FOOD SYSTEMS
Addressing food access remains a critical priority across the MSA, where nearly 70% of residents live in neighborhoods with limited access to quality, affordable fresh foods. Cities and counties throughout the region are recognized for proactive and innovative strategies that extend beyond traditional incentive models and grocery store recruitment. Instead, the region is advancing hyper-local, community-driven programs and policies that strengthen long-term food resilience. Key initiatives include the City’s 2019 Healthy Food Ordinance (“Food Desert Ordinance”), the 2024 Heart of the Farm Initiative, the 2023 FUSE Corps Executive Fellowship Food Sovereignty Report, and the Healthy Food Fund. Additionally, regionally supported pilots such as the farm-tocorner store food hub and the mobile grocery program in partnership with local food banks exemplify region-wide efforts to close food access gaps. These collaborative actions reflect a strong, ongoing commitment to ensuring healthy, affordable food access for all communities across the MSA.
LEAD:
Designated Municipal or Regional Department, e.g., Office of Resilience and Sustainability
SUPPORTING:
Grace Klein, Jones Valley Farms, Magic City Harvest; Urban Ministry’s WE Community Gardens; Alabama Sustainable Agriculture Network; Local CSA providers, Snow’s Bend Farm & Mountain Sun Farm
Increase resident's access to fresh, affordable, and healthy foods. Improving access to fresh, affordable, and healthy foods is a critical step toward advancing public health, economic, and community resilience in the MSA. Many neighborhoods experience limited access to full-service grocery stores, farmers markets, or culturally appropriate fresh food options. This lack of availability contributes to higher rates of diet-related illnesses, such as diabetes and hypertension, and exacerbates health disparities across racial and economic lines. To address this challenge, regional partners can pursue a multi-faceted strategy that includes expanding support for local farmers’ markets, incentivizing grocery retailers to locate in communities, and investing in mobile markets and urban agriculture initiatives. Strengthening the regional food system could also involve supporting food cooperatives, establishing community-supported agriculture (CSA) programs, and providing grants or technical assistance to small-scale growers and food entrepreneurs.

INCREASE THE USE OF NO-TILL FARMING TO MANAGE WATER RESOURCES TO TARGET FIVE FARMS ANNUALLY ACROSS THE MSA FOR THE NEXT FIVE YEARS
MEASURE 14: AGRICULTURAL FOOD SYSTEMS
No-till practices present a powerful opportunity to enhance water resource management while promoting soil health and climate resilience. Traditional tillage disturbs the soil structure, increasing the risk of erosion, runoff, and water loss. In contrast, no-till methods preserve the integrity of the soil by minimizing mechanical disturbance, allowing it to better absorb and retain moisture. This practice improves water infiltration, reduces evaporation, and strengthens the soil’s capacity to store water during dry periods, making farms more resilient to drought and extreme weather events.
RESPONSIBLE PARTIES
LEAD: Designated Municipal or Regional Department, e.g., Office of Resilience and Sustainability
SUPPORTING: Alabama Farmers Federation
STRATEGY
Prioritize sites by watershed impact, acreage, and producer readiness. Use simple MOUs with farm-specific practice menus and timelines. Verify implementation and outcomes annually tracking acres treated, water and nutrient reductions, and any needed course corrections.

WORK WITH THE ALABAMA FARMERS FEDERATION TO TARGET EDUCATION ABOUT THE NEGATIVE IMPACTS OF THE APPLICATION OF BIOSLUDGE TO 10 FARMS ANNUALLY ACROSS THE MSA OVER THE NEXT FIVE YEARS
Biochar can cause shortterm and site-specific problems on agricultural land, especially when the material or application rate isn’t well matched to the soil and crop. Fresh, high-carbon char may immobilize nitrogen and absorb other nutrients, depressing yields; many chars are alkaline, raising pH and triggering micronutrient deficiencies, and ashy chars can add salts or boron that stress seedlings.
STRATEGY
Restrict application of biosludge on regional agriculture land. Restricting the application of biosolids-based biosludge on regional agricultural land is a critical environmental and public health measure aimed at protecting soil, water quality, and food safety. Biosludge refers to the semi-solid organic byproduct that results from the biological treatment of wastewater, typically in municipal sewage treatment plants or industrial wastewater systems. To implement this restriction effectively, regional policies can be updated to clearly define and prohibit the use of biosludge derived from biosolids while still allowing or encouraging the use of plant- or wood-based biosludge produced through controlled pyrolysis. Establishing a regulatory framework for biosludge classification can help ensure that only safe, beneficial amendments are used on agricultural land.
RESPONSIBLE PARTIES
LEAD: Designated Municipal or Regional Department, e.g., Office of Resilience and Sustainability
SUPPORTING: Alabama Farmers Federation

Cities have authority over food systems through their legislative, regulatory, and programmatic powers, allowing them to influence every stage from production to waste recovery. They can use zoning and land use ordinances to permit or protect urban agriculture, community gardens, and farmers’ markets, while local health departments oversee food safety standards and vendor licensing. Economic development initiatives and tax incentives can attract grocery stores or food hubs to the MSA, and municipal procurement policies can prioritize purchasing from local farms, strengthening regional agriculture.
The Farm Bureau influences agricultural land decisions through its strong policy, advocacy, and organizational reach rather than direct regulatory power. As a membership-driven organization, it develops policy positions through member votes and uses them to lobby local, state, and federal lawmakers on issues like zoning, land use, water rights, and taxation that affect farmland. Farm Bureau representatives participate in advisory boards, public hearings, and regulatory processes, ensuring agricultural interests are heard in decision-making.

Implementation of this measure is projected to begin in 2026, with an estimated minimal duration of five years, depending on funding availability and building access. The timeline below outlines major tasks and key milestones as shown in Table K2.
Use "Too Good To Go" app to expand food recovery programs; start with grocery stores and restaurants
Work with the Community Food Bank of Central Alabama and the Health Department to expand food recovery efforts in grocery stores and restaurants; Promote the “Too Good to Go” app to identify when surplus edible food is available for pick-up
14A.1
Improve communication around community garden permitting Subsidize the cost of CSA boxes and distribute to underprivileged communities; apply to USDA's Summer Food Service Program which reimburses agencies
Support local community garden efforts to serve communities
Increase access to healthy food by requiring box stores such as the Dollar Store to carry fruits and vegetables. This initiative also includes measures like loosening parking and zoning restrictions for grocery stores, allowing mobile grocery and farmers markets to operate in residential areas, and establishing a Healthy Foods Fund to incentivize grocery store expansion

MEASURE 14: AGRICULTURAL FOOD SYSTEMS
GEOGRAPHIC LOCATION
The MSA encompasses seven counties: Jefferson, Shelby, Walker, Blount, St. Clair, Bibb, and Chilton. Anchored by the City, the MSA includes a mix of urban, suburban, and rural communities, with varying landscapes.
Progress on this measure will be evaluated through several key metrics, each of which is designed to be measurable and provide transparent tracking of project implementation:
Pounds of Edible Food Recovered and Redistributed; Use tracking protocol outlined in the Urban Agricultural Land Use Plan
Community Distribution Points Expanded; Pantries, CSA boxes, Healthy food ordinance establishments
Number of Food Recovery Partnerships Established; Grocery stores, restaurants, and venues
No significant GHG emissions reductions are associated with this measure.
The cost estimates are indicative only; they are based on preliminary assessments, comparisons with similar programs, and expert input and are meant to provide a rough order of magnitude evaluation as shown in Table L2.
TABLE L2: MEASURE 14 COSTS

MEASURE 14: AGRICULTURAL FOOD SYSTEMS
Securing the necessary funding to effectively execute the CACAP Toolkit demands a range of funding strategies and avenues. An integral facet of this financial approach is identifying potential external funding sources, particularly for actions that require additional support. Recognizing that certain strategies might surpass the MSA's current resources, tapping into external funding becomes essential. Within this framework, specific funding sources are identified where known as shown in Table M2.
Climate-Smart Agriculture & Forestry Programs
Conservation Stewardship Program
U.S. Department of Agriculture’s Natural Resources Conservation Service (NRCS)
Brownfields Grants
Promotes voluntary climatesmart practices, such as soil carbon enhancements, forest restoration, and wetland rehabilitation
Provides cost-share incentives for projects that improve soil health and carbon sequestration
Farmers and landowners
Brownfields Voluntary Cleanup Program
Natural Resources Conservation Service
Provides federal grants to local governments, nonprofits, and developers for assessment and cleanup
Assesses and remediates sites, often supporting redevelopment
Farmers and landowners
Provides financial and technical assistance to urban growers in the MSA in areas such as soil health, erosion control, water conservation, pollinator habitat, and high tunnels
Municipalities within the MSA
Municipalities within the MSA
Municipalities within the MSA
CLIMATE PREPAREDNESS AND EMERGENCY MANAGEMENT
The region has experienced a range of significant climate-related challenges over time, including severe storms, flooding, and extreme weather events. These impacts have exposed vulnerabilities in infrastructure, emergency response systems, and public health, underscoring the need for coordinated resilience strategies. With climate-related disruptions expected to increase in frequency and intensity, the MSA must focus on reducing exposure and building long-term adaptive capacity. At the core of future planning, it is essential for cities and counties throughout the MSA to strengthen their ability to manage climate impacts, share resources, and collaborate on building a more resilient region.
CO-BENEFITS KEY COMMUNITY BENEFITS

DESCRIPTION
Climate resilience is the capacity of communities, ecosystems, and infrastructure to anticipate, adapt to, and recover from the increasing impacts of climate change. This includes mitigating risks from hazards such as extreme heat, flooding, and severe storms while strengthening systems to endure and rebound from those events. Building resilience requires coordinated planning, investments in sustainable and adaptive infrastructure. The CACAP Toolkit presents a comprehensive framework to enhance resilience across both urban and open space environments. It features actionable strategies such as urban heat island mapping, promotion of reflective roofing materials, development of a municipal-focused CACAP Toolkit, and implementation of green infrastructure like rain gardens and permeable surfaces.
RESPONSIBLE PARTIES
LEAD: Designated Municipal or Regional Department, e.g., Office of Resilience and Sustainability
SUPPORTING: Department of Public Works
FOCUS ON THREE RESILIENCE INITIATIVES TO STRENGTHEN THE MSA’S ABILITY TO RESPOND TO CLIMATE IMPACTS BY 2027
Conduct a heat study and mapping initiative to identify designated Urban Heat Island locations within the community. This analysis will use satellite data, temperature sensors, and land use assessments to pinpoint areas experiencing significantly higher temperatures due to dense development and limited vegetation. The findings will guide future planning, green infrastructure investments, and climate resilience strategies.

CLIMATE PREPAREDNESS AND EMERGENCY MANAGEMENT
FOCUS ON THREE RESILIENCE INITIATIVES TO STRENGTHEN THE MSA’S ABILITY TO RESPOND TO CLIMATE IMPACTS BY 2027
MEASURE 15: CLIMATE RESILIENCY
Prioritize the use of light-colored roofing materials or establish a minimum solar reflectance standard for commercial and residential roofs during new construction or replacement. These “cool roofs” help reduce surface temperatures, lower indoor cooling demands, and mitigate the Urban Heat Island effect, especially in densely built areas. Implementing reflectance standards can significantly enhance energy efficiency and climate resilience at the building and neighborhood scale.
15.3 Nature-based Solutions Toolkit
Develop a toolkit for cities and counties that outlines best practices for implementing nature-based solutions to address climate resilience, stormwater management, and ecosystem restoration. The toolkit should include guidance on green infrastructure design, policy recommendations, funding sources, maintenance strategies, and case studies from successful projects. It will serve as a practical resource to support local governments in planning, executing, and sustaining naturebased initiatives.
IMPLEMENTATION OF AUTHORITY AND RESPONSIBILITIES
IMPLEMENTATION TIMELINES AND MILESTONES
Implementation of this measure is projected to begin in 2026, with an estimated minimal duration of two years depending on funding availability and building access. The timeline below outlines major tasks and key milestones as shown in Table N2.
Cities and counties manage climate resilience through their legislative, planning, and budgetary authority, using zoning and building codes to limit risk, directing infrastructure investments toward resilient systems, and overseeing emergency preparedness. They regulate energy, water, and land use to strengthen adaptive capacity, secure funding through local budgets and external grants, and partner with other agencies and organizations to deliver projects. By engaging communities in designing and implementing strategies, cities integrate resilience into daily governance, ensuring that infrastructure, natural systems, and residents are better prepared for climate impacts.
Match locations with nature-based solutions outlined in
Expedite permitting or provide a rebate for compliance; add to TDM Workbook
Require the use of permeable surfaces for new or reconstructed hardscaped areas where feasible
Implement carbon sequestration by preserving and expanding the urban forest, participating in soil-based or compost application sequestration initiatives
Design rain gardens in areas near storm drains to improve stormwater management

The MSA encompasses seven counties: Jefferson, Shelby, Walker, Blount, St. Clair, Bibb, and Chilton. Anchored by the City, the MSA includes a mix of urban, suburban, and rural communities, with varying landscapes.
Progress on this measure will be evaluated through several key metrics, each of which is designed to be measurable and provide transparent tracking of project implementation:
Acres or square feet of land improved using Nature based solutions; Percentage of ground covered
Number of toolkit solutions; Implemented vs. total available
Square footage of permeable vs. impervious materials installed; Percentage of ground covered
Tons of CO2 sequestered annually; Based on square foot
No significant GHG emission reductions are currently associated with these strategies.
The cost estimates are indicative only; they are based on preliminary assessments, comparisons with similar programs, and expert input and are meant to provide a rough order of magnitude evaluation as shown in Table O2.
TABLE O2: MEASURE 15 COSTS

Securing the necessary funding to effectively execute the CACAP Toolkit demands a range of funding strategies and avenues. An integral facet of this financial approach is identifying potential external funding sources, particularly for actions that require additional support. Recognizing that certain strategies might surpass the MSA's current resources, tapping into external funding becomes essential. Within this framework, specific funding sources are identified where known as shown in Table P2.
PROGRAM
Building Resilient Infrastructure and Communities
Climate Smart Communities Initiative
Community Development Block Grants
Safeguarding Tomorrow Revolving Loan Fund
Community Change Grants
Bloomberg Cities Idea Exchange
Federal Emergency Management Agency (FEMA)
National Oceanic and Atmospheric Administration (NOAA)
HUD
FEMA
EPA
Bloomberg Philanthropies
Global Innovation Fund Nonprofit
Supports pre-disaster mitigation through grants for infrastructure improvements. Recent court rulings reinforce its continuation
Offers about $100,000 grants plus technical assistance to accelerate local climate resilience planning
Improve community resilience alongside broader development goals
Help communities invest in hazard mitigation and climate resilience alongside its traditional grant programs
Reduce pollution, build climate resilience, and boost community capacity
A $50 million philanthropic program supporting cities in replicating effective climate and resilience solutions, including grants for pilot projects, technical assistance, and peer learning
Explicitly includes “Urban Resilience” as a priority area, seeking solutions that address critical urban challenges like floods and extreme heat intensified by climate change
Municipalities within the MSA
Municipalities within the MSA
Municipalities within the MSA
Municipalities within the MSA
Municipalities within the MSA
Municipalities within the MSA
Municipalities within the MSA

Recognizing the growing risks associated with climate change, cities and counties should take proactive steps to integrate Climate Action Management Systems across the MSA. This initiative seeks to embed climate resilience and mitigation strategies into regional planning efforts, infrastructure investments, and public services. Through crosssector collaboration, data-informed decisionmaking, and the implementation of adaptive infrastructure, the MSA aims to become a leader in climate preparedness and environmental sustainability.
RESPONSIBLE PARTIES
LEAD: Designated Municipal or Regional Department, e.g., Office of Resilience and Sustainability
SUPPORTING: Internal staff
CLIMATE ACTION MANAGEMENT SYSTEMS
INTEGRATE CLIMATE ACTION MANAGEMENT SYSTEMS ACROSS THE MSA BY 2027
Merge the CACAP Steering Committee with the Sustainability Steering Committee which presents an opportunity to consolidate expertise, streamline coordination, and build shared resources in support of both climate action and sustainability planning efforts. By uniting the two groups, the MSA can eliminate redundancy, foster more efficient decisionmaking, and ensure that strategies outlined in the CACAP Toolkit are aligned with broader sustainability goals. This integrated structure would promote stronger collaboration across departments and stakeholders, enhance accountability, and leverage collective capacity to advance environmental and economic outcomes more effectively.

16
INTEGRATE CLIMATE ACTION MANAGEMENT SYSTEMS ACROSS THE MSA BY 2027
MEASURE 16: CLIMATE ACTION MANAGEMENT SYSTEMS
Leverage cooperative internships focused on climate action and sustainability to build a strong career pipeline for college students across the MSA. By embedding students in realworld implementation roles, these internships will provide hands-on experience in areas such as renewable energy, environmental planning, resilience, and data analysis. The program will establish three interns per jurisdiction within the MSA, ensuring broad geographic coverage and tailored support for local CACAP Toolkit implementation efforts. These internships will not only accelerate the pace of climate action across jurisdictions but also cultivate the next generation of sustainability professionals committed to advancing longterm environmental and economic goals for the region.
Re-design climate action website for one-stop-shop information that educates the public on the CACAP Toolkit and sustainability practices, offering a centralized platform for information and resources. This centralized hub will provide clear, user-friendly access to data, tools, and resources, including educational materials, progress updates, community initiatives, and actionable guidance for individuals and organizations. By integrating interactive features and intuitive navigation, the new site will serve as a trusted resource for residents, businesses, and stakeholders to stay informed and empowered to participate in climate efforts.

IMPLEMENTATION OF AUTHORITY AND RESPONSIBILITIES
IMPLEMENTATION TIMELINES AND MILESTONES
Implementation of this measure is projected to begin in 2026 with an estimated minimal duration of four years, depending on funding availability and building access. The timeline below outlines major tasks and key milestones as shown in Table Q2.
Cities and counties can pass resolutions or ordinances to create steering committees, define their scope, and appoint members from government, community, and private sectors to guide implementation. Cities and counties also control official communications channels, enabling them to launch dedicated climate websites, share data and progress updates, and engage the public through surveys and events. Using their budgetary and staffing authority, they can hire staff, recruit interns, and partner with universities.
Monitor and report progress toward achieving CACAP goals on an annual basis
Establish a public-facing online Climate Hub, with reporting dashboards, resources, and next steps on Climate Action
Establish an annual micro-grant program to support local citizen-led projects and programs that will reduce emissions, adapt to climate change
Allocate appropriate funds identified in the CACAP into annual budgets
Establish three (3) interns per county to help guide the implementation of the CACAP
Widely advertise at public meetings and hearings through a variety of
MEASURE 16: CLIMATE ACTION MANAGEMENT SYSTEMS
The MSA encompasses seven counties: Jefferson, Shelby, Walker, Blount, St. Clair, Bibb, and Chilton. Anchored by the City, the MSA includes a mix of urban, suburban, and rural communities, with varying landscapes.
Progress on this measure will be evaluated through several key metrics, each of which is designed to be measurable and provide transparent tracking of project implementation:
Meeting Frequency and Attendance; Number of meetings held per year and average attendance rate
Partnerships Formed; Number of collaborations with local organizations working on environmental programs
Intern Hours Contributed; Total hours worked on CACAP projects
Unique Visitor; Monthly or quarterly user count
No significant GHG emissions reductions are associated with this measure.
The cost estimates are indicative only; they are based on preliminary assessments, comparisons with similar programs, and expert input and are meant to provide a rough order of magnitude evaluation as shown in Table R2.
TABLE R2: MEASURE 16 COSTS

CLIMATE PREPAREDNESS AND EMERGENCY MANAGEMENT
MEASURE 16: CLIMATE ACTION MANAGEMENT SYSTEMS
Securing the necessary funding to effectively execute the CACAP Toolkit demands a range of funding strategies and avenues. An integral facet of this financial approach is identifying potential external funding sources, particularly for actions that require additional support. Recognizing that certain strategies might surpass the MSA's current resources, tapping into external funding becomes essential. Within this framework, specific funding sources are identified where known as shown in Table S2.
PROGRAM AGENCY PURPOSE
Operating budget Office of Resilience and Sustainability
To allocate appropriate budget amounts to ensure a long-term success of the CACAP Toolkit

The healthcare sector is the largest and fastest-growing industry cluster in the MSA, serving as a critical hub for medical care, research, and innovation across the southeastern United States. Anchored by the UAB Health System, one of the nation's leading academic medical centers, the region boasts a comprehensive network of hospitals, specialty clinics, research institutions, and public health organizations. The UAB Health System alone contributes approximately $6.4 billion annually to Alabama's economy through its employment, clinical services, and cutting-edge research. Across the metro area, the healthcare sector employs more than 80,000 workers, fueling economic growth and workforce development. The City itself is home to approximately 13 hospitals and numerous primary care and specialty medical facilities, reinforcing the MSA’s role as a regional epicenter for high-quality, accessible healthcare.
The MSA has a well-documented history of environmental challenges. For generations, heavy industry and manufacturing facilities, often sited near residential neighborhoods, have contributed to long-term exposure to air pollution, degraded environmental conditions, and negative health outcomes.
The legacy of pollution from the region’s industrial base, particularly from activities associated with the steel and energy sectors, continues to shape air quality across the MSA.
According to the American Lung Association’s State of the Air report in 2023, the City ranked as the 39th most polluted U.S. city for ozone levels and received an “F” grade for ozone pollution over a three-year period. These conditions highlight the ongoing need for targeted environmental interventions, infrastructure investments, and policies that address both legacy pollution and future resilience across the region.

MEASURE 17
WORKFORCE DEVELOPMENT
MEASURE 17
PARTNER WITH WORKFORCE DEVELOPMENT EFFORTS TO ATTRACT NEW INDUSTRIES, DEVELOP CAREER READINESS, AND ELIMINATE WAGE DISCRIMINATION
MEASURE 17: WORKFORCE DEVELOPMENT
DESCRIPTION
The MSA is uniquely positioned to lead in workforce innovation, thanks to the MSA’s strategic location near major rail corridors and access to regional ports through an integrated logistics network. This multimodal connectivity enables the region to support and expand key sectors such as advanced manufacturing, clean energy, and EV manufacturing, while attracting new investments and driving job creation. Coupled with its rapidly growing technology and healthcare industries, as well as a geographically mixed landscape that supports a variety of economic activities, Central Alabama stands out as a forward-looking model for 21st-century workforce development.
The MSA’s strength lies in its collaborative, regionwide approach to workforce readiness. This effort is powered by strong partnerships among regional organizations, community colleges, state agencies, and employers. Workforce councils such as Central Six AlabamaWorks! serve a combined 19 counties, providing job training, employer engagement, and career pathway programs tailored to high-demand fields like healthcare, construction, manufacturing, and transportation. These councils ensure that students and job seekers are equipped with skills that directly match industry needs. Community colleges, including Central Alabama, Lawson State, and Trenholm State, play a pivotal role by offering hands-on training in critical fields such as welding, industrial electronics, and nursing. This comprehensive and integrated ecosystem positions Central Alabama as a national model for responsive, industrydriven workforce development.
STRATEGY
Support and incentivize the growth of start-ups and small businesses that develop sustainable products and services by offering targeted incentives, technical support, and access to funding opportunities. Leverage partnerships with organizations like the Birmingham Business Alliance to identify and engage high-potential leads, fostering a local green economy and driving innovation in environmental sustainability.
RESPONSIBLE PARTIES
LEAD:
Designated Municipal or Regional Department, e.g., Office of Resilience and Sustainability
SUPPORTING:
Lawson State Community College; Birmingham Region Health Partnership; Birmingham Business Alliance

PARTNER WITH WORKFORCE DEVELOPMENT EFFORTS TO ATTRACT NEW INDUSTRIES, DEVELOP CAREER READINESS, AND ELIMINATE WAGE DISCRIMINATION
Develop clear and accessible career pathways for ten priority green workforce positions across key sectors such as green infrastructure management, forestry, vehicle electrification and EV repair, and energy-related fields. These pathways should outline required training, certifications, and advancement opportunities to guide students, job seekers, and transitioning workers. By collaborating with industry partners, educational institutions, and workforce councils, the region can ensure alignment between training programs and in-demand skills, building a pipeline of qualified talent to support the growing green economy.
The Birmingham Region Health Partnership, led by the City, received a $10.8 million Good Jobs Challenge grant to train 1,200 jobseekers and place in high-quality healthcare roles across the MSA. The initiative focuses on creating a healthcare workforce pipeline through partnerships with UAB, Central Six AlabamaWorks!, STRIVE Birmingham, Prosper, and the Women’s Foundation of Alabama.
Create family-supporting jobs that have long faced systemic underinvestment by prioritizing hiring and access to workforce development programs. Focus on industries such as clean energy, sustainable construction, and green infrastructure to generate stable employment opportunities that promote economic mobility. These efforts should be paired with community engagement and wraparound support to ensure long-term success and resilience.
MEASURE 17: WORKFORCE DEVELOPMENT
58 INC., Shelby County’s official economic development corporation, has authority over workforce development through its county-appointed board and its partnership with the Shelby County Economic & Industrial Development Authority, which is legislatively authorized to promote economic growth. While it does not regulate, 58 INC. leads and coordinates workforce programs with employers, schools, AlabamaWorks, and state training agencies, managing apprenticeships, career readiness initiatives, and educator engagement to align local talent pipelines with business needs.
The City’s Department of Innovation & Economic Opportunity (IEO) has authority over workforce development through its city-level mandate to drive job creation, skills training, and economic growth. Backed by budget control and program management powers, IEO creates and funds initiatives like the BOLD grants, leads major workforce grant proposals, and partners with employers, training providers, and community organizations to align talent pipelines with industry needs, giving it both strategic and operational influence over workforce readiness in the City.
The Birmingham Business Alliance influences workforce development as the region’s economic development agency and chamber of commerce, using its convening power and partnerships to connect employers, educators, and talent. Through programs like FuelAL, it links university students with local job opportunities, while providing businesses with labor market data and talent solutions. By leveraging its investor network and advocating for pro-workforce policies, the Birmingham Business Alliance shapes strategies that strengthen the talent pipeline and support regional economic growth.

TIMELINES AND MILESTONES
Implementation of this measure is projected to begin in 2026, with an estimated minimal duration of four years, depending on funding availability and building access. The timeline below outlines major tasks and key milestones as shown in Table T2.
Collaborate with Innovation Depot to leverage incubation ideas
Support renewable energy startups; position the MSA as a green business hub.
Engage and partner with technical and community colleges, established workforce development organizations, and industry and manufacturing alliances to provide workforce development programs in these focus areas.; Leverage Green Jobs Network
Work with GASP on the Urban Climate Corps program, aiming to create a green workforce development program that prioritizes BIPOC youth and fosters a pipeline into green careers within the MSA
Train 1,200 jobseekers for high-quality healthcare roles, with a focus on empowering marginalized communities
Work with Lawson State Community College to locate
opportunities in communities
Enable training by providing supportive services such as childcare, transportation to and from training facilities and offsetting lost wages

The MSA encompasses seven counties: Jefferson, Shelby, Walker, Blount, St. Clair, Bibb, and Chilton. Anchored by the City, the MSA includes a mix of urban, suburban, and rural communities, with varying landscapes.
In the MSA, workforce training data is collected and monitored by a network of regional, state, and federal partners. Central Six AlabamaWorks! serves as the regional workforce council, tracking training enrollments, credential attainment, and job placements across key industry sectors. The Alabama Department of Labor oversees performance data under the Workforce Innovation and Opportunity Act, capturing metrics such as completion rates, employment outcomes, and wage progression. At the federal level, the U.S. Bureau of Labor Statistics provides metro-level insights into employment trends and occupational demand. Additionally, the Birmingham Business Alliance contributes labor market intelligence and skills gap analysis to guide workforce development efforts. Together, these entities support a coordinated approach to understanding and strengthening the region’s workforce pipeline.
Progress on this measure will be evaluated through several key metrics, each of which is designed to be measurable and provide transparent tracking of project implementation:
Number of Participants Enrolled;
Total individuals who start the program
Participant Demographics;
Data on race, gender, age, income level, ZIP code, education level, veteran status, etc.
Program Retention Rate;
Percentage of participants who complete the full training
Completion Rate;
Number and percentage of participants who finish the program
No significant GHG emissions reductions are associated with this measure.

The cost estimates are indicative only; they are based on preliminary assessments, comparisons with similar programs, and expert input and are meant to provide a rough order of magnitude evaluation as shown in Table U2.

Securing the necessary funding to effectively execute the CACAP Toolkit demands a range of funding strategies and avenues. An integral facet of this financial approach is identifying potential external funding sources, particularly for actions that require additional support. Recognizing that certain strategies might surpass the MSA's current resources, tapping into external funding becomes essential. Within this framework, specific funding sources are identified where known as shown in Table V2.
and Opportunity Act
U.S. Department of Labor Supports Adult, dislocated worker, and youth training; apprenticeships; on-the-job training; support services
Good Jobs Challenge U.S. Economic Development Administration Supports sector-based workforce development, training infrastructure, and wraparound services
Municipalities within the MSA
Municipalities within the MSA
Apprenticeship Building America Grants U.S. Department of Labor Supports registered apprenticeships Municipalities within the MSA Innovative Water Infrastructure Workforce Development Program
Builds a robust pipeline of skilled professionals for the drinking water and wastewater utility sector
Municipalities within the MSA Brownfields Job Training Grants
Trains unemployed and underemployed residents in environmental cleanup and remediation careers
Supports training for businesses impacted by COVID-19; reskilling and upskilling incumbent workers
Municipalities within the MSA Alabama Workforce Stabilization Program
Municipalities within the MSA

A symbolic task force approach centers on collaboration, shared learning, and collective problem-solving rather than formal authority or binding decision-making. In this model, the Task Force serves as a visible commitment to working together across organizations, sectors, or communities. Members are invited for their perspectives, experiences, and ability to contribute to a shared vision. The group focuses on identifying common challenges, exchanging best practices, and spotlighting successful strategies that others can adapt. Regular meetings, open dialogue, and transparent sharing of resources foster trust and build a community of practice. Rather than producing binding directives, the task force’s value lies in amplifying effective approaches, connecting partners, and inspiring action through collaboration and mutual support.

18
INDUSTRY TASK FORCE
MEASURE 18A
ENCOURAGE STEEL AND GAS OPERATIONS TO REDUCE FIVE (5) MTCO₂E GHG EMISSIONS BY 2035
MEASURE 18: INDUSTRY TASK FORCE
DESCRIPTION
By 2035, cities and counties will partner with regional steel manufacturers and natural gas system operators to achieve a cumulative reduction of five (5) MTCO₂e of GHG emissions through a mix of energy efficiency, process electrification, low-carbon fuels, methane leak detection and repair, waste-heat recovery, and best-available controls, backed by targeted incentives, streamlined permitting, and transparent measurement and public reporting.
RESPONSIBLE PARTIES
LEAD: Designated Municipal or Regional Department, e.g., Office of Resilience and Sustainability
SUPPORTING: KGS Steel, and Southeast Oil & Gas Association
Adopt new technologies, processes, and equipment to reduce reliance on fossil fuel-generated energy and increase energy efficiency in industrial-scale steel and gas operations. This strategy focuses on modernizing high-emission industrial systems with cleaner, more efficient alternatives such as electrified furnaces, waste heat recovery, and process optimization tools. A key component of this effort includes partnering with KGS Steel to serve as a demonstration site for best practices. By showcasing real-world implementation of energy-efficient innovations, the partnership can help inform and inspire broader adoption across the region’s industrial sector, while also contributing to emissions reductions, operational cost savings, and enhanced environmental performance.

ENCOURAGE STEEL AND GAS OPERATIONS TO REDUCE FIVE (5) MTCO₂E GHG EMISSIONS BY 2035
Establish industry standards such as the Science Based Targets initiative (SBTi) to ensure steel and gas companies align with global climate benchmarks. In addition to setting targets, companies can take meaningful action by adopting low-carbon logistics, partnering with vendors committed to environmental, social, and governance (ESG) principles, and incorporating green-certified raw materials into their supply chains. These strategies not only reduce environmental impact but also enhance brand credibility and resilience as industries adapt to evolving market and regulatory pressures. Supporting companies through technical assistance, recognition programs, and access to financial incentives can accelerate the adoption of these practices across the MSA. STRATEGY
Consider Carbon Capture and Sequestration (CCS) tools which present a promising opportunity to mitigate GHG emissions from hard-to-abate industrial sectors in the MSA. CCS technologies can capture CO₂ emissions directly from point sources such as steel or gas processing facilities and transport them for long-term storage in secure geological formations. As a first step, the region should vet the feasibility of such projects through collaboration with the Longleaf CCS Club in Mobile, AL, which brings together stakeholders focused on advancing carbon management solutions in the Southeast. Partnering with initiatives like Longleaf can help assess local storage capacity, infrastructure needs, regulatory considerations, and cost-benefit outcomes. Exploring CCS as part of a broader decarbonization strategy positions the MSA to lead in industrial climate innovation while protecting jobs and economic output in emissions-intensive sectors.

DESCRIPTION
By 2035, cities and counties will partner with hospitals, clinics, research labs, and medical suppliers to achieve a cumulative reduction of five (5) MTCO₂e of GHG emissions through deep efficiency and building electrification, refrigerant management, onsite renewables and storage, fleet electrification, and waste/ steam-sterilization optimization, reinforced by supplier standards. The City will support this with incentives, technical assistance, and streamlined permitting, and will require transparent measurement and annual public reporting to ensure accountability and resilience of patient care.
RESPONSIBLE PARTIES
LEAD: Designated Municipal or Regional Department, e.g., Office of Resilience and Sustainability
SUPPORTING: Alabama Maternal Health Task Force, UAB
ENCOURAGE HEALTHCARE INDUSTRY TO REDUCE FIVE (5) MTCO₂E OF GHG EMISSIONS BY 2035
STRATEGY
Work with individual healthcare facilities to plan and implement GHG reduction strategies as part of a broader effort to align the healthcare sector with regional climate goals. These strategies may include conducting facility-level energy audits, transitioning to electric or low-emission equipment, implementing sustainable procurement policies, and optimizing waste and water management. A key avenue for coordination and knowledge sharing is participation in the Alabama Maternal Health Task Force, which provides a collaborative platform to exchange best practices and promote environmentally responsible operations across healthcare institutions in the MSA. Through this engagement, healthcare providers can align public health goals with environmental stewardship, ultimately improving both patient outcomes and community resilience.

ENCOURAGE HEALTHCARE INDUSTRY TO REDUCE FIVE (5) MTCO₂E OF GHG EMISSIONS BY 2035
Target healthcare facilities with renewable energy projects which offers a strategic opportunity to reduce emissions and operational costs while improving grid stability. This is a crosscutting strategy from Measure 2A.5.
Participate in the Climate and Health Initiative which offers a critical opportunity to connect the implementation of the CACAP Toolkit with regional efforts to address the intersection of climate change and public health. This interdisciplinary program promotes research, education, and outreach focused on the health impacts of climate-related stressors such as extreme heat, air pollution, and natural disasters. By engaging with the initiative, stakeholders can share best practices and lessons learned from CACAP Toolkit implementation, helping to inform policies and practices that advance climate resilience and public health across the MSA. This collaboration will strengthen the region’s capacity to protect communities and integrate health considerations into broader climate planning.

Cities and counties will partner with rail operators, right-of-way owners, and community groups to rehabilitate 20 acres of rail-adjacent land using native revegetation, invasive removal, soil remediation, erosion control, and green-infrastructure features (bioswales, pollinator corridors, shade trees). Projects will prioritize segments near neighborhoods, stations, schools, and flood-prone areas, while meeting rail safety, access, and permitting requirements.
RESPONSIBLE PARTIES
LEAD: Designated Municipal or Regional Department, e.g., Office of Resilience and Sustainability
SUPPORTING:
ocal industry partners, economic development agencies
Restore degraded lands surrounding the rail line, including brownfields and deforested areas, which presents a critical opportunity to enhance carbon sequestration while revitalizing underutilized land within the MSA. This effort will begin by using tools such as the EPA’s Brownfields Mapping Tool to verify site eligibility for remediation funding and prioritize locations based on contamination status and redevelopment potential. Each site's carbon sequestration potential will be assessed through analysis of key factors such as soil type, parcel size, vegetation capacity, and hydrology to guide appropriate restoration strategies. Restoration will be implemented in phases, based on the complexity and environmental risk associated with each site, allowing for targeted investment, effective remediation, and measurable climate benefits over time. These projects will help reduce atmospheric carbon, improve ecosystem services, and support community health and resilience in areas historically impacted by industrial activity.
Implement idle-reduction technologies, electric cranes, and cleaner ground support equipment at yards and intermodal terminals which is a key strategy for reducing emissions, improving air quality, and advancing clean freight operations across the MSA. These upgrades can significantly cut fuel consumption and GHG emissions from dieselpowered equipment while improving operational efficiency. To support widespread adoption, the initiative will connect businesses with state and federal grant programs through a centralized one-stop-shop website, making it easier for operators to access funding and technical resources. Additionally, the region’s model TDM workbook will be expanded to include new criteria that award points for idle-reduction strategies, encouraging businesses to integrate low-emission practices into their daily operations and long-term sustainability plans.

The City has the authority to elevate this Task Force concept through its charter-backed powers to convene stakeholders, set strategic priorities, and formalize collaborative efforts. By issuing a resolution or mayoral directive, the City can give the Task Force public visibility and institutional legitimacy, positioning it as a trusted forum for sharing best practices and coordinating ideas across sectors. This official recognition allows the City to use its communication channels, partnerships, and convening power to attract participation, amplify success stories, and encourage broader adoption of innovative approaches identified by the group. IMPLEMENTATION OF
Implementation of this measure is projected to begin in 2026, with an estimated minimal duration of nine years depending on funding availability and building access. The timeline below outlines major tasks and key milestones as shown in Table W2.
Follow industry standards such as the SBTi
Adopt low-carbon logistics, partner with CCS vendors committed to ESG goals, and use green-certified raw materials
Participate in the Alabama Maternal Health Task Force to share best practices across the MSA
Participate in the Alabama Maternal Health Task Force to determine interest and provide an understanding of the cost
Share best practices from the implementation of the CACAP Toolkit to influence policy and practice toward climate resilience and public health in the MSA IMPLEMENTATION TIMELINES AND MILESTONES
MEASURE 18: INDUSTRY TASK FORCE
STRATEGY TIMELINE MILESTONES/ACTION
Use tools like EPA’s Brownfields Mapping Tool or state GIS layers to verify eligibility for remediation funding
18C.1 Restoring Lands 2027–2035
18C.2 Clean Freight Operations 2027–2035
Determine each site’s potential for carbon sequestration (e.g., based on soil type, size, and hydrology)
Plan for phased restoration depending on site risk and complexity
Connect businesses with state/federal grant programs through the one-stop- shop website
Expand TDM workbook to include points for idlereduction strategies

The MSA encompasses seven counties: Jefferson, Shelby, Walker, Blount, St. Clair, Bibb, and Chilton. Anchored by the City, the MSA includes a mix of urban, suburban, and rural communities, with varying landscapes.
Currently, there appears to be a lack of publicly available tracking or reporting related to key climate industry metrics in the MSA. This includes data such as GHG emissions, decarbonization efforts, or participation in voluntary climate disclosure frameworks within the oil and gas and healthcare industries. The absence of centralized metrics underscores the need for stronger coordination, data-sharing agreements, and transparent reporting systems to support climate action across the industries.
Progress on this measure will be evaluated through several key metrics, each of which is designed to be measurable and provide transparent tracking of project implementation:
Number of upgraded facilities adopting new technologies; Run site audits, offer incentives/financing, execute upgrade MOUs, and record completions in a public tracker
Metric tons of GHG emissions reduced per year; Set a baseline, require quarterly utility/fuel data, and publish verified annual reductions
% of sector market share committed to climate goals; Secure company pledges (or contract clauses), weight by output/employment, and report commitment share semiannually
Project completion date and commissioning of new furnace; Set contractual milestones, require third-party commissioning

MEASURE 18: INDUSTRY TASK FORCE
Table X2 shows the total quantified emission reductions as compared to BAU emissions for this measure.
Adoption of advanced technologies in the MSA's iron and steel sector presents an opportunity to reduce a portion of the MSA’s process emissions, which total approximately 174,000 MT CO₂e per year (EPA FLIGHT, Subpart Q 2023). A demonstration retrofit at a facility such as SMI Steel, which reports annual emissions of roughly 60,900 MT CO₂e, could reduce emissions by about 20% through measures such as electrified furnaces and waste heat recovery, saving approximately 12,200 MT CO₂e annually by 2030. This assumption is supported by the U.S. DOE’s Industrial Assessment Center findings that steel efficiency retrofits typically reduce direct emissions by 15–25% (DOE IAC 2022). Scaling these technologies to all four regional steel plants could achieve 26,000 MT CO₂e reductions annually by 2030 and nearly 35,000 MT CO₂e annually by 2050. Expanded application of advanced leak detection and repair (LDAR) practices in natural gas processing and distribution systems, which emit about 223,000 MT CO₂e annually (EPA FLIGHT, Subpart W 2023), can achieve 40% reductions in fugitive methane emissions (EPA Natural Gas STAR Program 2022), representing an additional 89,000 MT CO₂e annually by 2050.
Establishing emissions reduction standards, such as alignment with the Science Based Targets initiative (SBTi), can drive decarbonization in cement and lime manufacturing, which together emit approximately 3.95 million MT CO₂e annually in the MSA (EPA FLIGHT, Subpart H & S 2023). These emissions are primarily process-related, arising from calcination during clinker and lime production. Based on global benchmarks, SBTialigned companies typically commit to 10–15% reductions in emissions intensity by 2030 as part of a 1.5°C trajectory (SBTi 2023). If 50% of local cement and lime facilities adopt a 10% reduction pathway by 2030, annual reductions of about 197,000 MT CO₂e could be achieved. By 2050, broader adoption reaching 80% of facilities with a 15% reduction would yield approximately 366,000 MT CO₂e per year. These reductions would be achieved through process optimization, clinker substitution, and efficiency improvements, excluding facilities assumed to adopt CCS in order to prevent double counting.

18:
CCS is uniquely suited to reduce the process emissions from calcination in cement manufacturing, which cannot be eliminated through efficiency alone. One of the City’s largest cement plants, the National Cement facility, emits roughly 895,000 MT CO₂ annually (EPA FLIGHT, Subpart H 2023). Installing CCS at this site by 2040, with an assumed 70% capture efficiency, would avoid approximately 627,000 MT CO₂e annually by 2050. This assumption is based on performance ranges reported by the International Energy Agency (IEA 2021) and the Global CCS Institute (2023), which estimate typical capture efficiencies of 65–90% for cement kilns. This intervention would directly abate calcination process emissions, complementing but not overlapping with reductions from efficiency measures or standards, and represents the single most impactful opportunity for deep decarbonization in the local cement sector.
Reducing GHG emissions from healthcare facilities is achieved by conducting comprehensive energy audits, upgrading to efficient equipment, electrifying heating and sterilization systems, and adopting sustainable procurement and waste reduction policies. Based on the U.S. Commercial Buildings Energy Consumption Survey (CBECS 2018), healthcare buildings account for approximately 8.5 percent of national commercial sector energy use, a value applied to the MSA to estimate a baseline of 545,000 MT CO₂e annually. This strategy assumes phased reductions of 5 percent by 2025, 15 percent by 2030, and 30 percent by 2050 through efficiency improvements and electrification strategies consistent with EPA Portfolio Manager benchmarks and federal case studies of hospital energy retrofits. The resulting reductions amount to roughly 27,000 MT CO₂e/ year in 2025, 82,000 MT CO₂e/year in 2030, and 164,000 MT CO₂e/year in 2050. These reductions are distinct from renewable energy gains quantified in Measure 2A.5 to ensure methodological consistency and to avoid double counting.

18B.2
The deployment of renewable energy across healthcare institutions is treated as a subset of the broader renewable energy transition quantified in Measure 2A.5. Because hospitals are highly energy-intensive, their share of commercial sector demand is estimated at 8.5 percent based on CBECS data. Therefore, the emission reductions associated with renewable energy projects at healthcare facilities are calculated as 8.5 percent of the total commercial renewable energy reductions already captured in Measure 2A.5. This approach maintains alignment with the system-wide accounting framework and avoids overstating benefits. While the reductions are not reported separately here, attributing them within Measure 2A.5 ensures that healthcare contributions are represented proportionally to their share of energy use.
The Climate and Health Initiative provides an enabling platform to integrate the CACAP Toolkit into healthcare planning while aligning regional public health goals with climate resilience objectives. This strategy does not produce direct quantifiable GHG reductions but plays a critical role in advancing health-based adaptation strategies, supporting the exchange of best practices, and embedding climate considerations into public health research and outreach. By improving institutional readiness and resilience, the initiative indirectly strengthens the capacity of the healthcare sector to adopt emission reduction strategies and to protect populations from climate-related risks.

Restoring degraded lands along the rail line was quantified using land-based carbon sequestration rates derived from peer-reviewed literature and U.S. Forest Service guidance. An estimated 500 acres of brownfields and deforested parcels within the MSA were assumed available for restoration, with 70 percent reforested and 30 percent converted to native meadow or grassland. Reforestation rates were applied at 3.5 metric tons of CO₂ per acre per year, which falls at the midpoint of the U.S. range of 1.1 to 7.7 MTCO₂ per acre per year (Brown et al., 1999; USDA Forest Service urban forestry studies). Meadow restoration was applied at 1.8 MTCO₂ per acre per year based on U.S. grassland carbon estimates (EPA 2018). A survival and maintenance factor of 90 percent was applied to reflect long-term tree survival and management practices. Sequestration was phased in gradually, with projects reaching 40 percent of full potential by 2025, 80 percent by 2030, and full sequestration by 2050. Under these assumptions, the restoration program yields 538 MTCO₂e annually by 2025, increasing to 1,077 MTCO₂e in 2030 and 1,346 MTCO₂e in 2050. These reductions represent direct atmospheric carbon removals through vegetation growth and soil carbon accumulation on rehabilitated lands.

Emission reductions from clean freight operations were estimated by analyzing idle-reduction technologies, electrification of container-handling cranes, and replacement of diesel yard equipment with electric alternatives at regional freight terminals. For heavy-duty trucks, the analysis assumed 100 vehicles adopting idle-reduction systems that each avoid 1,000 hours of idling annually. Using a diesel fuel consumption rate of 0.8 gallons per hour and an emission factor of 10.21 kilograms of CO₂ per gallon (EPA MOVES and SmartWay guidance), these reductions amount to 817 MTCO₂e per year at full implementation. For intermodal yard operations, the analysis assumed five rubber-tired gantry (RTG) cranes, each consuming approximately 40,000 gallons of diesel annually. Electrification of these cranes reduces diesel use and replaces it with electric demand of 800 MWh per crane, yielding a net savings of 110 MTCO₂e per year when Alabama’s reported grid emission factor of 0.483 MTCO₂ per MWh is applied. Lastly, the replacement of 20 diesel yard tractors and top-handlers with electric models was modeled using baseline fuel use of 6,000 gallons per year per unit, resulting in a net savings of 980 MTCO₂e annually after accounting for electric consumption. Adoption rates were assumed to phase in to 40 percent by 2025, 80 percent by 2030, and 100 percent by 2050, producing estimated reductions of 763 MTCO₂e annually in 2025, 1,526 MTCO₂e in 2030, and 1,907 MTCO₂e in 2050.

The cost estimates are indicative only; they are based on preliminary assessments, comparisons with similar programs, and expert input and are meant to provide a rough order of magnitude evaluation as shown in Table Y2.
Costs vary widely, from a few thousand dollars per vehicle for idle-off systems to $10,000–$15,000 for onboard electrification retrofits (16 new equipment)

MEASURE 18: INDUSTRY TASK FORCE
Securing the necessary funding to effectively execute the CACAP Toolkit demands a range of funding strategies and avenues. An integral facet of this financial approach is identifying potential external funding sources, particularly for actions that require additional support. Recognizing that certain strategies might surpass the MSA's current resources, tapping into external funding becomes essential. Within this framework, specific funding sources are identified where known as shown in Table Z2.
PROGRAM
Community Development Block Grants
HUD Supports community-driven initiatives, such as convening task forces to tackle local challenges, develop plans, or coordinate services
Cities Idea Exchange Bloomberg Philanthropies
Local Technical Assistance
U.S. Economic Development Administration
Provides grants specifically for start-up costs of city-led initiatives, including task forces, along with technical support, site visits, and webinars to help cities adopt best practices from elsewhere
Helps fill knowledge gaps and enhance the decision-making capacity of local leaders in distressed communities, task forces convened for planning, outreach, or strategy development could benefit
Brownfields Program EPA Provides site assessment, cleanup grants, and technical support
Restoration and Enhancement Grant Program Federal Railroad Administration
Provides funding for restoration that supports rail safety or right-of-way improvements
Municipalities within the MSA
Municipalities within the MSA
Municipalities within the MSA
Municipalities within the MSA
Municipalities within the MSA
This CACAP Toolkit outlines a Toolkit for phased implementation across short, medium, and long-term timelines. It includes an expanded implementation framework that provides guidance on execution and monitoring. This framework incorporates critical elements such as implementation timelines, cost estimates, outlining projected financial requirements and underlying assumptions to aid in fiscal planning, and lead departments, responsible for guiding and carrying out specific initiatives. Additional details are included to support internal execution, covering lead agencies, priority levels, associated benefits, policy connections, and progress tracking.
While the specifics of individual initiatives are designed to remain adaptable, responding to shifting community priorities, evolving city departments and partner organizations, new legislative measures, and changing environmental factors, consistent and thorough monitoring will be key to realizing long-term objectives. As conditions evolve, the MSA aims to conduct regular assessments and evaluations. Additionally, a structured review and update process will be established to ensure the CACAP Toolkit remains a relevant and effective tool for advancing climate action and enhancing overall quality of life. Special attention will be given to prioritizing immediate actions that are essential for achieving measurable progress in the short and medium term. This comprehensive approach will serve as the operational blueprint for implementing the CACAP Toolkit effectively.

The Benefits Analysis section summarizes the expected benefits of the MSA’s priority GHG reduction measures, including associated co-pollutants. In alignment with EPA’s CPRG guidance, the analysis identifies how GHG mitigation strategies may also reduce emissions of criteria air pollutants (CAPs) such as nitrogen oxides (NOX), sulfur dioxide (SO₂), volatile organic compounds (VOCs), and fine particulate matter (PM2.5), along with select hazardous air pollutants (HAPs), where applicable. The GHG reduction initiatives are critical to improving local air quality and enhancing public health. Where possible, quantitative estimates of copollutant reductions have been provided using EPA-recommended tools such as Avoided Emissions and Reduction Tool AVERT and the National Emissions Inventory (NEI). In addition to co-pollutant reductions, this section analyzes the co-benefits and potential disbenefits to the broader community impacts associated with GHG emission reduction measures. Each measure was developed through stakeholder engagement and technical analysis to reflect the MSA’s unique environmental conditions, infrastructure limitations, cultural values, and implementation capacity. The benefits span four primary categories:
Public and Community Health
Energy Cost and Reliability
Workforce and Economic Development
Climate Resilience and Environmental Protection
Where applicable, disbenefits and implementation challenges are noted. These assessments are qualitative and are intended to guide prioritization, funding proposals, and stakeholder engagement during implementation.

The baseline year selected for the co-pollutant emissions analysis is 2020, consistent with EPA guidance for MSAs participating in the CPRG program. The EPA recommends the use of 2020 National Emissions Inventory (NEI) data as the standard reference point for establishing base year emissions, as it represents the most recent, comprehensive, and quality-assured dataset available at the time of planning. The 2020 NEI includes detailed, source-specific emissions estimates for both CAPs and HAPs across a wide range of sectors and allows for a reliable analysis of co-pollutant impacts from GHG reduction measures. To evaluate the GHG reduction potential of each measure, the baseline year for GHG emissions aligns with the year used for the MSA’s GHG inventories described in the GHG Inventory Section.
GHG measure implementation offers a wide range of benefits, such as cost savings and quality of life improvements. The CACAP Toolkit considers how each initiative can contribute to the broader goals of community wellbeing, economic resilience, environmental health, and operational efficiency. This section provides an overview of the primary benefits associated with each priority measure, helping to illustrate the full value of the measures beyond environmental impacts. These benefits can take many forms, such as improving public health through better air quality, lowering long-term utility costs through energy efficiency, increasing energy sovereignty by investing in local infrastructure, or creating new employment and training opportunities. Measures can also support long-term goals like enhancing community resilience to climate change or modernizing essential infrastructure for future generations. At the same time, successful implementation requires understanding and planning for potential barriers. These may include high upfront costs, technical complexity, behavior change requirements, or institutional capacity limits. By weighing the expected benefits against potential challenges, the MSA can prioritize investments that offer the greatest returns, both environmentally and socially.
Table A3 summarizes each priority measure, outlining its key benefits and any foreseeable disbenefits or barriers to implementation.
MEASURE
Measure 1A: Replace Fossil-fuelbased Systems in Selected Municipal owned Buildings and Operations with Electric Alternatives by 2031
Measure 1B: Promote Industrial Electrification in Ductile Iron Pipe Manufacturing starting in 2026
Measure 1C: Transition the Miller Steam Plant from Coal to Natural Gas by 2040
Measure 2A: Expand Solar Generation Across the MSA Through a Regional Bulk-Purchase Campaign, with a goal of 25 MW by 2030.
Measure 2B: Install Landfill Gas-toEnergy Systems at Two (2) Regional Landfills, by 2040
Major emissions reduction, cost savings healthy building standards, resilient operations
Major emissions reduction, cost savings healthy building standards, resilient operations
Major emissions reduction, cost savings healthy building standards, resilient operations
Cost savings, bundle projects of all sizes, commercial buildings not affected by the Capacity Reservation Charge, lower utility rate potential
Major emission reductions, improved air quality, cost effective
High capital cost, renovation disruption, utility/interconnection constraints, pace, acoustics, and aesthetics
Cost barriers, securing participation, need for technical training, and ongoing maintenance
Participation from Alabama Power
Measure 3: Execute a Regional Energy Efficiency Program for Residential and Commercial Buildings by 2030
Major emission reductions, lower utility bills, improved comfort, improved air quality, strengthen partnerships
Residential buildings affected by the Capacity Reservation Charge, Alabama Power restrictions, in some cases, higher utility rates
Upfront capital costs, gas generation unpredictable, utility purchase agreements may not guarantee favorable rates, risk of system leaks
Participation rate, renters, multifamily residents, and small businesses face split incentives, lower sales can prompt rate adjustments, poor design/ installation can underdeliver savings
Measure 4: Incorporate Smart Growth Principles into Zoning Codes and Future Land Use Planning in five (5) Municipalities by 2030
Measure 5: Transition to EV Infrastructure both at a Municipal and Community-wide level by 2035
Measure 6: Distribute 75 E-Bike Vouchers to Residents Annually
Reduced VMT, walkable cities, stronger local economies and access, affordability
Lower operating costs, cleaner, quieter operations, air quality & health, economic development
Affordability and access to jobs & services, first/last-mile connectivity, traffic & parking relief, health & well-being
Displacement & gentrification risk, construction & neighborhood impacts, urban heat/noise if poorly designed
High upfront capital, demand charges/peak rates, curb management conflicts, operational risk during outages
Upfront/ongoing costs for users, theft & security, infrastructure gaps
Measure 7: Write a TOD Corridor Plan that Targets an Increase in Transportation Connectivity, Dense Housing around the Bus Rapid Transit (BRT) system, and outlines a Pathway for Expanded Bike Lanes by 2031.
Measure 8: Implement a Regional VMT Reduction Program by 2028
Expand access to jobs, schools, and services, lower combined housing and transportation costs, housing supply and affordability gains
Can drive up nearby land rents, divert investment from neighborhoods not on the corridor, Savings rely on frequent, reliable transit
Measure 9: Reduce water usage within municipal operations 3% annually until 2030
Measure 10: Retrofit Wastewater Treatment Facilities with Renewable Energy and Energy-efficient Technologies, within the Jefferson County Environmental Services (JCES) portfolio of facilities, beginning with the Village Creek Water Reclamation Facility by 2035 and Develop a Program that would Facilitate other Infrastructure Owners to Convert to Renewable Energy by 2036
Measure 11: Expand Strict Stormwater Enforcement, Formalize Quarterly Riverkeeper Audits, Require Nature-based/flood-resilient Design, and begin Zoning to Eliminate Minimum Parking starting in 2026
Less congestion & more reliability, fewer severe crashes and injuries, lower fuel, maintenance, and parking costs, reduce chronic disease risks
Lower water and sewer bills, plus less energy for hot water and pumping
More reliable service, smarter equipment local air pollution, ratepayer relief from lower energy use, keeps treatment and pumping running during grid problems
Revenue losses for auto-oriented businesses, multi-jurisdiction coordination, new enforcement/ technology, and sustained funding; administrative burden can be high
Capital for retrofits, utility revenue declines can trigger rate adjustments, low-flow fixtures can mean longer rinse/fill times which erode savings
Big upfront costs that can pressure budgets and rates, smaller owners may lack matching funds or staff for implementation, new O&M skills needed for biogas controls and PV systems
Measure 12: Increase waste and recycling diversion by adopting a new Model Franchise Agreement by 2028 and launching a zero-waste campaign focused on procurement from 2026 to 2030
Reduce illicit discharges, cut peak runoff, increase infiltration, and cool heat-island hotspots, boost compliance, and build public trust, removing minimum parking requirements curbs overbuilt lots, shrinking runoff footprints
Reduced landfill methane, community education, improved aesthetics, and air quality
Administrative burden, poorly maintained nature-based features can clog, flood, or underperform, permeable pavements and bioswales require routine vacuuming, debris removal, and plant care, removing minimums without robust parking management can shift demand to nearby streets
Increased service fees, procurement standards could raise upfront costs for organizations, may create shortterm disruptions in service
Measure 13: Transform 500 Square Feet of Underutilized Spaces and Public Landscapes Annually into Natural Spaces using Native Landscaping; include Implementation Timeline in the Community Forestry Plan
Measure 14A: Establish 10 Fresh Food Distribution Locations annually across the MSA for the Next Five Years
More infiltration and less runoff/erosion, reduces heat island effect, greener, more attractive public spaces near homes, supports pollinators and urban wildlife
Access to fruits/vegetables supports healthier diets and lowers risk of diet-related diseases, supports regional farmers/wholesalers, colocating near BRT stops, schools, and libraries increases foot traffic and corridor vitality
Increase leaf-litter cleanup, raise irrigation needs during plant establishment, ongoing upkeep costs (weeding, pruning, trash removal)
Seasonal availability, delivery gaps, and perishables waste if demand is overestimated, competing with local grocers or farmers’ markets, food safety, temperature control
Measure 14B: Increase the Use of No-till farming to Manage Water Resources to Target Five Farms Annually across the MSA for the Next Five Years
Measure 14C: Work with the Alabama Farmers Federation to Target Education about the Negative Impacts of the Application of Biosludge to 10 farms annually across the MSA over the Next Five Years
Measure 15: Focus on three resilience initiatives to strengthen the MSA’s ability to respond to climate impacts by 2027
Better soil structure and residue cover increase infiltration, reduce runoff, and keep more moisture available to crops, less soil disturbance lowers nutrient and pesticide runoff, more microbial activity and earthworms
Avoid yield losses and soil problems, protect water quality, save money by preventing wasted inputs, improve crop results
Risk of resistance, and more slugs/rodents/insects in residue, transitional years can see uneven stands and lower yields, in wetter soils, no-till can raise N₂O emissions
Measure 16: Integrate Climate Action Management Systems across the MSA by 2027
Reduces vulnerabilities to extreme weather events, improves public safety and lowers emergency response costs, protects critical infrastructure (transportation, utilities, water, and energy systems)
Reduces duplication of efforts and ensures consistency in policies, reporting, and decisionmaking, improves regional resilience by aligning priorities across jurisdictions, enables evidence-based planning and prioritization of investments
Educating 10 farms per year touches a small share of producers, suppliers may view the program as adversarial, complicating partnerships, smaller or remote farms may be underrepresented due to travel, childcare, or language barriers
Communities may disagree on which three initiatives deserve focus, could prove more complex than anticipated, may discourage experimentation or innovation in other promising areas
Struggle to dedicate financial or technical resources, not all cities or counties will have the same readiness or staff expertise to adopt the system; If funding is not sustained, the system may degrade over time
Measure 17: Partner with workforce development efforts to attract new industries, develop career readiness, and eliminate wage discrimination
More attractive to new and expanding industries, aligns with emerging sectors such as clean energy, green infrastructure, and climate resilience jobs, ensures fair compensation across gender, race, and socioeconomic backgrounds
Risk of training workers for industries that don’t fully materialize in the region, employers may resist wage measures, risk of fragmentation if multiple entities pursue different priorities
Measure 18A: Encourage Steel and Gas Operations to reduce Five (5) MTCO₂e of GHG Emissions by 2035
Improves respiratory and cardiovascular health outcomes, reduces healthcare costs and improves overall quality of life, positions the region as an innovation hub for new technologies, spur new green jobs
Requires billions in investment, companies may push back, economic decline if workforce transition planning is not robust, households could face higher energy or product prices
Measure 18B: Encourage Healthcare Industry to reduce Five (5) MTCO₂e of GHG Emissions by 2035
Measure 18C: Restore 20 Acres of Degraded Lands Surrounding Rail Lines
Fewer pollution-related illnesses mean lower healthcare costs, Aligns the healthcare sector’s mission “do no harm” with its operations, lower operating costs for hospitals and clinics
Soils can capture and store carbon, reduces erosion, filters stormwater runoff, and improves groundwater recharge
May see declines in revenue from treating pollution-related illnesses, public health savings may take years to materialize, while providers must invest in emissions reduction upfront, risk criticism or accusations of greenwashing
Maintenance burden, redirect runoff in ways that unintentionally increase localized flooding, long lead time

Several of the MSA’s climate measures provide immediate public-health gains by cutting exposure to pollution and hardening essential services. Electrifying buildings, trucks, buses, and lawn equipment reduces tailpipe and combustion emissions that aggravate asthma and cardiovascular disease, especially for children, older adults, and neighborhoods near busy roads or industrial sites. Urban forestry, cool roofs, and shaded streets lower heat stress and related Emergency Room visits, while green stormwater infrastructure filters runoff, reduces flooding, and limits mold and waterborne illness after storms. Safer, low-stress bike/ped networks and traffic-calming reduce crashes and increase daily physical activity. Together, these actions improve air and water quality, enhance safety, and strengthen public health across the region.
Localizing community energy solar improves reliability by generating power close to where it’s used, reducing dependence on long transmission lines and single points of failure. Distributed solar can shave daytime peaks, especially during hot afternoons, easing stress on feeders and substations, cutting line losses, and lowering the risk of overload-related outages. Modern smart inverters also provide voltage support and grid services, helping stabilize local circuits and improve power quality. Geographic diversity across many small solar sites further smooths cloud-driven fluctuations, making the overall system more robust.

Each CACAP Toolkit measure serves as a driver of economic growth by creating jobs and strengthening workforce development. Construction and installation activities will generate local employment opportunities, while Measure 17 will stimulate demand for new technical skills and certifications, fostering pathways for upskilling and long-term career advancement. As the community builds greater expertise in managing infrastructure systems, the MSA will not only reduce reliance on outside contractors but also retain more economic value locally, reinforcing a sustainable cycle of investment, innovation, and capacity building.
Resilience and environmental stewardship are foundational values reflected in each measure. By upgrading energy and water infrastructure, the MSA reduces vulnerability to extreme weather, service interruptions, and environmental degradation. There are several measures that provide the most significant reductions in GHG emissions by transitioning away from natural gas, improving building efficiency. Measure 12 addresses one of the most impactful short-lived climate pollutants, methane, by diverting organic waste from landfills and strengthening community education and enforcement around waste practices. Collectively, these efforts contribute to the protection of the MSA’s forests, air, and water systems while aligning climate action with traditional values of land stewardship.
Table B3 provides a high-level summary of the benefits for each measure in each benefit category.
MEASURE
Measure 1A:
Replace Fossil-fuelbased Systems in Selected Municipal owned Buildings and Operations with Electric Alternatives by 2031
PUBLIC AND COMMUNITY HEALTH ENERGY RELIABILITY ECONOMIC DEVELOPMENT
Reduces air pollution, lowers respiratory and cardiovascular risks, and creates cleaner, quieter, and more resilient public spaces
Measure 1B:
Promote Industrial Electrification in Ductile Iron Pipe Manufacturing starting in 2026
Measure 1C: Transition the Miller Steam Plant from Coal to Natural Gas by 2040
Reduces air pollution from fossil fuel combustion, improving local air quality, and lowering risks of respiratory and cardiovascular diseases
Reduces air pollutants, leading to fewer respiratory and cardiovascular illnesses
Enables integration with renewables and backup storage, ensuring consistent power during outages or climaterelated disruptions
Creates jobs in clean energy installation and maintenance, reduces longterm operating costs, and attracts investment in sustainable infrastructure.
Enables integration with cleaner, more efficient power systems that can pair with renewables and grid management technologies to ensure consistent production
Drives investment in modern technologies, creating skilled jobs, and enhancing the industry’s long-term competitiveness in a low-carbon economy
Provides a more flexible and efficient power source that can quickly ramp up to meet demand and better integrate with renewable energy
Attracts investment in modern energy infrastructure, creating construction and maintenance jobs, and lowering long-term fuel and operational costs
CLIMATE RESILIENCE AND ENVIRONMENTAL PROTECTION
Reduces GHG emissions while ensuring critical facilities remain operational during extreme weather through cleaner, more adaptable energy systems.
Cuts GHG emissions, reducing reliance on fossil fuels, and minimizing harmful air pollutants that worsen climate and ecological risks
Measure 2A: Expand Solar Generation Across the MSA Through a Regional BulkPurchase Campaign, with a goal of 25 MW by 2030.
Reduces reliance on fossil fuels, lowering air pollution, and decreasing rates of respiratory and cardiovascular disease
Diversifies the power supply, reducing strain on the grid, and increasing local resilience during peak demand or outages
Creates local jobs in installation and maintenance, lowering long-term energy costs, and attracting clean energy investment to the region
Cuts GHG emissions, reducing harmful air pollutants, and lowering the environmental footprint of power generation while supporting cleaner regional energy systems
Reduces GHG emissions, decreasing dependence on fossil fuels, and providing distributed energy systems that withstand extreme weather disruptions
Measure 2B: Install Landfill Gas-toEnergy Systems at Two (2) Regional Landfills, by 2040
Captures harmful methane emissions, improving local air quality, and reducing odors and associated respiratory risks for nearby residents
Measure 3: Execute a Regional Energy Efficiency Program for Residential and Commercial Buildings by 2030
Measure 4: Incorporate Smart Growth Principles into Zoning Codes and Future Land Use Planning in five (5) Municipalities by 2030
Improves healthy communities by reducing indoor air pollution, lowering energy burdens, and creating safer, more comfortable living and working environments
Promotes walkable neighborhoods, reducing air pollution from vehicle use, and increasing access to green spaces and essential services
Provides a steady, locally generated power source that can operate independently of traditional fossil fuel supply chains
Creates green jobs, generating revenue from captured energy, and attracting investment in renewable infrastructure
CLIMATE RESILIENCE AND ENVIRONMENTAL PROTECTION
Turns waste into a reliable local energy source, reducing methane emissions, and spreading the region’s energy supply during disruptions
Enhances energy reliability by reducing overall demand, easing strain on the grid, and lowering the risk of outages during peak usage
Supports economic development by lowering utility costs, creating jobs in retrofitting and construction, and attracting investment in sustainable technologies
Reduces transportation and infrastructure energy demand, promoting compact development, and enabling more efficient utility and grid systems
Reduces vulnerability to energy price spikes, improving building performance during extreme weather, and lowering longterm operational risks
Measure 5: Transition to EV Infrastructure both at a Municipal and Community-wide level by 2035
Cuts tailpipe emissions, reducing air pollution, and lowering rates of asthma and other respiratory illnesses
Enables flexible charging management, integrating vehicleto-grid technologies, and spreading local energy storage capacity
Boosts economic development by attracting businesses and residents to vibrant, mixed-use areas, lowering infrastructure costs, and increasing longterm property values
Creates jobs in installation and maintenance, attracting clean technology investment, and lowering longterm transportation and fuel costs
Reduces exposure to climate hazards, supporting sustainable infrastructure, and fostering communities that can adapt more effectively to environmental and economic change
Reduces dependence on fossil fuels, supporting cleaner and more adaptable transportation systems, and enabling backup power options through vehicle-togrid technologies
Measure 6: Distribute 75 E-Bike Vouchers to Residents Annually
Promotes active transportation, reducing air pollution, and increasing access to affordable, clean mobility options
Lowers dependence on fossil fuels and decreasing overall demand for grid-powered transportation
Measure 7:
Write a TOD Corridor Plan that Targets an Increase in Transportation Connectivity, Dense Housing around the Bus Rapid Transit (BRT) system, and outlines a Pathway for Expanded Bike Lanes by 2031.
Measure 8:
Implement a Regional VMT Reduction Program by 2028
Reduces air pollution, encouraging active lifestyles, and enhancing access to essential services without car dependence
Reduces vehicle fuel demand, lowering overall transportation energy use, and enabling more efficient public transit operations
Reduces transportation costs for households, increasing access to jobs and services, and stimulating local demand for bike sales, repair, and maintenance
Attracts investment, boosting property values, reducing transportation costs, and creating vibrant, business-friendly communities
CLIMATE RESILIENCE AND ENVIRONMENTAL PROTECTION
Provides affordable, low-emission transportation that reduces dependence on volatile fuel markets and keeps mobility options available during energy or transit disruptions
Reduces reliance on single-occupancy vehicles, adding mobility options, and fostering compact communities better able to adapt to climate and economic disruptions
Measure 9:
Reduce water usage within municipal operations 3% annually until 2030
Reduces air pollution, encourages active transportation, and lowers risks of respiratory and cardiovascular diseases associated with vehicle emissions
Lowers overall fuel and electricity demand from transportation, easing strain on energy systems, and making the region less exposed to supply disruptions
Reduces transportation costs for households and businesses, improving access to jobs and services, and stimulating investment in transit and active mobility infrastructure
Adds transportation options, reducing dependence on volatile fuel supplies, and lowering vulnerability to climate and economic disruptions
Conserves clean water supplies, reducing strain on treatment systems, and ensuring more reliable access to safe drinking water
Lowers the energy demand needed for water treatment and distribution, easing pressure on local energy systems
Lowers utility costs, freeing resources for community investments, and promoting a sustainable business environment that attracts growth
Conserves critical resources, reducing vulnerability to droughts, and ensuring municipal services remain reliable under future climate stresses
Measure 10: Retrofit Wastewater Treatment Facilities with Renewable Energy and Energy-efficient Technologies, within the Jefferson County Environmental Services (JCES) portfolio of facilities, beginning with the Village Creek Water Reclamation Facility by 2035 and Develop a Program that would Facilitate other Infrastructure Owners to Convert to Renewable Energy by 2036
Measure 11: Expand Strict Stormwater Enforcement, Formalize Quarterly Riverkeeper Audits, Require Naturebased/flood-resilient Design, and begin Zoning to Eliminate Minimum Parking starting in 2026
Measure 12:
Increase waste and recycling diversion by adopting a new Model Franchise Agreement by 2028 and launching a zero-waste campaign focused on procurement from 2026 to 2030
PUBLIC AND COMMUNITY HEALTH ENERGY RELIABILITY ECONOMIC DEVELOPMENT
Reduces air pollution, lowering GHG emissions, and ensuring cleaner, more reliable water services
Reduces dependence on fossil fuels, lowering operational vulnerabilities, and ensuring critical water services remain reliable during grid disruptions
Cuts long-term utility costs, creating clean energy jobs, and attracting investment in sustainable infrastructure
CLIMATE RESILIENCE AND ENVIRONMENTAL PROTECTION
Ensures essential water services can operate independently during power disruptions and adapt more effectively to climate and energy uncertainties
Prevents polluted runoff, reducing flood-related health risks, and increasing access to cleaner, more sustainable public spaces
Protects infrastructure from flood damage, reducing strain on stormwater pumping systems, and promoting more efficient land use that lowers overall energy demand
Reduces costly flood damages, lowering infrastructure maintenance expenses, and attracting investment through more efficient, climate-ready land use
Reduces flood vulnerability, protecting critical infrastructure, and enabling communities to better adapt to climaterelated stresses
Preserves natural areas, reducing habitat destruction from landfills, and protecting soil and water quality from waste-related contamination
Reduces the energy needed for raw material extraction and manufacturing, while promoting circular systems that lower overall regional energy demand
Creates green jobs in recycling and reuse industries, lowering disposal costs, and stimulating markets for sustainable products and services
Reduces landfill dependence, conserving natural resources, and building more sustainable material systems that can better withstand supply chain disruptions
Measure 13: Transform 500 Square Feet of Underutilized Spaces and Public Landscapes Annually into Natural Spaces using Native Landscaping; include Implementation Timeline in the Community Forestry Plan
Measure 14A: Establish 10 Fresh Food Distribution Locations annually across the MSA for the Next Five Years
Enhances air quality, reducing heat stress, and providing accessible green areas that support physical and mental well-being
Reduces urban heat island effects, lowering cooling demands, and improving overall energy efficiency in surrounding areas
Increases property values, attracting investment through improved community aesthetics, and creating jobs in landscaping, maintenance, and green infrastructure
CLIMATE RESILIENCE AND ENVIRONMENTAL PROTECTION
Improves stormwater management, reducing flood and heat risks, and creating ecosystems that adapt to changing climate conditions
Measure 14B: Increase the Use of No-till farming to Manage Water Resources to Target Five Farms Annually across the MSA for the Next Five Years
Increases access to nutritious foods, reducing dietrelated illnesses, and addressing food insecurity
Reduces agricultural runoff, protecting drinking water quality, and lowering exposure to pollutants that can cause respiratory and gastrointestinal illnesses
Shortens supply chains, reducing transportation fuel use, and promoting more efficient, localized food distribution systems
Creates jobs, stimulating local agriculture and food businesses, and keeping more food-related revenue within the regional economy
Lowers fuel and equipment energy use in farming operations and reducing the energy needed for water pumping and irrigation
Lowers farm operating costs, improving long-term soil productivity, and strengthening the competitiveness of local agriculture
Builds localized food networks, reducing dependence on distant supply chains, and ensuring reliable access to healthy food during disruptions or emergencies
Improves soil health, enhancing water retention during droughts, and reducing erosion and crop losses during extreme weather events
Measure 14C: Work with the Alabama Farmers Federation to Target Education about the Negative Impacts of the Application of Biosludge to 10 farms annually across the MSA over the Next Five Years
Protects soil and water quality, reducing potential contamination of food sources, and safeguarding public health from harmful agricultural practices
Prevent inefficient farming practices that increase energy use and promote more sustainable soil management that reduces energy demand in agricultural operations
Helps farmers avoid costly soil degradation, protecting longterm crop yields, and sustaining the agricultural sector’s contribution to the regional economy
Promotes sustainable soil management practices, protecting water resources, and ensuring farms remain productive under changing climate conditions
Measure 15: Focus on three resilience initiatives to strengthen the MSA’s ability to respond to climate impacts by 2027
Reduces climaterelated health risks, protecting clean air and water, and ensuring safer living conditions during extreme weather events
Reduces pollution from fossil fuels, protecting critical infrastructure from disruptions, and ensuring residents have consistent access to clean, reliable power during climaterelated events
Reduces public health costs from climate-related illnesses, creating local jobs in resilience projects, and attracting investment through a safer, more sustainable regional economy
CLIMATE RESILIENCE AND ENVIRONMENTAL PROTECTION
Safeguards residents from extreme weather risks, protecting vital services like water and energy, and building community capacity to recover quickly from climaterelated disruptions
Measure 16: Integrate Climate Action Management Systems across the MSA by 2027
Measure 17: Partner with workforce development efforts to attract new industries, develop career readiness, and eliminate wage discrimination
Reduces emissions, improving air quality, strengthening resilience, and ensuring access to sustainable resources and infrastructure
Expands job opportunities, reducing income inequality, and strengthening economic stability.
Streamlines regional planning, optimizing energy use, and strengthening grid resilience against growing climate and demand pressures
Drives clean energy investments, creating green jobs, reducing operational cost
Prepares a skilled workforce to maintain, operate, and modernize energy infrastructure effectively
Attracts new industries, creating skilled jobs, and boosting the region’s competitiveness and long-term growth
Coordinates regional strategies to reduce emissions, strengthen infrastructure, and prepare communities for extreme weather and other climaterelated risks
Measure 18A: Encourage Steel and Gas Operations to reduce Five (5) MTCO₂e of GHG Emissions by 2035
Improves air quality, reducing pollution-related health risks, and creating a cleaner, safer environment for residents
Promotes cleaner, more efficient energy use and encouraging resilient industrial energy practices
Drives innovation, attracting cleantech investments, and creating green jobs in low-carbon industries
Builds a skilled labor force capable of responding to disruptions, adapting infrastructure, and sustaining critical services during economic, environmental, or energy-related challenges
Strengthens industrial systems, reducing vulnerability to energy disruptions, and enhancing the capacity to adapt to climate impacts
Measure 18B:
Encourage Healthcare Industry to reduce Five (5) MTCO₂e of GHG Emissions by 2035
PUBLIC AND COMMUNITY HEALTH ENERGY RELIABILITY ECONOMIC DEVELOPMENT
Lowers pollution, improving air quality, and promoting a cleaner environment that directly benefits public health
Measure 18.C: Restore 20 Acres of Degraded Lands Surrounding Rail Lines
Improves air and water quality, increasing green space, reducing urban heat, and creating safer, more aesthetically pleasing environments for nearby residents
Promotes more efficient energy use and resilient infrastructure in hospitals and healthcare facilities
Stabilizes soil and vegetation, reducing erosion and flood risks that can disrupt rail-based energy transport and infrastructure
Drives investments in energy-efficient technologies, creating green jobs, and fostering a more sustainable healthcare sector
Enhances property values, attracting investment, and creating jobs in land restoration and maintenance
CLIMATE RESILIENCE AND ENVIRONMENTAL PROTECTION
Strengthens facility infrastructure, ensuring reliable operations during disruptions, and enhancing the sector’s ability to withstand climaterelated challenges
Improves natural buffers against flooding and erosion, enhancing ecosystem health, and reducing vulnerability to climate-related disruptions

To maintain a balanced and actionable perspective, it is important to recognize that each GHG reduction measure presents not only benefits but also potential implementation challenges. These disadvantages, ranging from high upfront costs and technical complexity to community engagement fatigue, can influence timelines, budgets, and operational capacity. With thoughtful identification of disbenefits, planning, and proactive mitigation strategies, these barriers can be effectively managed or minimized. Table C3 outlines key anticipated disbenefits for each measure along with proposed strategies to address them to help with successful implementation.
Measure 1A: Replace Fossilfuel-based Systems in Selected Municipal owned Buildings and Operations with Electric Alternatives by 2031
High capital cost, renovation disruption, utility/interconnection constraints, pace, acoustics, and aesthetics
Measure 1B: Promote Industrial Electrification in Ductile Iron Pipe Manufacturing starting in 2026
Cost barriers, securing participation, need for technical training, and ongoing maintenance
Manage bills & demand, improve envelopes to shrink loads and equipment size, run total-cost-ofownership analyses, stack utility rebates, grants, and low-cost financing (e.g., ESCO/energy-savings performance contracts)
Prioritize electrification of high-energy processes first, then scale up as savings accrue, partner with large buyers (e.g., water utilities, municipalities) to create market demand for low-carbon ductile iron pipes
Measure 1C: Transition the Miller Steam Plant from Coal to Natural Gas by 2040
Measure 2A: Expand Solar Generation Across the MSA Through a Regional BulkPurchase Campaign, with a goal of 25 MW by 2030.
Measure 2B Install Landfill Gasto-Energy Systems at Two (2) Regional Landfills, by 2040
Participation from Alabama Power
Measure 3: Execute a Regional Energy Efficiency Program for Residential and Commercial Buildings by 2030
Residential buildings affected by the Capacity Reservation Charge, Alabama Power restrictions, in some cases, higher utility rates
Encourage Alabama Power to issue green bonds or seek low-interest financing, Push the Alabama Public Service Commission to require long-term decarbonization plans as part of utility filings, mobilize large institutional and municipal customers to support
Provide on-Bill Financing, offer targeted rebates, work with the PSC,
Measure 4: Incorporate Smart Growth Principles into Zoning Codes and Future Land Use Planning in five (5) Municipalities by 2030
Upfront capital costs, gas generation unpredictable, Utility purchase agreements may not guarantee favorable rates, risk of system leaks
Participation rate, renters, multifamily residents, and small businesses face split incentives, lower sales can prompt rate adjustments, poor design/ installation can underdeliver savings
Displacement & gentrification risk, construction & neighborhood impacts, urban heat/noise if poorly designed
Issue green bonds, begin as a pilot, negotiate performance-based PPAs, use captured gas onsite to reduce dependence on utility rates
Low interest loans, green leases and owner-tenant benefit-sharing addenda, Pre-qualify contractors
Affordable housing, phased infrastructure funding, targeted investments in neighborhoods, embedded green, heat-safe design, managed parking and mobility.
Measure 5:
Transition to EV Infrastructure both at a Municipal and Community-wide level by 2035
Measure 6:
Distribute 75 E-Bike Vouchers to Residents Annually
Measure 7:
Write a TOD Corridor Plan that Targets an Increase in Transportation Connectivity, Dense Housing around the Bus Rapid Transit (BRT) system, and outlines a Pathway for Expanded Bike Lanes by 2031.
Measure 8: Implement a Regional VMT Reduction Program by 2028
High upfront capital, demand charges/peak rates, curb management conflicts, operational risk during outages
Upfront/ongoing costs for users, theft & security, infrastructure gaps
Can drive up nearby land rents, divert investment from neighborhoods not on the corridor, Savings rely on frequent, reliable transit
Bundle sites for bulk pricing, deploy smart charging: power sharing, “EV only while charging,” idle fees, and strong enforcement, provide compliant backup and prewire for future microgrid
Offer annual maintenance credits, pair vouchers with zero-interest payment plans, add on-street bike corrals in commercial areas
Property-tax relief for homeowners, small business grants/longer leases, dedicate a fixed share of corridor funds to off-corridor projects, guarantee service levels; add bus lanes
Measure 9:
Reduce water usage within municipal operations 3% annually until 2030
Measure 10:
Retrofit Wastewater Treatment Facilities with Renewable Energy and Energy-efficient Technologies, within the Jefferson County Environmental Services (JCES) portfolio of facilities, beginning with the Village Creek Water Reclamation Facility by 2035 and Develop a Program that would Facilitate other Infrastructure Owners to Convert to Renewable Energy by 2036
Revenue losses for auto-oriented businesses, multi-jurisdiction coordination, new enforcement/ technology, and sustained funding; administrative burden can be high
Capital for retrofits, utility revenue declines can trigger rate adjustments, low-flow fixtures can mean longer rinse/fill times which erode savings
Big upfront costs that can pressure budgets and rates, smaller owners may lack matching funds or staff for implementation, new O&M skills needed for biogas controls and PV systems
Adopt an MSA-wide agreement for shared assets and enforcement; attract new EV industry or train current workforce on EV maintenance, MPOled program office: one hub for analytics, procurement, legal templates, and public engagement
Use rebates, grants, and low-cost financing, start with quick wins (leaks, high-use fixtures), then reinvest savings (Green Revolving Fund), shift some charges to fixed fees
Use third-party PPA, dedicate a small capital recovery surcharge, provide shared grant writing, owner’s engineering, procurement templates, standardize designs and bulk-buy to cut unit costs
Measure 11:
Expand Strict Stormwater Enforcement, Formalize Quarterly Riverkeeper Audits, Require Nature-based/floodresilient Design, and begin Zoning to Eliminate Minimum Parking starting in 2026
Measure 12:
Increase waste and recycling diversion by adopting a new Model Franchise Agreement by 2028 and launching a zero-waste campaign focused on procurement from 2026 to 2030
Measure 13:
Transform 500 Square Feet of Underutilized Spaces and Public Landscapes Annually into Natural Spaces using Native Landscaping; include Implementation Timeline in the Community Forestry Plan
Measure 14A:
Establish 10 Fresh Food Distribution Locations annually across the MSA for the Next Five Years
Measure 14B:
Increase the Use of No-till farming to Manage Water Resources to Target Five Farms
Annually across the MSA for the Next Five Years
Administrative burden, poorly maintained nature-based features can clog, flood, or underperform, permeable pavements and bioswales require routine vacuuming, debris removal, and plant care, removing minimum requirements without robust parking management can shift demand to nearby streets
Increased service fees, procurement standards could raise upfront costs for organizations, may create shortterm disruptions in service
Dedicate a portion of stormwater fees or developer fees to staffing, design for easy cleaning, assign a clear owner, schedule inspections, add priced/ time-limited curb parking with real enforcement
Increase leaf-litter cleanup, raise irrigation needs during plant establishment, Ongoing upkeep costs (weeding, pruning, trash removal)
Design franchise agreements with pricing that rewards high diversion rates, integrate route optimization, use penalties on contamination to offset collection costs, gradually introduce procurement standards to allow time for market adjustment
Install drip irrigation with timers/ moisture sensors, choose droughttolerant natives, Establish adopt-a-block programs
Seasonal availability, delivery gaps, and perishables waste if demand is overestimated, competing with local grocers or farmers’ markets, food safety, temperature control
Risk of resistance, and more slugs/rodents/insects in residue, transitional years can see uneven stands and lower yields, in wetter soils, no-till can raise N₂O emissions
Use pre-orders/subscriptions (CSA box), compliment grocers by location new locations in food-desert gaps, partner with the Food Bank to provide funding for refrigeration
Improve drainage, rotate crops and select resistant/tolerant varieties, plant a bit later or use earlier-maturity seeds
Measure 14C:
Work with the Alabama Farmers Federation to Target Education about the Negative Impacts of the Application of Biosludge to 10 farms annually across the MSA over the Next Five Years
Measure 15:
Focus on three resilience initiatives to strengthen the MSA’s ability to respond to climate impacts by 2027
Educating 10 farms per year touches a small share of producers, suppliers may view the program as adversarial, complicating partnerships, smaller or remote farms may be underrepresented due to travel, childcare, or language barriers
Communities may disagree on which three initiatives deserve focus, could prove more complex than anticipated and may discourage experimentation or innovation in other promising areas
Measure 16:
Integrate Climate Action Management Systems across the MSA by 2027
Measure 17:
Partner with workforce development efforts to attract new industries, develop career readiness, and eliminate wage discrimination
Measure 18A:
Encourage Steel and Gas Operations to reduce Five (5) MTCO₂e of GHG Emissions by 2035
Measure 18B:
Encourage Healthcare Industry to reduce Five (5) MTCO₂e of GHG Emissions by 2035
Train-the-trainer with Federation county reps, publish simple, crop-specific one-pagers, mobile workshops, rotate locations, share results through county meetings and ag media
Measure 18C: Restore 20 Acres of Degraded Lands Surrounding Rail Lines
Struggle to dedicate financial or technical resources, not all cities or counties will have the same readiness or staff expertise to adopt the system; If funding is not sustained, the system may degrade over time
Risk of training workers for industries that don’t fully materialize in the region, employers may resist wage measures, risk of fragmentation if multiple entities pursue different priorities
Requires billions in investment, companies may push back, economic decline if workforce transition planning is not robust, households could face higher energy or product prices
May see declines in revenue from treating pollution-related illnesses, public health savings may take years to materialize, while providers must invest in emissions reduction upfront, risk criticism or accusations of greenwashing
Maintenance burden, redirect runoff in ways that unintentionally increase localized flooding, long lead time
Establish a “watch list” of secondary risks (drought, air quality, biodiversity), one Prioritize initiative that delivers short-term “quick wins” (cooling centers), Frame as Phase 1 (2026–2027) of a longer roadmap with flexibility to add new priorities.
Follow the Toolkit, apply collectively for regional grants, develop public private partnership to leverage resources
Design programs that teach transferable, cross-sector skills, start with small-scale training initiatives tied to confirmed employer commitments before scaling up, offer tax credits for compliance, launch Task Force
Climate funds, green bonds, and private capital, tie subsidies, tax breaks, and procurement contracts to emissions reduction commitments
Position healthcare systems to grow services in wellness, preventive care, and telehealth, implement over time to spread costs, co-finance major infrastructure upgrades
Establish “adopt-an-acre” program, use graded swales and retention basins to redirect excess runoff, publicize early indicators of success
A critical dimension of evaluating GHG reduction measures is understanding their financial performance and emissions reduction potential over time. However, it is essential to recognize that these financial metrics, while valuable, do not capture the full scope of a measure’s impact, particularly when it comes to infrastructure resilience, foundational capacity building, and longterm public value. These foundational investments often unlock opportunities for subsequent emissions reductions and system-level efficiencies not directly quantified in traditional cost-benefit frameworks. In that context, each measure’s GHG reduction potential should also be considered alongside its financial and strategic role in the broader climate action framework. Measures that show high emissions reductions over time carry long-term environmental benefits that compound even if their initial financial performance is less favorable or their benefits are realized over longer time horizons. To support a balanced, multi-criteria decision-making approach, Table D3 below presents the projected emissions reductions for each priority measure, covering near- and long-term planning horizons.

In addition to GHG reductions, CACAP Toolkit measures can also lead to the reduction of various air pollutants that pose direct risks to human health and the environment. These co-pollutants are released during the combustion of fossil fuels and the degradation of organic waste, and they include criteria pollutants and toxic air contaminants such as nitrogen oxides (NOX), carbon monoxide (CO), particulate matter (PM), total organic compounds (TOC), ammonia (NH₃), sulfur dioxide (SO₂), and heavy metals. This section evaluates the co-benefits of the MSA’s measures by quantifying estimated reductions in co-pollutants across the electricity, propane, and waste sectors. All six mitigation measures modeled for the CACAP Toolkit contribute to reductions in these pollutants, reinforcing the public health and environmental benefits of the MSA’s broader sustainability goals. Table E3 identifies the co-pollutants included in the analysis and specifies which pollutants were modeled for each mitigation measure (e.g., NOX from propane combustion, PM from solid waste incineration). The technical analysis can be found as Appendix E.
1-Methylnaphthalene
1-Methylphenanthrene
1,1,2-Trichloroethane
1,1,2,2-Tetrachloroethane
1,2,4-Trichlorobenzene
2,2,4-Trimethylpentane

The trajectory of co-pollutant reductions mirrors the GHG reduction modeling used in this plan. As GHG emissions decrease over time, due to transitions to cleaner energy sources, electrification of buildings, and diversion of organic waste from landfills, associated co-pollutants also decline. Most pollutants follow a declining trajectory through 2049, especially where transitions to carbon-free electricity and clean technologies are complete. Table F3 presents the estimated reductions in co-pollutants associated with all co-pollutants within the MSA. Results are shown for the years 2035 and 2050, reflecting the long-term progression of electrification measures that reduce propane use in buildings and equipment. Among the pollutants analyzed, NOX is the dominant copollutant emitted from propane combustion, followed by CO, total organic compounds TOC, and PM. The data show that reductions in each of these pollutants approximately double from 2035 to 2050, due to continued implementation of electrification strategies that reduce propane consumption over time.
The CACAP Toolkit measures provide a wide spectrum of benefits that reach far beyond GHG reductions. As shown throughout this section, these initiatives contribute to improved public health, increased energy affordability and reliability, enhanced workforce development, and greater climate resilience. While each measure has distinct strengths, their true value emerges when viewed as interconnected components of a broader strategy for MSA sustainability, and resilience.
It is important to note that the financial viability, environmental impact, and social benefits of these measures should not be evaluated in isolation. While some investments may show clear returns through energy savings, others may not offer immediate cost savings or high emissions reductions on paper. However, they represent critical infrastructure upgrades that enable long-term system resilience, protect public health, and support future climate mitigation strategies that are not directly quantified in this analysis. This approach to evaluating benefits highlights that implementation decisions reflect not only technical performance or financial payback, but also community priorities and long-term climate resilience. Table G3 summarizes each measure’s performance across key criteria, which should be considered during implementation planning and prioritization.
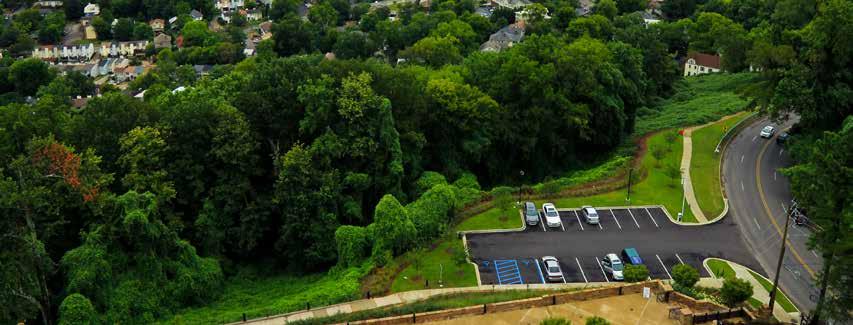

The workforce planning analysis has been developed to identify and align the essential job roles needed to implement the measures outlined in the CACAP Toolkit. The primary objective of this analysis is to create a clear roadmap of workforce needs, define the essential occupations needed to fulfill the measures, and bridge necessary gaps in the workforce through creating or leveraging training pipelines that are available through potential partnerships at the local, state, and national level.
This process was informed by direct engagement with city leadership, local job boards, and key stakeholders, whose insights helped shape a deeper understanding of the MSA’s current workforce landscape. Through collaborative discussions, we identified existing workforce capacities, pinpointed critical staffing gaps, and highlighted local and regional partnerships that can help bridge those gaps.
This analysis not only outlines a workforce development pathway to meet the current climate action measures but also lays the foundation for the MSA to cultivate a skilled workforce. In doing so, it supports long-term environmental progress and strengthens the region’s overall economic development.
Through comprehensive analysis of the CACAP Toolkit measures and stakeholder meetings, the project team identified the key roles required to implement each strategy by aligning technical requirements with corresponding job functions. The project team assessed the MSA’s current workforce capacity by evaluating existing personnel and estimating future demand across measures. Table H3 serves as both a workforce inventory and a forecasting tool to guide recruitment, training, and investment. By addressing these gaps through targeted hiring and strengthened partnerships, the MSA will be well-positioned to achieve its climate goals in an effective manner.
Key Measures to be executed by each role.
Measure 1. Electrification
The occupations needed to execute the associated measures effectively.
• Renewable Energy Systems Manager
• Renewable Energy Installation and Maintenance Technician
• Infrastructure and Environmental Engineer
• Electrical and Mechanical Engineer
• Land Use and Mobility Planner
• Environmental and Energy Compliance Analyst
• Policy and Incentives Coordinator
Measure 2. Renewable Energy
Measure 3. Energy Efficiency
Measure 4. Land Use Development
Measure 5. Fleet Electrification
Measure 6. Electric Bike Voucher Program
• Policy and Incentives Coordinator
• Infrastructure and Environmental Engineer
• Renewable Energy Systems Manager
• Outreach and Engagement Lead
• Renewable Energy Installation and Maintenance Technician
• Environmental Engineers
• Agricultural Technical Specialist
• Facilities and Charging Infrastructure Manager
• Green Construction and Maintenance Crews
• Renewable Energy Systems Manager
• Outreach and Engagement Lead
• Planning Director
• Municipal Attorney
• Infrastructure and Environmental Engineer
• Outreach and Engagement Lead
• Land Use and Mobility Planner
• Policy and Incentives Coordinator
• Green Construction and Maintenance Crews
• Renewable Energy Systems Manager
• Infrastructure and Environmental Engineer
• Fleet Electrification Program Manager
• Facilities and Charging Infrastructure Manager
• Automotive Technicians (EV Specialized)
• Outreach and Engagement Lead
• Land Use and Mobility Planner
• Environmental and Energy Compliance Analyst
• Policy and Incentives Coordinator
• Outreach and Engagement Lead
• Land Use and Mobility Planner
• Senior Transit Planner
• Environmental and Energy Compliance Analyst
• Policy and Incentives Coordinator
Key Measures to be executed by each role.
Measure 7. Transportation Oriented Development Area Planning
The occupations needed to execute the associated measures effectively.
• Infrastructure and Environmental Engineer
• Land Use and Mobility Planner
• Senior Transit Planner
• Green Construction and Maintenance Crews
• Urban Greening Specialist
• Environmental and Energy Compliance Analyst
Measure 8. Vehicle Miles Traveled Reductions
Measure 9. Water Reduction
Measure 10. Wastewater
Measure 11. Stormwater
Measure 12. Increase Waste and Recycling
• Infrastructure and Environmental Engineer
• Fleet Electrification Program Manager
• Facilities and Charging Infrastructure Manager
• Outreach and Engagement Lead
• Land Use and Mobility Planner
• Green Construction and Maintenance Crews
• Urban Greening Specialist
• Environmental and Energy Compliance Analyst
• Policy and Incentives Coordinator
• Renewable Energy Systems Manager
• Infrastructure and Environmental Engineer
• Green Construction and Maintenance Crews
• Urban Greening Specialist
• Policy and Incentives Coordinator
• Water Efficiency and Rebate Coordinator
• Renewable Energy Systems Manager
• Renewable Energy Installation and Maintenance Technician
• Infrastructure and Environmental Engineer
• Green Construction and Maintenance Crews
• Environmental and Energy Compliance Analyst
• Infrastructure and Environmental Engineer
• Outreach and Engagement Lead
• Land Use and Mobility Planner
• Urban Greening Specialist
• Environmental and Energy Compliance Analyst
• Municipal Attorney
• Infrastructure and Environmental Engineer
• Outreach and Engagement Lead
• Waste Reduction and Innovation Specialist
• Environmental and Energy Compliance Analyst
• Policy and Incentives Coordinator
• Green Construction and Maintenance
Key Measures to be executed by each role.
Measure 13. Open Space Utilization
The occupations needed to execute the associated measures effectively.
• Infrastructure and Environmental Engineer
• Outreach and Engagement Lead
• Land Use and Mobility Planner
• Green Construction and Maintenance Crews
• Urban Greening Specialist
• Environmental and Energy Compliance Analyst
• Policy and Incentives Coordinator
Measure 14. Agricultural Food Systems
Measure 15. Climate Resiliency
Measure 16. Climate Action Management Systems
Measure 17. Workforce Development
Measure 18. Task Force
• Renewable Energy Systems Manager
• Renewable Energy Installation and Maintenance Technician
• Infrastructure and Environmental Engineer
• Urban Greening Specialist
• Agricultural Technical Specialist
• Food Systems Access Coordinator
• Green Workforce Development Manager
• Environmental and Energy Compliance Analyst
• Policy and Incentives Coordinator
• Renewable Energy Systems Manager
• Infrastructure and Environmental Engineer
• Outreach and Engagement Lead
• Land Use and Mobility Planner
• Water Efficiency and Rebate Coordinator
• Urban Greening Specialist
• Outreach and Engagement Lead
• Green Workforce Development Manager
• Environmental and Energy Compliance Analyst
• Policy and Incentives Coordinator
• Green Workforce Development Manager
• Policy and Incentives Coordinator
• Infrastructure and Environmental Engineer
• Environmental and Energy Compliance Analyst
• Policy and Incentives Coordinator
• Electrical and Mechanical Engineer
• Green Construction and Maintenance Crews
• Fleet Electrification Program Manager
• Green Workforce Development Manager
• Facilities and Charging Infrastructure Manager
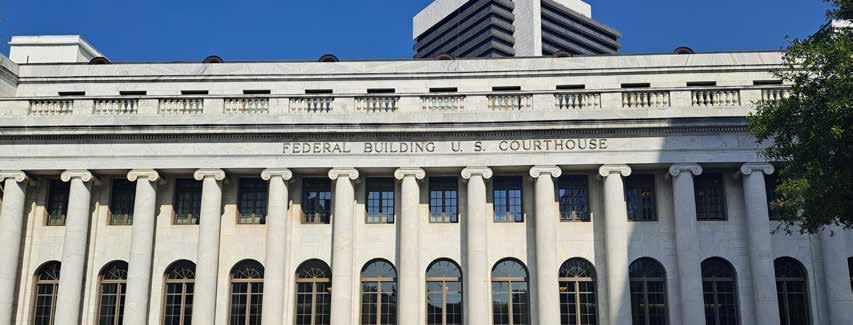
Table I3 outlines the priority occupations and their responsibilities necessary to successfully implement the MSA’s CACAP Toolkit. Each role contributes to advancing key climate strategies in areas such as renewable energy, green construction, sustainable transportation, and environmental compliance. Defining these responsibilities provides a clear roadmap for workforce planning, training, and alignment with regional labor needs.
ROLE CORE RESPONSIBILITIES
Renewable Energy Systems Manager
Renewable Energy Installation and Maintenance Technician
Planning Director
Municipal Attorney
Infrastructure and Environmental Engineer
Fleet Electrification Program Manager
Facilities and Charging Infrastructure Manager
Automotive Technicians (EV Specialized)
Outreach and Engagement Lead
Oversees planning, design, and implementation of renewable energy and electrification projects such as solar, wind, and geothermal systems across facilities or communities.
Installs and services renewable energy/ energy efficient equipment (e.g., solar panels, batteries, retrofitting equipment), ensuring systems run efficiently and safely.
FULL-TIME OR CONTRACTED COVERED MEASURES
Full-Time 1, 2, 3, 5, 9, 10, 14, 15
Contracted 1, 2, 10, 14
Oversees acquisition, management, and repurposing of vacant or underutilized properties for redevelopment aligned with sustainable land-use policies.
Advises on legal matters, drafts ordinances and contracts, and ensures compliance with environmental and land-use laws within local government projects.
Design systems and solutions to reduce pollution, manage waste, and protect water, air, and soil quality in infrastructure and industrial processes.
Leads the transition of municipal or private fleets from internal combustion engines to EVs through planning, procurement, and policy alignment.
Full-Time 4
Full-Time 4 & 12
Full-Time 1, 2, 4, 5, 7, 8, 9, 10, 11, 12, 13, 14, 15, 18
Full-Time 5 & 8
Plans and maintains EV charging stations and facility upgrades to support low-carbon transportation and building electrification. Full-Time 2, 5, 8, 18
Maintains and repairs EVs, with expertise in battery systems, electric drivetrains, and EV diagnostics.
Designs and leads public engagement strategies to inform and involve communities in sustainability, climate adaptation programs.
Contracted 5
Full-Time 2, 3, 4, 5, 6, 8, 11,12, 13, 15, 16
Land Use and Mobility Planner
Senior Transit Planner
Integrates land use and transportation planning to promote compact, transitoriented, and walkable development aligned with climate goals.
Designs and oversees public transportation fare programs to promote accessibility and increased ridership. Role to be filled through local transit authority.
Perform general construction and infrastructure work such as road building, facility upgrades, and stormwater installations. If needing specialized plumbing for a project, this can be outsourced.
1, 4, 5, 6, 7, 8, 11, 13, 15
2, 4, 7, 8, 9, 10, 12, 13, 18
Food Systems Access Coordinator
Responsible for expanding access to fresh, affordable food across communities. This role focuses on improving food access by coordinating initiatives that support local food production, enhance distribution systems, and foster community-driven solutions.
Manages water conservation programs, including customer incentives for efficient appliances, irrigation systems, and permitting support.
Develops and implements strategies to reduce waste through reuse, recycling, and local material loops, supporting a zero-waste framework.
Plans and manages urban forestry, landscaping, and green infrastructure projects to increase canopy cover, reduce heat, and enhance biodiversity.
Guides sustainable farming practices such as no-till methods, irrigation efficiency, and integration of renewable technologies. Planning to leverage the Farm Bureau for this role.
Builds and manages training programs for careers in climate resilience, renewable energy, and sustainable construction, with a focus on access and labor alignment.
7, 8, 9, 11, 13, 14, 15
14, 16, 17, 18
ROLE
Environmental and Energy Compliance Analyst
Electrical/ Mechanical Engineer
Policy and Incentives Coordinator
CORE RESPONSIBILITIES
Monitors and ensures compliance with federal, state, and local regulations on environmental performance and energy use, especially in high-emissions sectors.
Design and install induction furnace systems and energy optimization equipment.
Designs and evaluates climate-related policies and incentive programs (e.g., rebates, grants) to drive public and private sector participation.
FULL-TIME OR CONTRACTED COVERED MEASURES
Full-Time 1, 5, 6, 7, 8, 10, 11, 12, 13, 14,16,18
Contracted 1 & 18
Full-Time 1, 2, 4, 5, 6, 8, 9, 12, 13, 14, 16, 17, 18

To better understand the MSA's current workforce capacity and identify where strategic investments are most needed, Table J3’s staffing matrix evaluates the availability of key roles across each CACAP Toolkit measure. This table cross-references essential job functions with existing workforce capabilities, using (*) to denote those roles that are going to be contracted, an "X" to indicate a role that is needed but not currently available, and "V” to denote a role that is both needed and presently filled.
OCCUPATION/ROLE
Attorney
and Mechanical Engineer
Electrification Program Manager
and Charging Infrastructure Manager
Technicians (EV Specialised)
Outreach and Engagement Lead
Senior Transit Planner
Green Construction and Maintenance Crews
Water Efficiency and Rebate Coordinator
Waste Reduction and Innovation Specialist Urban Greening Specialist
Equity and Environmental Justice Advisor
Technical Specialist
*Food Systems Access and Equity Coordinator Green Workforce Development Manager
and Energy Compliance Analyst
Policy and Incentives Coordinator
OCCUPATION/ROLE
Renewable Energy Systems Manager
Renewable Energy Installation and Maintenance Technician
and
Facilities and Charging Infrastructure Manager Automotive Technicians (EV Specialised)
Systems Access Coordinator
OCCUPATION/ROLE
Renewable Energy Systems Manager
Renewable Energy Installation and Maintenance Technician
Planning Director Municipal Attorney
and Environmental Engineer
and Mechanical Engineer
Fleet Electrification Program Manager
Facilities and Charging Infrastructure Manager
Automotive Technicians (EV Specialised)
Outreach and Engagement Lead
Land Use and Mobility Planner
Senior Transit Planner Green Construction and Maintenance Crews
Waste Reduction and Innovation Specialist
Greening Specialist
and Environmental Justice Advisor
Systems Access and Equity Coordinator
Workforce Development Manager
and Energy Compliance Analyst
and Incentives Coordinator

To further inform workforce development strategies, the project team conducted a market analysis of the prescribed workforce across the entire MSA and looked at the historical and future projections of the roles needed to fulfill the measures for the CACAP Toolkit which helped us better understand how the key occupational sectors are projected to evolve over the next decade. This analysis builds upon the previous section of identified roles by providing a deeper look into the job demands and labor market trends of the key roles. Table K3 depicts historical and future job occupation projections, offering insight into which job sectors will be growing or shrinking. Through aligning the MSA’s workforce planning with these trends, this analysis helps to ensure that the roles being developed are not only necessary for the CACAP Toolkit measures but also for providing long-term employment opportunities for the community.

TABLE K3: INDUSTRIES AND ALIGNED PRIORITY OCCUPATIONS
INDUSTRY ALIGNED PRIORITY OCCUPATIONS
AUTOMOTIVE REPAIR & MAINTENANCE
UTILITIES – SOLAR, RENEWABLE, WATER
ENGINEERING SERVICES
BUSINESS, PROFESSIONAL, LABOR, POLITICAL
URBAN & REGIONAL PLANNING
AGRICULTURE
LEGAL SERVICES
CIVIC & SOCIAL ORGANIZATIONS
CONSTRUCTION
WASTE MANAGEMENT
TRANSPORTATION
PROFESSIONAL, SCIENTIFIC & TECHNICAL
Fleet Electrification Manager; EV Technicians
Renewable Installation Technician; Renewable Systems Manager; Water Rebate Coordinator
Electrical Engineer; Environmental Engineer; Mechanical Engineer
Water Rebate Coordinator; Planning Director; Workforce Development Manager
Senior Transit Planner
Agricultural Technician
Municipal Attorney
Outreach & Engagement Specialist
Construction Workers; Facilities & Infrastructure Manager
Waste Reduction Specialist
Fare Program Manager; Senior Transit Planner
Environmental & Energy Compliance Analyst; Policy & Incentives Coordinator; Food Systems Coordinator
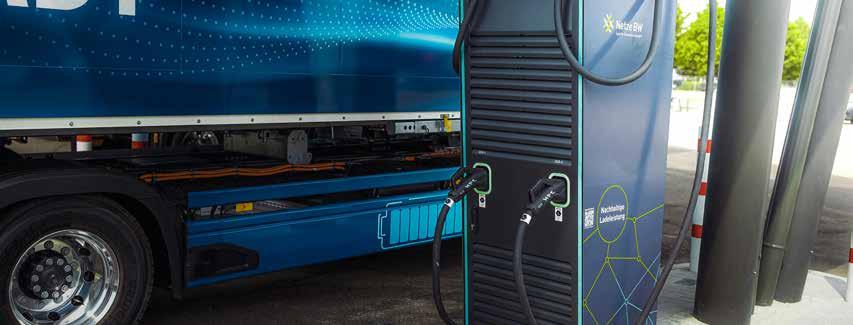
Professional, Scientific & Technical
Environmental & Energy Compliance Analyst; Policy & Incentives Coordinator; Food Systems Coordinator
Historical Estimated Workforce Snapshot by Industry, MSA (2014 - 2022)
Figure N highlights how employment in key occupations has shifted over the past decade, showing where growth has occurred (e g , construction, infrastructure management) and where certain roles have remained limited. These patterns provide a baseline for understanding the City’s capacity to scale up its green workforce.
Figure N highlights how employment in key occupations has shifted over the past decade, showing where growth has occurred (e.g., construction, infrastructure management) and where certain roles have remained limited. These patterns provide a baseline for understanding the City’s capacity to scale up its green workforce.
Figure N: Historical Estimated Workforce Snapshot by Industry, MSA (2014 - 2022)
FIGURE N: HISTORICAL ESTIMATED WORKFORCE SNAPSHOT BY INDUSTRY, MSA (2014 - 2022)
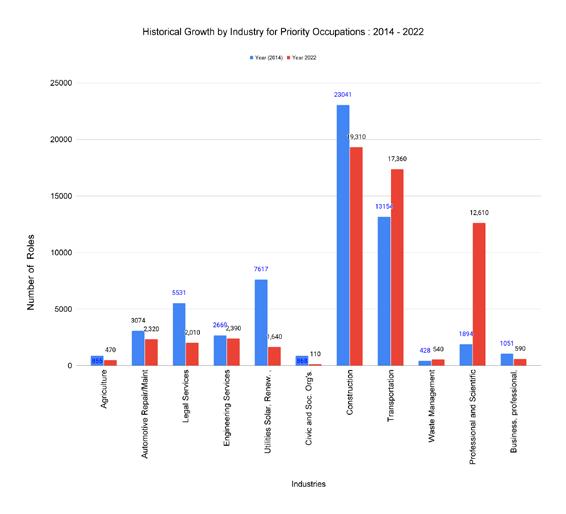

Table L3 highlights changes in employment levels across key industries linked to priority occupations, showing areas of decline (e.g., legal services, agriculture, utilities) and growth (e.g., professional and scientific services, transportation).
TABLE L3: HISTORICAL INDUSTRY EMPLOYMENT FOR PRIORITY OCCUPATIONS, MSA (2014 - 2022)

Figure O represents the industries of the priority occupations that are projected to grow (e.g. transportation, construction, engineering, agriculture, waste management), while others are set to slightly decline (e.g. Utilities, solar, water, renewable energy, and legal services). Note that some of these industries may be experiencing a retiring workforce which can be the result of the predicted decline for some areas.
FIGURE O: PROJECTED GROWTH OF INDUSTRIES FOR PRIORITY OCCUPATIONS, MSA (2022 - 2032)
Figure O: Projected Growth of Industries for Priority Occupations, MSA (2022 - 2032)
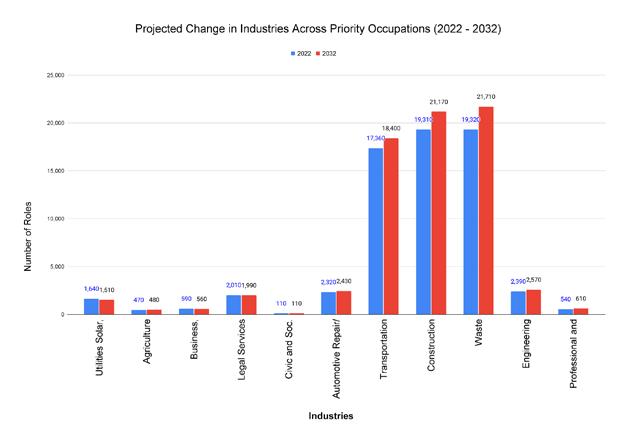
Industry Employment for Priority Occupations, MSA (2022 - 2032)
Table M3 presents projected employment levels across key industries tied to CACAP priority occupations, showing expected growth or decline over the decade to highlight a deeper look into future workforce demand.

Table M3 presents projected employment levels across key industries tied to CACAP Toolkit priority occupations, showing expected growth or decline over the decade to highlight a deeper look into future workforce demand.
NOTE: This analysis combines data from the U.S. BLS and the Alabama Department of Labor to balance consistency and accuracy across time periods. BLS Occupational Employment and Wage Statistics (OEWS) are used to establish historical baselines (2014–2022), given their longer time series. Alabama Department of Labor regional industry and occupational projections (2022–2032) are used to estimate future workforce trends, as they represent the state’s official labor market forecasts and align with Work Innovation and Opportunity Act (WIOA) planning. As a result, totals may differ between sources due to differences in methodology (survey-based estimates versus administrative record-based projections). Additionally, since neither source offers projections beyond 2032, the analysis is limited to this horizon.
Source: U.S. Bureau of Labor Statistics. One-Screen Data Search: Quarterly Census of Employment and Wages (QCEW). U.S. Bureau of Labor Statistics (BLS), https:// data.bls.gov/PDQWeb/en. Accessed 18 Aug. 2025.

Figure P compares the share of total employment by major occupational groups in the MSA with national averages, highlighting key areas of local specialization and underrepresentation.
FIGURE P: PERCENT OF TOTAL EMPLOYMENT: U.S. VS. BIRMINGHAM MSA
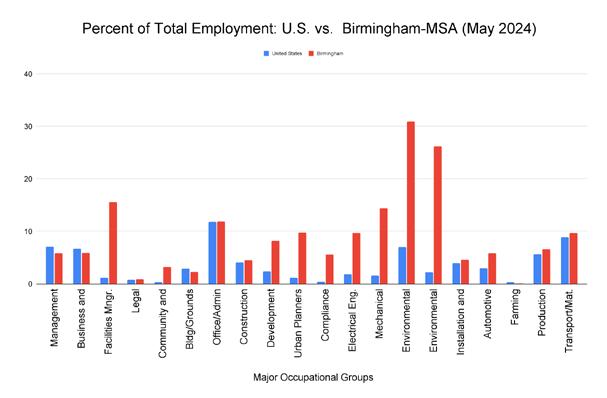
Priority Occupations and Matching Standard Occupational Classification (SOC) Codes
Table N3 ensures consistency across federal and state labor datasets by aligning the City’s priority occupations with standardized SOC codes and occupation classifications. This mapping provides a foundation for comparing local workforce concentrations to national benchmarks
Table N3: Priority Occupations and Matching SOC Codes
Table N3 ensures consistency across federal and state labor datasets by aligning the City’s priority occupations with standardized SOC codes and occupation classifications. This mapping provides a foundation for comparing local workforce concentrations to national benchmarks.
TABLE N3: PRIORITY OCCUPATIONS AND MATCHING SOC CODES
Fleet
Renewable
Workforce

Figure Q depicts the average wage of the priority CACAP Toolkit occupations nationally against the MSA, highlighting areas where local wages are lagging or exceeding national levels and indicating potential gaps in labor market competitiveness.
FIGURE Q: THE MEAN HOURLY WAGE OF MAJOR OCCUPATIONS: U.S. VS. MSA
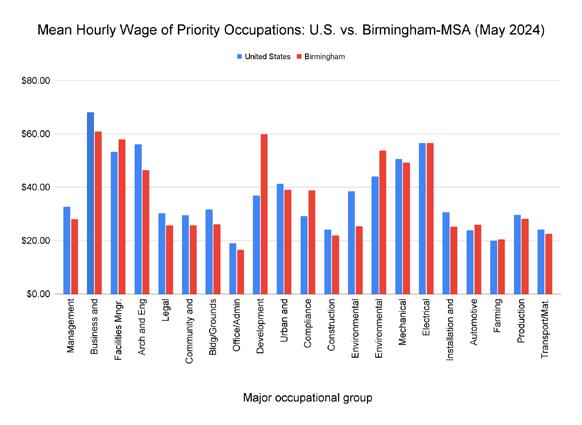
Source: U.S. Bureau of Labor Statistics. Occupational Employment and Wages in Birmingham, AL — May 2024. Southeast Information Office, 3 May 2025. Bureau of Labor Statistics, https://www.bls. gov/regions/southeast/news-release/occupationalemploymentandwages_birmingham.htm.
Source: U S Bureau of Labor Statistics Occupational Employment and Wages in Birmingham, AL May 2024 Southeast Information Office, 3 May 2025 Bureau of Labor Statistics, https://www bls gov/regions/southeast/news-release/occupationalemploymentandwages birming ham htm
NOTE: The BLS only has projected wages for the year 2024, therefore comparisons are limited to this period.
Using the BLS, the above statistics, and stakeholder meetings, we conducted a detailed gap analysis to assess the current workforce against future needs. This analysis revealed where critical roles remain unfilled or underdeveloped to execute certain measures in the CACAP Toolkit. These missing roles were identified in Table O3.
CACAP-ALIGNED JOB ROLE GAP OR BARRIER
Renewable Energy
Installation and Maintenance Technicians
Facilities and Charging Infrastructure Manager
Automotive Technicians (EV Specialized)
No role currently available. Plan to leverage local colleges (i.e. Lawson State, Trenholm State, Central Alabama Community and Jefferson College), national certification and training programs to train the candidate(s).
No role currently available. Planning to train candidate(s) for the role through national training programs (i.e. International Facility Management Association (FIMA)) and through local college programs such as Lawson State Community College.
No role currently available. Planning to train candidate(s) through local community college programs (e.g. Lawson State Community College and Trenholm State Community College), while also leveraging national training programs such as ImmerseLearn.
Environmental and Energy Compliance Analyst
Policy and Incentives Coordinator
No role currently available. Planning to leverage local community colleges (e.g. Jefferson State Community College and The University of Alabama) along with a variety of national training and certification programs such as Energy Star Portfolio Management and the Certified Auditor Training (CEA).
No role currently available. Planning to leverage local college training and upskilling programs (e.g. Jefferson State Community College and University of Alabama (UAB))
Building on the gap analysis, this jurisdictional support section acknowledges the MSA’s plans to partner with various local, state and national workforce development pipelines, which can provide valuable training opportunities to support key roles identified in the CACAP Toolkit. These expanded partnerships will help fill critical role gaps, enhance local skills, and ensure a resilient workforce that can sustain the plan’s success for years to come as shown in Table P3.
RENEWABLE ENERGY INSTALLATION AND MAINTENANCE TECHNICIANS
Little USA (LUSA) Community Solar Campus - Union Springs, AL
• Non-profit that combines agricultural innovation and solar energy workforce training to serve communities.
• Trains local residents via hands-on agrivoltaics courses that adhere to NABCEP standards
• Helps develop career training pathways in sustainable energy
Southeast Rural Power Coalition - Solar for All (Regional Program with Alabama Focus)
• Workforce development and entrepreneurship “centers of excellence” that provide training, hiring pathways and business opportunities tied to local solar projects
• Partners with Huntsville Utilities
Lawson State Community College (Birmingham/Bessemer)
• Electrical/Electronic Engineering Technology + CTE programs relevant to solar and Facilities work.
• EV Charging Stations for Hands-on Training
• Lawson State's Alabama Center for Automotive Excellence has installed EV charging stations (courtesy of Alabama Power) to provide real-life training scenarios for students
Jefferson State Community College
• Electrical Fast Track course (NEC basics, Circuits, Residential Wiring).
• Great for safe effective electrical installation and retrofitting work.
• Culminates in a college certificate.
Grant Funded course.
Trenholm State College
• NABCEP PV installation Professional (Online)
• Career training program offered through the college that prepares experienced installers to meet the education prerequisites for the NABCEP PVIP exam.
• Solar panel Installer Training
• Offers courses in PV design/installation fundamentals, good for entry-level upskilling.
Central Alabama Community College:
• Industrial Electronic Technology (AAS) - Course offers a strong foundation for solar tech.
• Electrical Helper (Course) - Entry pathway for electrical basics
Birmingham Electrical JATC:
• Apprenticeship program that provides on-the-job training for aspiring electricians.
• Only need a High School GED.
• Provides a base path to later pursuing higher training in renewable energy tech.
Alabama Workforce Training Center (AWTC), Birmingham:
• Offers no-cost, hybrid electrical skilled trades training program that provides foundational electrical skills essential for retrofit work involving system upgrades and installations.
Bevill State Community College:
• Alabama Energy Infrastructure Training Center (AEITC)
• Workforce development program that provides key training programs in EVs connectivity, PV solar/microgrid, HVAC, and weatherization.
NABCEP PV Associate (Advanced Certs)
• Industry-standard entry credential for solar PV installation/ Maintenance; many providers (online)
SEI (Solar Energy International)
• Technical School with online and in-person labs that offer NABCEP aligned courses to train solar installation job seekers.
EVITP
• Required for most federally funded EVSE projects.
• Covers load calcs, site prep, installation, networking, and commissioning.
• Available online.
• Candidates must have an electrical license.
FACILITIES AND CHARGING INFRASTRUCTURE MANAGER
Birmingham Electrical JATC:
• Registered apprenticeship with classroom + OJT for licensed electricians.
• Delivers EVITP (Electric Vehicle Infrastructure Training Program), which is the nationally recognized credential for NEVI-funded EV charging projects. This course has modules dialed towards project coordinators, managers, and inspectors alike.
Alabama Workforce Training Center (AIDT)
• Offers hands-on technical and construction trades training, including OSHA safety, construction trades, and manufacturer focused courses, which are good for gaining baseline experience for facility management.
Lawson State Community College
• Provides courses and certification for workers to learn the skills to become a facilities technician, which provides foundational skills to manage facilities and infrastructure.
International Facility Management Association (FIMA) (Online) -
• Offers Facility Management Professional courses that are online and self-paced courses to become trained and certified as a facility manager
• Offers scholarships and DEI initiatives to expand access to underrepresented workers in facility management
Certified Facility and Maintenance Professional (CFMP) (Online)
• Provides professionals with the skills and knowledge to excel in facility and maintenance management.
• Company that trains workers to maintain and repair EV charging stations.
• Foundational knowledge for managing charging infrastructure.
• Provides paid on-the-job training
• Has partnerships with workforce boards, utilities, and major EV charging providers
Association of Energy Engineers (online OR in person classes in Huntsville, AL)
• Offers Certified Energy Manager (CEM) certification which empowers professionals with the knowledge needed to be an effective facilities/infrastructure manager.
AUTOMOTIVE TECHNICIANS (EV SPECIALIZED)
Lawson State Community College: ASE 263 - Hybrid and EV Course
• Course prepares students for the ASE Light Duty Hybrid/EV Specialist Certification
Trenholm State Community College: Automotive Service Certificate & AAS
• Includes a Hybrid & EVs course (ASE 263), similar to Lawson State, covering electrical system diagnostics and ASE certification prep.
• Innovative Alabama EV training grant
• Provides training for automotive students, local technicians and first responders, and covers training and exam fees.
NobleProg (Instructor-led Workshops, Alabama)
• Provides live, instructor-led sessions, both online and on-site covering topics such as:
• EV Maintenance & Troubleshooting for technicians
• EV Charging Infrastructure and Smart Grid Integration
• EV Powertrains & Battery Technology's
• EV Retrofitting and more
AIDS EV Technology Center (Coming 2026)
• Facility is set to be a cutting-edge workforce training center that will train workforce on the skills needed for EV production and maintenance
Bevill State Community CollegeEVSE SkillFusion Program
• Through partnership with SkillFusion, Bevill State offers an EVSE Diagnostic Technician Certification, training workers on maintaining and repairing EV charging infrastructure and fleet maintenance.
ImmerseLearn - EV Technician Program (With VR)
• 100% virtual reality simulator where students can work on vehicles and learn the skills to service EV automotives from their home.
ChargerHelp! - EVSE Workforce Training
• Company that trains workers to maintain and repair EV charging stations
• Provides paid on-thejob training
• Has partnerships with workforce boards, utilities, and major EV charging providers
ENVIRONMENTAL AND ENERGY COMPLIANCE ANALYST
UA SafeStateEnvironmental Compliance 101
• Covers EPA/State regulatory structure, common violations, reporting requirements
• 8 Hour course, low-cost entry point in Tuscaloosa
• Good for new-hire or crosstraining existing staff members
Jefferson State Community College
• Data Analytics: Power BI Course
• Course provides key baseline training for data analytics such as sourcing, learning, modeling, visualization and analysis
• Scholarships are available to cover exam cost
Alabama Department of Economic and Community Affairs (ADECA)
• Provides online compliance training related to community development block grant administration
• Trains job seekers in key compliance pillars such as Right-of-Way acquisition, audits, financial compliance and environmental review
Environmental Training Company (ETC):
• Provides in-person environmental and consulting tailored to industry needs, including support from engineers and environmental professionals.
EPA Energy Star Portfolio Manager (Free, online):
• Free online course for beginning professionals in the environmental, energy and compliance space
360 Training - Environmental Compliance Basics (Online):
• Online training that covers key acts which are later needed for deeper understanding in compliance space such as Clean Air Act, Clean Water Act, etc.
CEA - Association of Engineers (AEE) (online):
• Focuses on energy audits, code compliance, and reporting for facilities.
Data Analysis Certificates:
• Offered through Corsera, edX, Tableau
POLICY AND INCENTIVES COORDINATOR
Jefferson State Community College:
• Offers online human resource professional courses that cover a variety of topics that are key for understanding incentives programs.
UAB: Workforce Innovation and Opportunity Act (WIOA):
• Provides covered tuition for certification and supportive services for eligible workers who seek courses in public policy, political science, and public administration at UAB which provide critical knowledge for the role.
Alabama State UniversityProfessional Grant Writing Course
• Fully online, self-paced program, that prepares learners for the grant professional certified exam
• Covers proposal development, case statements, budgeting, funder matching, and ethics.
UAB - Grant Writing Skills Suite
• Introductory and intermediate online courses focused on aligning needs with funding strategies
Auburn University at MontgomeryGraduate Certificate: Data Analysis and Policy Evaluation
• 12 hour, four-course graduatelevel certificate emphasizing data analytics, program evaluation, research design, data visualization, and communication- all skills vital for effective policy and incentive coordination.
• Offered fully online.
• Affordable tuition.
EPA Energy Star Portfolio Manager (Free, online):
• Free online course for beginning professionals in the environmental, energy and compliance space
360 Training - Environmental Compliance Basics (Online):
• Online training that covers key acts which are later needed for deeper understanding in compliance space such as Clean Air Act, Clean Water Act, etc.
CEA - Association of Engineers (AEE) (online):
• Focuses on energy audits, code compliance, and reporting for facilities.
Data Analysis Certificates:
• Offered through Corsera, edX, Tableau

The MSA plans to utilize some or all of the following KPIs to track the effectiveness and impact of initiatives that develop job-ready skills and enhance the workforce. They provide a way to assess how well a program equips individuals for employment by measuring outcomes related to education, practical training, and certification.
Number of green jobs filled per Sector
Number of Outreach and Engagement Events Held
DESCRIPTION
Track the total number of green roles filled to show economic benefit. (e.g. sustainable transportation, renewable energy, climate resilience, electrification, etc.)
Track total number of community outreach events or information sessions held on green job opportunities
Number of partnerships formed
Number of new agreements with colleges, unions, or employers to develop talent pipelines.

The workforce planning analysis provides a clear and actionable path for the MSA to build a sustainable workforce that can effectively implement the CACAP Toolkit strategies. By identifying the key roles required for each measure, mapping the existing workforce, and highlighting critical gaps, this analysis supports the MSA in strategically investing in training, recruitment, and partnerships to create a resilient, future-ready workforce. Through collaboration with regional and state partners and by leveraging existing programs, the MSA can develop a workforce prepared to meet immediate climate goals while also advancing the region’s long-term sustainability and economic prosperity.

CACAP Toolkit full list of strategies
1.1 Conduct a deep retrofit at the City of Birmingham's City Hall
1.2 Create Climate Policies for large facilities such as convention centers, hotels, and amphitheaters, beginning with the Birmingham Jefferson Convention Center
1.3 Promote the adoption of induction furnaces by Birmingham area ductile iron pipe manufacture
2.1 Adopt or encourage energy-efficient building codes for new construction
2.2 Launch "Solarize the MSA" by building a crowd funding campaign which bundles multiple solar projects under one RFP.
2.3 Transition tools, small engines, and other equipment to electric alternatives. Implement incentives and rebates for the community to do the same
2.4 Designate 35th Avenue Superfund sites an opportunity zone to target microgrid for all industry and residential LIDAC communities in and around the superfund site.
2.5 Establish Solar/Charging Infrastructure Supporting Irrigation in Rural Regions within the MSA
2.6 Install a solar powered parking structure on University of Alabama's campus (Cross-cutting strategy 1.4)
2.7 Establish waste to energy facilities to reduce methane emissions from landfills while producing renewable energy
2.8 Implement a Distributed Energy Resources (DER) program to reduce peak demand.; Implement energy management and energy storage systems at municipal locations to charge during low-use and release energy during peak demand hours.
2.9 Promote the installation of resilient renewable energy systems at facilities that provide emergency response services to MSA citizens. Provide administrative and regulatory support to pursue grants and utility interconnection.
3.1 Establish a program that provides low-interest loans for home energy efficiency retrofits, with zerointerest loans for eligible low-income households.
3.2 Promote programs for electrifying residential and commerical properties and improve energy efficiency through insulation, efficient heating/cooling systems, and energy audits.
3.3 Transition all lighting at City Hall to LED
4.1 Incorporate Smart Growth principles into zoning codes and future land use planning efforts throughout the MSA by encouraging increased walkability and density around urban centers and preserving open space for agricultural uses, preservation, and recreational uses.
5.1 Transition 90% of the City of Birmingham's municipal cars, 50% of light trucks, and 10% of vans to all electric by 2035 Municipalities within the MSA to follow a similar timeline
5.2 Expand 75 electric vehicle charging stations to employers by 2035
5.3 Promote Alabama Power's EV Home Charger Rebate program to educate residents on reduced rates for off-peak charging
5.4 Electrify University of Alabama at Birmingham’s (UAB) Blazer Express fleet of buses by 2035
6.1 Expand the initial Electric Bike Voucher Program to distribute 1,000 electric bike vouchers annually. Proposed revision:
7.1 Write a Comprehensive TOD Corridor Plan to Incorporate large-scale transit-oriented development (TOD) projects while also supporting smaller-scale, neighborhood-based intermodal facilities. These localized hubs—modeled after Dutch Mobility Hubs— could offer a variety of transportation options and amenities, helping to connect users more efficiently and address first- and last-mile challenges
7.2 Establish a North-South BRT corridor; explore expansions that can be accomplished to facilitate connectivity to destinations along the East-West corridor and future North-South corrido
7.3 Utilize a voucher program to reduce or eliminate public transportation fares, incentivizing residents to use public transit and eliminating financial barriers to transit access; need to apply for
8.1 Explore installation of E-Bike charging infrastructure, fix-it stations, and covered bike parking at convenient public locations such as trails, hubs, and commercial areas.
8.2 Require new non-residential developments greater than 25,000 square feet to reduce VMT through Transportation Demand Management (TDM) programs using the City of Birmingham's TDM workbook
8.3 Explore options in developing a car-sharing and/or bike sharing program that extends throughout the MSA
8.4 Re-Introduce Safe Routes to School program
8.5 Build additional portions of critical trail infrastructure such as those identified in the Red Rock Trail System Action Plan and B-ACTIVE Plan
9.1 Purchase and install X motion sensor faucets in all municipal buildings
9.2 Transition to drought tolerant landscaping for all municipal buildings within the MSA
9.3 Upgrade aging water infrastructure, including replacing lead service lines and reducing water main breaks, thereby enhancing water efficiency and public health
9.4 Promote Birmingham Water Works' rebate program for water-efficiency fixtures communitywide
9.5 Offer expedited and/or reduced cost permits to new developments and major renovations of existing developments that include greywater systems or rainwater harvesting infrastructure
10.1 Installation of renewable energy and energy efficiency measures at wastewater treatment facilities
11.1 Continue to enforce the Post-Construction Stormwater Ordinance (Ord. No. 19-31, § 1, 3-29-2019)
11.2 Lobby for the enforcement of water quality audits quarterly in partnership with Riverkeeper nonprofit groups
11.3 Amend local develpment guidelines to require flood-resilient design such as bioswales and pervious pave
11.4 Prioritize the installation of nature-based solutions and flood resilient infrastructure in areas of high need particularly within areas near or within the 100 year floodplain
11.5 Consider eliminating minimum parking requirements from local zoning codes to create less impervious surface during development
12.1 Introduce and enforce policies that prioritize the purchase of environmentally friendly and recycledcontent products for municipal operations
12.2 Launch a 2026 Zero Waste campaign
12.3 Adopt a Model Waste Franchise Agreement MSA wide to create consistencies in residential and commercial services
12.4 Expand the City of Birmingham's hauling services to mimic the services and rates outlined in the Model Franchise Agreement
13.1 Use the MSA zoning map to write a Smart Growth policy to address neighborhoods affected by blight
13.2 Develop a comprehensive Urban Community Forestry Plan and perform canopy assessments to guide tree canopy management and conservation efforts; tie to carbon sequestration
13.3 Utilize city-owned or operated open spaces to demonstrate sustainable landscaping and low-impact design planting strategies, such as planting native trees and plants
14.1 Identify 2 local farms to transition irrigation systems to renewable energy using agrivoltaics
14.2 Increase resident's access to fresh, affordable, and healthy foods
14.3 Increase the use of no-till farming and certain types of cover crops to manage water resources.
14.4 Restrict application of bio char also called sludge on regional agriculture land
15.1 Conduct heat study/mapping to identify designated Urban Heat Island locations
15.2 Prioritize light-colored roofs and/or a minimum specified reflectance for commercial and residential roofs when new or at replacement
15.3 Write a toolkit for municipalities which identifies best practices for nature-based solutions
16.1 Maintain the Steering Committee, which was established during the planning process, to build resources in support of implementing the Central Alabama Climate Action Plan (CACAP)
16.2 Address disparities in environmental impacts on historically underserved communities
16.3 Leverage cooperative internships focused on implementation of climate action and sustainability through the Univeristy of Alabama Birmiingham's Blazer Core program
16.4 Re-design climate action website for one-stopshop information that educates public on the CACAP and sustainability practices, offering a centralized platform for information and resources
17.1 Support and Incentivize the growth of startups and small businesses that develop sustainable products and services by offering targeted incentives, technical support, and access to funding opportunities finding leads through the Birmingham Busiiness Alliance
17.2 Develop career pathways for ten priority green workforce positions in green infrastructure management, forestry, vehicle electrification and EV repair, and energy-related fields.
17.3 Create jobs with family-supporting wages in frontline communities that have historically experienced systematic underinvestment
18.1 Adopt new technologies, processes, and/ or equipment to reduce use of fossil fuel-generated energy and to increase energy efficiency in industrialscale steel and gas processes
18.2 Work with individual steel and gas companies to plan and implement GHG reduction strategies
18.3 Create an alliance with the state government to decarbonize industrial processes using different technologies.
18.4 Consider Carbon Capture and Sequestration tools to mitigate GHG reductions
18.5 Implement Iron Electric Induction Conversion project at Untied States Pipe Foundry Company by replacing a coke-fired furnance with electric induction melting furnance for the production of ductile iron
18.6 Train 1,200 jobseekers for high-quality healthcare roles, with a focus on empowering marginalized communities
18.7 Work with individual healthcare facilities to plan and implement GHG reduction strategie
18.8 Target healthcare facilities with renewable energy projects with the intent to shift load from peak hours (4:00 - 8:00 p.m.) to nighttime or other off peak hours
18.9 Participate in Climate and Health Initiative, an interdisciplinary program aimed at promoting research, education, and outreach on the health impacts of climate change
18.10 Restore degraded lands surrounding the rail line (e.g., brownfields, and deforested lands) to enhance carbon sequestration
18.11 Implement idle-reduction technologies, electric cranes, and cleaner ground support equipment in yards and intermodal terminals

Report developed for the Central Alabama Climate Action Plan by: Evelyn Shu, Katherine Gross, Ellie Crump, and Henry Alexander; The American Institutes for Research
In 2024, the City of Birmingham (hereafter, the City) received an EPA grant to establish a Central Alabama Climate Action Plan (CACAP) for the Birmingham Metropolitan Statistical Area (MSA). Based on community feedback, the CACAP proposed and refined a set of greenhouse gas reduction measures, strategies, and actions. The Plan’s actions are intended to create significant co-benefits for residents. For example, in addition to reducing greenhouse gas emissions, actions will also help advance livable communities, economic development, and quality of life. This plan is not regulatory but can instead ser ve as a toolkit that cities and counties in the MSA can use to reduce carbon footprints while meaningfully improving quality of life, resilience, and economic vitality. The City will work to support the adoption of the actions and measures relevant under the City ’s jurisdiction.
Building on the climate action priorities and needs identified by community members during Phase 1 of data collection, the Blue Strike Environmental team developed a preliminary set of implementation measures, strategies, and actions aimed at achieving greenhouse gas reduction targets across key climate
In 2024, the City of Birmingham (hereafter, the City) received an EPA grant to establish a Central Alabama Climate Action Plan (CACAP) for the Birmingham Metropolitan Statistical Area (MSA). Based on community feedback, the CACAP proposed and refined a set of greenhouse gas reduction measures, strategies, and actions. The Plan’s actions are intended to create significant co-benefits for residents. For example, in addition to reducing greenhouse gas emissions, actions will also help advance livable communities, economic development, and quality of life. This plan is not regulatory but can instead ser ve as a toolkit that cities and counties in the MSA can use to reduce carbon footprints while meaningfully improving quality of life, resilience, and economic vitality. The City will work to support the adoption of the actions and measures relevant under the City ’s jurisdiction.
Building on the climate action priorities and needs identified by community members during Phase 1 of data collection, the Blue Strike Environmental team developed a preliminary set of implementation measures, strategies, and actions aimed at achieving greenhouse gas reduction targets across key climate sectors. Strategies, measures, and actions were designed to be relevant to a range of settings and contexts, including urban, suburban, and rural contexts. In Phase 2, the American Institutes for Research (AIR) and Clarus Consulting (Clarus) gathered qualitative and quantitative community feedback on these proposed measures, strategies, and actions, supporting the City in refining the CACAP. The Phase 1 and Phase 2 findings were presented in detail in previous reports. The findings from Phase 1 were described in detail in the Initial Findings Brief, which was publicly released in August 2025. Findings from Phase 2 were described in detail in the Refined Findings Brief, which was publicly released in October 2025. This report presents the final round of Public Comment and community feedback on the near-final CACAP, collected during Phase 3 engagement activities. It synthesizes insights from all three phases of the project, to inform the City ’s efforts in finalizing the scope and content of the plan.
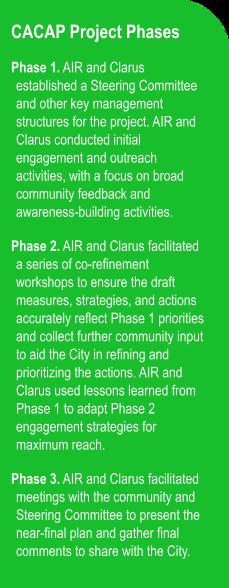
The public engagement activities included outreach to stakeholders for participation in a Steering Committee, as well as events and online input opportunities open to community members. These activities are summarized in Table 1.
Table 1. Over view of Public Engagement Activities
1 Spring 2025 Develop Initial Greenhouse Gas Inventory
2 Summer 2025 Review Draft Reduction Measures
3 Fall* 2025 Refine Draft Reduction Measures
*Final plan will be submitted on December 1, 2025
● 6 Kickoff Meetings
● First Steering Committee Meeting
● Online Survey #1: Your Experience with Climate Change
● 3 Public Workshops
● Second Steering Committee Meeting
● Online Survey #2: Review Draft Measures
● 2 Public Comment Sessions
● Third Steering Committee Meeting
● Online Survey #3: Public Comment Period
The outreach methods for the Steering Committee and broader community engagement are described in further detail below
The AIR team launched its community outreach efforts by forming a Steering Committee composed of stakeholders from a broad range of sectors and backgrounds across the Birmingham MSA. This process involved targeted research and strategic collaboration with the City to pinpoint individuals who could reflect the varied perspectives and needs of the region’s population. AIR and the City leveraged existing networks within local government, regional planning bodies, community-based organizations (CBOs), and the private sector to identify potential Steering Committee members. Project leaders sent selected individuals email invitations which included details about the Steering Committee and its first meeting. AIR invited representatives from each county and municipality in the project area to participate in the Steering Committee.
Across all three phases of the project, AIR invited 126 community members to join the Steering Committee, representing stakeholders across local government or regional planning organizations, community nonprofits, the private sector, and local universities (Exhibit 1). Each invited participant received a charter outlining the roles and responsibilities of the Steering Committee. A hallmark of the collective is that participation in the Steering Committee remained open throughout the planning process to expand and deepen stakeholder engagement throughout the project.
Exhibit 1. Steering Committee Invitees by Stakeholder Category
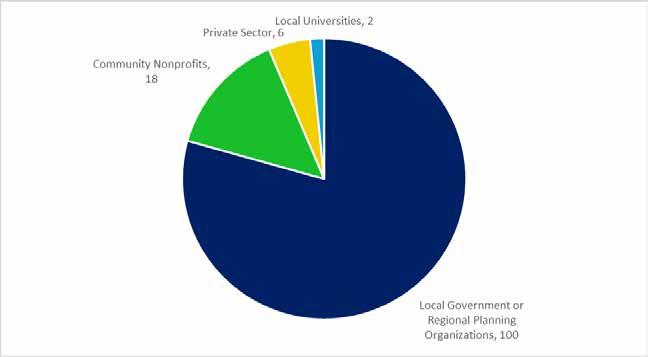
*Note There were 126 total Steering Committee Invitees
To ensure robust stakeholder participation throughout all phases of plan development, the CACAP project team employed several methods to engage various stakeholders from across the Central Alabama Region. These included both in-person and online engagement strategies, such as a series of virtual and in-person community meetings held in relatively accessible (public spaces and spatially distributed) locations within Birmingham as well as across the region’s counties. In addition, AIR launched two online sur veys and a Public Comment period that were open to all community members. These ser ved as an asynchronous opportunity for individuals to provide input at their convenience, helping to better reach community members who could not attend in-person or virtual events. To increase participation, the team selected meeting times and locations based on accessibility and community input, with most events scheduled on Tuesday and Thursday evenings. Targeted participation incentives, such as gift cards, aimed to encourage input from individuals and groups with more limited availability or resources.
AIR conducted in-depth research on communities within the Birmingham MSA to identify key populations and develop tailored engagement strategies to ensure participation across a broad spectrum of income levels, age brackets, languages, and faith traditions. For example, to promote and maximize participation for all events, AIR distributed information via email outreach to community-based organizations (CBOs), local businesses, government agencies, and public spaces such as libraries and churces, encouraging them to share it within their networks. These stakeholders and community groups were disag gregated by their relevance to reaching different audiences to ensure outreach to various community members. Identified stakeholders were directly invited to attend county- and MSA-wide meetings, complete two online sur veys, and participate in the Public Comment period. Additionally, community members could share their contact information during Phase 1 and Phase 2 activities, through in-person and virtual meetings, the two online sur veys, and/or the website to continue to receive plan updates. AIR also promoted all events on a centralized website and social media platforms, including Facebook and Instagram, using both organic and paid posts, as well as through local news outlets.
In total, AIR identified and directly invited 684 individuals across the Birmingham MSA to participate in the Phase 3 online Public Comment period and the Public Comment sessions hosted in October 2025. Table 2 breaks down the invitees by stakeholder category across all three phases.
*Note The sign-ups were open over the duration of Phases 1-3 These numbers indicate everyone who was invited to at least one of the activities during each Phase This does not include additional stakeholders who signed up to receive plan updates after that Phase’s activities occurred
The information outlined in this report is based on data acquired across three phases of the CACAP project, which each included a Steering Committee meeting , public events (i.e., kickoff meetings, public workshops, and Public Comment sessions), and online data collection (i.e., two online sur veys and a Public Comment period). Table 3 summarizes the total participation across these data collection methods for the three Phases.
Table 3. Cumulative Community Participation in the CACAP
Phase 3
*Some participants may be represented multiple times in the total number Participants were encouraged to participate in as many engagement opportunities and phases as they liked
*Additional in-depth interviews were conducted by the project team with stakeholder groups such as non-profits and local governmental agencies These engagement opportunities are not represented in this table nor total participation, but they greatly assisted in development of draft measures, strategies, and actions
The findings presented in this report are based on data from all three project phases and the following three sources, each of which are detailed below: Steering Committee meetings, virtual and in-person public events, and online data collection initiatives.
Throughout all three Phases, a total of 31 unique stakeholders expressed interest in participating in the Steering Committee.
Phase 1 Steering Committee Meeting. Project leaders held the first Steering Committee meeting virtually on May 21st, 2025. CACAP project team leadership from AIR, Clarus, Blue Strike Environmental, and the City of Birmingham attended the initial meeting , along with the Steering
Throughout all three Phases, a total of 31 unique stakeholders expressed interest in participating in the Steering Committee.
Phase 1 Steering Committee Meeting. Project leaders held the first Steering Committee meeting virtually on May 21st, 2025. CACAP project team leadership from AIR, Clarus, Blue Strike Environmental, and the City of Birmingham attended the initial meeting , along with the Steering
Committee participants. For the initial Steering Committee meeting , 18 individuals responded that they planned to attend: eight from CBOs, six from local government, three from the private sector, and one from a university. Ultimately, nine individuals participated in the initial Steering Committee meeting , with four participants coming from CBOs, two from local government, two from the private sector, and one from a university
The participants began by sharing their counties of residence, their sense of concern about and preparedness to address environmental issues in their communities, and how (if at all) they have been involved in the CACAP process thus far. After learning more about the scope and objectives of the CACAP, the seven sectors for climate action and resilience, and the role of the Steering Committee, members engaged in a facilitated dialogue about a set of key questions, including:
ο Which of the seven sectors resonates most with you? Why is each sector important to you and your community?
ο What environmentally related initiatives are you working on in your community that may fit into or complement the plan? How can a project team work with you to incorporate those?
ο What stakeholder categories in your community need to have a voice? What is the best way to reach those populations?
Phase 2 Steering Committee Meeting. Project leaders held the second Steering Committee meeting virtually on August 13th, 2025. For the second Steering Committee meeting , 11 individuals responded that they planned to attend. Ultimately, all 11 individuals participated in the second Steering Committee meeting , with four participants coming from CBOs, three from local government, two from the private sector, and two from a university. CACAP project team leadership from AIR, Clarus, Blue Strike Environmental, and the City of Birmingham also attended.
To start, participants heard from the City about key CACAP updates, including a reminder of its purpose and background, an over view of its process, timeline, and structure (e. g., measures, strategies, and actions) and a summary of key findings from Phase 1 of data collection and public engagement. Prior to attending the second Steering Committee meeting , participants had the opportunity to review draft CACAP measures through a variety of engagement opportunities, including the Phase 2 community refinement workshops and the second online Community Input Sur vey. Steering Committee participants also had the opportunity to review the Climate Action Tracker developed by Blue Strike Environmental in advance to prioritize their top three actions per sector and provide comments on the measures, strategies, and actions.
Blue Strike Environmental also briefly introduced some of the implementation and funding frameworks that will be part of the final CACAP. This included a prioritization matrix that:
ο Connects strategies to key factors influencing implementation and allows for dynamic weighting and modelling of various prioritization scenarios to generate priority scores that will influence timeline for implementation.
ο Inventories potential partners, cost assumptions, funding resources, and feasibility for implementation of strategies and actions.
During the meeting , the Project Team facilitated a discussion with Steering Committee participants to generate their feedback on the draft actions and to inform refinement and prioritization of the actions in the next phase of planning. Key questions included:
ο How would you describe the overall direction of the draft plan, and why?
ο What additional comments or questions do you have about the plan?
The meeting ended with an over view of the Phase 3 public engagement process.
Phase 3 Steering Committee Meeting. Project leaders held the third Steering Committee meeting virtually on October 1st, 2025. CACAP project team leadership from AIR, Clarus, Blue Strike Environmental, and the City of Birmingham attended, along with the Steering Committee participants. For the third Steering Committee meeting , 14 individuals responded that they planned to attend. Ultimately, seven individuals participated in the third Steering Committee meeting , with one participant coming from a CBO, three from local government, two from the private sector, and one from a university.
To begin, participants received updates from the City on key elements of the CACAP, including a refresher on its purpose and background, an over view of the planning process and timeline, and a summary of major findings from Phase 2 public engagement and data collection. Blue Strike Environmental then presented a synthesis of the near-final CACAP, highlighting proposed measures, strategies, and actions across each climate action sector, along with tools and resources to support local implementation. The team also shared estimated per capita greenhouse gas emissions for the Birmingham MSA, a summary of the regional greenhouse gas inventory, and implementation scenarios for projected greenhouse gas emissions. Following these presentations, participants identified priority actions for their organizations, businesses, or communities, discussed key challenges to CACAP implementation, and proposed potential solutions. Finally, participants reflected on messaging strategies, considering which aspects of the plan would most effectively resonate with the public.
Virtual and in-person public events aimed to foster community engagement and shared ownership of the CACAP in determining climate action priorities, refining and aligning strategies and actions for greenhouse gas reduction with local needs, and ultimately strategizing pathways for successful implementation. To promote and maximize participation for all events, AIR distributed information via email outreach to local businesses, government agencies, and community organizations, encouraging them to share it within their networks. AIR also promoted all events on a centralized website and social media platforms, including Facebook and Instagram, using both organic and paid posts, as well as through local news outlets. CACAP project team members from Clarus, AIR, Blue Strike Environmental, and the City of Birmingham attended each event.
Phase 1 Community Kickoff Meetings. Between May 13th and May 29th, 2025, AIR and Clarus facilitated five in-person kickoff meetings with community members across Jefferson, Shelby, St. Clair, Chilton, and Blount Counties, as well as one virtual meeting open to all residents of the Birmingham MSA Project leaders held in-person meetings at central locations within each respective county These kickoff meetings aimed to (1) provide context and purpose for the CACAP; (2) engage participants in solutions-focused ideation sessions about climate; and (3) collect feedback from participants about the measures they believe will reduce pollution and support climate resilience in their community.
In collaboration with Clarus, AIR organized community kickoff meetings across Blount, Chilton, Jefferson, Shelby, and St. Clair Counties. The CACAP project team scheduled a kickoff meeting in Walker County but ultimately canceled it due to inclement weather. The team did not schedule a meeting in Bibb County because of low anticipated community interest and turnout and chose to host a virtual meeting instead. AIR organized this virtual meeting for June 9th, 2025, and opened it to all residents of the Birmingham MSA. In Phase 1, AIR identified and invited a total of 614 individuals across the Birmingham MSA to community kickoff meetings. Table 4 breaks down participation by each Phase 1 Kickoff meeting.
Each community kickoff meeting opened with an over view of the CACAP and seven sectors for climate action and resilience: Agriculture and Open Space, Transportation, Energy and Buildings, Waste and Recycling , Industry, Climate Preparedness and Emergency Management, Water Management. Following the over view, Clarus facilitated generative, solutions-focused conversations guided by three key questions seeking input on each community ’s strengths, challenges, and climate solutions or actions desired for the seven sectors for climate action. Clarus facilitators took notes on the conversation and collected additional feedback via comment cards to capture stakeholder input, categorizing comments by sector and feedback type: Asset, Challenge, or Sug gested Action. Clarus then uploaded the qualitative data from the kickoff meetings to the Blue Strike tracker and shared the data with AIR for further coding and analysis.
Phase 2 Co-Refinement Workshops. The Clarus and AIR team coordinated two in-person community refinement workshops and one virtual workshop for residents of the Birmingham MSA (see Table 5). The team held the first workshop on July 24th, 2025, at Ruffner Mountain Nature Center, with a total of 13 participants. Six participants attended the team’s second workshop on July 30th, 2025, at Vestavia Hills Library in the Forest. The team hosted a final, virtual workshop on August 7th, 2025, with a total of 12 participants.
Each co-refinement workshop began with participants sharing the communities they represent, their motivations for joining , and how they ’ve engaged with the CACAP process so far Participants then heard from the project team about key CACAP updates, including a reminder of its purpose and background, an over view of its process and timeline, and a summary of key findings from Phase 1 of data collection and public engagement. After a brief review of the seven sectors for climate action and the CACAP structure (e. g., measures, strategies, and actions), the project team initiated an Open House and Gallery Walk. During this activity, participants had the opportunity to review the draft actions outlined for sectors of interest, prioritize their top five actions per sector using dot stickers (either physical or virtual), and share any additional feedback or comments for each action. Following the Open House and Gallery Walk, participants engaged in a facilitated discussion, to share reflections about and inform refinement of the draft actions in the next phase of planning. Key questions included:
7/24/2025
7/30/2025 Vestavia Hills Library in the Forest, Vestavia Hills, Jefferson County, AL 16 6
8/7/2025 Virtual Workshop 32 12
Each co-refinement workshop began with participants sharing the communities they represent, their motivations for joining , and how they ’ve engaged with the CACAP process so far Participants then heard from the project team about key CACAP updates, including a reminder of its purpose and background, an over view of its process and timeline, and a summary of key findings from Phase 1 of data collection and public engagement. After a brief review of the seven sectors for climate action and the CACAP structure (e. g., measures, strategies, and actions), the project team initiated an Open House and Gallery Walk. During this activity, participants had the opportunity to review the draft actions outlined for sectors of interest, prioritize their top five actions per sector using dot stickers (either physical or virtual), and share any additional feedback or comments for each action. Following the Open House and Gallery Walk, participants engaged in a facilitated discussion, to share reflections about and inform refinement of the draft actions in the next phase of planning. Key questions included:
1. What excites you most about what you have seen in the draft actions presented today?
2. Is anything missing from the draft actions presented today?
3. If you had to describe the overall direction of the draft plan in one word or a short phrase, what would it be, and why?
Phase 3 Public Comment Sessions. The Clarus and AIR team coordinated two final Public Comment sessions for residents of the Birmingham MSA (see Table 6). Both workshops occurred on October 8th, 2025. The virtual session occurred on Zoom from 11:30 AM to 12:30 PM CDT and included a total of 13 participants. The in-person session occurred at the Birmingham Botanical Gardens from 5:30 PM to 7:00 PM CDT and included a total of seven participants.
Table 6. Over view of Final Community Feedback Workshops
Each Public Comment session began with participants sharing the organizations or communities that they represent, and one thing they have recently witnessed that gives them hope about climate action in Central Alabama. From there, participants identified priority actions for their organizations, businesses, or communities, discussed key challenges to CACAP implementation, and proposed potential solutions. Finally, participants reflected on messaging strategies, considering which aspects of the plan would most effectively resonate with the public.
AIR administered the two online sur veys and a Public Comment period using the PublicInput community engagement platform. To maximize participation, AIR distributed the sur vey and Public Comment links through email outreach to local
in Central Alabama. From there, participants identified priority actions for their organizations, businesses, or communities, discussed key challenges to CACAP implementation, and proposed potential solutions. Finally, participants reflected on messaging strategies, considering which aspects of the plan would most effectively resonate with the public.
AIR administered the two online sur veys and a Public Comment period using the PublicInput community engagement platform. To maximize participation, AIR distributed the sur vey and Public Comment links through email outreach to local businesses, government agencies, and community organizations, encouraging them to share it within their networks. AIR also promoted the sur veys and Public Comment period on social media platforms, including Facebook and Instagram, using both organic and paid posts (see Exhibit 2).

Exhibit 2. Example of Social Media Visual Shared
Phase 1 Online Sur vey. AIR developed the Phase 1 Community Input Sur vey to collect baseline feedback from residents of Bibb, Blount, Chilton, Jefferson, Shelby, St. Clair, and Walker Counties regarding their priorities for addressing the impacts of climate and environmental changes in Central Alabama. The Phase 1 Community Input Sur vey was open for responses between May 6th and June 20th, 2025. As an incentive, participants could enter a drawing for a $50 e-gift card by providing their email address upon completion. In total, AIR received 165 sur vey responses during this period.
Phase 2 Online Sur vey. AIR developed the Phase 2 Community Input Sur vey to collect feedback from residents of Central Alabama regarding the draft implementation strategies and actions to meet greenhouse gas reduction targets for each climate sector. To reduce the cognitive load of the sur vey, AIR incorporated skip logic that allowed participants to select the specific sectors on which they wanted to provide feedback at the outset. The sur vey was open for responses between July 25th and August 29th, 2025. As an incentive, participants could enter a drawing for a $50 e-gift card by providing their email address upon completion. In total, AIR received 50 sur vey responses from participants who both consented to the sur vey and selected at least one sector to review during this period.
Phase 3 Public Comment Period. AIR posted the Draft Plan and Draft Executive Summary on the CACAP website for a final Public Comment period. During this period, participants could provide feedback on the Draft Central Alabama Climate Action Plan in an open comment box and could post their comments either publicly or privately This Online Public Comment period was open for responses between October 8th and October 22nd, 2025.
Key Findings from Phase 1
Across all engagement formats, participants expressed significant concerns about the local impacts of climate change. They specifically cited severe weather events—such as extreme heat and flooding—and the degradation of natural resources as pressing issues. 84% of respondents (N = 148) felt somewhat or very concerned that climate change is impacting their communities. Additionally, 68% of sur vey participants believed that their communities were not sufficiently prepared to address climate change. Steering Committee participants raised similar concerns, reporting an average community preparedness score of 2.2 on a 1-to-5 scale.
Participants reiterated their commitment to protecting the region’s natural resources and biodiversity, as well as strong support for local government inter vention to mitigate climate change. 73% of sur vey participants (N = 149) indicated that it ’s very important for local governments to act in addressing
felt somewhat or very concerned that climate change is impacting their communities. Additionally, 68% of sur vey participants believed that their communities were not sufficiently prepared to address climate change. Steering Committee participants raised similar concerns, reporting an average community preparedness score of 2.2 on a 1-to-5 scale.
Participants reiterated their commitment to protecting the region’s natural resources and biodiversity, as well as strong support for local government inter vention to mitigate climate change. 73% of sur vey participants (N = 149) indicated that it ’s very important for local governments to act in addressing
climate change. When asked to identify priorities for government inter vention, participants across all engagement formats highlighted the need to strengthen storm protection infrastructure, conser ve natural resources, improve the climate resilience of buildings and utilities, expand public transportation options, and improve access to regional recycling and composting programs. Table 7 summarizes Phase 1 participants’ priority themes and actions by sector.
Industry
Water Management
Waste and Recycling
Transportation and Land Use
● Offer grants for the installation of solar power.
● Remove prohibitive surcharges to make solar power more affordable and attainable.
● Encourage companies to invest in renewable and transition sources.
● Adopt or encourage energy-efficient building codes.
● Build a grassroots network of partners to respond when disasters or extreme weather events occur
● Establish flood mitigation and disaster preparedness plans that focus on fair access to resources.
● Improve and expand storm protection infrastructure.
● Focus on increasing utility resilience to extreme weather events.
● Focus on tree planting and maintenance
● Restore and protect natural resources
● Identify creative solutions during the design phase of residential development to include considerations for agriculture and open space
● Introduce native planting requirements in future development plans
● Support and incentivize businesses to adopt sustainable practices.
● Provide support for clean technology innovation in industry processes.
● Consider nature-based solutions in the development of flood plans
● Monitor areas where runoff is an ongoing issue.
● Incentivize nature-based solutions to manage storm and flood water.
● Establish recycling drop-off centers in each of the counties
● Make it easier for homes and businesses to recycle
● Make it safer and easier to get around by walking or biking.
● Make it cheaper, easier, and safer to use p ublic transportation.
● Incorporate more centralized and mixed-use development
● Leverage traffic calming solutions
● Increase community education and encourage alternative modes of transportation
The sectors of greatest interest to the Phase 2 sur vey participants were Energy and Buildings (50%), and Water Management (48%). Across the community workshops and Steering Committee meeting , the sectors which received the most prioritization votes were Transportation and Land Use (135) and Energy and Buildings (134), indicating that the highest number of participants were interested in reviewing these sectors. For each of the seven climate sectors, participants across all engagement formats aligned in their shared prioritization of the following themes and actions, as summarized in Table 8.
Table 8. Summary of Priority Themes and Actions by Sector from Phase 2 Data Collection
Energy and Buildings
[Prioritization Votes: 134
Survey Selection: 50%]
Climate Preparedness and Emergency Management
[Prioritization Votes: 111
Survey Selection: 34%]
Agriculture and Open Space
[Prioritization Votes: 89
Survey Selection: 46%]
Industry
[Prioritization Votes: 103
Survey Selection: 22%]
Water Management
[Prioritization Votes: 92
Survey Selection: 48%]
● 95% of survey respondents felt it was a priority to support a reduction in Alabama Power ’s renewable energy surcharge (the Capacity Reservation Charge)
● Adopt clean energy zoning ordinances
● Develop climate policies for large local facilities
● Establish home energy efficiency programs with income-scaled eligibility criteria.
● Align Urban Heat Island mapping with nature-based climate solutions
● Require permeable surfaces in new or reconstructed hardscaped areas
● Develop a climate risk communication plan for local communities with traditionally fewer resources. 92% of survey respondents felt it was a priority to develop a clear climate communications plan for these communities
● Increase annual native species planting 84% of survey respondents felt it was a priority to collaborate with local horticulture teams to increase the annual planting of native species
● Implement a “No Net Loss” policy for tree removal
● Expand local food recovery efforts
● Require box stores to sell fresh produce
● Support community gardening initiatives and improve communication around the permitting process
● Partner with local technical colleges and workforce organizations to expand career pathways in the green workforce 86% of survey respondents felt it was a priority to develop partnerships to advance green workforce development programs.
● Collaborate with the Greater-Birmingham Alliance to Stop Pollution (GASP) on the Urban Climate Corps program
● Assess the feasibility of using degraded lands for carbon sequestration
● Connect local businesses to state and federal grant programs that support the adoption of greener industry practices
● Compare local stormwater management guidelines with those of peer cities that have adopted green infrastructure standards
● Use Alabama Cooperative Extension’s drought-tolerant landscaping guide to inform plant recommendations
● Enforce strict compliance with backflow prevention standards
● Initiate energy upgrades at the Village Creek Water Reclamation Faci lity
Waste and Recycling
[Prioritization Votes: 113
Survey Selection: 46%]
Transportation and Land Use
[Prioritization Votes: 135
Survey Selection: 44%]
● Reduce construction and demolition waste
● Establish recycling centers in each county in the Birmingham MSA
● 81% of survey respondents felt it was a priority to create a regional compost facility.
● Establish 100-mile non-motorized infrastructure network
● Link neighborhoods to major local destinations
● Revise zoning ordinances to encourage mixed-use development in blighted areas
● Modify zoning codes to improve walkability and density
● Pursue solar array feasibility study with the University of Alabama at Birmingham
● Identify local employers to support the expansion of electric vehicle charging stations
● Incorporate Smart Growth principles into land use planning efforts throughout the MSA
Across qualitative feedback offered during both in-person and online engagement activities, participants highlighted the need for better communication and community education around issues related to climate action. While communication and education strategies themselves do not directly result in the reduction of greenhouse gas emissions, support for communication and education were noted as an effective way to support implementation efforts.
Across all engagement formats, participants expressed support for the direction of the CACAP. A majority (88%) agreed or strongly agreed that they had opportunities to share their personal climate concerns and desired actions through the CACAP community sur vey and meetings. The same percentage also agreed or strongly agreed that the proposed actions would meaningfully reduce climate pollution in their communities. While most participants found the proposed actions exciting and feasible, some expressed concerns about enforcement, long-term accountability, and the need for stronger partnerships with utilities and industry.
Implementation Priorities. Across all engagement formats, facilitators asked participants to reflect on the top two implementation priorities for their respective organizations, businesses, or communities. Participants in the virtual public workshop most frequently identified Smart Growth principles and improved access to fresh, healthy food as top implementation priorities. Other key priorities included advancing nature-based solutions, developing mobility hubs (where people can access multiple types of transportation modes in a central location), and reducing Alabama Power ’s Capacity Reser vation Charge. Table 9 presents all the implementation priorities identified by virtual workshop participants, ranked by frequency of mention.
In-person workshop participants cited relationship-building and engagement (especially with entities like Alabama Power), improving waste diversion efforts, better efficiency in manufacturing and industry, and regional-scale renewable energy projects as top implementation priorities for their organizations, businesses, or communities. Steering Committee participants also emphasized the priority of community engagement and waste reduction efforts, along with advancing solar power generation, addressing Miller Steam Plan emissions, and working toward greenhouse gas reduction targets to improve regional air quality. Steering Committee members also mentioned that Greenville, South Carolina's Swamp Rabbit Trail could ser ve as a model for economic redevelopment that Birmingham could emulate during implementation efforts.
Implementation Challenges and Solutions. Facilitators then asked participants across all engagement formats to consider the following questions:
● What will be our greatest challenges to the implementation of the plan?
● What solutions could help address these challenges?
Cost-related concerns emerged as a central challenge for virtual workshop participants. They noted that the financial burden on individuals, counties, and municipalities could hinder implementation. To address this, they proposed increasing grassroots awareness about the long-term cost-benefits of climate initiatives, including job creation and workforce development. They also sug gested sharing success stories—such as using low-interest loans and federal tax credits for home electrification—to demystify perceived expenses. Additionally, participants emphasized the need for consistent communication about cost-sharing opportunities and supported legislative outreach and grant programs to secure funding.
Virtual workshop participants also expressed concern about limited engagement from community members, as well as from local and county officials. To encourage community buy-in, they sug gested clear communication about the tangible benefits of CACAP implementation—such as cost savings and improved quality of life—and ensuring that public messaging is accessible and relevant. Table 10
success stories—such as using low-interest loans and federal tax credits for home electrification—to demystify perceived expenses. Additionally, participants emphasized the need for consistent communication about cost-sharing opportunities and supported legislative outreach and grant programs to secure funding.
Virtual workshop participants also expressed concern about limited engagement from community members, as well as from local and county officials. To encourage community buy-in, they sug gested clear communication about the tangible benefits of CACAP implementation—such as cost savings and improved quality of life—and ensuring that public messaging is accessible and relevant. Table 10
provides a summary of these implementation challenges and the corresponding solutions proposed by the virtual workshop participants.
Challenges
Cost burden to individuals
Cost burden to counties and municipalities
Securing funding for implementation
Getting buy-in from local and county leaders
Getting buy-in from community members
Navigating policy changes at the federal level
Elevating climate change as a priority issue
Potential
● Community, grassroots awareness about cost benefits, which includes jobs and workforce development opportunities
● The perception of green policy being expensive
● The following is a direct quotation from a workshop participant It is presented in first person to maintain the accuracy of their wording and personal experience: “I got a Home Equity Line of Credit (HELOC) from a local credit union to install a heat pump water heater Five percent (5%) interest rate and then paid it off and got federal tax credit ”
● Widespread and constant information sharing on cost share opportunities
● A legislative engagement and outreach campaign to secure support for implementation from policy makers.
● Creating grant programs
N/A – no solutions identified
● Showing the true value related to the program (e g long- and short-term savings).
● Communication about what ’s happening and why
N/A – no solutions identified
N/A – no solutions identified
In-person workshop participants identified the hesitancy of local leaders, organizations, and institutions to draw attention to climate issues as a key challenge to CACAP implementation. To address this challenge, they highlighted the importance of keeping climate messaging bipartisan and sug gested focusing on economic and health benefits, such as access to organic foods and energy independence. They also recommended educational outreach to help communities grasp the value of climate actions and navigate available resources. Lastly, they recommended visibility and public advocacy to encourage organizational support. In-person participants noted that certain communities have experienced long-standing issues related to solid waste management, which have led to reduced trust in new environmental initiatives. While they didn’t articulate any potential solutions, community recognition of this context underscores the importance of transparent communication, consistent ser vice improvements, and community-driven solutions to support CACAP implementation. Table 11 provides a summary of these implementation challenges and the corresponding solutions proposed by the in-person workshop participants.
Getting buy-in from community members
long- and short-term savings)
● Communication about what ’s happening and why
Navigating policy changes at the federal level
N/A – no solutions identified
Elevating climate change as a priority issue N/A – no solutions identified
In-person workshop participants identified the hesitancy of local leaders, organizations, and institutions to draw attention to climate issues as a key challenge to CACAP implementation. To address this challenge, they highlighted the importance of keeping climate messaging bipartisan and sug gested focusing on economic and health benefits, such as access to organic foods and energy independence. They also recommended educational outreach to help communities grasp the value of climate actions and navigate available resources. Lastly, they recommended visibility and public advocacy to encourage organizational support. In-person participants noted that certain communities have experienced long-standing issues related to solid waste management, which have led to reduced trust in new environmental initiatives. While they didn’t articulate any potential solutions, community recognition of this context underscores the importance of transparent communication, consistent ser vice improvements, and community-driven solutions to support CACAP implementation. Table 11 provides a summary of these implementation challenges and the corresponding solutions proposed by the in-person workshop participants.
Institutions/large organizations/leadership are afraid to attract attention to climate matters
Potential
● Visibility, stand up and be public.
● Show the economic value of things like organic foods
● Keep [messaging] neutral and bipartisan.
● Educational components Solid waste management – communities have experienced historical harm N/A – no solutions identified
Steering Committee participants identified several financial impediments to implementing the CACAP. These included regional donor fatigue, limited state funding for public transit improvements, and the significant investment required to support workforce development initiatives. To overcome these challenges, participants recommended pursuing federal and private grant opportunities, leveraging partnerships to share costs and resources for workforce development, and engaging state government stakeholders to support efforts for increased support for transit infrastructure. Steering Committee members reiterated that strong existing partnerships are foundational for the plan’s future success.
One Steering Committee participant sug gested that care should be used discussing greenhouse gas reduction in relation to improved air quality, because there is not a clear relationship between greenhouse gas emissions and pollutant-related air quality. Specifically, communication which does not distinguish between reductions in greenhouse gas emissions and reductions in other air pollutants may distract from implementation efforts as people may interpret compliance with air quality standards as a signal that greenhouse gas emission reductions are not needed. Table 12 provides a summary of these implementation challenges and the corresponding solutions proposed by the Steering Committee participants.
Table 12. Steering Committee Implementation Challenges & Solutions Challenges
Difficult
Institutions/large organizations/leadership are afraid to attract attention to climate matters
● Show the economic value of things like organic foods.
● Keep [messaging] neutral and bipartisan
● Educational components.
Solid waste management – communities have experienced historical harm N/A – no solutions identified
Steering Committee participants identified several financial impediments to implementing the CACAP. These included regional donor fatigue, limited state funding for public transit improvements, and the significant investment required to support workforce development initiatives. To overcome these challenges, participants recommended pursuing federal and private grant opportunities, leveraging partnerships to share costs and resources for workforce development, and engaging state government stakeholders to support efforts for increased support for transit infrastructure. Steering Committee members reiterated that strong existing partnerships are foundational for the plan’s future success.
One Steering Committee participant sug gested that care should be used discussing greenhouse gas reduction in relation to improved air quality, because there is not a clear relationship between greenhouse gas emissions and pollutant-related air quality. Specifically, communication which does not distinguish between reductions in greenhouse gas emissions and reductions in other air pollutants may distract from implementation efforts as people may interpret compliance with air quality standards as a signal that greenhouse gas emission reductions are not needed. Table 12 provides a summary of these implementation challenges and the corresponding solutions proposed by the Steering Committee participants.
Difficult funding environment and donor fatigue in the region
Workforce development strategies require resources
Lack of state funding for public transit in major cities
Lack of understanding around greenhouse gas emissions in relation to broader air quality standards could lead to confusion about implementation importance
● Pursue federal and private grants.
● Leverage partnerships to share resources and costs
● Work to engage state government to support transit improvement efforts.
● Use language which clearly refers to greenhouse gas emissions versus broader air quality standard compliance
Key Messages. Across all engagement formats, participants emphasized that framing the CACAP around economic opportunity, community-driven solutions, and locally relevant benefits would be the most effective way to engage residents of the Birmingham MSA Virtual workshop participants identified a number of CACAP messaging strategies that they felt would resonate with residents of the Birmingham MSA (Table 13), such as focusing on the fiscal advantages of the plan (e. g., job creation and cost savings), highlighting local commitment and long-term impact, supporting the accessibility of incentives (e. g., rebates, tax credits, or grant programs), framing the plan around quality of life improvements, and emphasizing community-based job creation.
What key messages will resonate with the public about this plan?
● The Plan creates jobs and saves money Do not talk about “climate” or “sustainability ”
● The MSA is behind this plan and committed to its implementation. There are long-term benefits.
● Identifying and helping people find and take advantage of incentives would help.
● Build more of the things we need to live a better life The concept of abundance
● Creating jobs that are future-forward and are based in the communities.
In-person workshop participants felt that messages about land rights and affordability, energy independence, community self-sufficiency, the benefits of renewable energy adoption, and leveraging corporate partnerships for local benefit would resonate most with residents of the Birmingham MSA (Table 14).
What key messages will resonate with the public about this plan?
● Messaging about land rights and affordability
● Messaging about self-sufficiency and sustainment – not having to rely on help outside of the community (inputs that are more effective)
● Walmart and other corporations to allow farmers’ markets in their empty lots
● Implement renewable energy.
● Strength, sustainability, and energy independence (focus on what we have here)
Steering Committee participants highlighted the effectiveness of CACAP messaging focused on quality-of-life improvements through better access to green spaces and natural resources, regional economic development opportunities, public transit expansion, and connecting climate action to everyday life and personal impact (Table 15).
What key messages will resonate with the public about this plan?
● Natural resources like Red Rock Trail System led by the Freshwater Land Trust, support climate action and quality of life
● Walkable, livable communities with better access to trails, parks, and green spaces are co-benefits of climate action
Economic Development
● Actions in the plan (like clean energy and open space) serve as tools to attract talent and grow business
Modern Transit
● The focus on improving public transit options to reduce car dependency and provide better access to jobs will resonate with the public
● Transition Birmingham-Jefferson County Transit Authority (BJCTA) buses from diesel to alternatives (CNG, electric)
● Expand Via to provide better job access.
● Reduce car dependency so residents don’t feel a car is required
● Promote e-bikes and trail connectivity
● Increase mobility and accessibility across Birmingham.
Personal and Local Impact
● Connect the plan to personal and local impact, and the impact of day-to-day living
● Younger residents and new residents are interested in clean energy (EVs, solar rooftop demands).
Participant Reflections and Comments on the Draft Plan. Participants in the Phase 3 Public Comment sessions and third Steering Committee meeting had the opportunity to provide any additional comments they had about the overall Draft Plan. The online Public Comment period also provided an open-ended prompt for participants to provide any comments they had about the Draft Plan. Table 16 summarizes all additional comments received during the Phase 3 meetings and online Public Comment period.
Table 16. Comments on the Draft CACAP
Relevant Page Number Comment
“As a resident of Birmingham and participant in the public input sessions, I want to express my full support for the Comprehensive Area Climate Action Plan. I appreciate the [holistic] approach that invited residents to share their voices, and I commend the County for developing a plan that reflects both local needs and global responsibility
The plan represents a critical opportunity for Jefferson County and the City of Birmingham to lead boldly on economic resilience, innovative technology, and strong economic development amidst ongoing threats to good paying jobs from other states and countries. I urge policymakers to pursue the high impact actions identified in the plan with ambition and urgency, especially those that improve energy efficiency, expand access to clean transportation, and create more opportunities for Alabamians to live abundantly
We have an opportunity to position Jefferson County as a regional leader in green technology and innovation. I encourage you to be aggressive in implementing this plan and to maintain transparent, ongoing engagement with residents as strategies evolve
Thank you for your leadership and commitment to a healthier, more abundant future for all of us ”
Page 64-65; 2A, 2
Page 123; Table K1, Strategy 7 4
“While I can understand the sentiment behind putting a solar microgrid in the 35th Avenue Superfund Site, I have concerns around this strategy. Residents in the area should be consulted before any major projects are implemented Figure H shows a potential PV array across the street from homes, which may result in unintended consequences if residents are not involved in the placement of the project ”
“Bus fare vouchers would be fantastic! They would encourage ridership, while making public transportation financially accessible. There would be some costs associated with a voucher system including bus maintenance and pay for the CDL drivers, especially if the voucher program results in increased ridership, the buses may require maintenance more often. A question to consider: Would there be other funding that replaces bus fare? ”
Page 151; 11.3
Pages 56, 75, 145, 150, 206, 208, 210
“Consider the avenues in which stormwater runs to these flood-prone zones Water running from upstream adds to flash flooding in flash prone zones. Focusing on flood-prong zones at first and then continuing to build out nature-based solutions City-wide will help prevent further flooding in those flood-prone areas by sending less water downstream during times of heavy rain.”
“A lot of technical language is used in this CACAP; especially around energy efficiency and renewable energy My concern is that officials or staff less familiar with such language may be wary of implementing strategies that they are not familiar with. I would like to recommend a glossary containing short definitions for more complex technical words and abbreviations that can be used as a reference. I see that abbreviations are spelled out at their first appearance, which is standard, but a glossary may make things clearer Examples include, VRF, PV, CO2e ”
“ The regulatory bodies over industry should be involved in this plan, namely ADEM and the Jefferson County Department of Health. These are the delegated authorities over most of the Clean Air Act, Clean Water Act, RCRA, and many other pollution prevention legislations that would need to be included in any changes to industrial processes in order for them to be legal.”
At the end of the Phase 1 and Phase 2 sur veys, respondents could share their counties of residence and age categories. In the Phase 1 sur vey, approximately 62% of the total respondents (N = 102) opted to provide demographic information. Most Phase 1 sur vey respondents (63%) indicated that they reside in Jefferson County Walker (4%), St. Clair (4%), and Blount (2%) counties had the fewest sur vey respondents. Five percent of respondents reported residing in “other ” counties outside of the Birmingham MSA, including Geneva, Hale, Mobile, and Morgan. Additionally, 5% of respondents chose not to disclose their locations. Most Phase 1 sur vey respondents indicated that they are either adults aged 21 to 59 years (58%) or seniors aged 60 years or older (35%). Youth (under 21) made up the smallest percentage of respondents.
In addition to data about participant characteristics through the Phase 2 sur vey, Phase 2 virtual community workshop facilitators asked the participants to share the Central Alabama county they call home. In-person community workshop participants also had the option to share their residential zip codes when they signed into the events. A majority of the Phase 2 sur vey participants (70%) and both in-person (100%) and virtual workshop participants (89%) reported that they reside in Jefferson County. Smaller proportions of the sur vey participants (16%) and virtual workshop participants (11%) reported that they reside in Shelby County. Most Phase 2 sur vey respondents indicated that they are either adults aged 21 to 59 years (62%) or seniors aged 60 years or older (35%).
Phase 3 activities did not ask participants to provide residential or demographic information, to reduce response fatigue given the length of the Draft Plan (291 pages). However, most of the participants in the Phase 3 public and Steering Committee meetings indicated in their self-introductions that they resided in Jefferson County, with some representation from Shelby County. Additionally, while the online Public Comment period did not ask respondents to identify their county of residence, all commenters either voluntarily identified the City of Birmingham as their residence or provided feedback specific to the City of Birmingham. Exhibit 3 summarizes public meetings and online participation by county across the three phases.
3. Community Participants by County
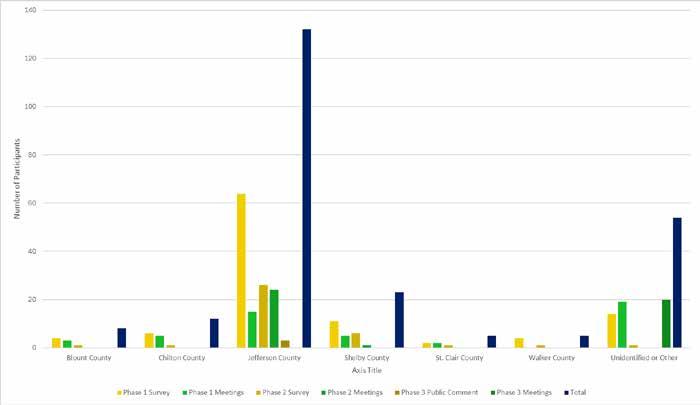
Report developed for the Central Alabama Climate Action Plan by: Evelyn Shu, Katherine Gross, Ellie Crump, and Henry Alexander; The American Institutes for Research
The Community Engagement activities for the Central Alabama Climate Action Plan (CACAP) offered a robust platform for community members and stakeholders to provide input about local concerns, needs, and opportunities to help inform, refine, and prioritize specific climate actions across key sectors. Through a combination of virtual and in-person Public Meetings, Steering Committee meetings, and online input opportunities, participants shared valuable feedback to inform the region’s approach to meeting greenhouse gas reduction targets for each of the seven CACAP sectors.
In 2024, the City of Birmingham (hereafter, the City) received an EPA grant to establish a Central Alabama Climate Action Plan (CACAP) for the Birmingham Metropolitan Statistical Area (MSA). Based on community feedback, the CACAP proposed and refined a set of greenhouse gas reduction measures, strategies, and actions. The Plan’s actions are intended to create significant co-benefits for residents. For example, in addition to reducing greenhouse gas emissions, actions will also help advance livable communities, economic development, and quality of life. This plan is not regulatory but can instead ser ve as a toolkit that cities and counties in the MSA can use to reduce carbon footprints while meaningfully improving quality of life, resilience, and economic vitality. The City will work to support the adoption of the actions and measures relevant under the City ’s jurisdiction.
The Final Findings underscore the community ’s commitment to climate action and its desire for collaborative, informed, and impactful solutions. Across all three Phases, participants consistently expressed a shared commitment to protect and improve the region’s natural and community resources, improve sustainability, and achieve emission reduction goals. By integrating community-driven priorities with technical feasibility and policy innovation, the CACAP is well-positioned to ser ve as a toolkit for regional climate planning and resilience.
In addition to the plan itself, the Community Engagement process has highlighted strong networks and collaboration opportunities, positioning the CACAP to ser ve as a catalyst for long-term environmental and quality-of-life progress. By demonstrating that community input has a real and meaningful influence on decision-making , the City has aimed to foster civic trust and create the conditions for long-lasting collaboration. As the CACAP transitions from design to implementation, the relationships and networks built through this Community Engagement process will be instrumental in mobilizing resources, maintaining momentum and buy-in, and adapting strategies to meet changing community needs. This engagement was designed to not only help shape the CACAP, but also to help build a durable partnership between the City and its residents that is grounded in mutual respect and can support a resilient, climate-ready future.
Building on the climate action priorities and needs identified by community members during Phase 1 of data collection, the Blue Strike Environmental team developed a preliminary set of implementation measures, strategies, and actions aimed at achieving greenhouse gas reduction targets across key climate sectors. Strategies, measures, and actions were designed to be relevant to a range of settings and contexts, including urban, suburban, and rural contexts. In Phase 2, the American Institutes for Research (AIR) and Clarus Consulting (Clarus) gathered qualitative and quantitative community feedback on these proposed measures, strategies, and actions, supporting the City in

The Birmingham Metropolitan Statistical Area (MSA) Greenhouse Gas (GHG) Inventory provides a comprehensive assessment of emissions generated within the region’s geographic boundary. As a foundational element of the MSA’s Central Alabama Climate Action Plan (CACAP), this Inventory establishes a clear, data-driven emission baseline to guide strategies for reducing emissions, improving air quality, and building climate resilience.
The Inventory quantifies GHG emissions across major sectors using internationally recognized accounting protocols, ensuring accuracy, transparency, and comparability with other communities. It covers direct emissions from within the MSA (Scope 1), indirect emissions from purchased energy (Scope 2), and other indirect emissions from the supply chain and related activities (Scope 3). Each scope has associated sectors and sources. Sectors are defined as broad categories of activity that group similar types of emissions. Within each sector, sources identify the specific processes, equipment, or activities that generate GHGs, enabling consistent classification, analysis, and tracking over time.
Table A shows the following emissions sectors and sources are included in this inventory:
TRANSPORTATION & MOBILE SOURCES
SOLID WASTE
WATER & WASTEWATER
DESCRIPTION
Emissions from on-road and off-road vehicles, public transit, rail, air travel, water travel, and other mobile equipment powered by fossil fuels.
Methane released from waste decomposition in landfills, along with emissions from waste combustion and handling.
Emissions associated with the extraction, treatment, distribution, and disposal of potable water and wastewater, including fugitive emissions from treatment processes.
COMMERCIAL ENERGY
INDUSTRIAL ENERGY
RESIDENTIAL ENERGY
Emissions from electricity and natural gas consumed by commercial buildings and facilities.
Emissions from fuel combustion and electricity consumption in industrial facilities and manufacturing operations.
Emissions from fuel combustion for space heating, water heating, cooking, and other household uses, as well as electricity-related emissions.
PROCESS & FUGITIVE EMISSIONS
UPSTREAM IMPACTS OF ACTIVITIES
AGRICULTURE, FORESTRY, AND OTHER LAND USE (AFOLU)
Local distribution fugitive emissions, reported leakage from natural gas operations, and process
Indirect emissions from the production, refining, and transportation of fuels and electricity used within the MSA.
Emissions and removals associated with fertilizer and manure, as well as land use, land-use change, agricultural activities, and forestry management.
By accounting for emissions across these sectors, the inventory delivers a complete view of the MSA’s carbon footprint.
The CACAP GHG Inventory was developed using ICLEI’s ClearPath tool and the U.S. Community Protocol for Accounting and Reporting of Greenhouse Gas Emissions (USCP), supplemented with EPA sources to complete a comprehensive inventory of all sinks and sources within the MSA Boundary.
This Inventory follows the reporting protocol outlined by ICLEI as referenced in the US Community Protocol1 and Local Government Operations Protocol2. Local governments are expected to evaluate emissions of the six internationally recognized GHGs under the Kyoto Protocol3, namely Carbon dioxide (CO₂), Methane (CH4), Nitrous oxide (N₂O), Hydrofluorocarbons (HFCs), Perfluorocarbons (PFCs), and Sulfur hexafluoride (SF6)4. To ensure consistency and comparability, GHG emissions are expressed in terms of carbon dioxide equivalent (CO₂e), which account for the varying impacts of different GHGs. The Global Warming Potential (GWP) metric is used to calculate CO₂e by comparing the heat-trapping ability of each gas to that of CO₂ over a specific time horizon, typically 100 years. The GWPs used in this inventory are from the Intergovernmental Panel on Climate Change (IPCC) Fifth Assessment Report (AR5)5, provided in Table B
1 ICLEI - Local Governments for Sustainability USA. (2023). U.S. community protocol for accounting and reporting of greenhouse gas emissions, version 1.2. Retrieved from https://icleiusa.org/us-community-protocol/
2 ICLEI - Local Governments for Sustainability USA, California Air Resources Board, & California Climate Action Registry. (2010). Local government operations protocol for the quantification and reporting of greenhouse gas emissions inventories, version 1.1. Retrieved from https://icleiusa.org/resources/local-government-operations-lgo-protocol/
3 United Nations. (1998). Kyoto Protocol to the United Nations Framework Convention on Climate Change. Retrieved from https://unfccc.int/resource/docs/convkp/kpeng.pdf
4 As referenced in the US Community Protocol, the high GWP GHG’s perfluorocarbons and sulfur hexafluoride are not required to complete an accurate inventory. The City reported no refrigerant loss, and therefore no hydrofluorocarbons do not appear in the inventory. All other GHGs are measured and reported.
5 Intergovernmental Panel on Climate Change. (2014). Climate change 2014: Mitigation of climate change. Contribution of Working Group III to the Fifth Assessment Report of the Intergovernmental Panel on Climate Change. Cambridge University Press. Retrieved from https://www.ipcc.ch/report/ar5/wg3/
GHG inventories are required to report Scope 1 and 2 emissions, and some Scope 3 emissions with significant influence.
Scope 1 emissions are those that are produced directly on-site within the boundary of the study. These emissions result from fuel combustion in stationary sources like municipal buildings and facilities, as well as mobile sources such as municipal-owned vehicle fleets and public transit buses. Additionally, Scope 1 includes fugitive emissions from sources like in-jurisdiction landfill methane release and leaks from refrigeration or wastewater treatment processes. Because these emissions stem from activities that the MSA directly controls or operates, they are a key focus for local governments aiming to reduce their carbon footprint through efficiency upgrades, fleet electrification, and improved waste management practices.
Scope 2 emissions refer to indirect GHG emissions associated with the consumption of purchased electricity, steam, heating, or cooling within the MSA’s boundary. While these emissions do not come from sources directly owned or controlled by the cities and counties within the MSA, they result from the generation of energy that the MSA uses in its operations. For municipalities, Scope 2 emissions primarily come from electricity consumption in government buildings, public lighting, water and wastewater treatment facilities, and other infrastructure. The amount of Scope 2 emissions depends on the carbon intensity of the electricity grid, meaning cities and counties that rely on fossil fuel-based power generation will have higher emissions than those using cleaner energy sources. Reducing Scope 2 emissions often involves increasing energy efficiency in municipal operations, investing in renewable energy procurement, and implementing local policies to support a cleaner electricity supply.
Scope 3 emissions refer to indirect GHG emissions that occur outside a city or county's direct control but are influenced by its activities. These emissions result from sources not owned or directly operated by cities and counties but are still a consequence of its operations, services, and community activities. For municipalities, Scope 3 emissions can include employee commutes, emissions from the production and transportation of goods and services procured by the cities and counties, solid waste disposal, and others. Not all Scope 3 emissions are required to be reported by the USCP, and those required to report are included in this inventory.
Rounding is applied to the final GHG values presented in the tables and figures throughout this document. However, values are not rounded during intermediary calculation steps. As a result of this rounding, some totals in the tables or figures may not match the exact sum of their components.
Emission sources are the distinct activities or processes within a community, organization, or sector that release GHGs into the atmosphere, either directly through fuel combustion and chemical processes or indirectly through the use of electricity, goods, and services. The primary sources of emissions are listed below, with their respective data source listed.
• Electricity – Direct usage data from the local utility; Alabama Power–specific emission factors applied.
• Natural Gas – In the absence of utility-provided data, activity was estimated using NREL SLOPE model outputs.
• Propane & Fuel Oil No. 2 – Downscaled U.S. EIA state-level fuel use data.
• Transportation – On-road emissions estimated using a blended dataset from Google Environmental Insights Explorer (EIE) and EPA MOVES; aviation fuel data from Birmingham International Airport; other off-road activity from EPA National Emissions Inventory (NEI).
• Solid Waste – Reported landfill emissions from EPA FLIGHT and population-based estimates for unreporting landfills.
• Potable Water – Electricity for treatment and pumping included under the commercial electricity sector.
• Wastewater – Fugitive emissions data from Jefferson County treatment plants; septic and other county wastewater estimated by population.
• Agriculture – Fertilizer and manure management from state-level activity data; land use estimates from ICLEI LEARN.
• Fugitive Emissions – Natural gas distribution and facility data from EPA FLIGHT; local distribution system leaks estimated using USCP guidance.
• Upstream Impacts – Transmission and distribution losses reported by the utility, combined with total loss factors for the electricity supply chain.
The inventory covers the entire MSA. This includes a total of seven counties:
• Bibb County
• Blount County
• Chilton County
• Jefferson County
• Shelby County
• St. Clair County
• Walker County
The primary GHG inventory will be analyzing the MSA as a group. Some specific sectors, including electricity and transportation will be broken down by county.
The 2023 calendar year serves as the base inventory year, marking the MSA’s first-ever community-wide GHG inventory. All future inventories will build upon this baseline to track progress over time. 2023 was chosen as it is the most recent post-COVID year with complete data.
Historical estimates for earlier years were developed by extrapolating backward from 2023 activity data using Alabama’s reported sector-level emission reduction trends. These extrapolations allow for contextualizing changes over time while acknowledging that direct activity data for earlier years were limited.
All activity data were reviewed for internal consistency, cross-checked against state and federal datasets, and reconciled across sectors to avoid double counting. Proxy estimates were applied only where direct data were unavailable, using population, third party sources, or activity intensity scaling.
This Inventory is part of a living document, developed using the best available data and methods at the time of compilation. As improved data sources and methodologies become available, the Inventory will be updated to reflect the most accurate and current information.
This section presents the GHG emissions profile for the MSA as a whole, providing a comprehensive picture of regional emissions across all major sectors. The results first summarize total MSA-wide emissions, followed by targeted breakdowns for specific sectors and sources.
While the primary focus is on the MSA-wide inventory, selected results are also disaggregated by county for electricity consumption, transportation and land use emissions. The three sectors with the most robust and geographically specific data available. This allows for both a broad regional understanding and insight into how these key sectors vary across counties.
The section concludes with emissions estimates for notable individual sources, including the University of Alabama Birmingham and Birmingham International Airport, which represent significant contributors within the MSA.
The total emissions produced within the MSA boundary during the 2023 calendar year was 21.5 million metric tonnes of CO2e emissions (MMT CO2e). Table C shows a breakdown of emissions by sector for the seven-county MSA.
Figure A illustrates GHG emissions (in MMTCO₂e) across key sectors. Transportation & Mobile Sources is the largest contributor, accounting for 7.92 MMTCO₂e. Other significant sources include Process & Fugitive Emissions (5.77), Residential Energy (3.69), Industrial Energy (3.60), and Commercial Energy (3.40).
Smaller contributions come from Solid Waste (0.83), Upstream Impacts of Activities (0.68), and Water & Wastewater (0.05). Notably, AFOLU (Agriculture, Forestry, and Other Land Use) sequesters 4.47 MMTCO₂e, and is a carbon sink.
Figure B presents the percentage distribution of GHG emissions across all producing sectors within the MSA, excluding the AFOLU sector, which sequesters carbon. Transportation sources contribute the largest share at 31% of total emissions, process and fugitive emissions account for 22%, followed by stationary energy use in the residential (14%), industrial (14%), and commercial (13%) sectors. Solid waste contributes 3%, and finally upstream impacts of activities and water/wastewater systems contribute 3% and 0.19%, respectively.
31% TRANSPORTATION & MOBILE SOURCES
22% PROCESS & FUGITIVE EMISSIONS 14% INDUSTRIAL ENERGY
The CACAP represents emissions data for seven counties within the MSA. While it is important to assess GHG emissions for the MSA as a whole, examining results at the county level provides a clearer picture of local trends, priorities, and opportunities for action. This section highlights select county-specific inventory results, including electricity use, transportation, and emissions from land use change.
Electricity emissions are the largest contributor to GHG emissions within the MSA boundary. As such a detailed breakdown of electricity emissions by county was taken. Table D shows the breakdown of CO₂e emissions per county within the MSA.
Figure C presents electricity-related GHG emissions across counties within the MSA, disaggregated by sector—residential (yellow), commercial (blue), and industrial (green). Each county is depicted using a proportional pie chart, where the size of the chart corresponds to the total metric tons of CO₂ equivalent (MTCO₂e) emitted from electricity consumption. Jefferson County exhibits the highest overall emissions in the MSA by a substantial margin, as indicated by both the dominant pie chart and the supporting bar graph. Emissions in Jefferson are driven primarily by commercial electricity use, followed closely by residential and industrial sectors. This spatial and sectoral emissions profile highlights Jefferson County as a critical focus area for targeted mitigation strategies.
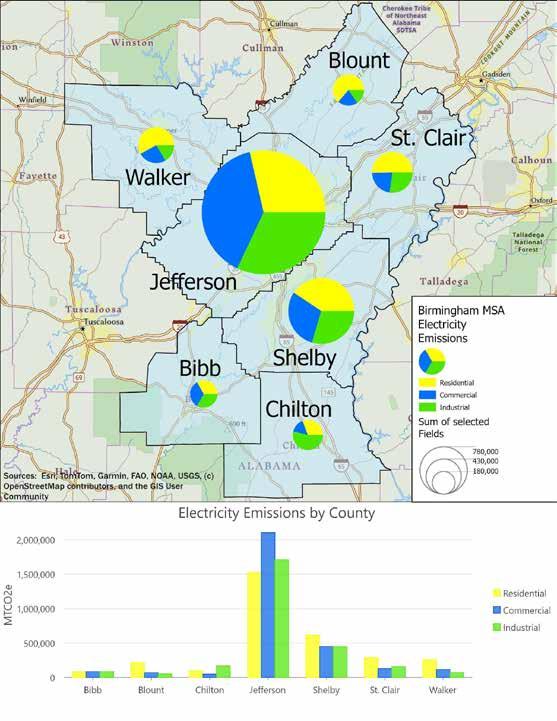
Forests and land use play an important role in a community’s GHG profile by both releasing and absorbing carbon. Activities such as tree harvesting, land clearing, and changes in vegetation can result in emissions, while forest growth and conservation efforts can remove carbon from the atmosphere.
The ICLEI LEARN tool6 estimates the net impact of these land-based carbon flows within the community boundary. The analysis is based on the National Land Cover Database (NLCD), which estimates land cover and biomass data to quantify sources and sinks. Land use change emissions insights provide a more complete picture of the community’s carbon balance and support land use planning that aligns with climate goals.
Wildfires and insects are a major driver of land use emissions for the MSA. These events caused immediate carbon releases through biomass combustion and resulted in long-term emissions due to the conversion of forested areas to non-forest land. This shift has reduced the land’s carbon sequestration capacity.
Table E below shows a simplified report of land use emission categories based on IPCC categories. The total net flux of land use is an emission of -6.2 MMT CO₂e per year. This is primarily due to the shifting landscape change from forests to non-forests.
6 ICLEI – Local Governments for Sustainability USA. (n.d.). Land Emissions and Removals Navigator (LEARN) tool. ICLEI USA. https://icleiusa.org/learn-tool/
Figure D presents the 2025 NLCD dataset 7 for the MSA, illustrating spatial patterns in land cover that underpin emissions modeling in the LEARN tool. NLCD serves as a foundational geospatial input for LEARN’s estimation of GHG fluxes resulting from land use change, enabling the detection of key transitions—such as urban encroachment, forest conversion, or canopy gain/loss—at a consistent national scale. Within the LEARN framework, this classification data is combined with standardized carbon stock factors and disturbance regimes to generate spatially explicit, protocol-aligned emissions and removals estimates.
7 U.S. Geological Survey. (2024). Annual NLCD Collection 1 Science Products [Data set]. U.S. Geological Survey. https://doi.org/10.5066/P94UXNTS USGS+2USGS+2
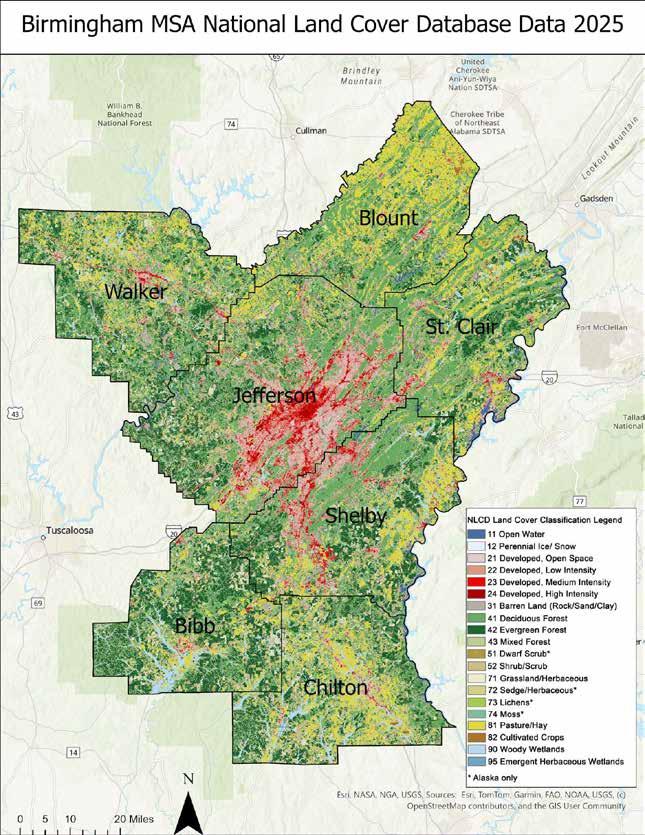
Emissions from Jefferson county were also portioned out to include only emissions from the one county. This includes a total amount of 14.27 MMTCO₂e emissions produced in the year 2023. The County also sequestered 1.43 MMTCO₂e. Table F shows a net balance of 12.84 MMTCO₂e.
Figure E below shows all emission producing sectors in Jefferson County. AFOLU was excluded due to being an emission sink. The largest single source of emission in Jefferson County is Transportation at 35%. This is followed by electricity and natural gas from industrial buildings at 17%, and process emissions from factories at 15.7%. Emissions from residential and commercial buildings produce 13.6%, and 13.4%, respectively. Rounding off emissions are Solid Waste (3.6%), Upstream impacts from Electricity T&D losses (1.3%), and Water and Wastewater facilities (0.14%).
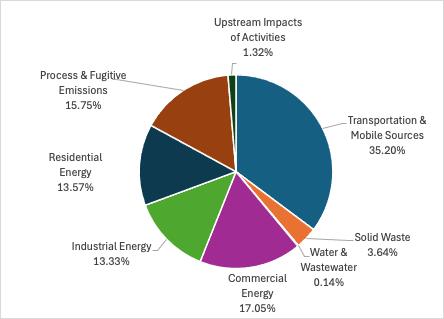
Jefferson County is the largest source of GHG emissions among the seven counties in the MSA As the seat of the MSA and home to the capital of Alabama, Jefferson County plays a central role in the region. It produces approximately 60% of total emissions across the MSA, while the remaining six counties collectively contribute 40%. Through this plan, Jefferson County is committing to emission reductions and taking responsibility for its disproportionate share of the region's emissions, as shown in Figure F
Jefferson County is the largest source of GHG emissions among the seven counties in the MSA. As the seat of the MSA and home to the capital of Alabama, Jefferson County plays a central role in the region. It produces approximately 60% of total emissions across the MSA, while the remaining six counties collectively contribute 40%. Through this plan, Jefferson County is committing to emission reductions and taking responsibility for its disproportionate share of the region's emissions, as shown in Figure F.
e F: Jefferson County emissions compared to the other six counties
Figure F: Jefferson County emissions compared to the other six counties
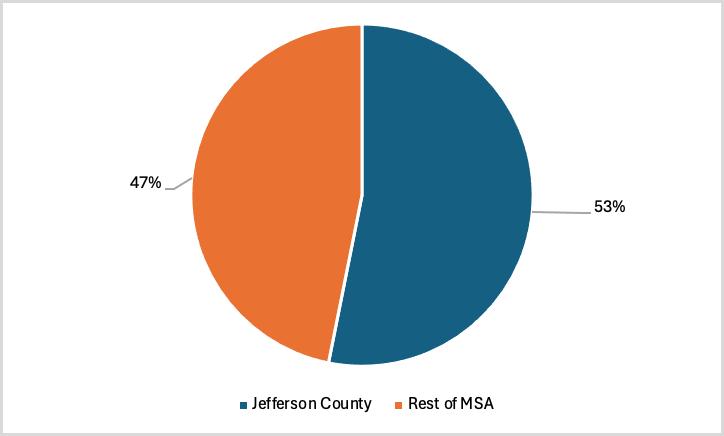
Jefferson County
Rest of MSA
21, the United States formally rejoined the Paris Agreement and submitted a new Nationally mined Contribution (NDC), committing to reduce GHG emissions 50–52% below 2005 levels by and to achieve net-zero emissions economy-wide by 2050 These targets reflect the fede ral nment ’s climate priorities. They also ser ve as a framework for coordinated action across all levels of nment, industry, and civil society The commitments are supported by landmark legislation, ding the Bipartisan Infrastructure Law and the Inflation Reduction Act, which together provide antial investments in clean energy, transportation electrification, building efficiency, and industrial bonization.
MSA will adopt these national climate goals as foundational benchmarks for regional planning and ions reduction In doing so, the MSA aligns with the broader national trajectory toward a carbon tion-free electricity grid by 2035, expanded deployment of electric vehicles and charging tructure, reduced methane emissions, and increased investment in historically underser ved munities.
pport this alignment and guide local target-setting , GHG emissions for the MSA were estimated for eriod 2005 through 2023. Because comprehensive local emissions data before 2023 were limited, rical estimates were derived by applying a combination of Alabama’s statewide utility emissions s, and national trends for other sectors proportion ally to the Birmingham region. This approach
In 2021, the United States formally rejoined the Paris Agreement and submitted a new Nationally Determined Contribution (NDC), committing to reduce GHG emissions 50–52% below 2005 levels by 2030 and to achieve net-zero emissions economy-wide by 2050. These targets reflect the federal government’s climate priorities. They also serve as a framework for coordinated action across all levels of government, industry, and civil society. The commitments are supported by landmark legislation, including the Bipartisan Infrastructure Law and the Inflation Reduction Act, which together provide substantial investments in clean energy, transportation electrification, building efficiency, and industrial decarbonization.
The MSA will adopt these national climate goals as foundational benchmarks for regional planning and emissions reduction. In doing so, the MSA aligns with the broader national trajectory toward a carbon pollution-free electricity grid by 2035, expanded deployment of electric vehicles and charging infrastructure, reduced methane emissions, and increased investment in historically underserved communities.
To support this alignment and guide local target-setting, GHG emissions for the MSA were estimated for the period 2005 through 2023. Because comprehensive local emissions data before 2023 were limited, historical estimates were derived by applying a combination of Alabama’s statewide utility emissions trends, and national trends for other sectors proportionally to the Birmingham region. This approach enabled a consistent and policy-aligned estimation of regional emissions trajectories. Calendar year 2005 was necessary to be estimated for a baseline year to remain consistent with federal climate targets, and serves as the reference point for setting the MSA’s mid-term 2030 reduction benchmark. The 2050 target remains net-zero emissions across all sectors, in alignment with national commitments.
Table G summarizes the estimated emissions trajectory for the MSA, including an estimated 2005 base year, the 2023 comprehensive GHG emission baseline, the 2030 interim target, and the 2050 net-zero objective.
Figure G shows estimated emissions between 2005 and 2023, the 2023-2050 BAU forecasts, and compared with the GHG Emission Targets.
Figure G: Estimated 2005–2050 Emissions and Targets
Figure E: Estimated 2005-2050 Emissions and Targets
20052007200920112013201520172019202120232025202720292031203320352037203920412043204520472049
4.1 BAU Projections Methodologies
The Business-as-Usual (BAU) Forecast represents expected emissions in the absence of additional climate action, based on demographic and sectoral growth trends This BAU Forecast was developed in the ICLEI ClearPath tool. To develop this baseline, population growth was applied uniformly across all sectors, reflecting the strong link between community expansion and rising demand for energy, transportation, housing, and services Within the Residential, Commercial, and Industrial Energy sectors, the EPA’s Energy Consumption Projections tool10 was used to project electricity, natural gas, and propane consumption. That tool is developed for the entire State of Alabama, but a confident assumption that those projections will be consistent for the MSA Within the transportation sector specifically, default carbon intensity growth rates from the U S Community Protocol, derived from federal CAFE standards, were incorporated to capture improvements in vehicle efficiency over time. This approach provides a consistent, standardized framework for projecting future emissions, while highlighting the extent to which anticipated population increases are likely to drive upward pressure on overall GHG emissions This BAU only includes carbon emissions and removes carbon sinks from land usage
4.2 BAU Projections Results
10 U S Environmental Protection Agency (n d ) Download the State Inventory and Projection Tool U S Environmental Protection Agency Retrieved August 21, 2025, from https://www epa gov/statelocalenergy/download-state-inventory-and-projection-tool
One of the most significant long-term predictors of GHG emissions is population growth. As communities expand, so do demands for transportation, energy, housing, water, and waste management, all of which are key contributors to emissions. A MSA-wide analysis of population growth provides critical insights into how these pressures may evolve over time and where they are most concentrated.
Between 2010 and 2023, the total population across the seven counties in the MSA grew from 1,115,485 to 1,181,432, representing a net increase of 65,947 residents, with a growth of nearly 6%. However, this growth was not evenly distributed. From 2010 to 2020, the MSA population grew at an average rate of 0.32% per year, reflecting relatively modest expansion. Since 2020, however, growth has accelerated sharply to 0.85% per year, more than double the previous decade’s pace. Taken together, the 2010–2023 period shows an overall average annual growth of 0.44%, as shown in Table H.
8 U.S. Census Bureau. (2010). ACS demographic and housing estimates for Bibb, Blount, Chilton, Jefferson, St. Clair, Shelby, and Walker Counties, Alabama: 2010 American Community Survey 5-year estimates [Data table ACSDP5Y2010.DP05]. Retrieved from https://data.census.gov/table/ACSDP5Y2010. DP05?q=population&g=050XX00US01007,01009,01021,01073,01115,01117,01127
The Business-as-Usual (BAU) forecast represents expected emissions in the absence of additional climate action, based on demographic and sectoral growth trends. To develop this baseline, population growth was applied uniformly across all sectors, reflecting the strong link between community expansion and rising demand for energy, transportation, housing, and services. For the transportation sector specifically, default carbon intensity growth rates from the USCP—derived from federal CAFE standards—were incorporated to capture improvements in vehicle efficiency over time. This approach provides a consistent, standardized framework for projecting future emissions, while highlighting the extent to which anticipated population increases are likely to drive upward pressure on overall GHG emissions. This BAU only includes carbon emissions, and removes carbon sinks from land usage.
Table I presents projected emissions for key forecast years 2030 and 2050 under the BAU scenario. These values illustrate how community-wide GHG emissions are expected to change over time when population growth and transportation sector carbon intensity adjustments are applied. Following the table, Figure H provides a visual breakdown of all major emission sources, showing their relative contributions and expected changes between the 2023 baseline year and 2050.
Figure H: MSA-wide BAU Emission change
ENERGY
WASTE AFOLU UPSTREAM IMPACTS OF ACTIVITIES
COMMERCIAL ENERGY
TRANSPORTATION & MOBILE SOURCES
WATER & WASTEWATER
PROCESS & FUGITIVE EMISSIONS
5.1 GHG Emission Reduction Measures Summary
Mitigation, adaptation, and resilience tackle climate risk from complementary angles: mitigation cuts the drivers of climate change by reducing GHG emissions or increasing carbon sinks; adaptation modifies buildings, infrastructure, and behaviors to live with current and expected impacts; and resilience is the capacity of people and systems to withstand shocks, keep operating, and recover quickly
The measures identified in this plan, as reflected in Table H, were categorized according to their primary benefit Mitigation measures provide specific, measurable reductions in GHG emissions that will be tracked in future inventories. Adaptation and resilience measures do not generate direct GHG reduction benefits and, therefore, are not assessed with the same quantitative rigor. Instead, they are evaluated based on their ability to reduce community vulnerability, strengthen systems, and enhance long-term capacity to respond to climate-related challenges.
Table H: Measure Qualitative and Quantitative Analysis
This appendix presents the quantified greenhouse gas (GHG) emission reductions associated with the measures and strategies outlined in Birmingham Metropolitan Statistical Area’s (MSA) Central Alabama Climate Action Plan (CACAP) Toolkit. The purpose of this appendix is to provide transparency in the analytical process used to estimate potential GHG impacts, as well as to document the key assumptions, data sources, and calculation methods applied across all mitigation measures.
Each quantified measure reflects an estimated annual reduction in metric tons of carbon dioxide equivalent (MT CO₂e) relative to the Business-as-Usual (BAU) emissions trajectory. Reductions were calculated using a combination of empirical data, peer-reviewed literature, and established analytical tools from sources such as the U.S. Environmental Protection Agency (EPA), Federal Highway Administration (FHWA), Transportation Research Board (TCRP), and other reputable agencies.
The analysis focuses on three milestone years: 2025, 2030, and 2050, to align with the CACAP Toolkit’s near-term, mid-term, and long-term planning horizons. Results are presented as annual reductions for each measure rather than cumulative totals, allowing for consistent comparison across sectors and timeframes. Where applicable, assumptions were tailored to local conditions using available data for the MSA, while ensuring methodological consistency with national guidance and best practices.
Table O summarizes the expected GHG reductions from each measure and strategy, providing both the quantitative outcomes and the rationale supporting each estimate.
Measure 1A: Replace Fossil-fuel-based Systems in Selected Municipal owned Buildings and Operations with Electric Alternatives by 2031
The City of Birmingham will implement comprehensive energy efficiency and decarbonization upgrades at City Hall, beginning with replacement of the existing chilled water-cooling and natural gas heating systems. Strategy 1A.1.1 replaces the current 100-ton cooling system, which operates at an average energy efficiency ratio (EER) of 15, with a new high-efficiency chiller and cooling tower designed to achieve a higher EER of 18. The higher efficiency chiller will only require 0.65 kW/ton vs 0.8 kW/ton. The chiller is estimated to run 350 hours at full load, 1,345 hours at 75% load, 1,550 hours at 50% load, and 520 hours at 25% load. The upgraded chiller will utilize 147,370 kWh per year, providing a savings of 33,650 kWh per year.
The Scope 2 GHG reduction was calculated using the EPA’s Emissions & Generation Resource Integrated Database (eGRID) tool to determine the GHG emissions per kilowatt-hour (kWh) for the site's zip Code in 2025. The electrical grid in this area depends on coal and natural gas power plants for most of its power. As a result, the reduction in cooling energy will reduce the GHG emissions of the site by 1.065 pounds (lbs.) CO₂e per kWh. Thus, the upgraded chiller is estimated to avoid approximately 35,867 pounds of CO₂e (16.27 MT CO₂e) annually through improved operational efficiency and reduced grid electricity use. By 2050, the regional electric grid is expected to be cleaner, and the emissions factor is reduced to 0.1 MT CO₂e/MWh. Thus in 2050, the emissions reduction related to the improved chiller is only 3.36 MT CO₂e.
Strategy 1A.1.2 focuses on full heating system decarbonization by replacing the existing 600 kBtu/hr natural gas boiler (assumed operating efficiency of 85%) with a Variable Refrigerant Flow (VRF) heat pump system capable of providing both heating and cooling using electricity rather than fossil fuels. The current natural gas boiler is assumed to have two-stage operating capability, as is common for commercial boilers installed in the last 15 years. The boiler is assumed to operate for 1,800 hours per year at 60% capacity and 1,325 hours per year at 100% capacity. The boiler is estimated to consume 1,443,000 kBtu of natural gas annually, which provides 1,226,550 kBtu of usable space heat. A VRF heat pump system can have a coefficient of performance (COP) ranging between 3.5-4.0. For the purposes of this analysis, a COP of 3.8 is used, meaning 3.8 units of heat are delivered for every 1.0 unit of energy required to power the system. The more efficient VRF heat pump system will only require an input of 322,776 kBtu (94,600 kWh) per year.
The current natural gas boiler has a combustion emissions factor of 0.05306 MT CO₂e/MMBtu per EPA guidelines. This gives a baseline emissions value of 168,798 lb CO₂e, or 76.57 MT CO₂e per year for the gas boiler. Converting the system to electric driven VRF heat pumps will require 94,600 kWh/yr to provide an equal amount of space heat. Assuming the system is installed in 2030, we use an expected grid electricity emission value for the year 2030 of 0.4 MT CO₂e/MWh. The new VRF heat pump system will emit only 83,419 lb CO₂e, or 37.84 MT CO₂e per year, which yields a savings of 38.73 MT CO₂e per year. By 2050, the regional electric grid is expected to be cleaner, and the emissions factor is reduced to 0.1 MT CO₂e/MWh. Thus in 2050, the emissions related to the VRF heat pump system is only 9.5 MT CO₂e, yielding a GHG reduction of 67.1 MT CO₂e.
The VRF heat pump system can also provide cooling for the building. The cooling efficiency of the VRF system is expected to be similar to the efficiency of the upgraded chiller; thus, no additional GHG reduction is factored in for cooling operation of the VRF heat pump system.
The combined GHG reduction for the upgraded chiller project and the VRF heat pump system is 55.0 MT CO₂e for the year 2030 and 70.5 MT CO₂e for the year 2050.
This transition eliminates on-site natural gas combustion for the City Hall building. Combined, these projects represent a key early action toward electrifying municipal facilities, enhancing energy resilience and improving building performance in alignment with Birmingham’s climate goals.
Emission reductions were estimated by assigning 10% of the MSA’s total commercial natural gas consumption to a “large emitter” cohort representative of high-load facilities such as hotels, convention centers, and event venues. Based on 2023 commercial fuel use data, this allocation equates to 840,362 MMBtu of natural gas per year, producing a baseline of 44,590 MTCO₂e annually using the EPA’s stationary combustion emission factor for natural gas (0.05306 MTCO₂ per MMBtu).
The analysis assumes this fossil energy is distributed across space heating (60%), water heating (30%), and cooking or process loads (10%). Existing combustion system efficiencies were modeled at 0.85, 0.75, and 0.40, respectively. Electrified replacements were modeled using performance coefficients consistent with current technology: a Coefficient of Performance (COP) of 2.8 for space heating, 2.5 for water heating, and an induction cooking delivery efficiency of 0.85. The incremental electricity required for these electric systems was converted from MMBtu to MWh using 1 MWh = 3.412 MMBtu.
Post-electrification emissions were calculated by applying grid emission factors of 0.483 MTCO₂/ MWh in 2025, 0.40 in 2030, and 0.10 in 2050, representing a continued decarbonization of Alabama’s power generation mix. Annual GHG reductions are the difference between baseline fossil emissions and new electricity-related emissions. Under this conservative scenario, annual reductions are estimated at 6,617 MTCO₂e in 2025, 13,142 MTCO₂e in 2030, and 36,728 MTCO₂e in 2050, once full adoption is achieved. Propane use and envelope or system upgrades that further reduce thermal demand are excluded from this estimate but may enhance overall reductions.
MEASURE 1B: Promote Industrial Electrification in Ductile Iron Pipe Manufacturing starting in 2026
Replacing the coke-fired cupola furnaces at steel plants with induction furnaces reduces the energy needs of those plants due to the increased thermal efficiency of induction furnaces, transfers the energy source to electricity that can be more easily decarbonized, and eliminates harmful air pollutants from coke combustion. A cupola iron furnace combines coke (refined coal), scrap metals, magnesium, and other aggregates at high temperatures to produce cast iron. Hot blast cupola furnaces emit approximately 542 kg CO₂e per ton of product. This report assumes the foundry produces 1,700 tons of steel per year. For 1,700 tons of product, this equates to 920.9 MT of CO₂e emissions per year currently. Induction furnaces produce less direct GHG emissions than cupola furnaces because of their higher thermal efficiency and use of noncarbon energy sources. The specific energy of induction heating is 550 kWh/ton product. Converting to induction furnaces will require 935,000 kWh/yr to heat 1700 ton of product. The GHG emissions for the electricity requirements using the 2030 grid emissions factor of 0.4 MT CO₂e/MWh is 374 MT CO₂e per year; for a 2050 grid emissions factor of 0.1 MT CO₂e/MWh, the expected emissions is 93 MT CO₂e per year. Compared to the current hot blast furnace emissions, the induction furnace will provide a GHG reduction of 547 MT CO₂e in 2030 and 827 MT in 2050 CO₂e. GHG savings for this measure assumes a life span of a furnace of over 20 years. The analysis was based on prior analysis, “Right Way” Next Generation Melt Project, of this type of furnace replacement done by the Department of Energy (DOE) and American Cast Iron Pipe Company.
Scenario 1: Conversion to Natural Gas. In this transitional scenario, all four coal-fired generating units at the Miller Steam Plant convert to natural gas by 2040. Using the facility’s reported emission factor of 1,065 lb CO₂/MWh (0.483 t CO₂/MWh) as the baseline, and assuming a post-conversion intensity of 0.372 t CO₂e/MWh, this shift would reduce total electricity-related emissions in the MSA by approximately 2.0 MMT CO₂e per year once fully implemented. The analysis assumes a linear conversion between 2026 and 2040, constant annual generation of 18.06 TWh, and equal output from each of the plant’s four generating units. This approach maintains grid reliability and regional energy self-sufficiency while achieving roughly a 23% reduction in power-sector emissions. Although natural gas is not a zero-emission resource, it offers an interim pathway toward deeper decarbonization by displacing coal combustion and facilitating integration of renewable energy over time.
Scenario 2: Partial Decommissioning and Renewable Replacement. This intermediate scenario envisions retiring two of Miller’s four units (50% of generating capacity) and replacing their output with renewable sources such as solar, wind, and battery storage systems. The remaining two coal units continue to operate at the reported baseline intensity of 0.483 t CO₂/MWh, while the renewable portion contributes no direct emissions. The resulting mixed output effectively halves the facility’s emissions, yielding an estimated 4.36 million metric tons CO₂e per year reduction at full implementation. A 2026–2040 linear ramp is assumed to reflect phased retirements and renewable buildout. This pathway balances emissions reduction with operational and economic considerations, allowing the local energy grid to diversify the energy mix while maintaining system reliability and managing workforce transitions.
Scenario 3: Full Replacement with Renewable Energy. In the most ambitious scenario, all four coal units at the Miller Steam Plant are retired and replaced entirely with renewable generation and storage capacity by 2040. This transformation eliminates all direct stack emissions from power generation within the MSA, reducing electricity-related emissions by approximately 8.72 million metric tons CO₂e per year at the completion of all projects. The analysis assumes constant demand (18.06 TWh/yr), equal output per unit, and a linear transition between 2026 and 2040. This conversion scenario is attributed to the aggressive scenario.
MEASURE 2: Expand Renewable Energy through a Mix of Solar, Waste-to-energy, and Distributed Energy Initiatives
MEASURE 2A: Expand Solar Generation Across the MSA Through a Regional Bulk-Purchase Campaign, with a goal of 25 megawatt (MW) by 2030.
STRATEGY 2A.1: Solarize the MSA
See Appendix G Renewable Energy GHG Savings and Appendix H PV Watts Generation Estimates.
STRATEGY 2A.2: 35th Avenue
See Appendix G Renewable Energy GHG Savings and Appendix H PV Watts Generation Estimates.
STRATEGY 2A.3: Rural Regions
See Appendix G Renewable Energy GHG Savings and Appendix H PV Watts Generation Estimates.
STRATEGY 2A.4: UAB
See Appendix G Renewable Energy GHG Savings and Appendix H PV Watts Generation Estimates.
STRATEGY 2A.5: DER Program
See Appendix G Renewable Energy GHG Savings and Appendix H PV Watts Generation Estimates.
STRATEGY 2A.6: Emergency Response
See Appendix G Renewable Energy GHG Savings and Appendix H PV Watts Generation Estimates.
STRATEGY 2A.7 Advocate for removal of Capacity Reservation Charge
This strategy enables emission changes due to policy shifts at the utility level. It is not currently known how much emissions removing this policy would save with a high degree of confidence. Should further information emerge, this strategy will be assessed in the future.
MEASURE 2B: Install Landfill Gas-to-Energy Systems at Two (2) Regional Landfills, by 2040
Emissions reductions were calculated using modeled methane generation data for a representative regional landfill reporting 10,497 MT CH₄ per year under EPA Subpart HH protocols. Applying a 75% methane-capture efficiency, consistent with the EPA Landfill Methane Outreach Program (LMOP) and the 2006 IPCC (Intergovernmental Panel on Climate Change) Guidelines range of 60–90%, and a global warming potential (GWP) of 28 from the IPCC Fifth Assessment Report (AR5), the captured methane equates to approximately 220,000 MT CO₂e per year in direct avoided emissions for one landfill. Combustion of the recovered gas in an on-site energy system is assumed to achieve 35% electrical conversion efficiency, offsetting grid electricity with an average emissions factor of 0.4 MT CO₂e/MWh, yielding an additional ~21,500 MT CO₂e/year in displacement benefits. Scaling these results to two comparable landfills results in ~440,000 MT CO₂e/year of direct reductions and up to ~480,000 MT CO₂e/year when energy co-benefits are included. All reductions are expressed as annual values relative to business-as-usual (BAU) conditions.
Measure 3 comprises a suite of strategies aimed at reducing GHG emissions through increased energy efficiency and electrification within the residential and commercial building sectors across the MSA. The measure is subdivided into four targeted strategies: (1) providing financial assistance for residential retrofits; (2) promoting electrification and building performance improvements; (3) completing lighting upgrades at City Hall; and (4) adopting or encouraging more stringent energy codes for new construction. Together, these strategies address both existing building stock and new development, leveraging efficiency gains, fuel-switching, and building standards to achieve long-term emissions reductions.
Reductions were estimated based on an assumed 2% participation rate among households across the MSA, with each participating household achieving a 20% reduction in overall energy use through retrofits such as insulation upgrades, HVAC replacements, and weatherization. These savings were applied proportionally to total residential sector emissions of approximately 3.69 million MT CO₂e annually. Electricity and fuel savings were translated into GHG reductions using the respective emissions factors, resulting in an estimated reduction of 73,805 MT CO₂e per year at full implementation.
This strategy combined the effects of space heating electrification and building envelope improvements. It was assumed that 1% of residential and commercial buildings would convert from fossil fuel-based heating (natural gas, LPG, and fuel oil) to electric systems. Additionally, a 1% reduction in electricity use was assumed across both sectors due to envelope efficiency upgrades (e.g., insulation, air sealing, efficient windows). Emissions savings from electrification were calculated based on the displacement of fossil fuel combustion, while electricity reductions were computed using the Alabama-specific emissions factor. The total annual reduction for this strategy was estimated at 70,339 MT CO₂e.
This strategy addressed the remaining lighting systems at Birmingham City Hall, assumed to encompass 300,000 square feet of floor area. Lighting upgrades were expected to save approximately 2.2 kWh per square foot per year, resulting in an annual energy savings of 660,000 kWh. Applying the MSA’s grid emissions factor, the resulting GHG reduction from this strategy was calculated to be 319 MT CO₂e per year.
Emission reductions were estimated for new construction subject to enhanced energy efficiency codes. It was assumed that five million square feet of new development would occur by 2030 across the MSA and that these buildings would perform 30% better than baseline code, achieving annual energy savings of 1.8 kWh per square foot. This results in nine million kWh/year of avoided electricity use and an annual emissions reduction of 4,350 MT CO₂e. The analysis assumes consistent performance beyond 2030, with no additional acceleration in construction beyond the assumed growth.
Table C: Measure 3
as compared to BAU emissions (MT CO₂e)
MEASURE 4: Incorporate Smart Growth Principles into Zoning Codes and Future Land Use Planning in five (5) Municipalities by 2030
Measure 4 focuses on integrating Smart Growth principles into local zoning codes and future land use planning. By 2030, five participating municipalities will adopt policies promoting compact, mixed-use, and walkable development patterns centered around existing urban cores. The intent is to reduce vehicle miles traveled (VMT), shift trips to active and public modes, and lower transportation-related GHG emissions.
Land use reform is a long-term strategy that influences where and how residents travel. Compact development shortens trip lengths, reduces auto dependency, and enables walking, biking, and transit use. Over time, these structural changes to the built environment lead to measurable reductions in per capita transportation emissions.
The GHG reduction potential of Smart Growth strategies was quantified by estimating the change in VMT associated with compact, mixed-use development patterns and applying that reduction to baseline on-road emissions. Baseline emissions were derived from the MSA transportation inventory, which reported 6,638,207 MTCO₂e per year from on-road gasoline and diesel vehicle travel (equivalent to approximately 15.3 billion VMT). The emission factor derived from this baseline equals approximately 0.000433 MTCO₂e per VMT (or 0.433 kg CO₂e per mile).
To estimate VMT reduction impacts, this measure assumes adoption of Smart Growth land use policies in five municipalities by 2030, influencing the form and density of new development and redevelopment areas. Based on elasticities summarized by Ewing and Cervero (2010), Smart Growth America (2020), and the FHWA (2016), the relationship between urban form and travel behavior typically yields a 5–12% long-term reduction in VMT under comprehensive implementation. Given the MSA’s moderate implementation scale and phasing, this analysis adopts a moderate scenario where Smart Growth policies reduce regional on-road VMT by 3% by 2030 and 8% by 2050 relative to the business-as-usual trajectory.
Table D: Measure 4 Quantified emission reductions as compared to BAU emissions (MT CO₂e)
MEASURE 5: Transition to EV Infrastructure both at a Municipal and Communitywide level by 2035
STRATEGY 5.1: Municipal Fleet
Emission savings of 1,025 MT CO₂e/year were adopted directly from the Alabama Priority Climate Action Plan. This value represents the net reduction after accounting for electricity use in replacement vehicles. Because implementation begins after 2025, the savings are assumed to be mature by 2030 and applied uniformly through 2050.
STRATEGY 5.2: Business Infrastructure
75 stations (two ports each) are assumed to deliver ~4 MWh per port per year, yielding 600 MWh of electricity and enabling approximately 2 million electric miles annually at 0.30 kWh/mi. Displacement of gasoline travel (25 mpg) avoids 711 MT CO₂e, while charging adds 290 MT CO₂e, for a net 421 MT CO₂e/year reduction by 2035. Reductions scale linearly between 2026 and 2035.
STRATEGY 5.3: Community Infrastructure
The rebate program is assumed to increase EV adoption by 0.3% of total LDV VMT (~44.5 million mi/ year). Resulting avoided gasoline use equals 1.78 million gallons/year (15,830 MT CO₂e avoided). Associated charging requires 13,359 MWh/year (6,453 MT CO₂e added), producing a net 9,376 MT CO₂e/year reduction by 2035. The benefit is sensitive to actual participation levels and gridcarbon intensity.
STRATEGY 5.4: Bus Fleet
Replacement of 14 diesel buses traveling 35,000 mi/bus/yr at four mpg with electric buses consuming 2.0 kWh/mi displaces 122,500 gallons of diesel. Avoided emissions total 1,251 MT CO₂e, offset by 473 MT CO₂e from charging (980 MWh × 0.483 t/MWh), for a net 777 MT CO₂e/year reduction at full implementation in 2035.
Table E: Measure 5 Quantified emission reductions as compared to BAU emissions (MT CO₂e)
MEASURE 6: Distribute 75 E-Bike Vouchers to Residents Annually
6.1:
The emission reduction potential for this measure was estimated by quantifying the avoided VMT per voucher recipient and applying the standard emissions factor for an average gasoline-powered passenger vehicle. Each year, 75 vouchers are assumed to be distributed, and each participant is assumed to replace approximately 1,000 annual vehicle miles with E-Bike use. This is a conservative assumption supported by multiple studies indicating that E-Bike adoption typically displaces 1,000–3,000 car miles per user annually.
According to the EPA, the average passenger vehicle emits 404 grams of CO₂ per mile, equivalent to 0.000404 MT CO₂e per mile. The GHG reduction per E-Bike recipient was calculated as follows:
1,000 miles × 0.000404 MT CO₂e/mi = 0.404 MT CO₂e reduced per participant per year
At 75 participants per year, the total annual reduction equals 30.3 MT CO₂e. Due to the assumption that each year’s voucher recipients will continue to use their E-Bikes in subsequent years, the benefits are cumulative. Over time, these annual additions result in total reductions of approximately 909 MT CO₂e by 2030 and 7,878 MT CO₂e by 2050. This calculation assumes consistent annual usage and continued participation over the lifespan of each E-Bike.
Table F: Measure 6 Quantified emission reductions as compared to BAU emissions (MT CO₂e)
MEASURE 7: Write a TOD Corridor Plan that Targets an Increase in Transportation Connectivity, Dense Housing around the BRT system, and outlines a Pathway for Expanded Bike Lanes by 2031.
STRATEGY 7.1: Comprehensive TOD Corridor Plan
This strategy quantifies emissions reductions from compact, mixed-use development patterns and localized “Dutch-style” mobility hubs. Based on research by the EPA (EPA, 2011) and the Center for Transit-Oriented Development (CTOD, 2008), households in TOD areas drive 20–40% less than regional averages. The model assumes 1,500 households will relocate to TOD zones by 2030, reducing 10 daily VMT per household, and 4,500 by 2050. The resulting avoided VMT, multiplied by the regional emission factor and adjusted with a 10% conservatism factor, yields 1,991.154 MT CO₂e/ year in 2030 and 5,973.463 MT CO₂e/year by 2050.
STRATEGY 7.2: North-South BRT corridor
Expansion of the BRT network is expected to induce a measurable mode shift from car to transit. Drawing on parameters from the Institute for Transportation and Development Policy (ITDP, 2016), the Federal Transit Administration (FTA, 2010), and TCRP Report 118 (2007), the model assumes 7,000 new daily riders by 2030, increasing to 17,500 by 2050. Each rider is assumed to replace a 7–7.5 mile roundtrip 65–70% of the time, across 300 annual service days. Applying the MSA-specific emission factor and accounting for a 10% operations haircut yields 3,473.964 MT CO₂e/year in 2030 and 10,356.114 MT CO₂e/year in 2050.
This strategy quantifies VMT reductions from active transportation mode shift resulting from the completion of key trail linkages. Consistent with the FHWA (2016) and Rails-to-Trails Conservancy (2019) findings, active infrastructure projects typically shift 0.01–0.05% of short car trips to walking and biking. A midrange value of 0.0167% VMT shift is applied in 2030 and 0.05% by 2050. Applying these fractions to the regional VMT baseline results in 1,001.774 MT CO₂e/year avoided by 2030 and 2,999.342 MT CO₂e/year by 2050.
Reducing or eliminating transit fares increases ridership and access among residents. Empirical evidence from fare-free programs (TCRP Report 95, 2004; National Academies, 2022; CityLab, 2019) shows ridership gains of 20–60%. This analysis conservatively assumes a 15% system-wide increase in ridership by 2030 and a 40% increase by 2050, with 60–65% of new trips replacing car travel. Using an average 6.5-6.8 mile roundtrip and 300 annual service days, the resulting reductions are 2,493.183 MT CO₂e/year by 2030 and 7,534.605 MT CO₂e/year by 2050.
Table G: Measure 7 Quantified emission reductions as compared to BAU emissions (MT CO₂e)
MEASURE 8: Implement a Regional VMT Reduction Program by 2028
STRATEGY 8.1: Bike Infrastructure
This strategy supports active transportation by providing critical infrastructure for E-Bike use. Research from the Rocky Mountain Institute (RMI) suggests that widespread adoption of E-Bikes can replace up to 25% of short automobile trips, resulting in a total VMT reduction of approximately 3% (RMI, 2021). Given the exploratory and phased implementation nature of this strategy, a conservative estimate of 0.7% VMT reduction was applied to the regional baseline. This corresponds to approximately 103.9 million VMT avoided annually, translating to a GHG reduction of 41,977 MT CO₂e per year at full implementation.
STRATEGY 8.2: Transportation Demand Management
Strategy 8.2 requires that new non-residential developments over 25,000 square feet implement Transportation Demand Management (TDM) strategies as defined in the City’s TDM workbook. Assuming an annual addition of 1 million square feet of qualifying commercial space and 250 square feet per employee, the strategy affects approximately 4,000 new commuters each year. Based on standard commuting patterns (230 workdays/year and 20 miles/day roundtrip), the total annual VMT impact is 18.4 million miles. A conservative TDM effectiveness rate of 8% (from CAPCOA, 2021) was applied, leading to 1.47 million avoided VMT, or 594 MT CO₂e per year.
STRATEGY 8.3: Car/Bike sharing programs
This strategy evaluates the development of a car-sharing and/or bike-sharing program across the MSA. According to studies from the University of California, Berkeley, car-share programs can reduce participant VMT by 6% to 16%, with additional modal shift impacts from bike-share systems (Shaheen et al., 2020). A conservative scenario assumes 8,000 participating residents, each reducing VMT by 1,000 miles annually, leading to eight million avoided VMT. This results in an estimated GHG savings of 3,232 MT CO₂e per year upon full program implementation.
STRATEGY 8.4: Safe Routes to School program
Reintroducing Safe Routes to School (SRTS) is intended to reduce vehicle trips related to student transportation. Literature from the National Center for Safe Routes to School and NCHRP Report 803 (2015) supports estimates that effective SRTS programming can eliminate up to 150 vehicle trips per day per school. Assuming 50 participating schools, each eliminating 150 trips per day over 180 school days, the total avoided mileage is 5.4 million VMT annually. The resulting GHG savings is estimated at 2,182 MT CO₂e per year.
Table H: Measure 8 Quantified emission reductions as compared to BAU emissions (MT CO₂e)
MEASURE 9: Reduce water usage within municipal operations 3% annually until 2030
STRATEGY 9.1: Motion Sensor Faucets
Strategy 9.1 assumes the installation of 100 motion-sensor faucets in municipal facilities to minimize unnecessary faucet run-time. Based on studies by the EPA WaterSense program and related building efficiency analyses, each faucet is estimated to save approximately 1,000 gallons of water per year through reduced flow duration and optimized water use. The total annual water savings of 100,000 gallons was converted to energy savings using the potable water intensity of 10,740 kWh/MG, and then multiplied by Alabama’s grid emission factor (0.000483 tCO₂e/kWh). This results in an estimated GHG reduction of 0.5 MT CO₂e per year.
The savings estimate is conservative and reflects standard aerator flow rates (0.5–0.35 gpm) and typical office or public restroom usage patterns. The measure also aligns with rebate eligibility under the Alabama Conservation Incentive Program, which offers partial reimbursement for efficiency upgrades in municipal settings.
Strategy 9.2 addresses irrigation efficiency by replacing existing turf or water-intensive landscaping with drought-tolerant plant species across approximately 300,000 square feet of municipal property. Following guidance from the Alabama Cooperative Extension’s “Drought-Tolerant Landscapes for Alabama” and supported by studies such as the Southern Nevada Water Authority’s Xeriscape Conversion Study, the conversion is assumed to save approximately 15 gallons per square foot per year.
The resulting 4.5 million gallons of annual water savings was multiplied by the potable water energy intensity and grid emission factor to yield a reduction of 23.3 MT CO₂e per year. This estimate represents electricity savings from reduced irrigation pumping and water delivery. Over time, this measure also provides long-term water resilience benefits by reducing peak irrigation demands and maintenance costs.
Strategy 9.3 supports the distribution of 75 high-efficiency fixtures annually through a partnership with Central Alabama Water’s rebate program. Each fixture—assumed to be a WaterSense-certified aerator or low-flow faucet—is estimated to save approximately 700 gallons per year, consistent with EPA WaterSense guidance. The total annual water savings of 52,500 gallons was converted to electricity and GHG savings using the same potable water intensity and emission factor, resulting in a reduction of 0.3 MT CO₂e per year.
This strategy is designed as a community engagement initiative, complementing municipal retrofits by incentivizing households and small businesses to adopt efficient fixtures. Participation in local rebate programs amplifies the overall impact of municipal conservation efforts while fostering water stewardship at the community level.
Strategy 9.4 encourages the use of non-potable water reuse systems in new and renovated developments by offering expedited or discounted permits for projects incorporating greywater recycling or rainwater harvesting infrastructure. For early implementation years, it is conservatively estimated that these incentives will support installations offsetting approximately 250,000 gallons of potable water use per year.
Applying the potable water electricity intensity (10,740 kWh/MG) and grid emission factor (0.000483 tCO₂e/kWh) yields a total GHG reduction of 1.3 MT CO₂e per year. These systems primarily displace potable water used for irrigation or toilet flushing, reducing both water and energy demands. As participation grows, the program could achieve greater long-term reductions aligned with EPA Onsite Non-Potable Water System (ONWS) performance metrics.
Table I: Measure 9 Quantified emission reductions as compared to BAU emissions (MT CO₂e)
MEASURE 10: Retrofit Wastewater Treatment Facilities with Renewable Energy and Energy-efficient Technologies, within the Jefferson County Environmental Services (JCES) portfolio of facilities, beginning with the Village Creek Water Reclamation Facility by 2035 and Develop a Program that would Facilitate other Infrastructure Owners to Convert to Renewable Energy by 2036
10.1.1 Village Creek Water Reclamation Facility. The Village Creek Water Reclamation Facility, operated by JCES, is the largest wastewater facility in the MSA, with a permitted capacity of approximately 132 Million Gallons per Day (MGD). For this analysis, the annual flow was conservatively estimated at 70 MGD average, or about 25,550 million gallons per year. Using the U.S. EPA benchmark of 1,400 kWh per million gallons treated (EPA, Benchmarking Energy Efficiency at Wastewater Treatment Plants, 2013), Village Creek’s electricity consumption was estimated at roughly 35.8 million kWh annually. Applying the Alabama-specific grid emission factor of 0.483 metric tons CO₂e per MWh (Alabama Power reported emission intensity, 2023), baseline annual emissions equal approximately 17,300 MT CO₂e. Based on EPA’s Net Zero Energy Roadmap for Wastewater Facilities, which shows that large plants can realistically achieve 30–40% reductions through a combination of biogas recovery, combined heat and power (CHP), advanced aeration systems, and solar photovoltaics, a 35% reduction potential was applied. This results in an estimated annual reduction of 13,790 MT CO₂e at Village Creek alone.
10.1.2 Regional Program for Other Facilities. Beyond Village Creek, JCES operates additional large plants such as Valley Creek (85 MGD capacity) and Five Mile Creek (20 MGD), along with six smaller municipal facilities. Additional wastewater treatment plants are operated across Shelby, St. Clair, Walker, Blount, Bibb, and Chilton counties, including medium-sized facilities in Pelham, Alabaster, Helena, Jasper, Pell City, and Columbiana, and smaller systems in Jemison, Brent, Centreville, Thorsby, and others. Collectively, these non-Village Creek plants represent an estimated baseline electricity demand of 28.4 million kWh/year, equating to 13,600 MT CO₂e/year. To reflect differences in facility scale and retrofit potential, reduction factors were applied by tier: 35% for large facilities (Valley Creek, Five Mile Creek), 25% for medium facilities (1–10 MGD), and 15% for small facilities (<1 MGD). These percentages align with U.S. DOE and EPA findings that large plants can maximize biogas and solar resources, while smaller systems are generally limited to low-cost aeration and pumping efficiency measures. Applying these tiered assumptions produces an additional annual reduction of approximately 7,687 MT CO₂e across the MSA’s wastewater sector.
Table J: Measure 10 Quantified emission reductions as compared to BAU emissions (MT CO₂e)
MEASURE 11: Expand Strict Stormwater Enforcement, Formalize Quarterly Riverkeeper Audits, Require Nature-based/flood-resilient Design, and begin Zoning to Eliminate Minimum Parking starting in 2026
STRATEGY 11.1: Ordinance
No significant GHG emission reductions are associated with this strategy.
STRATEGY 11.2: Audits
No significant GHG emission reductions are associated with this strategy.
STRATEGY 11.3: Nature-based solutions
No significant GHG emission reductions are associated with this strategy.
STRATEGY 11.4: Parking requirements
The GHG emission reductions associated with eliminating parking minimums were quantified by combining reductions in VMT with avoided embodied emissions from asphalt paving. The VMT methodology follows the California Air Pollution Control Officers Association’s Quantifying Greenhouse Gas Mitigation Measures Handbook, which builds on Caltrans (2012) and Chatman (2013). It assumes that reducing parking supply below Institute of Transportation Engineers (ITE) estimated residential demand lowers household reliance on automobiles for commuting. The percent reduction is calculated as the product of the parking scarcity factor (shortfall in supply relative to ITE demand), the share of project VMT generated by residents, the statewide average share of household VMT that is commutebased (37%, Caltrans 2012), and the observed reduction in commute driving under conditions of limited parking (37%, Chatman 2013). This fractional reduction is applied to baseline residential VMT, and avoided emissions are calculated using MSA’s tailpipe emission factor, consistent with factors used in other transportation measures. Embodied savings are estimated by multiplying the number of stalls not constructed by 30 m² per stall (including aisles) and an asphalt emission factor of 30 kg CO₂e per m², then amortizing the result over a 30-year pavement design life. This approach conservatively quantifies the most direct and well-supported benefits of parking reform, fewer vehicle trips and less paved surface area, while excluding speculative or indirect co-benefits, ensuring consistency and methodological transparency across the inventory.
Table K: Measure 11 Quantified emission reductions as compared to BAU emissions (MT CO₂e)
MEASURE 12: Increase waste and recycling diversion by adopting a new Model Franchise Agreement by 2028 and launching a zero-waste campaign focused on procurement from 2026 to 2030
Municipal procurement policies prioritize low-waste and recycled-content products. This strategy assumes a 1% reduction in landfilled organics across 5% of the regional waste stream, based on the leadership effect of municipal operations on upstream waste generation. This yields an annual reduction of 240.9 MT CO₂e. Impacts are driven by avoided landfilling of paper and packaging waste.
An MSA-wide Zero Waste campaign is assumed to increase organics diversion through public education, expanded service participation, and improved material sorting. The strategy is modeled to reduce landfilled organics by 3% of the total disposed stream across 100% of the MSA, resulting in 14,451.3 MT CO₂e/year avoided emissions. While the campaign is initiated in 2026, reductions are treated as fully realized starting in 2026 for consistency with other measures.
STRATEGY 12.3: Model Franchise Agreement Phase 1
This strategy assumes that a standardized franchise agreement across the MSA leads to expanded organics collection, container standardization, contamination control, and performance enforcement. A 5% reduction in landfilled organics across 100% of the MSA is assumed, resulting in 24,085.5 MT CO₂e/year in avoided emissions. This approach is consistent with EPA recommendations and examples from jurisdictions implementing organics mandates via contracting structures.
STRATEGY 12.4: Model Franchise Agreement Phase 2
The City’s hauling services are modeled to align with the MSA-wide franchise structure outlined in 12.3. This strategy assumes a 2% reduction in landfilled organics within 35% of the MSA waste stream, representing Birmingham’s estimated share. The resulting annual GHG reduction is 3,372.0 MT CO₂e.
Table L: Measure 12 Quantified emission reductions as compared to BAU emissions (MT CO₂e)
MEASURE 13: Transform 500 Square Feet of Underutilized Spaces and Public Landscapes Annually into Natural Spaces using Native Landscaping; include Implementation Timeline in the Community Forestry Plan
13.1 Convert vacant lots to green system interventions. Birmingham has an estimated several hundred vacant parcels, with real estate listings suggesting 600–700 acres of undeveloped land in circulation. For this strategy, the analysis assumes 500 vacant lots averaging 0.2 acres each (100 acres total), of which 80% (≈80 acres) are feasible for greening. Beginning in 2025, 24 acres are converted, with 40% of that area planted with trees and 60% transitioned to low-mow meadows. This yields 4,800 trees planted across vacant lots in the first year. Tree carbon sequestration is calculated using U.S. Forest Service i-Tree defaults of 4.2 tCO₂/acre-canopy/yr at maturity, with a 15-year ramp-up. Meadow conversions generate operational savings immediately by avoiding mowing fuel (0.53 tCO₂/acre/yr), synthetic fertilizer use (0.16–0.19 tCO₂e/acre/yr), and irrigation electricity (0.74 tCO₂/acre/yr), based on EPA emission factors for gasoline, IPCC Tier-1 fertilizer defaults , and U.S. average water energy intensity of 2,300 kWh/MG. Combined, vacant lot interventions yield 23 tCO₂e/yr reductions by 2025, rising above 200 tCO₂e/yr by 2050 as canopy matures and meadow acreage expands.
13.2 Develop a comprehensive Urban Community Forestry Plan. This strategy represents a citywide canopy program, separate from vacant lot conversions. The scenario assumes 500 new trees are planted annually across parks, streets, and rights-of-way, with a 70% survival rate by year five. Average canopy at maturity is estimated at 25 m² per tree (0.006 acres), and sequestration is quantified at 4.2 tCO₂/acre/yr with a 15-year ramp-up . By 2030, cumulative canopy from successive plantings yields 18 tCO₂/yr in annual sequestration, rising above 230 tCO₂/yr annually by 2050. Energy co-benefits from shade could add further reductions if planting is targeted to buildings, though those effects are not quantified here.
13.3 Utilize city-owned open spaces for sustainable landscaping. City demonstration sites emphasize sustainable landscaping practices by replacing turf with native meadows and low-mow areas. This analysis assumes 10 acres converted in 2025, 30 acres by 2030, and 50 acres by 2050. Emission reductions come from avoided mowing fuel (≈0.53 tCO₂/acre/yr), reduced fertilizer inputs (0.16–0.19 tCO₂e/acre/yr), and avoided irrigation (0.74 tCO₂/acre/yr), for a combined 1.45 tCO₂e/ acre/yr reduction. Soil carbon gains from meadow establishment add 0.3–1.0 tCO₂/acre/yr over several decades. Together, these operational and soil benefits yield 14.5 tCO₂e/yr reductions in 2025, 43 tCO₂e/yr by 2030, and 72 tCO₂e/yr by 2050.
Table M: Measure 13 Quantified emission reductions as compared to BAU emissions (MT CO₂e)
MEASURE 14A: Establish 10 Fresh Food Distribution Locations annually across the MSA for the Next Five Years
STRATEGY 14A.1: Food Insecurity
No significant GHG emission reductions are associated with this strategy.
MEASURE 14B: Increase the Use of No-till farming to Manage Water Resources to Target Five Farms Annually across the MSA for the Next Five Years
STRATEGY 14B.1: No-till Farming
No significant GHG emission reductions are associated with this strategy.
Measure 14C: Work with the Alabama Farmers Federation to Target Education about the Negative Impacts of the Application of Biosludge to 10 farms annually across the MSA over the Next Five Years
No significant GHG emission reductions are associated with this strategy.
STRATEGY 14C.1: Biosludge
No significant GHG emission reductions are associated with this strategy.
MEASURE 15: Focus on three resilience initiatives to strengthen the MSA’s ability to respond to climate impacts by 2027
STRATEGY 15.1: Heat Study
No significant GHG emission reductions are associated with this strategy.
STRATEGY 15.2: Cool Roofs
No significant GHG emission reductions are associated with this strategy.
STRATEGY 15.3: Nature-based Solutions Toolkit
No significant GHG emission reductions are associated with this strategy.
MEASURE 16: Integrate Climate Action Management Systems across the MSA by 2027
STRATEGY 16.1: Steering Committee
No significant GHG emission reductions are associated with this strategy.
STRATEGY 16.2: Internships
No significant GHG emission reductions are associated with this strategy.
STRATEGY 16.3: Website
No significant GHG emission reductions are associated with this strategy.
MEASURE 17: Partner with workforce development efforts to attract new industries, develop career readiness, and eliminate wage discrimination
STRATEGY 17.1: Incubation
No significant GHG emission reductions are associated with this strategy.
STRATEGY 17.2: Career Pathways
No significant GHG emission reductions are associated with this strategy.
STRATEGY 17.3: Career Wages
No significant GHG emission reductions are associated with this strategy.
MEASURE 18A: Encourage Steel and Gas Operations to reduce Five (5) MTCO�e GHG Emissions by 2035
18A.1 New Technologies. Adoption of advanced technologies in the MSA’s iron and steel sector presents an opportunity to reduce a portion of the MSA’s process emissions, which total approximately 174,000 MT CO₂e per year (EPA FLIGHT, Subpart Q 2023). A demonstration retrofit at a facility such as SMI Steel, which reports annual emissions of roughly 60,900 MT CO₂e, could reduce emissions by about 20% through measures such as electrified furnaces and waste heat recovery, saving approximately 12,200 MT CO₂e annually by 2030. This assumption is supported by the U.S. DOE’s Industrial Assessment Center findings that steel efficiency retrofits typically reduce direct emissions by 15–25% (DOE IAC 2022). Scaling these technologies to all four regional steel plants could achieve 26,000 MT CO₂e reductions annually by 2030 and nearly 35,000 MT CO₂e annually by 2050. Expanded application of advanced leak detection and repair (LDAR) practices in natural gas processing and distribution systems, which emit about 223,000 MT CO₂e annually (EPA FLIGHT, Subpart W 2023), can achieve 40% reductions in fugitive methane emissions (EPA Natural Gas STAR Program 2022), representing an additional 89,000 MT CO₂e annually by 2050.
18A.2 Steel and Gas Emission Reductions. Establishing emissions reduction standards, such as alignment with the Science Based Targets initiative (SBTi), can drive decarbonization in cement and lime manufacturing, which together emit approximately 3.95 million MT CO₂e annually in the MSA (EPA FLIGHT, Subpart H & S 2023). These emissions are primarily process-related, arising from calcination during clinker and lime production. Based on global benchmarks, SBTi-aligned companies typically commit to 10–15% reductions in emissions intensity by 2030 as part of a 1.5°C trajectory (SBTi 2023). If 50% of local cement and lime facilities adopt a 10% reduction pathway by 2030, annual reductions of about 197,000 MT CO₂e could be achieved. By 2050, broader adoption reaching 80% of facilities with a 15% reduction would yield approximately 366,000 MT CO₂e per year. These reductions would be achieved through process optimization, clinker substitution, and efficiency improvements, excluding facilities assumed to adopt CCS in order to prevent double counting.
18A.3 Carbon Capture and Sequestration (CCS). CCS is uniquely suited to reduce the process emissions from calcination in cement manufacturing, which cannot be eliminated through efficiency alone. One of the City’s largest cement plants, the National Cement facility, emits roughly 895,000 MT CO₂ annually (EPA FLIGHT, Subpart H 2023). Installing CCS at this site by 2040, with an assumed 70% capture efficiency, would avoid approximately 627,000 MT CO₂e annually by 2050. This assumption is based on performance ranges reported by the International Energy Agency (IEA 2021) and the Global CCS Institute (2023), which estimate typical capture efficiencies of 65–90% for cement kilns. This intervention would directly abate calcination process emissions, complementing but not overlapping with reductions from efficiency measures or standards, and represents the single most impactful opportunity for deep decarbonization in the local cement sector.
Because the MSA GHG Inventory does not disaggregate healthcare emissions explicitly, the baseline was estimated as a share of the broader Commercial Energy sector. National data from the U.S. Energy Information Administration’s Commercial Building Energy Consumption Survey (CBECS 2018) identifies healthcare facilities as responsible for approximately 8.5% of total U.S. commercial building energy consumption. This ratio was applied to the MSA’s total commercial energy emissions, estimated at 6,381,445 MT CO₂e in 2023, derived from electricity, natural gas, and propane use across all commercial and institutional facilities.
Electricity accounts for roughly 93% of this total (506,342 MT CO₂e), with combustion fuels (natural gas and propane) comprising the remainder (38,897 MT CO₂e). This baseline represents Scope 1 and 2 emissions associated with direct fuel use and purchased electricity in healthcare buildings across the MSA.
This strategy estimates emissions reductions resulting from energy efficiency, equipment modernization, and electrification increases in healthcare facilities. These efficiency gains encompass comprehensive energy audits and retro-commissioning; replacement of gas-fired boilers with high-efficiency electric heat pumps; installation of LED lighting and smart building controls; upgrades to efficient sterilization and medical equipment; and sustainable procurement and waste or water efficiency initiatives. Reduction factors were developed using a combination of federal and sectoral research sources, including the EPA ENERGY STAR Portfolio Manager dataset for healthcare facilities, Department of Energy hospital retrofit case studies documenting energy savings from modernization projects, and Health Care Without Harm (HCWH) decarbonization guidance outlining realistic operational benchmarks for hospital energy performance.
A phased schedule of 5%, 15%, and 30% reductions by 2025, 2030, and 2050, respectively, was applied to reflect achievable savings from progressive facility upgrades and electrification. Using the baseline of 545,238 MT CO₂e, this results in modeled annual reductions of approximately 27,262 MT CO₂e in 2025, 81,786 MT CO₂e in 2030, and 163,572 MT CO₂e in 2050. These estimates capture direct emissions reductions attributable to energy efficiency and electrification improvements within healthcare operations and do not include avoided emissions from renewable electricity generation, which are addressed separately.
Hospitals and medical campuses represent prime candidates for on-site and off-site renewable energy adoption, given their large rooftops, energy storage opportunities, and need for resilient power supply. However, to maintain internal consistency within the inventory framework and prevent double counting, the renewable energy benefits for healthcare facilities are attributed proportionally within Measure 2A.5 (Renewable Energy Expansion).
No significant GHG emission reductions are associated with this strategy.
Restoring degraded lands along the rail line was quantified using land-based carbon sequestration rates derived from peer-reviewed literature and U.S. Forest Service guidance. An estimated 500 acres of brownfields and deforested parcels within the MSA were assumed available for restoration, with 70% reforested and 30% converted to native meadow or grassland. Reforestation rates were applied at 3.5 metric tons of CO₂ per acre per year, which falls at the midpoint of the U.S. range of 1.1 to 7.7 MTCO₂ per acre per year (Brown et al., 1999; USDA Forest Service urban forestry studies). Meadow restoration was applied at 1.8 MTCO₂ per acre per year based on U.S. grassland carbon estimates (EPA 2018). A survival and maintenance factor of 90% was applied to reflect long-term tree survival and management practices. Sequestration was phased in gradually, with projects reaching 40% of full potential by 2025, 80% by 2030, and full sequestration by 2050. Under these assumptions, the restoration program yields 538 MTCO₂e annually by 2025, increasing to 1,077 MTCO₂e in 2030 and 1,346 MTCO₂e in 2050. These reductions represent direct atmospheric carbon removals through vegetation growth and soil carbon accumulation on rehabilitated lands.
Emission reductions from clean freight operations were estimated by analyzing idle-reduction technologies, electrification of container-handling cranes, and replacement of diesel yard equipment with electric alternatives at regional freight terminals. For heavy-duty trucks, the analysis assumed 100 vehicles adopting idle-reduction systems that each avoid 1,000 hours of idling annually. Using a diesel fuel consumption rate of 0.8 gallons per hour and an emission factor of 10.21 kilograms of CO₂ per gallon (EPA MOVES and SmartWay guidance), these reductions amount to 817 MTCO₂e per year at full implementation. For intermodal yard operations, the analysis assumed five rubber-tired gantry (RTG) cranes, each consuming approximately 40,000 gallons of diesel annually. Electrification of these cranes reduces diesel use and replaces it with electric demand of 800 MWh per crane, yielding a net savings of 110 MTCO₂e per year when Alabama’s reported grid emission factor of 0.483 MTCO₂ per MWh is applied. Lastly, the replacement of 20 diesel yard tractors and top-handlers with electric models was modeled using baseline fuel use of 6,000 gallons per year per unit, resulting in a net savings of 980 MTCO₂e annually after accounting for electric consumption. Adoption rates were assumed to phase in to 40% by 2025, 80% by 2030, and 100% by 2050, producing estimated reductions of 763 MTCO₂e annually in 2025, 1,526 MTCO₂e in 2030, and 1,907 MTCO₂e in 2050.
Table N: Measure 18 quantified emission reductions as compared to BAU emissions (MT CO₂e)
All emission reductions per strategy were summarized in the table below for reference.
Table O: Summary Table of Annual Emissions Reduction by Measure
Alabama Cooperative Extension. (2023). Drought-tolerant landscapes for Alabama.
Alabama Department of Environmental Management (ADEM). (2025). Municipal wastewater outfalls map.
Alabama Public Climate Action Plan (PCAP). (2024). Municipal fleet transition measure documentation. Asphalt Institute. (2019). Environmental product declarations for asphalt mixtures.
Brown, S., Schroeder, P., & Kern, J. (1999). Spatial distribution of biomass in forests of the eastern United States. Environmental Management, 23(2).
California Air Pollution Control Officers Association (CAPCOA). (2010). Quantifying greenhouse gas mitigation measures: A resource for local governments to assess emission reductions from GHG mitigation measures.
California Air Pollution Control Officers Association (CAPCOA). (2021). Quantifying greenhouse gas mitigation measures.
Caltrans. (2012). California household travel survey.
Center for Transit-Oriented Development. (2008). Effects of transit-oriented development on housing, parking, and travel.
Chatman, D. (2013). Does scarce residential parking reduce auto ownership and use? Journal of the American Planning Association.
Closed Loop Partners & Eco-Cycle. (2021). The state of composting in the U.S.
Denver Office of Climate Action, Sustainability & Resiliency (CASR). (2023). E-bike rebate program impact summary. https://www.denvergov.org/Government/Agencies-Departments-Offices/Climate-ActionSustainability-Resiliency/E-Bike-Rebates
Ewing, R., & Cervero, R. (2010). Travel and the built environment: A meta-analysis. Journal of the American Planning Association, 76(3), 265–294.
Federal Energy Management Program (FEMP), U.S. Department of Energy. (2014). Guidelines for estimating landscape water use.
Federal Highway Administration (FHWA). (2016). The relationship between land use, urban form, and vehicle miles of travel: Evidence from the literature.
Federal Highway Administration (FHWA). (2016). Active transportation and demand management.
Federal Transit Administration (FTA). (2010). Evaluating public transportation health benefits.
Health Care Without Harm (HCWH). (2023). Health sector climate pledge and decarbonization guidance.
ICLEI–Local Governments for Sustainability USA. (2019). U.S. community protocol for accounting and reporting of greenhouse gas emissions (Version 1.2). https://icleiusa.org/us-community-protocol/
Institute for Transportation and Development Policy (ITDP). (2016). The BRT standard.
Institute of Transportation Engineers (ITE). (2019). Parking generation manual (5th ed.).
Intergovernmental Panel on Climate Change (IPCC). (2006). 2006 IPCC guidelines for national greenhouse gas inventories: Volume 4—Agriculture, forestry and other land use. https://www.ipcc-nggip.iges.or.jp/ public/2006gl/
Intergovernmental Panel on Climate Change (IPCC). (2006). 2006 IPCC guidelines for national greenhouse gas inventories: Volume 5—Waste.
Intergovernmental Panel on Climate Change (IPCC). (2014). Climate change 2014: Fifth assessment report (AR5).
Intergovernmental Panel on Climate Change (IPCC). (2019). 2019 refinement to the 2006 IPCC guidelines for national greenhouse gas inventories.
Jefferson County. (2015). Solid waste management plan.
Jefferson County Environmental Services. (2024). Facility profiles.
LandSearch. (2024). Real estate listings for undeveloped and vacant parcels in Birmingham, Alabama. https://www.landsearch.com
National Academies of Sciences, Engineering, and Medicine. (2022). Investigation of free transit programs in the U.S.
National Center for Safe Routes to School. (2021). Safe routes to school (SRTS) guide.
National Institute for Transportation and Communities (NITC). (2020). The e-bike potential: How electric bicycles can improve sustainable transportation. https://nitc.trec.pdx.edu/research/project/1283
National Renewable Energy Laboratory (NREL). (2021). Modeling port and freight equipment electrification.
National Renewable Energy Laboratory (NREL). (2022). Workplace charging usage and energy demand profiles.
Nowak, D. J., et al. (n.d.). Urban tree carbon sequestration rates [Model documentation]. U.S. Forest Service. i-Tree Eco. https://www.itreetools.org
Rails-to-Trails Conservancy. (2019). Active transportation transforms America.
Rocky Mountain Institute (RMI). (2021). Can electric bikes help tackle climate change? https://rmi.org/ insight/can-electric-bikes-help-tackle-climate-change/
Rocky Mountain Institute (RMI). (2021). The e-bike potential: How e-bikes can replace car trips in U.S. cities.
Shaheen, S., et al. (2020). Impact of carsharing on household vehicle holdings: Results from North American shared-use vehicle survey. UC Berkeley.
Smart Growth America. (2020). Driving down emissions: Transportation, land use, and climate change.
Southern Nevada Water Authority. (2012). Xeriscape conversion study.
Transportation Research Board. (2015). NCHRP Report 803: Active transportation and real-world reductions in VMT.
Transportation Research Board. (TCRP Reports 95 & 118). Traveler response to transportation system changes: BRT practitioners guide.
U.S. Department of Agriculture (USDA). (2020). Carbon sequestration in soils and grasslands.
U.S. Department of Energy (DOE). (2019). Truck idle reduction technology fact sheet.
U.S. Department of Energy (DOE). (2022). Heat pump and electrification performance fact sheet.
U.S. Department of Energy (DOE). (n.d.). Healthcare energy efficiency and resilience case studies.
U.S. Department of Energy (DOE) & U.S. Energy Information Administration (EIA). (n.d.). Electric power annual.
U.S. Department of Energy, Alternative Fuels Data Center. (2023). Electric vehicle fuel economy and energy use data.
U.S. Energy Information Administration (EIA). (2018). Commercial buildings energy consumption survey (CBECS).
U.S. Environmental Protection Agency (EPA). (2011). Location efficiency and housing type: Boiling it down to BTUs.
U.S. Environmental Protection Agency (EPA). (2013). Benchmarking energy efficiency at wastewater treatment plants.
U.S. Environmental Protection Agency (EPA). (2016). Net zero energy for water resource recovery facilities: A roadmap to 2040.
U.S. Environmental Protection Agency (EPA). (2017). Smart growth and climate change.
U.S. Environmental Protection Agency (EPA). (2018). Advancing sustainable materials management: 2018 fact sheet.
U.S. Environmental Protection Agency (EPA). (2018). Greenhouse gas inventory guidance for land use, land-use change, and forestry.
U.S. Environmental Protection Agency (EPA). (2020). Onsite non-potable water systems for municipal, institutional, and commercial buildings.
U.S. Environmental Protection Agency (EPA). (2021). Energy use in the U.S. water sector.
U.S. Environmental Protection Agency (EPA). (2022). MOVES3 emissions model and SmartWay idle reduction guidance.
U.S. Environmental Protection Agency (EPA). (2022). Emissions & Generation Resource Integrated Database (eGRID) 2022 subregion data. https://www.epa.gov/egrid
U.S. Environmental Protection Agency (EPA). (2023). Emission factors for greenhouse gas inventories.
U.S. Environmental Protection Agency (EPA). (2023). GHG reporting program, Subpart HH: Municipal solid waste landfills.
U.S. Environmental Protection Agency (EPA). (2024). Emission factors for greenhouse gas inventories.
U.S. Environmental Protection Agency (EPA). (2025). GHG emission factors hub (EPA 430-R-25-001). https://www.epa.gov/climateleadership/ghg-emission-factors-hub
U.S. Environmental Protection Agency (EPA). (n.d.). Landfill methane outreach program (LMOP) technical guidance.
U.S. Environmental Protection Agency (EPA). (n.d.). Greenhouse gas emissions from a typical passenger vehicle. https://www.epa.gov/greenvehicles/greenhouse-gas-emissions-typical-passenger-vehicle
U.S. Environmental Protection Agency (EPA). (n.d.). WARM model documentation (Version 15).
U.S. Environmental Protection Agency & U.S. Geological Survey. (n.d.). Energy–water nexus data: Typical energy intensity of water supply and treatment (2,300 kWh per million gallons).
U.S. Environmental Protection Agency & U.S. Department of Energy. (2017). WaterSense program: Water efficiency at work—Best management practices for commercial and institutional facilities.
U.S. Forest Service (USFS). (2013). Urban tree carbon sequestration and growth data (Nowak et al.).
U.S. Forest Service (USFS). (n.d.). Urban tree carbon sequestration rates [Model documentation]. i-Tree Eco.
U.S. National Renewable Energy Laboratory (NREL). (2022). Workplace charging and energy demand profiles.
World Resources Institute, C40 Cities, & ICLEI. (2021). Global protocol for community-scale greenhouse gas emission inventories (GPC 1.1). https://ghgprotocol.org/gpc
Appendix E: CAP and HAP Emission Projections
The tables below show the CAP and HAP emissions per county for the Birmingham MSA.
Introduction
The tables below show the CAP and HAP emissions per county for the Birmingham MSA.
CAP and HAP emissions per county
CAP and HAP Emissions per County
Sum of Emissions (Tons)
Benzo[a]Pyrene
Benzo[b]Fluoranthene
Benzo[e]Pyrene
Benzo[g,h,i,]Perylene
Benzo[k]Fluoranthene
2,4-Toluene Diisocyanate
2,4,6-Trichlorophenol
1,1,2-Trichloroethane
1,1,2,2-Tetrachloroethane
2,4-Dinitrotoluene
Benzo(c)phenanthrene
Benzo(g,h,i)Fluoranthene
Benzo[a]Pyrene
Benzo[b]Fluoranthene
1,2,4-Trichlorobenzene
2,4-Toluene
2,4,6-Trichlorophenol
Benzo[g,h,i,]Perylene
2,4,6-Trichlorophenol
Benzo[k]Fluoranthene
Volatile Organic Compounds
(Mixed Isomers)
1,4-Dichlorobenzene
Condensible
PM10 Primary (Filt + Cond)
PM2 5 Filterable
PM2 5 Primary (Filt + Cond)
PM2 5 Primary (Filt + Cond)
- Paved Road Dust
PM10 Filterable
PM10 Primary (Filt + Cond)
PM2 5 Filterable
PM2 5 Primary (Filt + Cond)
0
1
1
0
0
1,2,4-Trichlorobenzene
CAP and HAP Emission Reductions by Key Years
CAP and HAP Emission Reductions by key years
Row Labels
1,3-Butadiene
1,3-Dichloropropene
Bold indicates implementation year
1A.1 City Hall Retrofit
1A.3 Transition 50 tools, small engines, and other equipment to electric alternatives by 2031
1B.1 Secure two (2) MSA pipe melt shops committed to induction conversions (or first-furnace installs) by 2030
1C.1 Work with Alabama Power Company to encourage the Miller Steam Plant to convert all four (4) units to natural gas
State Energy Program, Rural Energy for America Program, Energy Efficiency and Conservation Block Grants, Green Banks & Clean Energy Financing Support
Operating Budget
2A.1 Launch "Solarize the MSA" by building a crowd funding campaign which bundles multiple solar projects under one RFP
2A.2 Designate 35th Avenue Superfund site as an opportunity for a renewable energy microgrid for all industry and residential LIDAC communities in and around the superfund site.
2A.3 Establish solar/ charging infrastructure to support irrigation in rural regions within the MSA by identifying and working with local farms to transition irrigation systems to renewable energy.
2A.5 Implement a DER program to reduce peak demand. Implement energy management and energy storage systems at municipal locations to charge during low-use periods and release energy during peak demand hours.
3.1 Establish a program that provides low-interest loans for home energy efficiency retrofits, with zero-interest loans for eligible low-income households.
Alabama Energy Infrastructure Bank, RE-Powering America’s Land Initiative, Energy Efficiency and Conservation Block Grants, Greenhouse Gas Reduction Fund / Green Banks, Alabama State Energy Program, AlabamaSAVES Revolving Loan Program, State Tax Incentives, PACE (Property Assessed Clean Energy)
3.2 Promote programs for electrifying residential and commercial properties and improve energy efficiency through insulation, efficient heating/cooling systems, and energy audits.
3.3 Convert the Birmingham City Hall to LED, starting with a quick lighting audit to baseline fixture counts, hours, and kWh.
Energy Efficiency & Conservation Block Grant, State Energy Program, SAVES Revolving Loan Program & Local Energy Loan Programs
3.4 Adopt or encourage energy-efficient building codes for new construction
4.1 Promote increased walkability and compact, mixed-use development around existing urban centers, planners to reduce car dependency, lower GHG emissions, and support local economic vitality.
5.1 Set a goal of net zero for 100% passenger vehicles and a 50% reduction in emissions for heavier vehicles (Fire, EMS, Public Works) by 2035
Active Transportation Infrastructure Investment Program, MAX Transit maintenance grants, Transportation Alternatives Program, EV Charging Infrastructure Program, Volkswagen Environmental Mitigation Trust, Alabama Power's Make Ready Program, Low or No Emission Vehicle Program, EV Funding Finder tool
5.3 Promote Alabama Power's EV Home Charger Rebate program to educate customers on reduced rates for off-peak charging
6.1 Expand the initial Electric Bike Voucher Program to distribute electric bike vouchers annually
Community Grant Program, Energy Efficiency and Conservation Block Grant , Environmental Justice or Clean Air Grants, Federal Infrastructure Programs
7.1 Write a Comprehensive TOD Corridor Plan to Incorporate large-scale transitoriented development (TOD) projects while also supporting smaller-scale, neighborhoodbased intermodal facilities. These localized hubs—modeled after Dutch Mobility Hubs— could offer a variety of transportation options and amenities, helping to connect users more efficiently and address first- and last-mile challenges
7.2 Explore expansions that can be accomplished to facilitate connectivity to destinations along the EastWest corridor and future North-South corridor
7.3 Build additional portions of critical trail infrastructure such as those identified in the Red Rock Trail System Action Plan and B-ACTIVE Plan
Commute Smart Program, Strengthening Mobility and Revolutionizing Transportation (SMART) grants program. Transportation Alternatives Program, Rebuilding American Infrastructure with Sustainability and Equity, TOD Planning Grants
Strengthening Mobility and Revolutionizing Transportation (SMART) grants program, Commute Smart Program, FTA TOD Planning Grants, Congestion Mitigation and Air Quality Improvement (CMAQ) Program, Surface Transportation Block Grant Program
Transportation Alternatives Program
7.4 Utilize a voucher program to reduce or eliminate public transportation fares, incentivizing residents to use public transit and eliminating financial barriers to transit access
8.1 Prioritize active transportation and support a growing community of E-Bike users, including the installation of E-Bike charging infrastructure, bike fix-it stations, and covered bike parking, in key public areas
8.2 Require new nonresidential developments greater than 25,000 square feet to reduce VMT through Transportation Demand Management (TDM) programs using the City of Birmingham's TDM workbook
8.3 Explore the development of a comprehensive carsharing and bike-sharing program that serves communities across the MSA
8.4 Re-introduce the Safe Routes to School program to promote safe, active transportation options for students traveling to and from school
9.2 Transition to droughttolerant landscaping at all municipal buildings within the MSA by 2030
Carbon Reduction Program, Congestion Mitigation and Air Quality Improvement Program, Surface Transportation System Funding Alternatives, Value Pricing Pilot Program, Safe Streets and Roads for Al
9.3 Provide incentives for the installation of smart sprinkler systems, both residentially and commercially, through the Central Alabama Water rebate program
9.4 Offer expedited and reduced-cost permits to new developments and major renovations that incorporate greywater systems or rainwater harvesting infrastructure
11.1 Continue to enforce the Post-Construction Stormwater Ordinance in the MSA
11.2 Lobby for the enforcement of quarterly water quality audits in partnership with the Riverkeeper non-profit group
11.3 Prioritize the installation of nature-based solutions in areas of high need
Alabama Section 319 Clean Water Implementation Grants, Community Disaster Resilience Zones, PreDisaster Mitigation Grant, PROTECT (Promoting Resilient Operations for Transformative, Efficient, and Cost-Saving Transportation)
11.4 Consider eliminating minimum parking requirements from local zoning codes
12.1 Introduce and enforce policies that prioritize the purchase of environmentally friendly and recycled-content products for municipal operations
12.3 Adopt a Model Waste Franchise Agreement MSA wide to create consistency in residential and commercial services
12.4 Expand the City’s residential waste hauling services to align with the standards and rates established in the Model Waste Management Franchise Agreement
13.1 Convert vacant lots into green system interventions, such as rain gardens, tree plantings, and lowmaintenance meadows
13.3 Utilize city/countyowned or operated open spaces to showcase sustainable landscaping and low-impact design planting strategies
14A.1 Increase resident's access to fresh, affordable, and healthy foods. Improving access to fresh, affordable, and healthy foods
Recycling Education and Outreach Grant Program, Solid Waste Infrastructure for Recycling, Rural Utilities Service – Solid Waste Management Grants, Alabama Recycling Fund Grants
Federal RAISE Grants, American Rescue Plan Act, Forever Wild Land Trust, Land and Water Conservation Fund, Outdoor Recreation Legacy Partnership, Open Space Lands Acquisition and Development Grants
Operating Budget
14B.1 No-till Farming
14C.1 Restrict application of bio char on regional agriculture land
15.2 Prioritize the use of light-colored roofing materials or establish a minimum solar reflectance standard for commercial and residential roofs during new construction or replacement
15.3 Develop a toolkit for cities and counties that outlines best practices
16.1 Merge the CACAP Steering Committee with the Sustainability Steering Committee
16.2 Leverage cooperative internships focused on climate action and sustainability to build a strong career pipeline for college students across the MSA
16.3 Re-design climate action website for one-stop-shop information that educates the public on the CACAP
17.1 Support and incentivize the growth of start-ups and small businesses
Agriculture & Forestry Program, Conservation Stewardship Program
&
Community Development Block Grants, Bloomberg Cities Idea Exchange
17.2 Develop clear and accessible career pathways for ten priority green workforce positions
17.3 Create family-supporting jobs in communities that have long faced systemic underinvestment
1A.1 City Hall Retrofit
1A.2 Create electrification policies for large facilities such as convention centers, hotels, and amphitheaters, beginning with the BJCC by 2030
1A.3 Transition 50 tools, small engines, and other equipment to electric alternatives by 2031
1B.1 Secure two (2) MSA pipe melt shops committed to induction conversions (or first-furnace installs) by 2030
1C.1 Work with Alabama Power Company to encourage the Miller Steam Plant to convert all four (4) units to natural gas
2A.1 Launch "Solarize the MSA" by building a crowd funding campaign which bundles multiple solar projects under one RFP
State Energy Program, Rural Energy for America Program, Energy Efficiency and Conservation Block Grants, Green Banks & Clean Energy Financing Support
2A.2 Designate 35th Avenue Superfund site as an opportunity for a renewable energy microgrid for all industry and residential LIDAC communities in and around the superfund site.
2A.3 Establish solar/charging infrastructure to support irrigation in rural regions within the MSA by identifying and working with local farms to transition irrigation systems to renewable energy.
2A.4 Support UAB to Install a
2A.5 Implement a DER program to reduce peak demand. Implement energy management and energy storage systems at municipal locations to charge during low-use periods and release energy during peak demand hours.
2B.1 Establish waste-toenergy systems at two landfills to install advanced landfill gas collection infrastructure to capture methane generated by the anaerobic decomposition of organic waste
Revolving Loan Program, State Tax Incentives, PACE (Property Assessed Clean Energy)
Revolving Loan Program
3.1 Establish a program that provides low-interest loans for home energy efficiency retrofits, with zero-interest loans for eligible low-income households.
3.2 Promote programs for electrifying residential and commercial properties and improve energy efficiency through insulation, efficient heating/cooling systems, and energy audits.
4.1 Promote increased walkability and compact, mixeduse development around existing urban centers, planners to reduce car dependency, lower GHG emissions, and support local economic vitality.
5.1 Set a goal of net zero for 100% passenger vehicles and a 50% reduction in emissions for heavier vehicles (Fire, EMS, Public Works) by 2035
Active Transportation Infrastructure Investment Program, MAX Transit maintenance grants, Transportation Alternatives Program, EV Charging Infrastructure Program, Volkswagen Environmental Mitigation Trust, Alabama Power's Make Ready Program, Low or No Emission Vehicle Program, EV Funding Finder tool
5.2 Expand 75 Level 2 EV charging stations to employers by 2035
5.3 Promote Alabama Power's EV Home Charger Rebate program to educate customers on reduced rates for off-peak charging
5.4 Electrify UAB’s Blazer Express bus fleet by 2035
6.1 Expand the initial Electric Bike Voucher Program to distribute electric bike vouchers annually
7.1 Write a Comprehensive TOD Corridor Plan to Incorporate large-scale transit-oriented development (TOD) projects while also supporting smaller-scale, neighborhood-based intermodal facilities. These localized hubs— modeled after Dutch Mobility Hubs—could offer a variety of transportation options and amenities, helping to connect users more efficiently and address first- and last-mile challenges
Transportation Alternatives Program, EV Charging Infrastructure Program, Alabama Power's Make Ready Program
Community Grant Program, Energy Efficiency and Conservation Block Grant , Environmental Justice or Clean Air Grants, Federal Infrastructure Programs
Commute Smart Program, Strengthening Mobility and Revolutionizing Transportation (SMART) grants program. Transportation Alternatives Program, Rebuilding American Infrastructure with Sustainability and Equity, TOD Planning Grants
7.2 Explore expansions that can be accomplished to facilitate connectivity to destinations along the East-West corridor and future North-South corridor
7.3 Build additional portions of critical trail infrastructure such as those identified in the Red Rock Trail System Action Plan and B-ACTIVE Plan
7.4 Utilize a voucher program to reduce or eliminate public transportation fares, incentivizing residents to use public transit and eliminating financial barriers to transit access
8.1 Prioritize active transportation and support a growing community of E-Bike users, including the installation of E-Bike charging infrastructure, bike fix-it stations, and covered bike parking, in key public areas
8.2 Require new non-residential developments greater than 25,000 square feet to reduce VMT through Transportation Demand Management (TDM) programs using the City of Birmingham's TDM workbook
Strengthening Mobility and Revolutionizing Transportation (SMART) grants program, Commute Smart Program, FTA TOD Planning Grants, Congestion Mitigation and Air Quality Improvement (CMAQ) Program, Surface Transportation Block Grant Program
Transportation Alternatives Program
Carbon Reduction Program, Congestion Mitigation and Air Quality Improvement Program, Surface Transportation System Funding Alternatives, Value Pricing Pilot Program, Safe Streets and Roads for Al
9.1 Purchase and install 100 motion sensor faucets in all municipal buildings
9.2 Transition to drought-tolerant landscaping at all municipal buildings within the MSA by 2030
9.3 Provide incentives for the installation of smart sprinkler systems, both residentially and commercially, through the Central Alabama Water rebate program
10.1 Retrofit wastewater treatment facilities with renewable energy and energy-efficient technologies
11.2 Lobby for the enforcement of quarterly water quality audits in partnership with the Riverkeeper non-profit group
11.3 Prioritize the installation of nature-based solutions in areas of high need
Clean Water State Revolving Fund, Water Infrastructure Finance and Innovation Act
Alabama Section 319 Clean Water Implementation Grants, Community Disaster Resilience Zones, PreDisaster Mitigation Grant, PROTECT (Promoting Resilient Operations for Transformative, Efficient, and Cost-Saving Transportation)
12.1 Introduce and enforce policies that prioritize the purchase of environmentally friendly and recycled-content products for municipal operations
12.2
12.3 Adopt a Model Waste Franchise Agreement MSA wide to create consistency in residential and commercial services
12.4 Expand the City’s residential waste hauling services to align with the standards and rates established in the Model Waste Management Franchise Agreement
13.1 Convert vacant lots into green system interventions, such as rain gardens, tree plantings, and low-maintenance meadows
Education and Outreach Grant Program, Solid Waste Infrastructure for Recycling, Rural Utilities Service–Solid Waste Management Grants, Alabama Recycling Fund Grants
Federal RAISE Grants , American Rescue Plan Act, Forever Wild Land Trust, Outdoor Recreation Legacy Partnership, Open Space Lands Acquisition and Development Grants
13.2 Develop a Comprehensive Urban Community Forestry Plan
13.3 Utilize city/countyowned or operated open spaces to showcase sustainable landscaping and low-impact design planting strategies
Open Space Lands Acquisition and Development Grants
14A.1 Increase resident's access to fresh, affordable, and healthy foods. Improving access to fresh, affordable, and healthy foods
Agriculture &
14C.1 Restrict application of bio char on regional agriculture land
15.1 Conduct a heat study and mapping initiative to identify designated Urban Heat Island locations
18A.1 Adopt new technologies, processes, and equipment to reduce reliance on fossil fuel-generated energy and increase energy efficiency in industrial-scale steel and gas operations
18A.2 Establish industry standards such as the Science Based Targets initiative (SBTi) to ensure steel and gas companies align with global climate benchmarks
18A.3 Consider Carbon Capture and Sequestration (CCS) tools which present a promising opportunity to mitigate GHG emissions from hard-to-abate industrial sectors in the MSA
Agriculture & Forestry Program
18B.1 Work with individual healthcare facilities to plan and implement GHG reduction strategies as part of a broader effort to align the healthcare sector with regional climate goals
18B.2 Target healthcare facilities with renewable energy projects which offers a strategic opportunity to reduce emissions and operational costs while improving grid stability
18B.3 Participate in the Climate and Health Initiative which offers a critical opportunity to connect the implementation of the CACAP Toolkit with regional efforts to address the intersection of climate change and public health
1A.1 City Hall Retrofit
1A.2 Create electrification policies for large facilities such as convention centers, hotels, and amphitheaters, beginning with the BJCC by 2030
1A.3 Transition 50 tools, small engines, and other equipment to electric alternatives by 2031
1B.1 Secure two (2) MSA pipe melt shops committed to induction conversions (or firstfurnace installs) by 2030
1C.1 Work with Alabama Power Company to encourage the Miller Steam Plant to convert all four (4) units to natural gas
2A.1 Launch "Solarize the MSA" by building a crowd funding campaign which bundles multiple solar projects under one RFP
State Energy Program, Rural Energy for America Program, Energy Efficiency and Conservation Block Grants, Green Banks & Clean Energy Financing Support
2A.2 Designate 35th Avenue Superfund site as an opportunity for a renewable energy microgrid for all industry and residential LIDAC communities in and around the superfund site
2A.3 Establish solar/ charging infrastructure to support irrigation in rural regions within the MSA by identifying and working with local farms to transition irrigation systems to renewable energy.
2A.4 Support UAB to Install a solar powered parking structure on campus
2A.6 Promote the installation of resilient renewable energy systems at facilities that provide emergency response services to MSA citizens
2B.1 Establish waste-toenergy systems at two landfills to install advanced landfill gas collection infrastructure to capture methane generated by the anaerobic decomposition of organic waste
3.1 Establish a program that provides low-interest loans for home energy efficiency retrofits, with zero-interest loans for eligible low-income households.
Alabama Energy Infrastructure Bank, RE-Powering America’s Land Initiative, Energy Efficiency and Conservation Block Grants, Greenhouse Gas Reduction Fund / Green Banks, Alabama State Energy Program, AlabamaSAVES Revolving Loan Program, State Tax Incentives, PACE (Property Assessed Clean Energy)
Alabama Energy Infrastructure Bank, RE-Powering America’s Land Initiative, Energy Efficiency and Conservation Block Grants, Greenhouse Gas Reduction Fund / Green Bank, AlabamaSAVES Revolving Loan Program
3.2 Promote programs for electrifying residential and commercial properties and improve energy efficiency through insulation, efficient heating/cooling systems, and energy audits.
4.1 Promote increased walkability and compact, mixed-use development around existing urban centers, planners to reduce car dependency, lower GHG emissions, and support local economic vitality.
5.1 Set a goal of net zero for 100% passenger vehicles and a 50% reduction in emissions for heavier vehicles (Fire, EMS, Public Works) by 2035
5.2 Expand 75 Level 2 EV charging stations to employers by 2035
Active Transportation Infrastructure Investment Program, MAX Transit maintenance grants, Transportation Alternatives Program, EV Charging Infrastructure Program, Volkswagen Environmental Mitigation Trust, Alabama Power's Make Ready Program, Low or No Emission Vehicle Program, EV Funding Finder tool
Transportation Alternatives Program, EV Charging Infrastructure Program, Alabama Power's Make Ready Program
5.3 Promote Alabama Power's EV Home Charger Rebate program to educate customers on reduced rates for off-peak charging
5.4 Electrify UAB’s Blazer Express bus fleet by 2035
6.1 Expand the initial Electric Bike Voucher Program to distribute electric bike vouchers annually
7.2 Explore expansions that can be accomplished to facilitate connectivity to destinations along the EastWest corridor and future North-South corridor
7.3 Build additional portions of critical trail infrastructure such as those identified in the Red Rock Trail System Action Plan and B-ACTIVE Plan
Community Grant Program, Energy Efficiency and Conservation Block Grant , Environmental Justice or Clean Air Grants, Federal Infrastructure Programs
Strengthening Mobility and Revolutionizing Transportation (SMART) grants program, Commute Smart Program, FTA TOD Planning Grants, Congestion Mitigation and Air Quality Improvement (CMAQ) Program, Surface Transportation Block Grant Program
Transportation Alternatives Program
7.4 Utilize a voucher program to reduce or eliminate public transportation fares, incentivizing residents to use public transit and eliminating financial barriers to transit access
8.1 Prioritize active transportation and support a growing community of E-Bike users, including the installation of E-Bike charging infrastructure, bike fix-it stations, and covered bike parking, in key public areas
8.2 Require new nonresidential developments greater than 25,000 square feet to reduce VMT through Transportation Demand Management (TDM) programs using the City of Birmingham's TDM workbook
9.2 Transition to droughttolerant landscaping at all municipal buildings within the MSA by 2030
9.3 Provide incentives for the installation of smart sprinkler systems, both residentially and commercially, through the Central Alabama Water rebate program
10.1 Retrofit wastewater treatment facilities with renewable energy and energy-efficient technologies
Carbon Reduction Program, Congestion Mitigation and Air Quality Improvement Program, Surface Transportation System Funding Alternatives, Value Pricing Pilot Program, Safe Streets and Roads for Al
Clean Water State Revolving Fund, Water Infrastructure Finance and Innovation Act
11.2 Lobby for the enforcement of quarterly water quality audits in partnership with the Riverkeeper non-profit group
11.3 Prioritize the installation of nature-based solutions in areas of high need
Alabama Section 319 Clean Water Implementation Grants, Community Disaster Resilience Zones, PreDisaster Mitigation Grant, PROTECT (Promoting Resilient Operations for Transformative, Efficient, and Cost-Saving Transportation)
12.1 Introduce and enforce policies that prioritize the purchase of environmentally friendly and recycled-content products for municipal operations
12.2 Adopt a
Recycling Education and Outreach Grant Program, Solid Waste Infrastructure for Recycling, Rural Utilities Service – Solid Waste Management Grants, Alabama Recycling Fund Grants
13.1 Convert vacant lots into green system interventions, such as rain gardens, tree plantings, and lowmaintenance meadows
Federal RAISE Grants , American Rescue Plan Act, Forever Wild Land Trust, Outdoor Recreation Legacy Partnership, Open Space Lands Acquisition and Development Grants
13.3 Utilize city/countyowned or operated open spaces to showcase sustainable landscaping and low-impact design planting strategies
14A.1 Increase resident's access to fresh, affordable, and healthy foods. Improving access to fresh, affordable, and healthy foods
18A.1 Adopt new technologies, processes, and equipment to reduce reliance on fossil fuel-generated energy and increase energy efficiency in industrial-scale steel and
18A.2 Establish industry standards such as the Science Based Targets initiative (SBTi) to ensure steel and gas companies align with global climate benchmarks
18A.3 Consider Carbon Capture and Sequestration (CCS) tools which present a promising opportunity to mitigate GHG emissions from hard-to-abate industrial sectors in the MSA
18B.1 Work with individual healthcare facilities to plan and implement GHG reduction strategies as part of a broader effort to align the healthcare sector with regional climate goals
18B.2 Target healthcare facilities with renewable energy projects which offers a strategic opportunity to reduce emissions and operational costs while improving grid stability
18A.1 Adopt new technologies, processes, and equipment to reduce reliance on fossil fuel-generated energy and increase energy efficiency in industrial-scale steel and gas operations
18B.3 Participate in the Climate and Health Initiative which offers a critical opportunity to connect the implementation of the CACAP Toolkit with regional efforts to address the intersection of climate change and public health
18C.1 Restore degraded lands surrounding the rail line, including brownfields and deforested areas
18C.2 Implement idlereduction technologies, electric cranes, and cleaner ground support equipment at yards and intermodal terminals
Brownfields Program, Restoration and Enhancement Grant Program
Clean Ports Program, Port Infrastructure Development Program, Reduction of Truck Emissions at Port Facilities
Various federal, state, and regional agencies provide grants, loans, and planning support for climatefocused initiatives. Funding opportunities are increasingly available to help local jurisdictions achieve their climate goals, particularly those aimed at reducing emissions. Cities and counties with established CACAPs may have a competitive edge when applying for grants, as these plans demonstrate a strong commitment to climate and proactive planning. While not an exhaustive list of all available funding sources, Table B outlines potential avenues the MSA could explore to finance the CACAP Toolkit’s implementation. These funds can support early-stage program development, pilot initiatives, and staffing, helping to establish a sustainable financial model for long-term success. Additionally, utilities and other organizations offer rebates, financing options, and discounts to promote energy-efficient upgrades and sustainability projects in residential and commercial sectors.
TYPE OF FUNDING EXAMPLES
Open Space Preservation Tax
Property Tax Increment
Taxes
Fees
DESCRIPTION
Tax on properties for preserving city open spaces and green areas.
Incremental property tax revenue allocated for development projects.
Utility User Tax City tax on utility service consumption such as natural gas.
Community Services/ Facilities District Special Taxes Levied on property owners to fund neighborhood enhancements.
Parking Fee User fee for city-owned parking facilities.
Development Fee Fee paid by developers for funding city infrastructure.
Impact Fees Paid by property owners who are seeking building permits.
Congestion Pricing User fee to reduce traffic congestion and raise funds.
Enterprise Fund
Funds
Bonds
Green Revolving Fund
Green Bond
Cities often collect franchise fees or utility user taxes from private utility providers for the right to operate in public rights-of-way.
An internal fund where savings from efficiency projects are reinvested in future green initiatives.
Bonds for capital improvements with an environmental focus.
TYPE OF FUNDING EXAMPLES
DESCRIPTION
Grants
Loans
Various State and Federal Grants, like CalRecycle, Caltrans, U.S. DOE Grants, U.S. EPA Grants, U.S. DOT Grants
Energy Efficiency Loans
Grants available for specific projects, often requiring matching funds or in-kind contributions.
179D for energy efficiency initiatives
Tax credits & deductions
Rebates
Inflation Reduction Act
Energy-Efficiency Rebates, Renewable Energy Rebates, Water-Saving Rebates, Transportation Rebates, Landscaping Rebates, Building Retrofits, Small Business Rebates
Low-interest loans provided by state or federal agencies for energy-efficiency or renewable energy projects.
Under Section 179D, tax-exempt entities—including cities, counties, and other local governments—can allocate the tax deduction to eligible designers of energy-efficient improvements made to public buildings. This allocation serves as an incentive for designers to incorporate energy-efficient systems into public projects, potentially reducing overall project costs for the City.
Comprehensive set of financial incentives to accelerate the transition to clean energy. Includes Investment and Production Tax Credits, as well as credits for clean vehicles and alternative fueling infrastructure.
Rebates from state and federal agencies incentivize sustainable and energy-efficient practices, such as the use of energy-efficient appliances or renewable energy systems. These rebates typically offset the initial cost of the product or service, making them more accessible.
TYPE OF FUNDING EXAMPLES
Energy Performance Contracts (EPC)
Public-Private Partnerships (PPP)
Infrastructure as a Service (IAAS)
Energy Efficiency Agreement
Alabama Power
Energy Infrastructure Lease
DESCRIPTION
Attachment X: PV Watts Production Estimates
Strategy 2A.2
PV Watts Production Estimates
STRATEGY 2A.2

Attachment X: PV Watts Production Estimates
Strategy 2A.2

* If a zip code includes areas belonging to more than one subregion, then you should determine the appropriate subregion online based on utility information with Power Profi ler. The presented emission rates are the rates from the fi rst listed subregion, also displayed in the "Selected eGRID Subregion" column. You can type in the correct subregion.