Climate change is a pressing global challenge that requires collective action and sustainable solutions to safeguard our planet's future. Greenhouse gas (GHG) emissions, which are emitted from the energy we consume and the products we use, are damaging our environment and increasing temperatures at an unsustainable pace.
The next few years are incredibly important in limiting global temperature increases and mitigating the most severe impacts of climate change. According to the Science-base Target initiative (SBTi), global emissions need to be reduced by 50% by 2030 and 100% by 2050. The longer we wait to act, the more expensive change becomes and our ability to adequately address climate change and halt the damage to the global ecosystem will be impeded.
The LVCVA is a leader in the travel and tourism industry. The LVCVA owns and operates the 4.6 million square foot Las Vegas Convention Center (LVCC), a premier trade show destination. Recognizing the need for urgent and ambitious climate action based on public concern and scientific evidence, the LVCVA sees the imperative to systemize and accelerate efforts. To make this transition, the LVCVA has new standards for our organization, and we will work with industry partners to effectively reduce GHG emissions across operations.
To begin the planning process, the LVCVA is using the SBTi as well as state and county reporting frameworks as guidance. At a statewide level, Nevada launched a Climate Strategy in 2020 to achieve a 45% GHG reduction by 2030 and a 100% reduction by 2050, using a 2005 baseline year. At a regional level, Clark County, in which the LVCC is located, is currently implementing the 2021 “All-in” Sustainability and Climate Action Plan to bolster a sustainable community that falls in line with the state guidance. In doing so, Clark County is on its way to also achieving a 100% reduction in GHG emissions by 2050.
Our Climate Action Plan (CAP) integrates environmental standards with social and economic considerations. This integration will ensure that the LVCVA maintains a Triple Bottom-Line framework to guide its decisionmaking process. This Triple Bottom Line consists of profit – the financial return for the LVCVA, people – our commitment to positively impacting society, and the planet – our recognition of our impact on the Earth. Achieving GHG emission reductions is the overarching goal of this CAP; however, eight (8) Guiding Principles have been identified to uphold the implementation of the CAP in its entirety.
1. REACH OVERARCHING GHG GOALS:
Achieve a 50% reduction in Scopes 1 and 2 by 2030 and 100% by 2050 using a 2022 baseline; begin tracking Scope 3 data as available.
2. REACH WATER USAGE REDUCTION GOALS:
Reduce water consumption annually per square foot.
3. REACH WASTE DIVERSION GOALS:
Achieve 75% diversion by 2027, and 90% by 2035.
4. ESTABLISH GOVERNANCE:
Strengthen internal and external management and accountability structures to ensure the LVCVA achieves the goals outlined in the CAP.
5. COMMUNICATE:
Build a community engagement strategy to integrate communication and reporting protocols across the facility and event partners.
6. DEVELOP RESILIENCE:
Be prepared for climate emergencies.
7. PROVIDE RESOURCES:
Be purposeful in understanding and prioritizing the funding needed to implement this CAP.
8. PARTNER:
Partner with facility and destination stakeholders.
The LVCVA began by inventorying 2022 GHG emissions. We chose 2022 as the year representative of normalized post-pandemic operations of the expanded LVCC Emissions were categorized into three scopes as shown in Table A
The LVCVA began by inventorying 2022 GHG emissions. We chose 2022 as the year representative of normalized post-pandemic operations of the expanded LVCC. Emissions were categorized into three scopes as shown in Table A.
The LVCVA began by inventorying 2022 GHG emissions. We chose 2022 as the year representative of normalized post-pandemic operations of the expanded LVCC. Emissions were categorized into three scopes as shown in Table A.
Table A: Working definition of three emission scopes
Table A: Working definition of three emission scopes
Scope 1 Carbon emissions resulting directly from fuel use on campus (primarily natural gas for heating) or LVCC-owned vehicles
Scope 1 Carbon emissions resulting directly from fuel use on campus (primarily natural gas for heating) or LVCC-owned vehicles
Scope 2 Carbon emissions associated with energy purchased by LVCC and generated elsewhere, (primarily grid electricity generated from utility used across facilities)
Scope 2 Carbon emissions associated with energy purchased by LVCC and generated elsewhere, (primarily grid electricity generated from utility used across facilities)
Scope 3 Carbon emissions resulting indirectly from LVCC operations, either from upstream or downstream acti vities, (for example, attendee transportation, procurement, and waste)
Scope 3 Carbon emissions resulting indirectly from LVCC operations, either from upstream or downstream activities, (for example, attendee transportation, procurement, and waste)
Scope 1 and Scope 2 emissions are within the LVCVA's direct influence and are where our immediate action can be most effective. This GHG inventory is not only a snapshot of current emissions but also a foundational tool for setting realistic and impactful carbon reduction targets, aligning with global sustainability standards, and enhancing the overall environmental stewardship of the LVCVA. The comprehensive details of the LVCVA's total emissions for the baseline year are presented in Table B.
Scope 1 and Scope 2 emissions are within the LVCVA's direct influence and are where our immediate action can be most effective. This GHG inventory is not only a snapshot of current emissions but also a foundational tool for setting realistic and impactful carbon reduction targets, aligning with global sustainability standards, and enhancing the overall environmental stewardship of the LVCVA. The comprehensive details of the LVCVA's total emissions for the baseline year are presented in Table B.
Scope 1 and Scope 2 emissions are within the LVCVA's direct influence and are where our immediate action can be most effective. This GHG inventory is not only a snapshot of current emissions but also a foundational tool for setting realistic and impactful carbon reduction targets, aligning with global sustainability standards, and enhancing the overall environmental stewardship of the LVCVA. The comprehensive details of the LVCVA's total emissions for the baseline year are presented in Table B.
Table B: Summary of emission totals from Scopes 1 and 2 (2022 Baseline).
Table B: Summary of emission totals from Scopes 1 and 2 (2022 Baseline).
CATEGORY
CATEGORY
To create this CAP, we developed and evaluated strategies to reduce emissions from Scopes 1 and 2. Both of these emission types can be directly controlled by the LVCVA. In addition to the LVCVA’s efforts, our analysis factored in the emission reductions created from less carbon-intensive energy generation by our electrical provider, NV Energy. Table C provides an overview of our planned Scope 1 and Scope 2 emission reduction strategy. Alternative strategies, along with more detailed analyses, are provided in the Detailed Report available as a supplement to this Executive Summary.
Table C: GHG Emissions Reduction Plan
* The average doesn’t include emissions from the 2041-2050 timeframe because no cost estimates are available
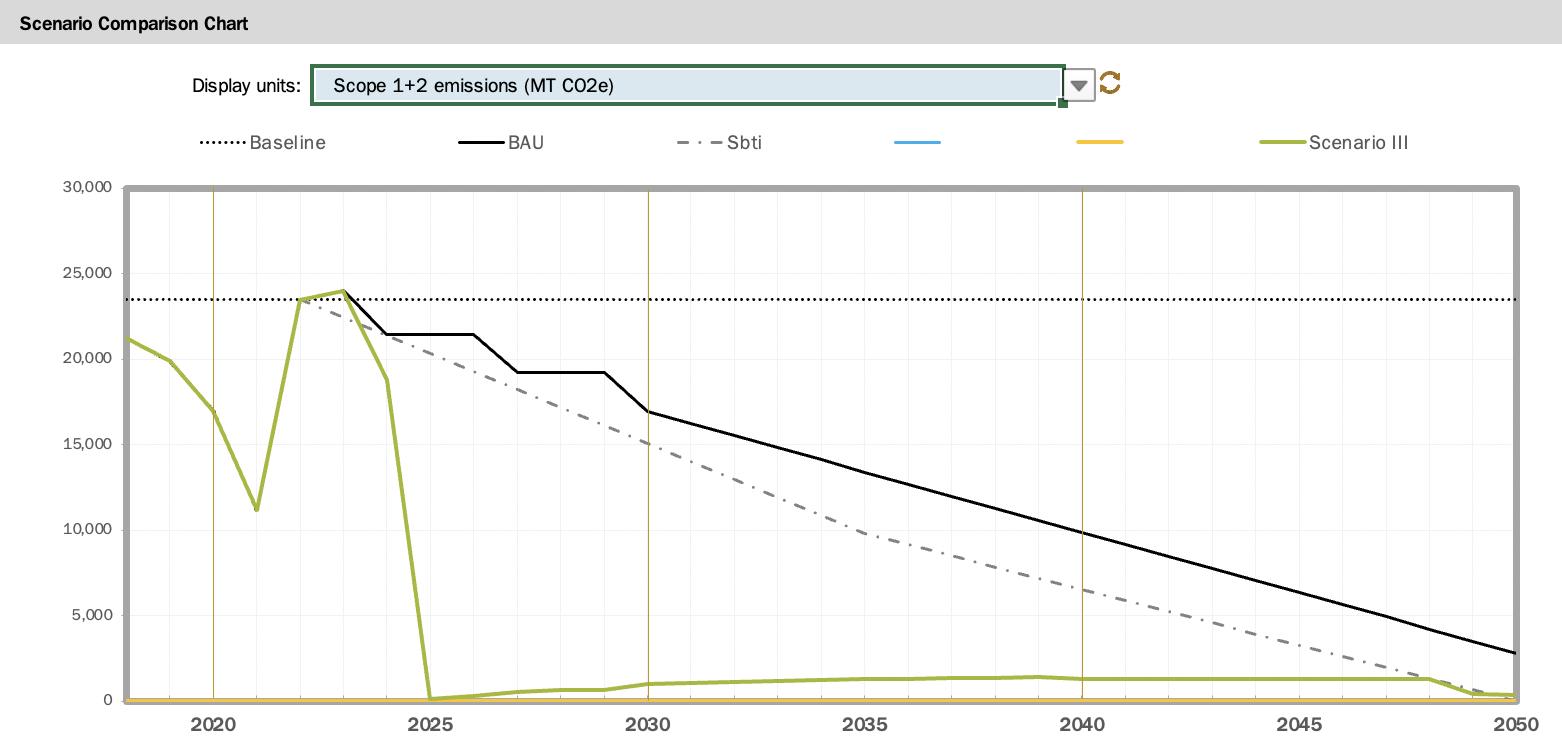
Figure A provides a depiction of the CAP ’s GHG reduction pathway to 2050. The dotted horizontal line represents a 2022 baseline, which represents the LVCVA the state after the West Hall installation; while the solid black line is an adjusted business-as-usual scenario, which assumes a gradual transition to 100% renewable electricity by the year 2050 achieved by NV Energy's targets for achieving carbon neutrality. The dashed line represents an SBTi target calculated for the LVCVA. Finally, the green line represents the CAP ’s GHG reduction planned outcome. For comprehensive information on alternative strategies and scenarios, please refer to the Detailed Report.
1 The cost of heating system upgrades doesn’t include tax rebates This cost can be lowered utilizing the 179D Commercial Buildings Energy-Efficiency Tax Deduction The exact amount needs to be determined based on the building square footage served by equipment, energy efficiency potential, and other factors.
2 The fleet electrification cost represents the incremental cost of the EV fleet after applying the Investment Tax Credit (ITC)
1 The cost of heating system upgrades doesn’t include tax rebates. This cost can be lowered utilizing the 179D Commercial Buildings Energy-Efficiency Tax Deduction. The exact amount needs to be determined based on the building square footage served by equipment, energy efficiency potential, and other factors.
2 The fleet electrification cost represents the incremental cost of the EV fleet after applying the Investment Tax Credit (ITC)
Figure A provides a depiction of the CAP’s GHG reduction pathway to 2050. The dotted horizontal line represents a 2022 baseline, which represents the LVCVA the state after the West Hall installation; while the solid black line is an adjusted business-as-usual scenario, which assumes a gradual transition to 100% renewable electricity by the year 2050 achieved by NV Energy's targets for achieving carbon neutrality. The dashed line represents an SBTi target calculated for the LVCVA. Finally, the green line represents the CAP’s GHG reduction planned outcome. For comprehensive information on alternative strategies and scenarios, please refer to the Detailed Report.
The water reduction goal is to reduce water consumption annually per square foot. Non-reuse water is the most important reduction element and will occur through continued irrigation efficiency, exploration of not-potable water usage, and weather and moisture controls to supplement our existing strict sustainable desert landscape guidelines. The plan also calls for the establishment of additional standards for low-flow faucets, toilets, and other water-efficient fixtures to reduce water consumption and the energy associated with water heating.
The water reduction goal is to reduce water consumption annually per square foot. Non-reuse water is the most important reduction element and will occur through continued irrigation efficiency, exploration of not-potable water usage, and weather and moisture controls to supplement our existing strict sustainable desert landscape guidelines. The plan also calls for the e stablishment of additional standards for low-flow faucets, toilets, and other water-efficient fixtures to reduce water consumption and the energy associated with water heating.
Our waste diversion strategy is the part of the CAP that requires the closest collaboration with our building partners. To achieve our goal of 75% waste diversion by 2035, we intend to conduct annual waste audits, partner with our waste hauler to better indicate “what goes where”, continue to reduce the use of non-recyclable materials and continue to improve the redirection of food waste, including through potential onsite anaerobic digestion.
Our waste diversion strategy is the part of the CAP that requires the closest collaboration with our building partners. To achieve our goal of 75% waste diversion by 2035, we intend to conduct annual waste audits, partner with our waste hauler to better indicate “what goes where”, continue to reduce the use of non-recyclable materials and continue to improve the redirection of food waste, including through potential onsite anaerobic digestion.