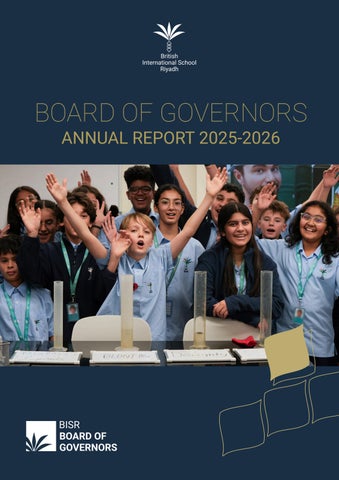
BOARD OF GOVERNORS ANNUAL REPORT 2025-2026
1
CONTENTS 04 Message from the Board of Governors 05. Board of Governors Structure of Governance 25/26 06. Role of the Board 07. Overview of 25/26 15. Briefing on School Finances – Financial Stability and Sustainability of the School – Tuition Fees – The School’s Finances Are Stable, and Take a Long-Term View – Investment in Teaching & Learning Remains the Priority 21. Summary of Academic Performance 22. EPC Summary of the Year – Exam Results 25/26 – Attainment: Primary – FS and Key Stage 1 – Attainment: Primary– Key Stage 2 – Attainment: Senior – Key Stage 3 – IGCSE, A Level, IB and BTEC Results – Class of 2026 University Destinations 31. BISR Campuses 32.Our Partners 33. Safeguarding Review – Our Commitment – Attendance Support Pathways and Outcomes – Attendance This Year – Independent Safeguarding Assurance and Governance – Strategic Development Plan (PSHE) – Strengthening Safeguarding Culture
3
MESSAGE FROM THE BOARD OF GOVERNORS As we look back across 2025/26, three words keep coming to mind: Excellence, Energy, and Expansion. Together, they capture not just what our school has achieved over the past twelve months, but who we are as a community and the direction we continue to travel in. Excellence - Raising the Bar Excellence is our foundation. This year’s exam results and academic milestones have once again set a remarkably high standard, reflecting the quiet determination of our students and the relentless dedication of our teaching staff. Beyond these figures, true academic excellence is visible every day in our classrooms, in the way our students push themselves to think critically and creatively. Energy - Life Across Our Campuses If excellence is our foundation, energy is our heartbeat. Step onto any of our seven campuses on any given day and you feel it instantly. The past year has seen an incredible surge of momentum - from high-energy House competitions and fixtures on the sports fields to concerts, debates, and creative showcases. Every event has brought our BISR community together, filling our sites with laughter, camaraderie, and experiences that will remain in our students' hearts for years to come. Expansion - Growth Without Compromise From welcoming students to Al Waha at the start of the 25/26 term, to continuously developing our existing sites, our school continues to evolve. We are actively expanding welcoming exceptional new staff and broadening the experiences available to our students. Yet as our footprint and community grow, our core mission remains unchanged. We expand not simply to get bigger, but to get better, ensuring that every new campus, classroom, teacher, and opportunity strengthens our overarching drive for excellence. Thank you to our students, families, and staff for making 2025/26 another standout year. The future is bright, and we look forward to everything we will build together in the years ahead.
BISR Board of Governors
4
STRUCTURE OF GOVERNANCE
5
ROLE OF THE BOARD
Ensuring clarity of vision, ethos and strategic direction. Overseeing the financial performance of the school and making sure resources are effectively deployed. Holding the Executive Leadership Team to account for the educational performance of the school and its students, and the performance of staff. Welcoming new Leadership Appointing our new Chief Executive Officer - Nicholas Prince
6
OVERVIEW OF 25/26 Inter-campus Maths Challenge
Inter-schools Battle of the Books
Maths Olympiad
7
OVERVIEW OF 25/26 Primary Inter-schools Swimming Gala
Primary Inter-schools Football Tournament
Swimming and PE Fun Day
8
OVERVIEW OF 25/26 ACTIVITIES & PARTICIPATION TRENDS Al Hamra, DQ, and Al Waha campuses collectively demonstrate strong and consistent engagement, maintaining an average activities programme participation rate of nearly 80%. Together, these campuses offer an average of 159 weekly ECAs, of which an average of 62 are highly active. This robust offering drives a solid average active club participation rate of over 58% across the three schools. A shared strategic focus remains on the approximately 19% of students who are currently uninvolved, highlighting a unified opportunity for targeted engagement initiatives.
School
Avg. Activities Programme Participation
Avg. Active Club Participation
Avg. SEND Student Participation
Avg. Active ECAs
Al Waha
80.7%
54.9%
71.9%
86
Al Hamra
80.3%
65.5%
72.3%
38
DQ
77%
54.7%
68.3%
61
BAE campuses (Sharq, Saqr, Tabuk, and Taif) collectively demonstrate exceptional student engagement, maintaining an outstanding average activities programme participation rate of nearly 98%. Together, these campuses offer a highly focused average of about 8 weekly ECAs, of which an average of 3.5 are active. This targeted approach drives a remarkable average active club participation rate of over 85% across the four schools. Non-involvement is exceptionally low, averaging just 2.5%, highlighting a highly efficient model where nearly every student is successfully integrated into the extracurricular programmes.
School
Avg. Activities Programme Participation
Avg. Active Club Participation
Avg. SEND Student Participation
Avg. Active ECAs
Al Sharq
92%
70.3%
N/A
2
Al Saqr
98.2%
71.5
N/A
3
Tabuk
100%
100%
100%
3
Taif
100%
100%
N/A
6
9
OVERVIEW OF 25/26 Senior Sports
U14 SAIKAC Girls Football
U15 BSME Games, Cairo
10
OVERVIEW OF 25/26 WINS: COMPETITIVE SPORT School
Total Participations
Events Involved
Hosted Events
Championships / Top 3
Al Waha
2643
78
26
6 Champions / 15 Total
Al Hamra
932
70
13
3 Champions / 6 Total
DQ
735
53
21
3 Champions / 4 Total
Total
4310
201
60
12 Champions / 25 Total
NOTABLE ACHIEVEMENTS: AL WAHA CAMPUS Sports Represented: Netball, Volleyball, Football, Basketball, Swimming (Tigersharks), Athletics, Badminton.
1ST
15
PODIUM PLACEMENTS
6
2ND
CHAMPIONS
BSME U15 Winner SSA Netball (U14, U16, U19) SSA U14 Boys Volleyball SAIKAC U19 Boys Football
7
3RD
SAIKAC Netball (U14, U16, U19) SSA Netball U11 SSA U14 Boys Volleyball SAIKAC U16 Boys Football SSA U16 Girls Basketball
SAIKAC U16 Boys Volleyball SAIKAC U14 Girls Football
NOTABLE ACHIEVEMENTS: AL HAMRA CAMPUS Sports Represented: Football, Dodgeball, Basketball, Netball, Athletics, Benchball.
1ST
6
PODIUM PLACEMENTS
3
3RD
CHAMPIONS
SSA U14 Boys Football SSA U9 Dodgeball SSA U11 Girls Football
3
BSME Basketball SSA U9 Dodgeball SAIKAC U14 Girls Basketball
NOTABLE ACHIEVEMENTS: DQ CAMPUS Sports Represented: Volleyball, Football, Basketball, Netball, Badminton, Swimming, Athletics.
4
PODIUM PLACEMENTS & UNDEFEATED SEASONS
1ST
3
3RD
CHAMPIONS / UNDEATEN
SSA U14 Boys Football Champions U14 Girls Volleyball (Unbeaten in RISAC) U11 Boys Football (Unbeaten in RISAC)
11
2
3
BSME Basketball SSA U9 Dodgeball SAIKAC U14 Girls Basketball
OVERVIEW OF 25/26 Celebrating Successes LEARNING (ACADEMIC EXCELLENCE & INNOVATION) Premier Regional Teaching Standards: Jo Newman (BISR Al Waha) named Middle East & North Africa Regional Winner in the 2026 Cambridge Dedicated Teacher Awards.
Global AI Recognition: A BISR Tabuk educator was named among Toddle’s Best AI Tutors of 2026 from thousands of international entries. National STEM & Problem-Solving Success: 4 students reached the prestigious KAUST Mathematics Competition finals (out of 8,500 nationwide participants). Examination & Institutional Distinction: Honoured for 20 Years of Partnership with Cambridge International Education, alongside top global exam board accolades (Pearson, OxfordAQA, Cambridge).
ENRICHMENT (GLOBAL REPRESENTATION & PARTNERSHIPS) World Champion Esports Title: BISR DQ students crowned U13 Minecraft World Champions at the World Student Esports Championships in Malta.
Historic Diplomatic Engagement: A Level Politics students completed a rare, official visit to Saudi Arabia’s Shura Council. Regional Games Triumph: Historic debut victory at the BSME U15 Games in Cairo. STEAM Collaborations: Successfully delivered the STEAM Festival of Speed at BISR Al Waha in conjunction with BAE Systems.
WELL-BEING (AQUATICS SPOTLIGHT, INCLUSION & COMMUNITY) National Swimming Dominance: Tigersharks secured 50 Medals, 4 Broken Records, and a Top-6 Finish at the AFSA National Championship.
Systemic EAL Support: Signed strategic partnership with Heddle to expand specialised support for multilingual and EAL learners. Kingdom-Wide Early Years Leadership: Staff from all campuses attended an EYFS bestpractice conference at Downe House, led by Dr. Alistair Bryce-Clegg MBE. Market-Leading Reputation: Ranked among the Most Popular International Schools in Riyadh by the International Schools Database.
12
OVERVIEW OF 25/26 BRAND RECOGNITION Top Choice for Riyadh Families
20 Years of partnership with Cambridge International Education
Duke of Edinburgh Gold awards at the Embassy
Hosting Delegates from Education Investment Saudi at DQ
Learning in Motion Conference (TEEMS)
Saudi International Schools Conference - Technology
13
OVERVIEW OF 25/26 COMMUNITY ENGAGEMENT The Parent Teacher Association supported many community events by offering help in a number of ways, generously giving their time and energy. Community Iftars Bake Sales Festive Grotto Learn & Connect Workshops Mumpreneur Events Second Hand Uniform Sales
14
BRIEFING ON SCHOOL FINANCES
BRIEFING ON SCHOOL FINANCES
Atif Mirza Deputy Chair
Our financial foundation remains robust, anchored by a sustainable, forward looking view. The priority are resources in Teaching & Learning. The fees are being managed with accountability and fiscal prudence. We are funding future growth in a carefully measured approach. Achieved a major milestone with the opening of Al Waha Campus.
16
FINANCIAL STABILITY AND SUSTAINABILITY OF THE SCHOOL 2025/2026 (F)
2024/2025
VARIANCE
INCOME (SAR IN MILLIONS) Total Pupils
3,098
2,695
15%
Tuition Fees
215.69
181.46
19%
Cap Dev / Admissions Fees & Others
25.37
23.15
10%
Total Income
241.06
204.61
18%
2025/2026 (F)
2024/2025
VARIANCE
EXPENDITURES (SAR IN MILLIONS) Staff Costs
166.78
153.27
9%
Rent, Repairs & Other overheads
70.27
53.58
31%
Total Expenditure
237.05
206.85
15%
EBITDA
4.01
(2.24)
279%
Depreciation
13.88
9.18
51%
Surplus/(Deficit) from Operations
(9.87)
(11.42)
(14%)
Note: EBITDA means Earnings before Interest, Tax, Depreciation, and Amortization
Students numbers at Al Waha are 1718, Al Hamra are 521, and DQ are 859. Due to higher student numbers, revenue increased to 241m and staffing costs increased, and higher rent due to the opening of Al Waha campus in 2025-2026 academic year. The finances continue to be operated in sustainable way as BISR remains cash positive. Clean external audit report for 24/25. 17
TUITION FEES ACADEMIC YEAR
BISR AVERAGE FEE INCREASE
CALENDAR YEAR
KSA CPI
20/21
0.0%
2020
3.4%
21/22
0.0%
2021
3.1%
22/23
1.2%
2022
2.5%
23/24
1.9%
2023
2.3%
24/25
0.0%
2024
2.0%
25/26
3.5%
2025
2.1%
26/27
3.0%
2026
1.8%
Average
1.4%
2.5%
Average fee increase over the last 7 years is 1.4%. Corresponding CPI average increase is 2.5%. (Trading Economics) GCC Schools
KSA Schools
MINIMUM
MAXIMUM
BISR
BISR fee increase is comparable across KSA, GCC. BISR recognises value for money. All funds are reinvested in the schools. 18
THE SCHOOL’S FINANCES ARE STABLE, AND TAKE A LONG-TERM VIEW We remain financially stable, with appropriate operational cashflow and a strategy that balances current needs with long-term sustainability. Ensuring the academic and mental well-being of students. Balancing tuition fees as per market and accessing the needs of the school. Building reserves to invest in capital projects and major renovations to ensure future substainabily. Continuing to build partnerships with external companies. Operating of BAE campuses.
19
INVESTMENT IN TEACHING & LEARNING REMAINS THE PRIORITY Budget Expenditure 3%
5%
22.7% 69.3%
The majority of our budget continues to go toward hiring and retaining exceptional teachers, enhancing curriculum delivery, and supporting student development. In 26/27, BISR will invest in hiring quality teachers for Al Waha, Al Hamra and Diplomatic Quarter campuses in line with increased student numbers - 3238 students (26/27) versus 3098 students (25/26). Significant investment in AI Framework, Ed Tech, IT licenses and educational (about SAR 8.33m) as part of BISR Digital Strategy - directly aimed at improving student well-being and improving teacher time management efficacy for greater focus on student enrichment. A dedicated Digital Tech Committee created in 2025 supervises and monitors progress and spend. CPD and professional development for BISR teachers @ SAR 775k are important aspects of learning and positively impact student enrichment. BISR is committed to providing the best facilities for its students. 20
SUMMARY OF ACADEMIC PERFORMANCE
21
EPC SUMMARY OF THE YEAR The EPC and school have worked together to: Align academic offerings across campuses: Standardised KS4 exam boards and the number of GCSEs offered to ensure a consistent student experience. Expand post-16 pathways: Successfully developed and extended the new BTEC curriculum into Year 13 to grow upper-school options. Establish consistent setting processes: Agreed upon standardised setting structures across all core subjects to ensure fairness and clarity. Prioritise balanced study habits: Developed a hybrid Primary home learning programme to balance technology and traditional written work. Protect instructional time: Ensure that non-curricular school trips take place during school holidays to maximise classroom learning. Achieve excellent results.
22
EXAM RESULTS 25/26 A LEVEL: ACADEMIC PROGRESS & EXCELLENCE
+0.65
42.8% of students Achieved A*-A grades, consistently exceeding UK benchmarks.
Average value-added progress above student targets
UK National Average
BISR Average
15 Students earned straight A*/A grades across 3 or 4 subjects. 86% of Students secured their first choice of university, with 4% achieving better-thanexpected results and were able to upgrade via Clearing.
A*-A
A*-B
A*-C
BTEC: VOCATIONAL DISTINCTION
100%
100%
91.6%
90%
Pass Rate
Sport students achieved Distinction or Distinction*
Distinction/Distinction*
Business students achieved DD or above
100%
Exceptional performance with 100% of Business students entering with 23 GCSE points or fewer achieved DD or above.
Overcoming Entry Benchmarks: Despite 82% of the cohort entering below the traditional A Level 33-point benchmark (average entry score: 27 pts), students delivered top-tier outcomes. Programme Growth: Inaugural cohort of 11 students successfully completed 14 qualifications across Business and Sport with outstanding attainment.
23
EXAM RESULTS 25/26 INTERNATIONAL BACCALAUREATE: GLOBAL SUCCESS Average IB Score
35
+ 2 points year on year
Diploma Pass Rate
96%
+7% from 2025
Top Individual Score
43
+5 points year on year
43 points – Top individual IB score at BISR, 5 point improvement from 2025.
100% Offer Rate for all UK Russell Group university applicants. 1 student secured maximum core points, a feat achieved by only 12% of candidates worldwide.
4
students achieved 40+ points placing them in the top 10% globally.
GCSE ACHIEVEMENTS Grade 9-4 (Pass)
Grade 9-7 (A*-A equivalent)
91.5%
47.5%
8
Top achievers earn all 8s and 9s including 3 perfect grade 9 sweeps.
+0.95
Average value-added progress across all subject entries. Top drivers include Economics, Computer Science, English Literature, Geography and Drama.
*RESULTS AS OF 30 SEPTEMBER 2026
24
ATTAINMENT PRIMARY – FS AND KEY STAGE 1 71
Foundation Stage GLD (Teacher Assessment) 80
60
71
68
40
20
0
BISR GLD
England (22/23)GLD
BISR GLD
ENGLAND (24/25) GLD
Key Stage 1 (Attainment Teacher Assessment) 80
60
40
20
0
%WTS
%EXS
%GDS
%WTS
YEAR 1 ENGLISH (TEACHER ASSESSMENT READING)
%EXS
%GDS
YEAR 1 MATHS (TEACHER ASSESSMENT)
WTS = WORKING TOWARDS THE EXPECTED STANDARD EXS = WORKING AT THE EXPECTED STANDARD GDS = WORKING AT GREATER DEPTH WITHIN THE EXPECTED STANDARD
25
ATTAINMENT PRIMARY – KEY STAGE 2 GL PROGRESS TEST English
Maths
20
20
10
10
0
0 % W T % S EX % S GD S
30
% W T % S EX % S GD S
30
% W T % S EX % S GD S
40
% W T % S EX % S GD S
40
% W T % S EX % S GD S
50
% W T % S EX % S GD S
50
% W T % S EX % S GD S
60
% W T % S EX % S GD S
60
% W T % S EX % S GD S
70
% W T % S EX % S GD S
70
YEAR 2 ENGLISH
YEAR 3 ENGLISH
YEAR 4 ENGLISH
YEAR 5 ENGLISH
YEAR 6 ENGLISH
YEAR 2 MATHS
YEAR 3 MATHS
YEAR 4 MATHS
YEAR 5 MATHS
YEAR 6 MATHS
Science 70 60 50 40 30 20 10
YEAR 3 SCIENCE
YEAR 4 SCIENCE
YEAR 5 SCIENCE
TS % EX S % GD S
% W
TS % EX S % GD S
% W
TS % EX S % GD S
% W
% W
TS
% EX S % GD S
0
YEAR 6 SCIENCE
WTS = WORKING TOWARDS THE EXPECTED STANDARD
PROGRESS TEST STANDARDISATION AVERAGE DISTRIBUTION
EXS = WORKING AT THE EXPECTED STANDARD
WTS 23% EXS 54% GDS 23%
GDS = WORKING AT GREATER DEPTH WITHIN THE EXPECTED STANDARD
26
ATTAINMENT SENIOR – KEY STAGE 3 GL PROGRESS TEST English
Maths 70
60
60
50
50
40
40 30
30 20
20
10
10
0
YEAR 7 ENGLISH
YEAR 8 ENGLISH
YEAR 8 MATHS
Science 80
60
40
20
0
%WTS %EXS %GDS
%WTS %EXS %GDS
YEAR 8 SCIENCE
YEAR 9 SCIENCE
WTS = WORKING TOWARDS THE EXPECTED STANDARD
PROGRESS TEST STANDARDISATION AVERAGE DISTRIBUTION
EXS = WORKING AT THE EXPECTED STANDARD
WTS 23% EXS 54% GDS 23%
GDS = WORKING AT GREATER DEPTH WITHIN THE EXPECTED STANDARD
27
% EX S % GD S
TS % W
TS
YEAR 7 MATHS
% EX S % GD S
% W
TS
% EX S % GD S
% W
TS % W
YEAR 8 ENGLISH
% EX S % GD S
% EX S % GD S
TS % W
TS % W
% EX S % GD S
0
YEAR 9 MATHS
IGCSE RESULTS AL WAHA
9
8/9
7-9
4-9
2026
15%
29%
48%
90%
2025
10%
24%
42%
90%
2024
13%
31%
50%
90%
2023
15%
32%
50%
93%
DQ
9
8/9
7-9
4-9
2026
13%
26%
47%
94%
2025
6%
18%
38%
93%
2024
9%
18%
36%
91%
*RESULTS AS OF 30 SEPTEMBER 2026
A LEVEL RESULTS A*
A*/A
A*/B
A*/C
2026
13%
43%
69%
88%
2025
13%
39%
66%
86%
2024
10%
41%
74%
92%
2023
10%
34%
57%
84%
28
IB RESULTS 7
7/6
7/4
7/3
2026
15%
48%
97%
99%
2025
6%
35%
94%
100%
2024
1%
13%
84%
97%
2023/24
2024/2025
2025/26
Average Passing Points
30
32
35
Diploma Pass Rate
92%
89%
96%
Number of Diploma Students
13
9
24
Highest IB Point Score
34
38
43
IB Headlines
BTEC RESULTS 2026
D*
D*/D
D*/M
D*/P
46%
92%
100%
100%
29
CLASS OF 2026 UNIVERSITY DESTINATIONS AUSTRALIA
KSA
UNITED KINGDOM
Melbourne University
Aston University
RCSI Bahrain
Al Faisal University Dar Al Uloom University Prince Sultan University Princess Nourah University
BULGARIA
LEBANON
University of Plovdiv
American University of Beirut
CANADA
MALTA
Newcastle University
Carlton University OCAD University Simon Fraser University University of British Columbia University of Toronto University of Waterloo Western University York University
QMUL Malta
Queen's University Belfast
BAHRAIN
CHINA
NETHERLANDS University of Amsterdam
SPAIN
Manchester Metropolitan University
SOAS University of London University College London (UCL) University of Birmingham University of Exeter
IE University The European University of Valencia University of UCAM
University of Leeds University of Liverpool University of Manchester University of Sheffield
EGYPT American University Cairo
UAE
FRANCE
University of Wollongong in Dubai
Paris Sciences et Lettres
USA
INDIA
Douglas College George Mason University Indiana University, Kelley School of Business, Finance Joyce University University of California, Davis, Computer Engineering
KOREA
London School of Economics
University of Brighton
National Yangming Chiaotung University
Dublin City University
Imperial College London
Queen Mary University
TAIWAN
IRELAND
City St George's, University of London Kings College London
University of Nottingham, China
Jindal Global University
Cardiff University
University of Southampton University of St Andrews University of Warwick University of Westminster University of York Warwick University Winchester University
Yonsi University
30
York University
BISR CAMPUSES
TABUK Tabuk (BAE)
AL MAJMA'AH Al Saqr (BAE) RIYADH Al Hamra Al Waha Diplomatic Quarter Al Sharq (BAE)
TAIF Taif (BAE)
31
OUR PARTNERS
32
SAFEGUARDING REVIEW
SAFEGUARDING REVIEW OUR COMMITMENT
At BISR, Safeguarding remains a central priority. British International School Riyadh remains unwavering in its commitment to providing a safe, secure, and supportive environment where the welfare of every student is our Dr Shaden Qasrawi Lead–Safeguarding Governor
absolute priority.
Our safeguarding framework operates on the absolute principle that safeguarding is everyone’s responsibility and requires rigorous vigilance at every level of leadership, governance, and daily operations.
OUR SAFEGUARDING PARTNERS
Andrew Hall
34
SAFEGUARDING REVIEW ATTENDANCE SUPPORT PATHWAYS AND OUTCOMES Attendance is rigorously monitored and tracked, with parents receiving regular data updates.
Structured Attendance Support Pathway implemented to identify and support students early.
Clear escalation stages from monitoring
→ pastoral intervention →
targeted support plans.
Strengthened attendance messaging system ensuring consistent parent communication and early alerts.
Impact of the new Pathway Earlier identification of attendance concerns More consistent pastoral intervention across year groups Improved engagement for students previously at risk of persistent absence
35
SAFEGUARDING REVIEW ATTENDANCE THIS YEAR YTD Attendance Figures for Each Campus
Al Hamra
Al Waha
DQ
93.11%
92.01%
91.7%
BAE schools
87.06%
ATTENDANCE TRENDS Attendance Data (3 Years)
90.7%
0%
88.8%
91.7%
91.8%
91.5%
89.2%
91.7%
93.11%
92.01%
87.06%
80
87.5%
100
DQ
HA
WA
BAEs
DQ
HA
WA
BAEs
DQ
HA
WA
BAEs
60
40
20
0
2023-2024
2024-2025 DQ
HA
WA
36
2025-2026 BAEs
SAFEGUARDING REVIEW INDEPENDENT SAFEGUARDING ASSURANCE AND GOVERNANCE External Assurance & Oversight Termly Designated Safeguarding Governor (DSG) monitoring visits Site inspections and safeguarding walkabouts conducted each term Regular review of the Single Central Record (SCR) for compliance assurance Governance Structure Termly safeguarding reports submitted to DSG and Deputy Safeguarding Govenor Safeguarding Committee meetings provide oversight, challenge, and review of trends Continuous monitoring of safeguarding effectiveness and action planning
POLICY AND COMPLIANCE UPDATES Continuous policy review aligned to: Keeping Children Safe in Education (KCSIE) Saudi regulatory requirements International safeguarding best practice Policy Development This Year Introduction and updates include: Positive Handling Policy Safeguarding & Child Protection updates Behaviour and pastoral guidance revisions Online safety and digital safeguarding updates Recruitment & safer recruitment policies (updated processes)
37
FAMILY POLICIES
SAFEGUARDING REVIEW STRATEGIC DEVELOPMENT PLAN (PSHE) Group-Wide PSHE Framework Aligned PSHE (Personal, Social and Health Education) platform to be implemented across the group from 2026/27 to ensure a consistent curriculum across all schools Key Benefits Consistency in wellbeing and personal development education Stronger safeguarding-linked curriculum provision Improved continuity for students moving between schools
SAFEGUARDING TRAINING & PROFESSIONAL DEVELOPMENT Building Staff Capacity Interactive face-to-face safeguarding workshops and scenario-based training National College safeguarding modules completed annually Recorded safeguarding briefings shared for reinforcement External training partnerships including The Safeguarding Alliance and COBIS The roll out of a unified, de-escalation-first framework (Team Teach) enhancing how we navigate challenging behaviours by prioritising positive behavioural support, communication, and the absolute safety of our school community.
38
SAFEGUARDING REVIEW STRENGTHENING SAFEGUARDING CULTURE Early Identification & Collaboration Staff low-level concerns platform enables early reporting and pattern identification Thematic analysis of concerns (e.g. MyConcern) identifies trends and hotspots Stronger collaboration between Safeguarding and Counselling teams Impact Earlier identification of safeguarding concerns More coordinated student support Improved understanding of emerging needs Stronger preventative safeguarding approach
SAFEGUARDING & PASTORAL IMPACT SUMMARY Stronger Safeguarding Culture Early reporting and increased staff confidence in escalation Earlier Identification of Need Data analysis + counselling collaboration enabling faster intervention Improved Attendance Outcomes Stronger monitoring and intervention pathway improving engagement Stronger Staff Capability Blended training improving confidence and consistency Robust Governance & Assurance Termly governor oversight, SCR checks, structured reporting Continuous Improvement Audit actions completed, and systems strengthened across safeguarding 39