MARKET INTELLIGENCE BRIEF
Global Outlook 2026–2035
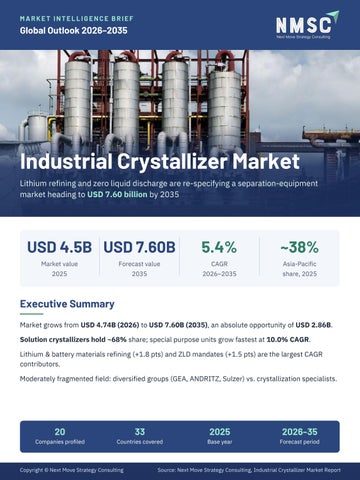
Industrial Crystallizer Market Lithium refining and zero liquid discharge are re-specifying a separation-equipment market heading to USD 7.60 billion by 2035
USD 4.5B USD 7.60B
5.4%
~38%
Market value
Forecast value
CAGR
Asia-Pacific
2025
2035
2026–2035
share, 2025
Executive Summary Market grows from USD 4.74B (2026) to USD 7.60B (2035), an absolute opportunity of USD 2.86B. Solution crystallizers hold ~68% share; special purpose units grow fastest at 10.0% CAGR. Lithium & battery materials refining (+1.8 pts) and ZLD mandates (+1.5 pts) are the largest CAGR contributors. Moderately fragmented field: diversified groups (GEA, ANDRITZ, Sulzer) vs. crystallization specialists.
20
33
2025
2026–35
Companies profiled
Countries covered
Base year
Forecast period
Copyright © Next Move Strategy Consulting
Source: Next Move Strategy Consulting, Industrial Crystallizer Market Report
02 | MARKET LANDSCAPE
Market Size, Growth & Ecosystem
A USD 4.5B equipment market adding USD 2.86B of new value by 2035 Market Size (USD Billion)
Share by Equipment, 2025
CAGR 5.4% · 2026–2035
Total USD 4.5 billion
7.60 4.50
Solution USD 3.06B Melt
4.74
68%
USD 0.54B Polymer USD 0.40B
Solution
Special purpose USD 0.32B Other · USD 0.18B
2025
2026
2035
Asia-Pacific leads with ~38% share (USD 1.71B); the U.S. is the largest single country at ~USD 752M in 2025. Chemical processing is the largest end use at ~32% (USD 1.44B), spanning basic, specialty and fine chemicals. Buyers increasingly specify continuous, titanium and duplex stainless systems, favouring vendors with proven high-purity expertise.
Industry Ecosystem & Value Chain Raw Materials
Fabrication
Project Delivery
Distribution
Aftermarket
Stainless, duplex,
Vessels,
OEMs, EPC
Direct sales,
Install, retrofit,
titanium, nickel alloys
automation
contractors
agents
spares, service
components
LEADING SUB-SEGMENTS BY 2025 SHARE
~54%
~52%
~48%
~42%
Direct OEM sales channel
Continuous operating
New equipment offer
Stainless steel
mode
Copyright © Next Move Strategy Consulting
construction
Source: Next Move Strategy Consulting
03 | GROWTH DRIVERS & OPPORTUNITIES
Demand Drivers & High-Growth Segments
Battery materials and zero liquid discharge add 3.3 points to market CAGR Growth Catalyst & Risk Matrix — Impact on CAGR (% pts) Lithium & battery materials refining
+1.8
Zero liquid discharge mandates
+1.5
Specialty & fine chemical production
+1.2
Pharma capacity in emerging markets
+1.0
Continuous processing adoption
+0.8
Fertilizer capacity / food security
+0.7
High capital cost of premium systems
−1.1
Long lead times for custom plants
−0.8
Volatile chemical/fertilizer cycles
−0.5
Fastest-Growing Segments (CAGR 2026–35)
10.2%
10.0%
Metals & mining end use
Special purpose crystallizers
9.2%
7.2%
Titanium construction
Services offer
7.0%
6.1%
Semi-continuous mode
Water & wastewater end use
Lithium: DTB & forced-circulation designs for brine/spodumene earn premium pricing. ZLD retrofits: modular evaporative systems for existing plants.
Titanium & duplex vessels are increasingly specified for corrosive lithium brine streams.
USD 2.86B Absolute dollar opportunity, 2026–2035
Batch-to-continuous conversion for specialty chemical lines. Copyright © Next Move Strategy Consulting
Source: Next Move Strategy Consulting
03 | GROWTH DRIVERS & OPPORTUNITIES
Regional Growth Opportunity Map
Asia-Pacific holds scale; Latin America and India set the pace 2025 Revenue (USD B) & CAGR 2026–2035
Bubble size ∝ 2025 revenue
Europe · 4.8%
1.17 0.99
1.71
North America · 4.5%
0.36
Asia-Pacific · 5.9% · ~38%
MEA · 5.6%
0.27 Latin America · 7.2% (fastest)
Key Country Markets Country
Where to Play 2025
2035
CAGR
U.S.
$752M
$1.14B
4.2%
China
$616M
$1.08B
5.8%
Germany
$351M
$582M
5.2%
India
$274M
$615M
8.8%
Brazil
$119M
$231M
6.8%
Saudi Arabia
$101M
$182M
6.2%
Copyright © Next Move Strategy Consulting
India — fastest country (8.8%): chemicals, fertilizer, pharma plus ZLD compliance. Latin America — lithium refining & mining; revenue doubles to USD 0.54B. Europe — battery supply chains favour titanium & continuous systems.
GCC — petrochemical & fertilizer projects (Saudi 6.2%).
Source: Next Move Strategy Consulting
04 | COMPETITIVE SCENARIO
Leading Companies & Market Positioning
A moderately fragmented field won on engineering depth and testing Competitive Positioning Matrix Global Specialists
Diversified Leaders GEA Group
Swenson Technology
ANDRITZ
BMA
Sulzer
EBNER
Geographic reach →
Hosokawa Micron
Veolia Water Tech. Alfa Laval
Piovan
SPX FLOW Fives
Bepex International Tsukishima Kikai
Rosenblad Design
Katsuragi Industry
Chem Process Systems
Technoforce Solutions
Hebei Leheng Shijiazhuang Dingwei
Regional / Niche Players
Regional Broad-Line
Focused crystallization portfolio
End-market & portfolio breadth →
Diversified process portfolio
Qualitative placement of the 20 NMSC-profiled companies by archetype; not a market-share ranking.
Key Competitive Strategies Partnerships
Capability Expansion
Application Innovation
Mar 2025: GEA partnered with Rock
GEA test centers in France & Germany
Specialists (Swenson, Bepex, BMA)
Tech Lithium to supply crystallization
run batch, continuous and mini-plant
win on application-specific designs;
& ZLD systems for the Guben lithium
trials; Sulzer keeps investing in
Asian vendors localize offerings for
hydroxide converter, Germany.
separation engineering.
India and China.
Investor lens: vendors lacking credible lithium / battery-materials crystallization risk exclusion from RFP shortlists. Innovation focus: high-purity lithium crystallization, batch-to-continuous conversion and ZLD evaporative systems.
Copyright © Next Move Strategy Consulting
Source: Next Move Strategy Consulting
Thank You Connect with our analysts for in-depth insights, custom segmentation and strategic guidance on the Industrial Crystallizer Market.
Click here for the complete report
→
nextmsc.com/report/industrial-crystallizer-market-cm5215
Contact Us
Official Website
Contact Number
www.nextmsc.com
+1 857 758 5017
info@nextmsc.com
20
33
Top 10
2025–35
Company profiles
Country markets
Company shares
Analysis period
Follow Us
Copyright © Next Move Strategy Consulting
YouTube
Twitter / X
www.nextmsc.com