Global Market Outlook · 2026 –2035
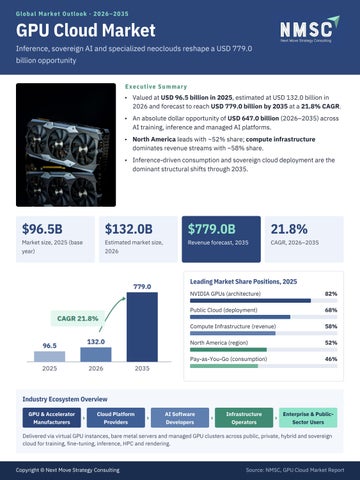
GPU Cloud Market Inference, sovereign AI and specialized neoclouds reshape a USD 779.0 billion opportunity Executive Summary
• Valued at USD 96.5 billion in 2025, estimated at USD 132.0 billion in 2026 and forecast to reach USD 779.0 billion by 2035 at a 21.8% CAGR. • An absolute dollar opportunity of USD 647.0 billion (2026–2035) across AI training, inference and managed AI platforms. • North America leads with ~52% share; compute infrastructure dominates revenue streams with ~58% share. • Inference-driven consumption and sovereign cloud deployment are the dominant structural shifts through 2035.
$96.5B
$132.0B
$779.0B
21.8%
Market size, 2025 (base
Estimated market size,
Revenue forecast, 2035
CAGR, 2026–2035
year)
2026
Leading Market Share Positions, 2025 NVIDIA GPUs (architecture)
82%
Public Cloud (deployment)
68%
Compute Infrastructure (revenue)
58%
North America (region)
52%
Pay-as-You-Go (consumption)
46%
Industry Ecosystem Overview GPU & Accelerator Manufacturers
›
Cloud Platform Providers
›
AI Software Developers
›
Infrastructure Operators
›
Enterprise & PublicSector Users
Delivered via virtual GPU instances, bare metal servers and managed GPU clusters across public, private, hybrid and sovereign cloud for training, fine-tuning, inference, HPC and rendering.
Copyright © Next Move Strategy Consulting
Source: NMSC, GPU Cloud Market Report
02 · Growth Drivers & Opportunities
Hyperscale Capex and Production Inference Power the Next Decade Growth Catalyst & Risk Matrix (+/−) % impact on CAGR, 2026–2035
Hyperscale AI capex
+4.8%
GenAI inference volumes
+3.6%
Custom AI accelerators
+2.4%
Sovereign AI programs
+2.1%
Cloud migration of AI
+1.7%
Managed AI platforms
+1.5%
Power & grid limits
−2.2%
GPU/memory inflation
−1.6%
Buyer concentration
−0.9%
Sovereignty/export costs
−0.7%
27.3% CAGR Dedicated Capacity — enterprises shift to reserved commitments to secure GPU supply amid power constraints.
Key Demand Drivers • Hyperscale capex is the primary driver: Amazon plans USD 200B and Microsoft ~USD 190B of 2026 capex, mainly AI infrastructure. • Enterprise AI monetization: AWS AI run rate exceeded USD 15B and Microsoft AI USD 37B in Q1 2026. • Custom silicon and sovereign AI programs diversify supply and open new national demand pools. • Key brakes: power/grid interconnection delays and GPU and memory price inflation.
High-Growth Segments — Fastest Sub-Segment by Axis (CAGR 2026–2035)
30.1%
29.5%
29.4%
28.4%
Startups
Proprietary AI Accelerators
Sovereign Cloud
Cloud Marketplace
Deployment model
Sales channel
Organization size
GPU architecture
27.3%
27.1%
26.6%
25.9%
Dedicated Capacity
Healthcare & Life Sciences
AI Inference
Managed AI Platform
Workload type
Revenue stream
Consumption model
End-user industry
Copyright © Next Move Strategy Consulting
Source: NMSC, GPU Cloud Market Report
0 3 · R e g i o n a l O p p o r t u n i t ie s
Emerging Regions Outpace a North America-Led Market Growth Opportunity Map — Regions
Bubble size = 2035 market value (USD B)
Country Outlook (USD Billion) Country
29.3%
2025
2035
CAGR
Saudi Arabia
1.4
17.5
29.3%
India
4.6
52.0
28.5%
China
7.8
68.0
25.3%
USD 39.5B
Japan
3.9
27.0
22.5%
U.S. — dominant country market, 2025
Germany
4.3
27.5
21.0%
France
3.1
19.5
20.8%
UK
5.2
32.0
20.6%
Canada
7.5
46.0
20.5%
U.S.
39.5
205.0
18.9%
Saudi Arabia — fastest-growing country globally
28.5% India — fastest pace in Asia-Pacific
Regional Opportunity Insights • North America (~52% share) anchors scale through hyperscale capex and early enterprise AI adoption.
• Middle East & Africa posts the highest CAGR (27.2%), driven by Vision 2030-linked sovereign AI investment. • Asia-Pacific adds ~USD 222B by 2035 as national AI programs in China, India and Japan expand capacity. • Europe demand is shaped by EU data-sovereignty rules, favoring in-region, compliance-ready GPU capacity.
Copyright © Next Move Strategy Consulting
Source: NMSC, GPU Cloud Market Report
0 4 · C o m p e t it i v e S c e n a r i o
Contracted Capacity Is the New Competitive Currency USD 66.8B
Competitive Positioning Matrix Specialized Neoclouds
Convergence Zone
CoreWeave revenue backlog, end-2025
CoreWeave · Nebius · Lambda · Crusoe · Fluidstack · RunPod
Hyperscalers add custom silicon & managed AI; neoclouds scale contracted backlog
(4x+ starting level)
AI workload specialization →
Faster GPU deployment, close chipsupplier ties
USD 550B+ Combined 2026 capex plans — Amazon, Microsoft, Alphabet
Regional / Sovereign & Developer Clouds
Diversified Hyperscalers
OVH · Scaleway · Hetzner · Vultr · DigitalOcean
AWS · Microsoft · Alphabet · Oracle · IBM · Alibaba · Tencent · Huawei · Baidu
Compliance-sensitive, local data
Integrated software ecosystems,
residency
global footprint
82% NVIDIA share of GPU architecture (USD 79.0B, 2025)
Moderately Concentrated Breadth of cloud stack & global footprint → Qualitative positioning based on NMSC competitive archetypes
20 companies profiled; share data for top 10
Key Strategic Moves — Expansion, Partnerships, M&A M&A · May 2025
Investment · Jan 2026
Partnership · Mar 2026
CoreWeave closed ~USD 1.0B
NVIDIA USD 2.0B private placement
AWS–NVIDIA: 1M+ Blackwell & Rubin
acquisition of Weights & Biases
investment in CoreWeave
GPUs across AWS Regions
Expansion · Mar 2026
Expansion · Apr 2026
Product · Apr 2026
Microsoft Azure to deploy NVIDIA Vera
Google Cloud adds RTX PRO 6000
Vultr launches NVIDIA Nemotron Nano
Rubin NVL72 systems
Blackwell GPUs on Cloud Run
3 Omni on its GPU Cloud
Strategic Implications • Capacity is the moat: players compete on capacity availability, backlog-to-revenue conversion and priceperformance. • Neoclouds gain share as enterprises diversify across hyperscalers and AI-specialist providers to avoid deployment delays. • Vertical integration via M&A extends GPU providers into MLOps and managed AI platforms. • Multi-region diversification is favored over single-region specialists through 2035.
Copyright © Next Move Strategy Consulting
Source: NMSC, GPU Cloud Market Report
05 · Thank You & Contact
Thank You — Let's Shape Your Next Move in GPU Cloud Connect for in-depth insights and strategic guidance Our analysts support investors, strategy teams and B2B decisionmakers with segment-level sizing, country forecasts and competitor benchmarking for the GPU cloud market.
Click here for the complete report
Contact Us Official Website
www.nextmsc.com Contact Number
+1 857 758 5017 Email
info@nextmsc.com
Follow Us
YouTube
Twitter (X)
What the Full Report Delivers
20
33
2025–35
Top 10
Companies profiled
Countries covered
Analysis period
Company market shares
Segmentation coverage: revenue stream · deployment model · consumption model · GPU architecture · workload type · organization size · sales channel · end-user industry · region and country
Copyright © Next Move Strategy Consulting
Source: NMSC, GPU Cloud Market Report