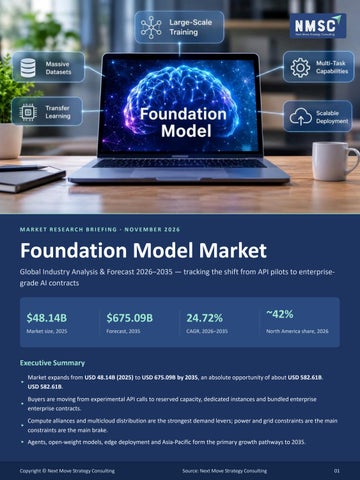
MARKET RESEARCH BRIEFING · NOVEMBER 2026
Foundation Model Market Global Industry Analysis & Forecast 2026–2035 — tracking the shift from API pilots to enterprisegrade AI contracts
$48.14B
$675.09B
24.72%
Market size, 2025
Forecast, 2035
CAGR, 2026–2035
~42% North America share, 2026
Executive Summary ▸
Market expands from USD 48.14B (2025) to USD 675.09B by 2035, an absolute opportunity of about USD 582.61B. USD 582.61B.
▸
Buyers are moving from experimental API calls to reserved capacity, dedicated instances and bundled enterprise enterprise contracts.
▸
Compute alliances and multicloud distribution are the strongest demand levers; power and grid constraints are the main constraints are the main brake.
▸ Agents, open-weight models, edge deployment and Asia-Pacific form the primary growth pathways to 2035.
Copyright © Next Move Strategy Consulting
Source: Next Move Strategy Consulting
01
01 · MARKET LANDSCAPE
A 14× Expansion in One Decade Pilots are converting into contracts — growth is steepest early, then moderates as the base expands.
$92.48B
$675.09B
Estimated market size, 2026
Forecast market size, 2035
24.72%
$582.61B
CAGR, 2026–2035
Absolute opportunity, 2026– 35
G lo b al Revenue Fo recast, 2025–2035 (USD Billion) 24.72% CAGR (2026–2035) Buyers now score models on cost per task and deployment control, not benchmark rank alone.
675.1
541.4 434.1 348.1
279.1 223.8
92.5
115.3
143.9
179.4
48.1
2025
2026
2027
2028
2029
Market Share Leaders
2030
2031
2032
2033
2034
2035
Industry Ecosystem
Closed Weight
72%
Compute Suppliers
Public Cloud
62%
AI chips, cloud capacity, data centers
Text LLM
48%
Model Developers
North America
~42%
U.S. (country)
39%
API Consumption
~36%
Build closed & open-weight models
Distribution Channels API access and subscriptions
Service Partners Fine-tuning, evaluation, safety alignment
Buyers Consumers, developers, enterprises, public sector Navy bars: NMSC-stated 2026 shares. Green bars: 2025 shares derived from NMSC segment values ÷ USD 48.14B total.
Copyright © Next Move Strategy Consulting
Source: Next Move Strategy Consulting
02
02 · GROWTH DRIVERS & OPPORTUNITIES
Compute Access Sets the Growth Pace Four drivers add up to +13.1 pts of CAGR impact; power, pricing and regulation subtract 6.5 pts.
Impact of Drivers & Restraints on CAGR FACTOR · REGION · TIMEFRAME
RESTRAINTDRIVER
Compute capacity partnerships Multicloud distribution
+3.5%
· Global · 2026–35
Enterprise agent workloads
+3.1%
· NA, APAC · 2026–33
Open-weight adoption (devs, SMBs) Power & grid constraints
+4.3%
· NA, EU · 2026–32
+2.2%
· APAC, EU
−3.0%
· NA, EU · 2026–32
Open-weight price competition
· Global · 2026–30
−2.1%
EU AI Act compliance workload
· Europe · 2026–29
−1.4%
Proof point: AWS × OpenAI 7-year, USD 38B compute deal (Nov 2025), expanded with 2 GW of Trainium capacity (Feb 2026).
Regional Growth Opportunity Map 1
North America · Largest $21.17B (2025) → $243.04B (2035); ~42% share in 2026
5 1
3 2
6
2
4
United States · Top Country $18.63B (2025) → $206.58B (2035)
3
Asia-Pacific · Fastest Region 28.36% CAGR, reaching $236.28B by 2035
4
India · Fastest Country
34.26% CAGR; $2.00B (2026) → $28.35B (2035). Local-language and sovereign demand shape entry.
Copyright © Next Move Strategy Consulting
5
Europe · Sovereign AI
6
Middle East · Hosting
Microsoft–Mistral expansion (Jul 2026)
Mistral × HUMAIN sovereign AI
adds EU infrastructure and Azure Local;
collaboration in Saudi Arabia (Aug 2026)
AI Act enforcement since Aug 2026.
signals in-country model demand.
Source: Next Move Strategy Consulting
03
02 · HIGH-GROWTH SEGMENTS
Scale Leaders vs. Fastest Movers Incumbent segments hold scale; agents, open weights and edge outgrow the 24.72% market rate. S EG M EN T A X IS
L A RG ES T S EG M EN T · 2025 → 2035
FA S TES T · C A G R 2026 –35
Revenue Stream
A PI C o nsum p tio n · $18.30B → $189.03B
C usto m S ervices · 28.77%
D ep lo ym ent
Pub lic C lo ud · $29.85B → $337.53B
Ed g e · 34.73%
M o d el Fam ily
Text LLM · $23.10B → $216.03B
V id eo M o d el · 31.42%
A rchitecture
C lo sed Weig ht · $34.66B → $418.55B
O p en Weig ht · 29.46%
Param eter S cale
Fro ntier · $16.37B → $236.28B
S m all · 27.12%
Buyer Typ e
Enterp rise · $17.32B → $290.30B
Pub lic S ecto r · 26.87%
U se C ase
C o d ing · $10.58B → $135.02B
A g ents · 31.14%
Ind ustry Vertical
Techno lo g y · $14.44B → $168.78B
Energ y & Utilities · 30.46%
Growth Pathways — CAGR 2026–2035 vs. Market Edge deployment
34.73%
India (country)
34.26%
Video models
31.42%
Agents (use case)
31.14%
Energy & Utilities
30.46%
Open-weight models
29.46%
Custom Services
28.77%
Asia-Pacific (region)
28.36%
Total market
24.72%
Whitespace Opportunities Identified by NMSC
Sovereign Hosting
Industrial Engineering
Custom Services
Enterprise Contracts grow at 27.84% CAGR as governments demand in-border models.
Manufacturing vertical reaches $60.76B by 2035 via simulation- and design-tuned models.
Distillation, alignment and evaluation (28.77% CAGR) price outcomes, not tokens.
Copyright © Next Move Strategy Consulting
Source: Next Move Strategy Consulting
04
03 · COMPETITIVE SCENARIO
Alliances, Not Acquisitions, Win Competition centers on model quality, compute access and distribution rather than price alone.
Bundled
Competitive Positioning Matrix
Market Structure CONCENTRATION
PLATFORM COMPANIES
Concentrated at the frontier, with a growing open-weight tier from Europe and Asia. Alphabet Microsoft
Distribution reach →
INNOVATION FOCUS
Agents, multimodal inputs, long context and hardware co-design.
Amazon Alibaba (Qwen)
M&A ACTIVITY
Partnership-led: compute alliances and sovereign deals outnumber takeovers.
Mistral AI OpenAI
Direct API
Anthropic
DeepSeek
PRICING MODELS
Per-token charges through to reserved capacity and dedicated instances. FRONTIER LABS
OPEN-WEIGHT CHALLENGERS
Closed weight
Architecture →
Open weight
Indicative placement based on NMSC company archetypes.
Key Strategic Moves — Partnerships, Expansion & Launches NOV 2025 PARTNERSHIP
NOV 2025 ALLIANCE
FEB 2026 INVESTMENT
AWS × OpenAI — 7-year, USD 38B
Microsoft, NVIDIA & Anthropic — linked
compute deal for NVIDIA GPU access.
partnerships; Claude on Microsoft
Amazon × OpenAI — 2 GW Trainium capacity; planned USD 50B investment.
Foundry.
MAR 2026 CO-DESIGN
JUL 2026 EXPANSION
AUG 2026 LAUNCH
Mistral AI × NVIDIA — co-develop open
Microsoft × Mistral — European
open frontier models.
infrastructure and Azure Local
Alibaba Qwen3.8 Max launched; Mistral × HUMAIN sovereign AI in Saudi Arabia.
deployments.
20 PROFILED PLAYERS · FRONTIER LABS, HYPERSCALERS & OPEN -WEIGHT CHALLENGERS OpenAI
Alphabet
Anthropic
Mistral AI
Cohere
ByteDance
Meta
Microsoft
DeepSeek
IBM
Amazon
xAI
Alibaba
Huawei
Moonshot AI
Tencent MiniMax
Baidu Zhipu AI
Lingyiwanwu (01.AI)
Copyright © Next Move Strategy Consulting
Source: Next Move Strategy Consulting
05
FOUNDATION MODEL MARKET · 2026–2035
USD 92.48B (2026) → USD 675.09B (2035) · 24.72% CAGR
Thank You Connect with Next Move Strategy Consulting for in-depth Foundation Model Market insights and strategic guidance tailored to investors, strategy teams and B2B decision-makers.
WEBSITE
PHONE
www.nextmsc.com
+1 857 758 5017
info@nextmsc.com
Inside the Full Report Forecasts for 2025, 2026 and 2035 across 8 segmentation axes gen-dedup-a2d504ec2c18d5a2615d2214ab77ac69.png
Region- and country-level revenue views through 2035
Click here for the complete report
Drivers and restraints weighted by CAGR impact 20 company profiles and alliance-structure analysis
nextmsc.com/report/foundation-model-market-ic5242
Follow Us
Copyright © Next Move Strategy Consulting
YouTube
Source: Next Move Strategy Consulting
06