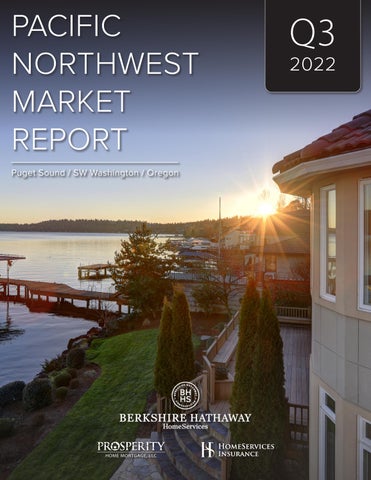
NORTHWEST MARKET REPORT


Puget Sound / SW Washington / Oregon PACIFIC
Q3 2022
ABOUT THIS REPORT
The Berkshire Hathaway HomeServices Quarterly Market Report features the latest MLS data and local market statistics. Through year-over-year comparisons of key performance indicators and market summaries, this report delivers a comprehensive overview of residential real estate activity for the regions we service across the Pacific Northwest, including:
• Greater Seattle Metro (King, Pierce, and Snohomish)
• Southwest Washington (Vancouver Metro Area)
• Greater Portland Metro Area
• Mid-Willamette Valley (Marion, Polk, Linn, and Benton)
• Eugene, Coastal, and Southern Oregon
• Central Oregon
Learn about trends affecting sales activity and price, read decisive takeaways for each market, and empower yourself with Northwest Knowledge.
ABOUT US
Since 1942, we’ve been helping people buy and sell homes in Oregon and Washington. With 33 offices and a growing regional network of nearly 1,000 real estate professionals, we lead the Northwest in delivering exceptional service backed by data-driven market intelligence, just like you’ll find throughout this report.
For more information and assistance to help successfully navigate today’s real estate market, contact your local Berkshire Hathaway HomeServices broker. We are Good to know.®
All statistics are based upon MLS data for the period of 07/01/22 - 09/30/22.
PACIFIC NORTHWEST 2022 MARKET REPORTQ3
BERKSHIRE HATHAWAY HOMESERVICES
LETTER FROM THE EDITOR
Every real estate market has its opportunities and challenges, and this Q3 2022 Pacific Northwest market is no different. Following years of tailwinds, the real estate market finally faces the long-anticipated growing headwinds that are cooling down the nation’s decade-long housing market boom. The difference between now and the previous housing recession is that current conditions are being shaped in large part by underinvestment as opposed to irresponsible lending. The current housing market pivot is not akin to the subprime lending-fueled crash that sparked the ‘Great Recession’ in 2008.
Not long ago, real estate professionals, their sellers, and buyers were having M.O.M conversations about the housing market, or how many minutes-on-market it will be before going under contract. Today expectations are trending back to the traditional D.O.M conversation, or how many days-on-market before we receive an offer. The days of unprecedented contract terms and record-high home price appreciation are no more. Despite weaker sales, as compared to historic numbers, prices remain resilient and more than a quarter of homes on the market are selling at or above list price because demand still exceeds supply.
For buyers, competition has decreased as some step away from the market, voluntarily or involuntarily, so if you’re serious about purchasing property, you can expect a more normal, traditional negotiation and sale life cycle. For sellers, the return on investment and equity remains near record levels. A well-priced home is still a sought-after commodity, and the pricing expertise of a Berkshire Hathaway HomeServices sales professional can get you the most possible value for your home.

What is historically true and continues to be true today is that most real estate transactions are the result of a life event. And, even in times of economic uncertainty, life changes still influence buying and selling decisions.
In fact, in this recalibrating marketplace, a trusted real estate professional – someone with extensive localmarket knowledge, a sharply honed skill set, and a proven track record for service excellence – is more important than ever. So, after you’ve reviewed the latest Northwest Knowledge™ in our Q3 report, reach out to us. We’re always here to guide you home.

PACIFIC NORTHWEST 2022 MARKET REPORTQ3
BERKSHIRE HATHAWAY HOMESERVICESLETTER FROM THE EDITOR
Jason
Waugh,
President
& CEO
Berkshire
Hathaway HomeServices Northwest Real Estate Berkshire Hathaway HomeServices Real Estate Professionals
Greater Seattle Metro Area
(King, Pierce, and Snohomish)
We’re approaching the typical selling seasonality coupled with a definitive reset in the market, thus creating a less competitive environment for buyers looking to purchase. Despite higher interest rates, home prices remain resilient, though the rate of acceleration is slowing down throughout the Greater Seattle Metro Area. Average days on market lengthened this quarter, as new listings and active listings both posted year-over-year declines.
NEW LISTINGS AND ACTIVE LISTINGS
In the Greater Seattle Metro Area, new listings (20,049) fell 15% this quarter from year-ago figures. However, active listings were up 5% year-over-year to end Q3 2022 at a total of 28,473 active listings throughout King, Pierce, and Snohomish Counties.
DAYS ON MARKET
Days on market jumped 64% to end Q3 2022 at an average of 23 days, up from 14 days this quarter last year. In Juanita/Woodinville, average days on market was 24 days, a 140% year-over-year rise. North Seattle posted the lowest average days on market (17 days), though the average days on market was still 13% higher than this time last year. And while average days on market increased in almost every submarket throughout the Greater Seattle Metro Area, Central Seattle went against this trend with a days-on-market average of 19 days, a 32% decline from year-ago figures.
PENDING SALES AND CLOSED TRANSACTIONS
Pending sales (14,890) missed the mark by 30% this quarter, while closed transactions also fell, declining 32% from year-ago figures to end Q3 2022 at 15,413. Closed units were down across the region, decreasing year-over-year by 34%, 27%, and 31% in King, Pierce, and Snohomish Counties, respectively. In Mercer Island, closed units (69) fell 50% from the same time period last year.
AVERAGE SALES PRICE
Average sales price in the Greater Seattle Metro Area ($857,108) was up a slight 5% from year-ago figures. In Dash Point/Federal Way, average sales price increased 12% to $589,599, the highest yearover-year percentage gain in the region. At $2,803,104, Mercer Island recorded the highest average sales price in the region, which was a 3% jump from year-ago figures.
GREATER SEATTLE METRO WEST SEATTLE KENT CENTRAL SEATTLE BELLEVUE NORTH SEATTLE FEDERAL WAY/DASH POINT BURIEN/NORMANDY PARK GIG HARBOR/KEY PENINSULA AVERAGE SOLD PRICE AVERAGE DAYS ON MARKET 16 18 28 19 12 22 14 25 11 22 11 21 15 17 14 22 14 23 11 21 13 22 15 19 11 20 13 28 16 20 10 24 2021 2022 $ 571,248 $ 1,325,360 $ 1,201,774 $0K $375K $750K $1.1M $1.5M $1.8M $2.2M $2.6M $3M TACOMA/UNIVERSITY PLACE M ERCER ISLAND PUYALLUP REDMOND/CARNATION LYNNWOOD/EDMONDS K IRKLAND/BRIDLE TRAILS EVERETT JU ANITA/WOODINVILLE PACIFIC NORTHWEST 2022 MARKET REPORTQ3 BERKSHIRE HATHAWAY HOMESERVICESGREATER SEATTLE METRO $ 2,803,104 $ 1,260,352 $ 877,583 $ 641,556 $ 589,599 $ 549,599 $ 577,340 $ 814,157 $ 877,188 $ 1,556,147 $ 1,104,821 $ 1,076,315 $ 622,252 $ 622,854 $ 1,396,991 $ 1,335,154 $ 2,718,851 $ 1,200,589 $ 810,004 $ 637,294 $ 524,703 $ 511,369 $ 522,378 $ 737,044 $ 829,859 $ 1,546,869 $ 1,018,375 $ 1,037,323 $ 581,549
137 69 585 353 627 379 255 137 PACIFIC NORTHWEST 2022 MARKET REPORTQ3 1,000 900 800 700 600 500 400 300 200 100 CENTRAL SEATTLE REDMOND/ CARNATION WEST SEATTLE MERCER ISLAND NORTH SEATTLE KIRKLAND/ BRIDLE TRAILS BURIEN/ NORMANDY PARK JUANITA/ WOODINVILLE BELLEVUEKENT FEDERAL WAY/ DASH POINT PUYALLUP LYNNWOOD/ EDMONDS EVERETT GIG HARBOR/ KEY PENINSULA TACOMA/ UNIVERSITY PLACE 1,200 1,400 1,600 1,500 BERKSHIRE HATHAWAY HOMESERVICESGREATER SEATTLE METRO 689 431 614 431 570 437 417 345 658 431 743 415 416 307 379 330 1,670 1,272 1,021 688 902 655 825 533 GREATER SEATTLE METRO NUMBER OF CLOSED UNITS 2021 2022 1,800 400 300 200 100 500 600 700
Southwest Washington Area
Metro)
Inventory in Southwest Washington is still well below normal levels, though it did increase to 1.9 months in September 2022. Expectedly, new listings, active listings, and closed transactions fell compared to the same time last year. Average sales price was up 10% from year-ago figures, but with last quarter’s 16% yearover-year percentage change, Q3’s figure points to a slowdown in the rate of price appreciation, which we would expect from a balancing market.
DAYS ON MARKET
Average days on market in Southwest Washington increased 53% from year-ago figures to an average of 26 days. In every city surveyed except Ridgefield, days on market increased; in Ridgefield, average days on market (23 days) fell 4% from year-ago figures, which was also the fastest average in the region.
AVERAGE SALES PRICE
Average sales price increased 10% from year-ago figures to $589,903 this quarter. Average sales price in Washougal climbed 20% to $731,398 while the average price in Woodland this quarter - $514,096 - fell 8% from year-ago figures.
CLOSED TRANSACTIONS AND PENDING SALES
Closed transactions (2,079) declined 31% year-overyear. Pending sales decreased 33% to 1,892 this quarter. Throughout the region, closed units were down in all Southwest Washington cities surveyed for this report, though closed units in Woodland only missed the mark by 4% to end the quarter at 54 units.
NEW LISTINGS AND ACTIVE LISTINGS
At 2,498, new listings in Southwest Washington declined 26%; active listings (3,769) were down 6% compared with year-ago figures.
(Vancouver
SW WASHINGTON $200K $300K $400K $500K $600K $700K $800K $900K VANCOUVER WASHOUGAL BATTLE GROUND WOODLAND LA CENTER RIDGEFIELD CAMAS LONGVIEW/KELSO AVERAGE SOLD PRICE AVERAGE DAYS ON MARKET CAMAS LONGVIEW/ KELSOVANCOUVER WASHOUGAL BATTLE GROUND WOODLAND RIDGEFIELDLA CENTER 50 75 100 125 150 175 200 225 250 275 300 1,252 1800 2000 1600 1400 1200 1000 800 600 400 200 1,263 13 24 22 42 30 31 24 37 24 23 23 29 16 25 21 30 2021 2022 $481,205 $623,455 $558,869 $618,627 $735,094 $363,981 $580,107 $607,314 1,948 1,338 155 102 257 173 56 54 76 36 238 172 235 175 260 244 NUMBER OF CLOSED UNITS PACIFIC NORTHWEST 2022 MARKET REPORTQ3 BERKSHIRE HATHAWAY HOMESERVICESSW WASHINGTON 325 $ 525,269 $ 657,932 $ 514,096 $ 700,694 $ 792,992 $ 379,603 $ 629,621 $ 731,398
Greater Portland Metro Area
The Portland Metro Area remains inventory starved as Q3 averaged just 2.0 months of supply. Homes are spending more time on the market as closed transactions lag behind last year’s figures. With higher interest rates tempering buyer demand, this also puts downward pressure on pricing in the Greater Portland Metro Area, and we’re finally seeing the pace of price appreciation decline. Given the frenzy of our 2021 market, this is an expected adjustment; a more balanced market gives buyers time to make the best decisions possible and allows for previously unsustainable price gains to reach a more reasonable pace of growth.
DAYS ON MARKET
At 23 days, the average days on market in the Greater Portland Metro Area was 35% slower than this time last year. However, a city-by-city analysis reveals that in some Portland area markets this quarter, the average days on market was faster than this time last year. In Canby, average days on market (23 days) fell 12% from year-ago figures and in West Portland, average days on market (28 days) dropped 13% compared with this same time last year.
AVERAGE SALES PRICE
Average sales price ticked up 6% this quarter to $614,200, compared with $581,492 in Q3 last year. Average sales price in Yamhill/Carlton jumped 25% from year-ago figures to $633,819. With an average sales price of $1,051,769, Lake Oswego posted the highest average price in the region, which represented a 1% decrease from the same time period last year.
PENDING SALES AND CLOSED TRANSACTIONS
Pending Sales (6,827) declined 31% this quarter and closed transactions (7,398) fell 28% from year-ago figures. Though all cities surveyed posted fewer closed transactions this quarter compared with Q3 2021, closed transactions in Tigard/ Tualatin fell a slight 8% to end Q3 2022 at 271 closed units.
NEW LISTINGS AND ACTIVE LISTINGS
New listings (10,031) declined 16% year-over-year while active listings dropped 3% to end Q3 2022 at 14,482.
GREATER PORTLAND METRO 2021 2022 AVERAGE SOLD PRICE PORTLAND - W LAKE OSWEGO OREGON CITY HILLSBORO/FOREST GROVE PORTLAND - N WEST LINN CANBY SHERWOOD PORTLAND - NE GRESHAM/TROUTDALE BEAVERTON/ALOHA MCMINNVILLE PORTLAND - SE SANDY TIGARD/TUALATIN YAMHILL/CARLTON NW WASHINGTON COUNTY MILWAUKIE/CLACKAMAS/HAPPY VALLEY WILSONVILLE NEWBERG COLUMBIA COUNTY 32 28 16 22 14 22 12 21 14 22 17 21 13 24 18 21 17 24 19 22 16 25 $250K $375K $500K $625K $750K $875K $1M $1.1M 21 25 15 25 19 19 14 18 26 19 15 23 26 23 16 21 13 23 12 22 $510,681 $ 508,971 $573,386 $ 595,634 $524,708 $ 542,374 $701,296 $ 741,573 $1,059,839 $ 1,051,769 $816,296 $ 899,618 $473,407 $ 510,302 $527,812 $ 579,737 $413,505 $ 451,927 $541,039 $ 576,728 $508,256 $ 633,819 $485,958 $ 462,924 $678,897 $ 707,456 $ 701,092 $665,315 $554,660 $ 627,378 $519,583 $ 554,292 $589,970 $ 603,191 $545,174 $530,906 $566,097 $ 598,200 $ 613,276 $ 590,393 $707,165 $ 760,755 AVERAGE DAYS ON MARKET PACIFIC NORTHWEST 2022 MARKET REPORTQ3 BERKSHIRE HATHAWAY HOMESERVICESGREATER PORTLAND METRO
PACIFIC NORTHWEST 2022 MARKET REPORTQ3 101 295 271 165 722 485 146 122 133 102 326 198 176 126 72 26 171 143 TIGARD / TUALATIN WILSONVILLE HILLSBORO/ FOREST GROVE SHERWOOD SANDY COLU MBIA COUNTY M CMINNVILLE YA MHILL/ CARLTON NE WBERG 800 700 600 500 400 300 200 100 NUMBER OF CLOSED UNITS GREATER PORTLAND METRO 2021 2022 BERKSHIRE HATHAWAY HOMESERVICESGREATER PORTLAND METRO 463 280 1,045 767 1,257 890 930 682 455 327 334 201 205 156 435 382 660 476 301 201 134 110 861 624 1300 1200 1100 1000 900 800 700 600 500 400 300 200 100 WEST LINN NW WASHINGTON COUNTY G RESHAM/ TROUTDALE BE AVERTON/ ALOHAMILWAUKIE/ CLACKAMAS/ HAPPY VALLEYPORTLANDW PORTLANDN PORTLANDNE PORTLANDSE OREGON CITY LAKE OSWEGO CANBY
Mid-Willamette Valley
(Marion, Polk, Linn, and Benton)
Fewer new listings and extended time on market throughout the Mid-Willamette Valley helped slow the pace of price appreciation, though average price remained 6% higher than year-ago figures.
DAYS ON MARKET
Average days on market in the Mid-Willamette Valley climbed 55% from 20 days in Q3 2021 to 31 days this quarter. Average days on market in Independence (36 days) jumped 200% from this time last year, while average days on market in Philomath (25 days) dropped 22% from year-ago figures.
AVERAGE SALES PRICE
Average sales price ($455,541) increased 6% from the same time period last year. In Monmouth, average sales price decreased by 4% from year-ago figures, ending the quarter at $459,491.
PENDING SALES AND CLOSED TRANSACTIONS
Pending sales (1,320) dropped 26% year-over-year, while home sales also fell, declining 27% to end Q3 2022 at 1,388. In Monmouth, closed units posted a strong quarter, increasing 23% to 58 units. In Philomath, closed units were down 40% to end Q3 2022 at 37 units.
NEW LISTINGS AND ACTIVE LISTINGS
New listings (1,829) decreased 17% from year-ago figures. Active listings missed the mark by 1%, ending the quarter at 2,720.
MID-WILLAMETTE VALLEY $0K $100K $200K $300K $400K $500K $600K SALEM/KEIZER STAYTON DALLAS MONMOUTH INDEPENDENCE PHILOMATH ALBANY CORVALLIS LEBANON SWEET HOME AVERAGE SOLD PRICE AVERAGE DAYS ON MARKET $420,201 $464,434 $476,178 $473,911 $498,560 $348,349 $401,635 $414,105 $412,193 $389,709 $ 452,735 $ 471,410 $ 459,491 $ 487,132 $ 562,260 $ 370,866 $ 460,429 $ 422,384 $ 442,989 $ 395,883 2021 2022 18 28 19 24 36 50 32 25 19 34 21 37 24 30 12 36 16 28 29 33 PACIFIC NORTHWEST 2022 MARKET REPORTQ3 BERKSHIRE HATHAWAY HOMESERVICESMID-WILLAMETTE VALLEY
PACIFIC NORTHWEST 2022 MARKET REPORTQ3 NUMBER OF CLOSED UNITS 2021 2022 MID-WILLAMETTE VALLEY BERKSHIRE HATHAWAY HOMESERVICESMID-WILLAMETTE VALLEY 280 260 240 220 200 180 160 140 120 100 80 60 40 20 STAYTON DALLAS INDEPENDENCEMONMOUTH PHILOMATH ALBANY CORVALLIS LEBANON SWEET HOME 300 320 340 47 148 47 46 62 328 313 162 72 43 108 58 37 37 257 242 129 68 SALEM/ KEIZER 1,000 800 600 400 200 1,200 1,400 1,259 899
Eugene, Coastal & Southern Oregon
(Lane, Tillamook, and Douglas)
Prices were still on the rise throughout Eugene, Coastal, and Southern Oregon. Closed units were generally lower than the same time period last year and the average days on market was slower in some cities. However, Garibaldi and Netarts/Oceanside didn’t follow the regional trend; days on market fell significantly, while the number of closed units in Tillamook increased from Q3 of last year.
DAYS ON MARKET
In the region, average days on market increased 32%, from 19 days in Q3 2021 to 25 days in Q3 2022. In Garibaldi, average days on market dropped an astounding 86%, from 145 days this time last year to just 20 days this quarter. In Netarts/Oceanside, average days on market fell 71% to end the quarter at a fast-moving 17 days.
CLOSED UNITS
Closed transactions (1,852) declined 16% from year-ago figures. In Tillamook, closed units increased 8% from 36 units in Q3 2021 to 39 units this quarter.
AVERAGE SALES PRICE
Average sales price throughout the region was up 7%, ending the quarter at $449,813. In Lebanon, average sales price increased only slightly, rising 2% to $395,883.
NEW LISTINGS, ACTIVE LISTINGS, AND PENDING SALES
New listings (2,153) fell 16% from year-ago figures while active listings (3,212) declined 2%. Pending sales (1,767) were also down, falling 17% compared with the same time last year.
EUGENE, COASTAL, & SOUTHERN OREGON 2021 2022 PACIFIC NORTHWEST 2022 MARKET REPORTQ3 BERKSHIRE HATHAWAY HOMESERVICESEUGENE, COASTAL, & SOUTHERN OREGON AVERAGE SOLD PRICE AVERAGE DAYS ON MARKET $0K $200K $400K $600K $800K $1M $1.2M $408,957 $ 472,311 $ 516,085 $348,004 $ 383,685 $253,793 $351,250 $389,770 $ 395,446 $655,743 $ 858,500 $ 422,991 14 20 18 31 145 20 38 44 58 17 35 35 EUGENE FLORENCE ROSEBURG GARIBALDI TILLAMOOK NETARTS/ OCEANSIDE
PACIFIC NORTHWEST 2022 MARKET REPORTQ3 EUGENE 2 710 19 ROSEBURG 350 400 NETARTS/ OCEANSIDEGARIBALDI TILLAMOOK FLORENCE 450 500 550 600 650 700 800 900 897 707 246 192 151 111 50 100 150 200 250 300 NUMBER OF CLOSED UNITS 2021 2022 EUGENE, COASTAL, & SOUTHERN OREGON BERKSHIRE HATHAWAY HOMESERVICESEUGENE, COASTAL, & SOUTHERN OREGON 3639
Central Oregon
Like most markets throughout the Pacific Northwest, real estate indicators in Central Oregon are showing signs of transition as we see a definite change from the unsustainable trajectory of 2020 and 2021 into a more balanced marketplace. New and active listings have dropped compared with this same time last year; sales were lower throughout the region; and homes spent more time on the market than they did in 2021. However, price appreciation was still happening at a double-digit pace for all markets surveyed this quarter, which reflects strong buyer demand for Central Oregon homes.
NEW AND ACTIVE LISTINGS
New listings in Central Oregon (1,550) fell 28% from year-ago figures and active listings in Q3 2022 (2,644) missed the mark by 5% compared with this same time period last year.
AVERAGE SALES PRICE
Average sales price increased 14% year-over-year to end Q3 2022 at $793,699 for the region. In Sunriver, average sales price jumped 31% from year-ago figures to $892,400.
PENDING SALES AND CLOSED TRANSACTIONS
Pending sales (1,188) were down 31% compared with the same time period last year and closed transactions were also down 31%, ending Q3 2022 at 1,284 for the region. In Redmond/Terrebonne, closed units (265) this quarter dropped 43% from year-ago figures.
DAYS ON MARKET
Days on market slowed 26% from year-ago figures to an average of 29 days, up from an average of 23 days in Q3 2021. The market in Bend was slightly faster this quarter with an average of 26 days, representing a 4% decrease from the days-on-market average last year. In Redmond/Terrebonne, average days on market climbed 107% from year-ago figures to 29 days this quarter.
CENTRAL OREGON 2021 2022 $0K $150K $300K $450K $600K $750K $900K BEND REDMOND/ TERREBONNE SUNRIVER AVERAGE SOLD PRICE AVERAGE DAYS ON MARKET $805,566 $485,412 $679,308 $ 892,708 $ 557,143 $ 892,400 27 26 14 29 18 24 500 450 400 350 300 250 200 150 100 50 1,200 1,050 900 750 600 450 300 150 BEND REDMOND/ TERREBONNE SUNRIVER 1,071 82 765 461 265 65 NUMBER OF CLOSED UNITS PACIFIC NORTHWEST 2022 MARKET REPORTQ3 BERKSHIRE HATHAWAY HOMESERVICESCENTRAL OREGON
 ©2022 BHH A liates, LLC. An independently operated subsidiary of HomeServices of America, Inc., a Berkshire Hathaway a liate, and a franchisee of BHH A liates, LLC. Berkshire Hathaway HomeServices and the Berkshire Hathaway HomeServices symbol are registered service marks of Columbia Insurance Company, a Berkshire Hathaway a liate. Equal Housing Opportunity.