1 minute read
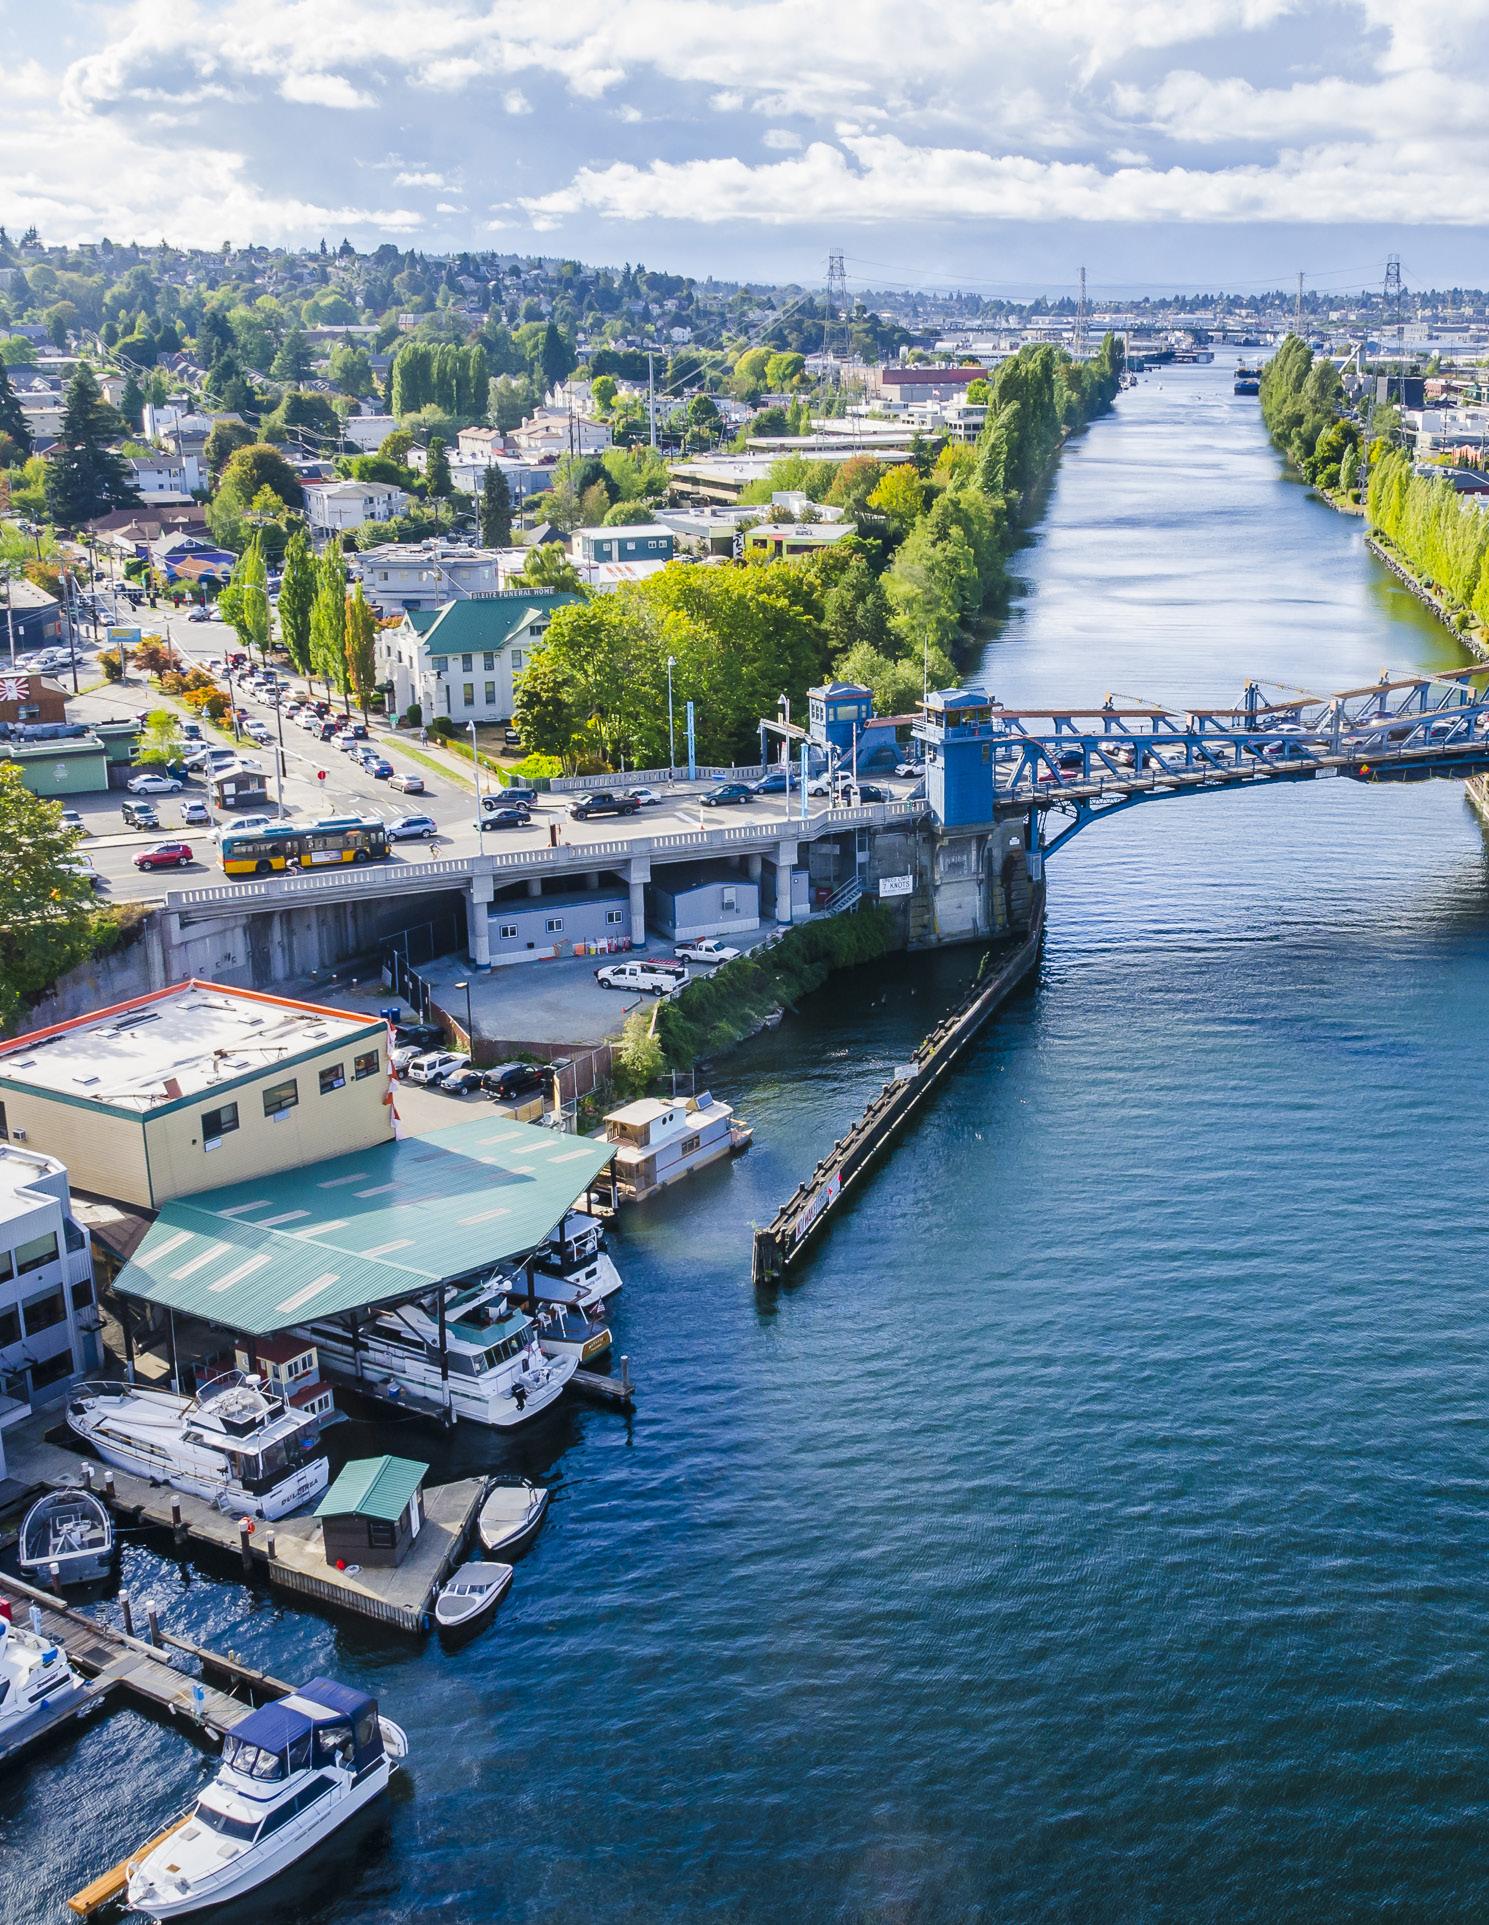
Greater Seattle Metro Area

from Pacific Northwest Market Report - Q2 2023 - Central Region
by Berkshire Hathaway HomeServices NW Real Estate & Real Estate Professionals

(King, Pierce, Snohomish, and Thurston)
Tight inventory, higher interest rates, and strong buyer demand are creating competition for listings in the Greater Seattle Metro area. Despite less activity than in the same period the prior year, the market is moving, and a well-priced and show-ready listing in the Greater Seattle Metro area is still selling fast and often in a multiple-offer situation.
Days On Market
Average days on market in the Greater Seattle Metro area increased 117% year-over-year to 26 days. Across the region, average days on market jumped by double- and triple-digit percentage points, rising the most in Bellevue –a 200% year-over-year jump and an average of 24 days this quarter. At 18 days, Redmond/Carnation and West Seattle tied for the swiftest-moving markets in the region, though this number represented a 125% and 80% year-over-year increase, respectively.
Closed Transactions
Closed transactions (13,873) fell 33% from year-ago figures throughout the Greater Seattle Metro area. King County recorded a total of 7,111 closed units, a 32% decrease from this time last year. On a percentage basis, closed units decreased the most in Burien/Normandy Park, where 113 units closed this quarter was a 74% drop from year-ago figures.
PENDING SALES, NEW LISTINGS, & ACTIVE LISTINGS
Pending sales (14,783) were down 23% from year-ago figures; new listings decreased 38% year-over-year to end Q2 2023 at 17,438; and active listings (22,462) declined 27% from year-ago figures.
Average Sales Price
Average sales price inched down 6% from year-ago figures to end the quarter at $848,485. Mercer Island posted the highest average sales price in the region – $2,346,674 –but the average sales price there still fell 10% compared to the same time last year. Only Central Seattle went against the trend; average sales price ($1,076,649) in Central Seattle increased year-over-year by 4%.


