Q1 2023


PUGET SOUND • SW WASHINGTON • OREGON
ABOUT THIS REPORT
The Berkshire Hathaway HomeServices Quarterly Market Report features the latest MLS data and local market statistics. Through year-over-year comparisons of key performance indicators and market summaries, this report delivers a comprehensive overview of residential real estate activity for the regions we service across the Pacific Northwest, including:
• Greater Seattle Metro Area (King, Pierce, Snohomish, and Thurston)
• Southwest Washington (Vancouver Metro Area)
• Greater Portland Metro Area
• Mid-Willamette Valley (Marion, Polk, Linn, and Benton)
• Eugene, Coastal, and Southern Oregon
• Central Oregon
Learn about trends affecting sales activity and price, read decisive takeaways for each market, and empower yourself with Northwest Knowledge™.
ABOUT US
Since 1942, we’ve been helping people buy and sell homes in Oregon and Washington. With 31 offices and a growing regional network of nearly 1,000 real estate professionals, we lead the Northwest in delivering exceptional service backed by data-driven market intelligence, just like you’ll find throughout this report.
For more information and assistance to help successfully navigate today’s real estate market, contact your local Berkshire Hathaway HomeServices broker. We are
All statistics are based upon MLS data for the period of 01/01/23 - 03/31/23.
BERKSHIRE HATHAWAY HOMESERVICES
PACIFIC NORTHWEST 2023 MARKET REPORT Q1
LETTER FROM THE EDITOR

The narrative of real estate activity throughout the early months of 2023 can best be described as fluid. A notoriously cyclical industry, first quarter of 2023 experienced the ebbs and flows of a recalibrating market. Sellers were the beneficiaries of stable prices due to continued record-low inventory levels. Prospective buyers were conscience of and responded to changing mortgage interest rates as evidenced by sales activity during four (4) consecutive weeks in January of rate declines, followed by four (4) consecutive weeks of rate increases in February, followed by three (3) consecutive weeks of rate declines in March. All the while, the Federal Reserve attempted to fight stubborn inflation as the labor market continued to outperform expectations.
The data in this report reflect a resetting marketplace. You’ll see many cities where active listings, new listings, and closed transactions are down from the previous year, but you’ll also see places where sales improved, or prices are on the rise. There are reasons for optimism as we transition to the spring and summer selling seasons, like the cooling of inflation and the easing of mortgage rate volatility in Q1, which had not seen a narrower, more stable range since late 2021.
Life events largely determine decisions to buy or sell real estate. What we know to be true is that regardless of what the economy and market are doing, life always goes on. Life advances regardless of forces beyond our control. With such a dynamic marketplace, the data in this report will empower you with local-market knowledge allowing you to make those critical buying or selling decisions from an informed position. Hiring a Berkshire Hathaway HomeServices Real Estate sales professional, who can untangle and successfully navigate the complexities of this real estate market, is a sound investment and will ensure you maximize your opportunity to capitalize on one of the most significant asset classes in your financial portfolio. We are… Good To Know!
Jason Waugh, President & CEO

BERKSHIRE HATHAWAY HOMESERVICES LETTER FROM THE EDITOR PACIFIC NORTHWEST 2023 MARKET REPORT Q1
Greater Seattle Metro Area
(King, Pierce, Snohomish, and Thurston)
Like most major metro markets across the country, the Greater Seattle Metro Area continues to offer historically low levels of new inventory. As mortgage rates continue to settle into a more predictable and less volatile range, the downward pressure on that inventory will further mount as demand outpaces supply.
DAYS ON MARKET
In the Greater Seattle Metro Area, average days on market jumped 176% this quarter, to end Q1 2023 at an average of 47 days. Average days on market increased the most in Juanita/Woodinville, rising 514% from year-ago figures to an average of 43 days. Kirkland/Bridle Trails had the fewest average days on market – 32 days, which still represents a 129% increase from Q1 last year.
CLOSED TRANSACTIONS
This quarter, closed transactions were down 28% yearover-year to 10,179 transactions in the Greater Seattle Metro Area. King County had a total of 4,880 closed units, a 30% decline from year-ago figures. Lynnwood/Edmonds and Mercer Island both posted a slight 8% drop in closed units compared with Q1 2022, ending this quarter at 414 units and 46 units, respectively.
PENDING SALES, NEW LISTINGS, & ACTIVE LISTINGS
Pending sales (12,354) fell 25% throughout the region, while active listings (18,817) declined a slight 5% and new listings decreased by 32% to 12,678 this quarter.
AVERAGE SALES PRICE
Average sales price in the Greater Seattle Metro Area declined 6% year-over-year to $784,664. At an average of $2,331,413, Mercer Island had the highest average sales price for the region, with only a slight 1% drop from yearago figures. But not every region in the Greater Seattle Metro Area experienced declining sales prices. Average sales price in Thurston County remained flat, ticked up 1% in Burien/Normandy Park to $655,551, increased 7% to $883,492 in Gig Harbor/Key Peninsula, grew 1% in Kirkland/ Bridle Trails to $1,258,770, and rose 3% in Olympia to an average of $561,830.
BERKSHIRE HATHAWAY HOMESERVICES GREATER SEATTLE METRO AREA 14 46 17 37 26 38 15 50 27 61 9 49 8 47 14 37 10 41 2022 2023 19 46 12 41 14 32 19 52 19 41 $1.1M 13 $375K $0K $1.5M 42 $750K $1.8M $2.2M 21 60 14 33 7 43 $ 655,456 $ 544,188 $ 1,251,000 $ 1,280,802 $ 2,331,413 $ 1,333,450 $ 786,520 $ 655,551 $ 546,358 $ 510,753 $ 542,473 $ 772,649 $ 883,492 $ 1,516,389 $ 1,011,772 $ 1,008,795 $ 601,345 $ 571,978 $ 561,830 $ 1,258,770 $ 1,227,015 $ 2,350,682 $ 1,733,787 16 43 13 47 20 55 17 53 $ 517,361 $ 587,472 $ 571,589 $ 1,014,173 $ 957,856 $ 726,198 $ 809,603 $ 517,840 $ 842,186 $ 648,512 $ 596,813 $ 532,681 $ 558,955 $ 911,927 $ 827,883 $ 1,893,415 $ 1,027,724 $ 1,052,230 $ 655,037 $ 516,295 $ 516,463 $2.6M KING COUNTY KENT MERCER ISLAND PIERCE COUNTY BELLEVUE REDMOND/ CARNATION SNOHOMISH COUNTY FEDERAL WAY/ DASH POINT KIRKLAND/BRIDLE TRAILS THURSTON COUNTY GIG HARBOR/KEY PENINSULA JUANITA/ WOODINVILLE WEST SEATTLE TACOMA/ UNIVERSITY PLACE OLYMPIA CENTRAL SEATTLE PUYALLUP LACEY/ DUPONT NORTH SEATTLE LYNNWOOD/ EDMONDS BURIEN/ NORMANDY PARK EVERETT
AVERAGE SOLD PRICE AVERAGE DAYS ON MARKET
GREATER SEATTLE METRO AREA
PACIFIC NORTHWEST 2023 MARKET REPORT Q1
BERKSHIRE HATHAWAY HOMESERVICES GREATER SEATTLE METRO AREA 10,000 9,000 8,000 7,000 6,000 5,000 4,000 3,000 2,000 1,000 7,011 4,880 3,271 2,468 2,798 2,104 1,149 743 900 800 700 600 500 400 300 200 100 CENTRAL SEATTLE WEST SEATTLE NORTH SEATTLE BURIEN/ NORMANDY PARK BELLEVUE KENT FEDERAL WAY/ DASH POINT GIG HARBOR/ KEY PENINSULA 410 350 449 245 330 232 231 180 384 256 371 271 255 206 207 161
50 46 242 185 451 246 103 84 REDMOND/ CARNATION MERCER ISLAND KIRKLAND/ BRIDLE TRAILS JUANITA/ WOODINVILLE 700 600 500 400 300 200 100 2,750 1,500 1,250 1,000 750 500 250 PUYALLUP LYNNWOOD/ EDMONDS EVERETT TACOMA/ UNIVERSITY PLACE 1,050 760 605 502 449 414 464 289 472 306 111 167 OLYMPIA LACEY/DUPONT PACIFIC NORTHWEST 2023 MARKET REPORT Q1 KING COUNTY PIERCE COUNTY SNOHOMISH COUNTY THURSTON COUNTY NUMBER OF CLOSED UNITS 2022 2023
GREATER SEATTLE METRO AREA
Southwest Washington
(Vancouver Metro Area)
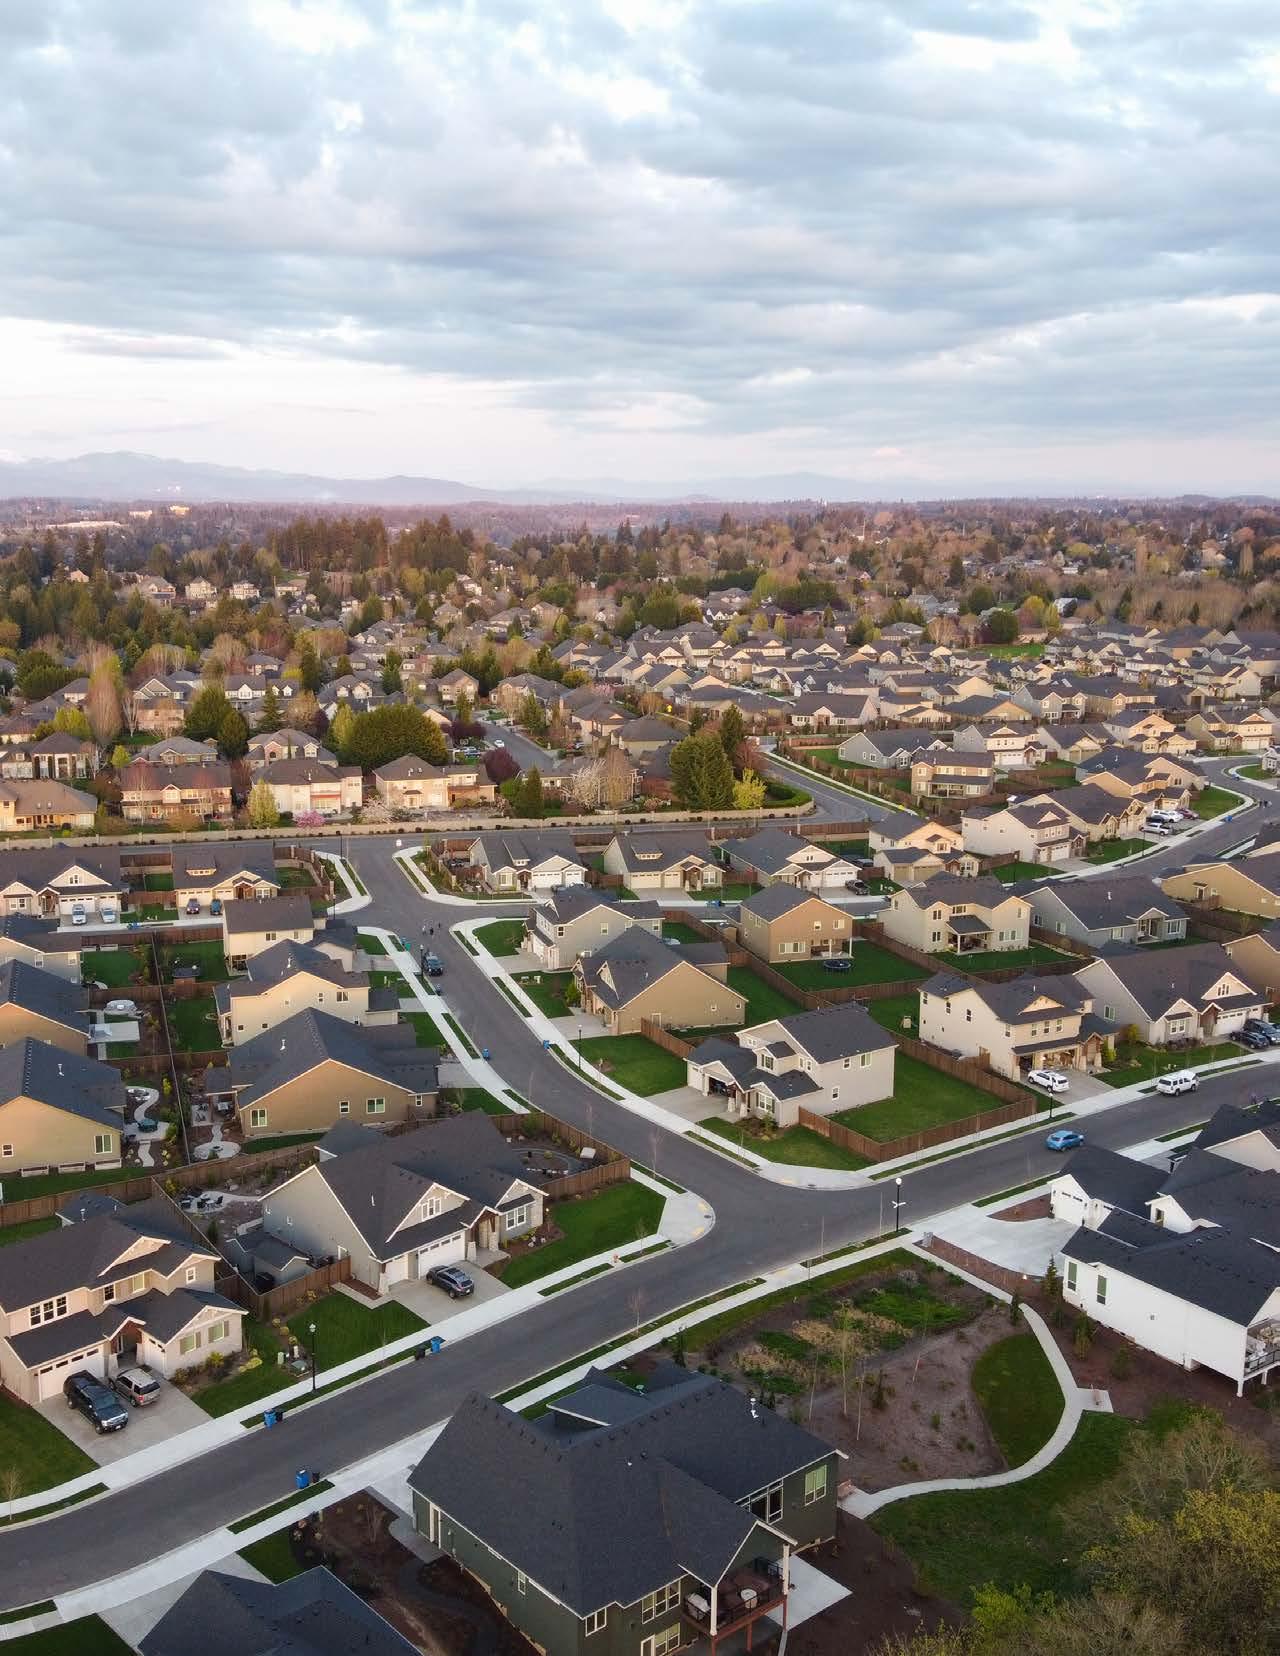
The Southwest Washington real estate market was not immune to the same conditions as its neighboring communities. Inventory, which decreased to 1.4 months in March, was down this quarter as new listings declined year-over-year and month-over-month.
DAYS ON MARKET
Average days on market in Southwest Washington increased 155% from year-ago figures to 51 days this quarter. Vancouver posted the lowest days on market average for the region – 49 days – though this average represented a 206% year-over-year climb. Compared with Q1 2022, average days on market this quarter increased the most in Woodland, where the 77-day average was a 353% increase from the previous year.
AVERAGE SALES PRICE
Overall, average sales price in the Southwest Washington region fell a modest 2% this quarter to $558,054, though in some places it remained unchanged or increased. Average sales price in Kelso/Longview ($379,685) was flat compared with Q1 2022; average sales price in Vancouver ($512,418) increased 3% year-over-year; and in La Center ($699,578) it jumped 19% from year-ago figures.
CLOSED TRANSACTIONS & PENDING SALES
Closed transactions declined 39% year-over-year to end Q1 2023 at 1,243 for the Southwest Washington region. Closed units were down in most cities throughout the Vancouver Metro Area, except in Woodland where closed units (43) increased 8% from the same period last year. Pending sales in the region realized a 33% decline compared with year-ago figures.
NEW LISTINGS & ACTIVE LISTINGS
New listings decreased 36% from year-ago figures to end Q1 2023 at 1,663 while active listings declined 14% to end the quarter at 2,638.
SW WASHINGTON METRO AREA
$200K $300K $400K $500K $600K $700K $800K $900K CAMAS LONGVIEW/ KELSO VANCOUVER WASHOUGAL BATTLE GROUND WOODLAND RIDGEFIELD LA CENTER 1,252 1,263 16 49 22 55 37 59 39 75 19 50 24 57 28 54 17 77 $497,310 $587,531 $605,620 $640,538 $841,251 $380,111 $610,377 $686,038 1,276 806 80 61 178 107 40 43 204 131 166 78 198 139 BERKSHIRE HATHAWAY HOMESERVICES SW WASHINGTON METRO AREA $ 512,418 $ 699,578 $ 547,443 $ 609,876 $ 762,602 $ 379,685 $ 599,887 $ 637,239 AVERAGE SOLD PRICE AVERAGE DAYS ON MARKET NUMBER OF CLOSED UNITS 2022 2023 2000 1800 1600 1400 1200 1000 800 600 400 200 325 300 250 225 200 175 150 125 100 75 50 VANCOUVER WASHOUGAL BATTLE GROUND WOODLAND LA CENTER RIDGEFIELD CAMAS LONGVIEW/ KELSO 46 16 PACIFIC NORTHWEST 2023 MARKET REPORT Q1
Greater Portland Metro Area
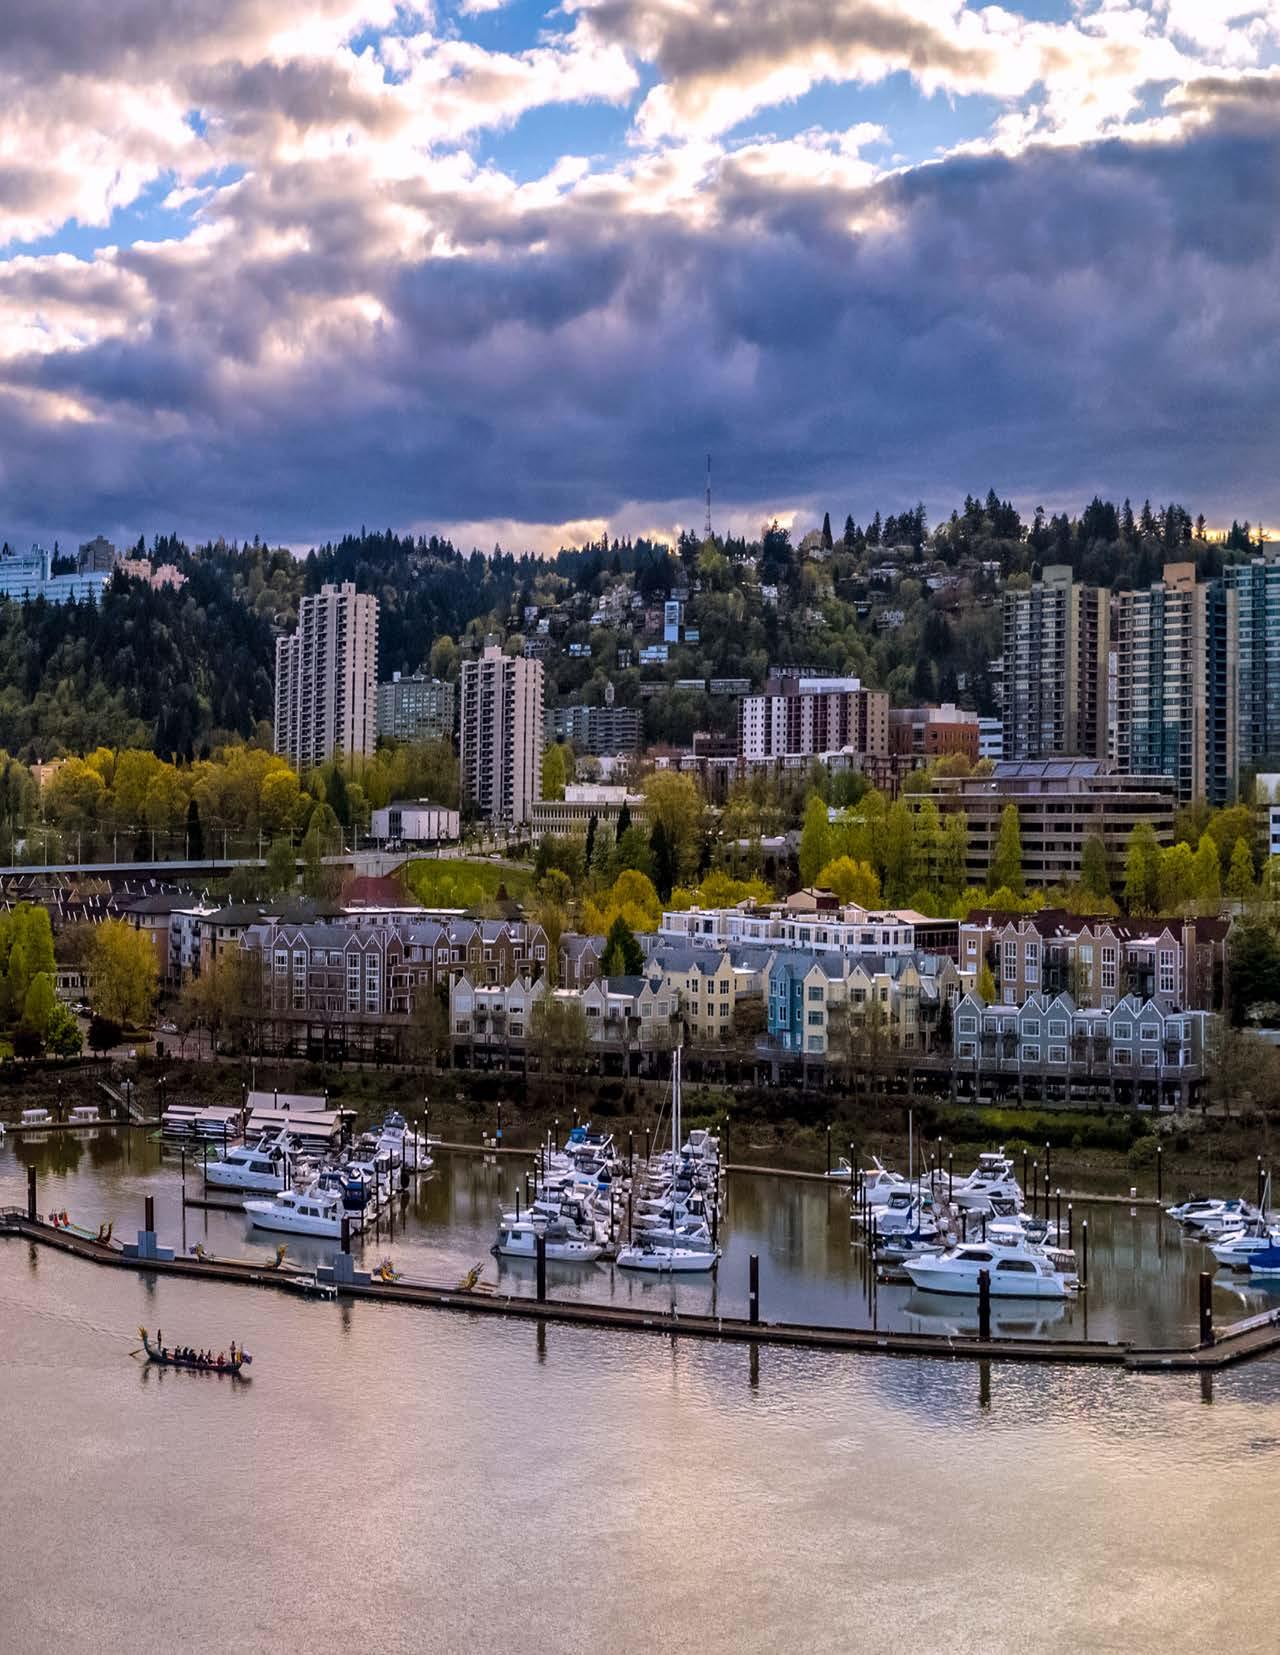
In response to the fight to tame inflation and the residual impact those decisions have on economic considerations consumers base decisions upon, along with persistent inventory constraints, the market throughout the Greater Portland Metro Area mirrored many of its peers.
DAYS ON MARKET
In the Greater Portland Metro Area, average days on market jumped 100% from 25 in Q1 2022 to 50 days this quarter. On a percentage basis, average days on market grew the most in Canby, rising 220% from year-ago figures to end Q1 2023 at an average of 80 days. Beaverton/Aloha posted the lowest average days on market in the region; the average of 42 days represented a 180% year-over-year increase.
NEW LISTINGS, ACTIVE LISTINGS, & PENDING SALES
New listings fell 28% from year-ago figures, active listings dropped a slight 3%, and pending sales retreated by 30% to end this quarter at 5,359.
AVERAGE SALES PRICE
Average sales price ($567,761) dropped 5% from year-ago figures throughout the Greater Portland Metro Area this quarter. Average sales price was down in most places, though it was up 1% to $513,966 in Yamhill County and increased 8% in Sherwood to an average of $737,041. At $1,124,709, Lake Oswego posted the highest average sales price in the region, which remained virtually unchanged from year-ago figures.
CLOSED TRANSACTIONS
Closed transactions in the Greater Portland Metro Area (4,455) were 35% lower this quarter than they were in Q1 last year. Closed units in Wilsonville (53) fell the most on a percentage basis, dropping 58% from the same time the prior year.
GREATER PORTLAND METRO AREA
38 54 38 52 22 48 15 42 44 88 24 45 26 57 15 43 24 47 24 47 41 67 23 57 26 48 26 44 15 39 26 73 24 49 25 80 29 49 23 54 18 45 $522,004 $ 473,225 $558,855 $ 536,081 $520,876 $ 488,814 $766,427 $ 732,140 $1,128,174 $ 1,124,709 $939,164 $ 821,238 $482,876 $ 458,160 $578,411 $ 560,765 $517,926 $ 437,298 $564,454 $ 560,387 $602,894 $ 602,385 $468,631 $ 480,787 $679,758 $ 737,041 $ 614,030 $693,784 $610,776 $ 582,230 $537,671 $ 525,513 $627,289 $ 619,806 $556,330 $541,579 $608,622 $ 547,920 $ 569,835 $ 544,828 $725,870 $ 674,143 BERKSHIRE HATHAWAY HOMESERVICES GREATER PORTLAND METRO AREA AVERAGE SOLD PRICE AVERAGE DAYS ON MARKET 2022 2023 PORTLAND - W OREGON CITY PORTLAND - N CANBY PORTLAND - NE BEAVERTON/ ALOHA PORTLAND - SE TIGARD/ TUALATIN NW WASHINGTON COUNTY MILWAUKIE/ CLACKAMAS/ HAPPY VALLEY WILSONVILLE LAKE OSWEGO HILLSBORO/ FOREST GROVE WEST LINN NEWBERG SHERWOOD SANDY COLUMBIA COUNTY GRESHAM/ TROUTDALE YAMHILL/ CARLTON MCMINNVILLE $250K $625K $375K $750K $500K $875K $1M $1.1 M PACIFIC
2023 MARKET REPORT Q1
NORTHWEST
188 143 127 469 322 86 71 53 73 47 222 135 139 90 32 126 91 700 600 500 400 300 200 100 BERKSHIRE HATHAWAY HOMESERVICES GREATER PORTLAND METRO AREA 322 198 742 438 850 606 666 454 245 208 170 88 95 75 336 202 405 260 184 109 97 61 522 367 1300 1200 1100 1000 900 800 700 600 500 400 300 200 100
METRO AREA 2022 2023 20 NUMBER OF CLOSED UNITS PORTLANDW OREGON CITY PORTLANDN CANBY PORTLANDNE BEAVERTON/ ALOHA PORTLANDSE TIGARD/ TUALATIN NW WASHINGTON COUNTY MILWAUKIE/ CLACKAMAS/ HAPPY VALLEY WILSONVILLE LAKE OSWEGO HILLSBORO/ FOREST GROVE WEST LINN NEWBERG SHERWOOD SANDY COLUMBIA COUNTY GRESHAM/ TROUTDALE YAMHILL/ CARLTON MCMINNVILLE PACIFIC NORTHWEST 2023 MARKET REPORT Q1
GREATER PORTLAND
Mid-Willamette Valley
(Marion, Polk, Linn, and Benton)
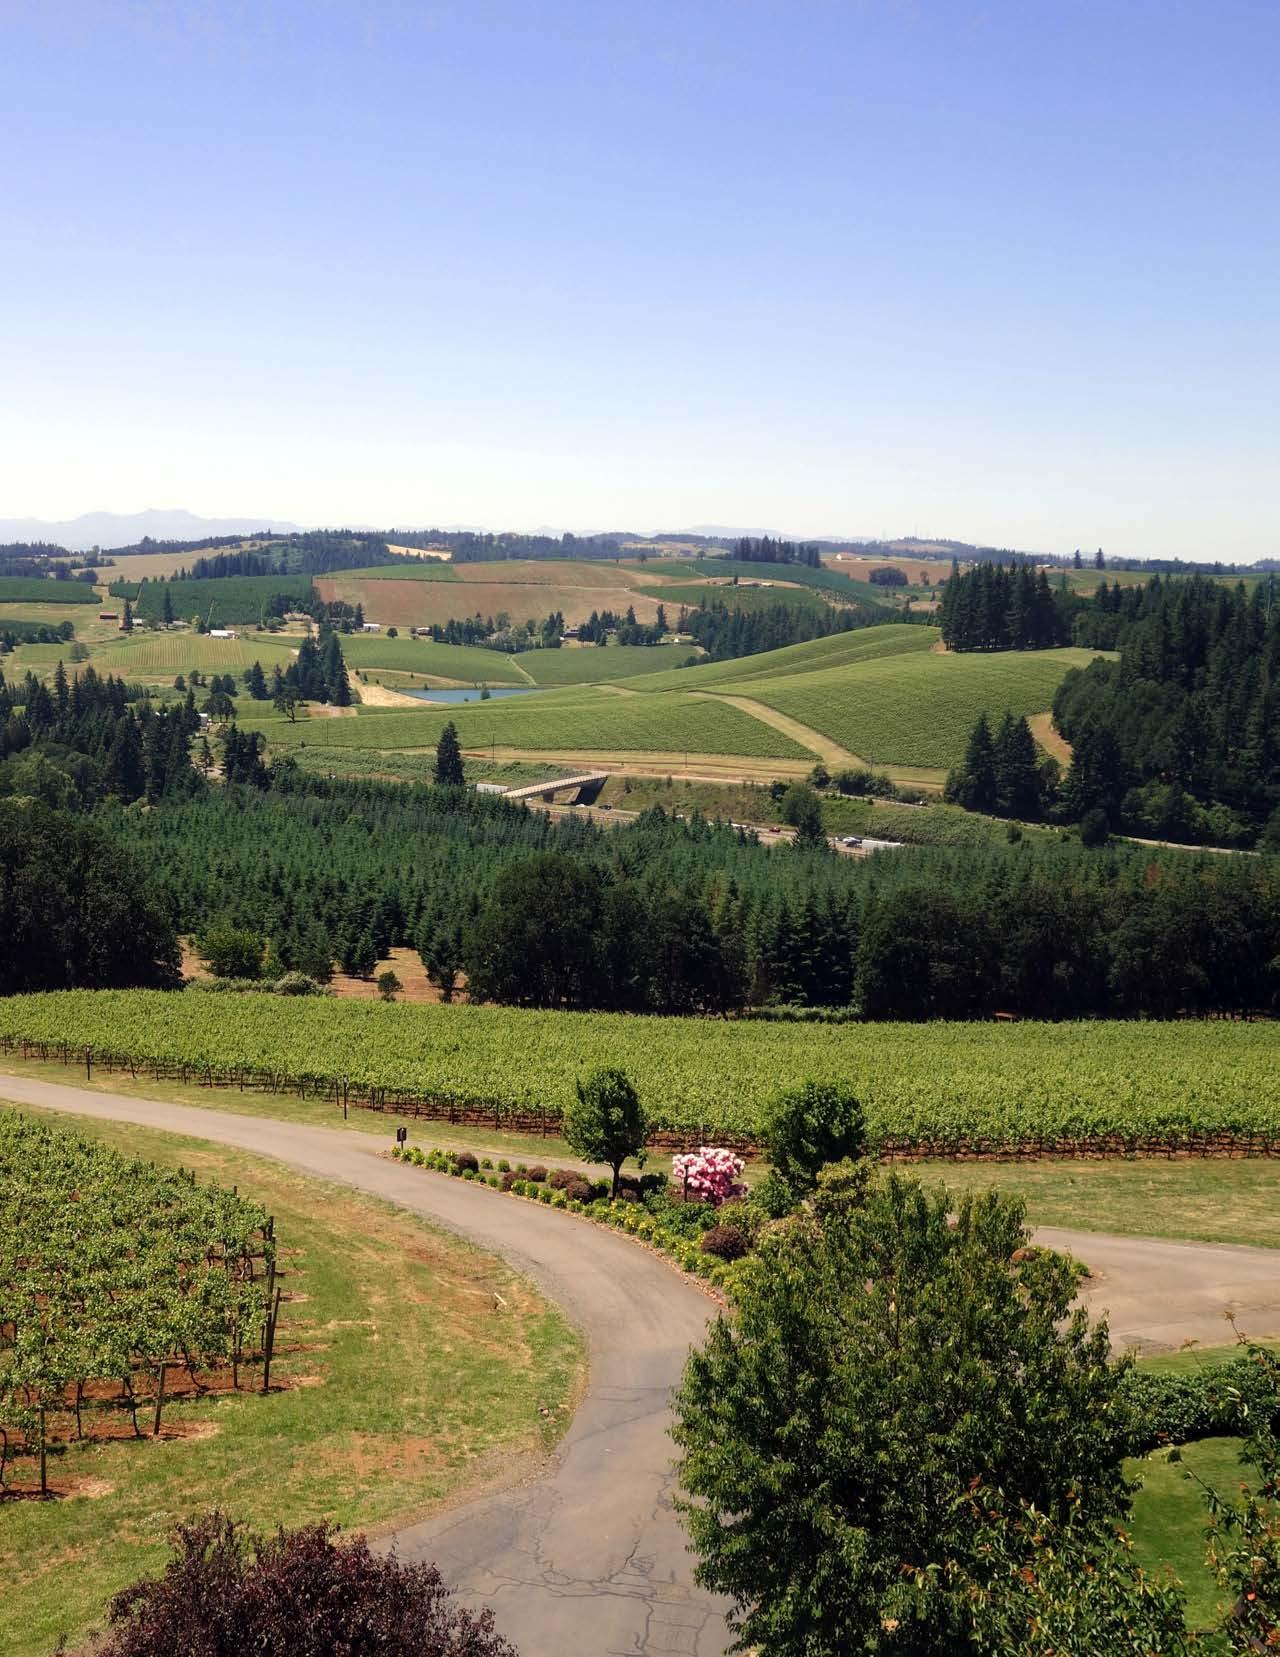
Overall, the Mid-Willamette Valley experienced a series of ups and downs this quarter – days on market increased while average sales price experienced a modest decline throughout the region, though certain cities experienced rising prices and faster sales. Inventory fell to 1.8 months as the lack of supply continued to provide a headwind.
DAYS ON MARKET
Average days on market in the Mid-Willamette Valley increased 117% across the region, rising to an average of 63 days from an average of 29 days in Q1 of last year. In Philomath, days on market went against this trend, dropping 44% from year-ago figures to an average of 28 days.
AVERAGE SALES PRICE
Average sales price retreated a modest 2% this quarter, ending Q1 2023 at $429,067. Once again, Philomath went against the regional trend; average sales price increased by 38% year-over-year to $586,927 this quarter. In Dallas, average sales price ($421,194) was up 1% from year-ago figures.
PENDING SALES, NEW LISTINGS, & ACTIVE LISTINGS
New listings fell 35% from year ago figures to 1,072 while active listings also dropped, declining 4% from yearago figures to 2,080. Pending sales were down as well, falling 25% year-over-year to end Q1 2023 at 1,060 .
HOME SALES
Closed sales in the Mid-Willamette Valley declined 30% from year-ago figures to 908 transactions this quarter. Across the region, closed units were down in every city surveyed for this report, falling the least percentagewise in Salem/Keizer, where closed units dropped 27% year-over-year to end the quarter at 609 units.
MID-WILLAMETTE VALLEY
$422,262 $461,892 $503,794 $425,760 $357,056 $415,347 $445,942 $425,922 $388,373 $ 414,211 $ 466,542 $ 450,215 $ 586,927 $ 512,065 $ 378,774 $ 421,194 $ 395,410 $ 423,822 $ 369,145 28 59 31 69 26 108 50 28 37 47 37 87 31 61 32 54 24 50 34 66 BERKSHIRE HATHAWAY HOMESERVICES MID-WILLAMETTE VALLEY 2022 2023 AVERAGE SOLD PRICE AVERAGE DAYS ON MARKET SALEM/ KEIZER STAYTON DALLAS MONMOUTH INDEPENDENCE PHILOMATH ALBANY LEBANON CORVALLIS SWEET HOME $0K $300K $100K $400K $200K $500K $600K PACIFIC NORTHWEST 2023 MARKET REPORT Q1 $ 491,914
BERKSHIRE HATHAWAY HOMESERVICES MID-WILLAMETTE VALLEY STAYTON DALLAS INDEPENDENCE MONMOUTH PHILOMATH ALBANY CORVALLIS LEBANON SWEET HOME 38 92 29 40 28 133 125 54 19 64 19 24 15 162 88 64 50 320 300 280 260 240 220 200 180 160 140 120 100 80 60 40 20 MID-WILLAMETTE VALLEY 830 609 SALEM/ KEIZER 2022 2023 NUMBER OF CLOSED UNITS 1200 1000 800 600 400 200 187 PACIFIC NORTHWEST 2023 MARKET REPORT Q1
Eugene, Coastal,& Southern Oregon
(Lane, Tillamook, and Douglas)
The Eugene, Coastal, and Southern Oregon residential real estate market experienced what you’d expect from a marketplace in flux; varying metrics with key indicators posting mixed results.
DAYS ON MARKET
In Eugene and Southern Oregon, average days on market increased 65% year-over-year to an average of 51 days. In Sweet Home, average days on market jumped 135% from Q1 2022 to an average of 87 days this quarter.
CLOSED TRANSACTIONS
Closed transactions (1,088) missed the mark by 28% from year-ago figures. Netarts/Oceanside went against this regional trend; closed units there climbed 25% to 15 units this quarter.
NEW LISTINGS, ACTIVE LISTINGS, AND PENDING SALES
In the region, new listings (1,439) fell 25% from yearago figures, active listings (2,429) slipped 2% yearover-year, and pending sales declined 23% compared with Q1 2022, to end the quarter at 1,317.
AVERAGE SALES PRICE
Average sales price declined 4% year-over-year to $413,091. However, in Corvallis and Sweet Home, average sales price increased, jumping 4% and 6%, respectively.
BERKSHIRE HATHAWAY HOMESERVICES EUGENE, COASTAL, & SOUTHERN OREGON 2022 2023
$425,559 $ 484,459 $ 471,856 $373,446 $ 351,053 $345,000 $ 440,000 $ 444,266 23 43 39 51 107 61 $658,833 $ 551,783 29 43 39 54 AVERAGE SOLD PRICE AVERAGE DAYS ON MARKET EUGENE ROSEBURG TILLAMOOK NETARTS/ OCEANSIDE FLORENCE $0K $450K $150K $600K $300K $750K $900K PACIFIC NORTHWEST 2023 MARKET REPORT Q1
EUGENE, COASTAL, & SOUTHERN OREGON
EUGENE, COASTAL, & SOUTHERN OREGON
2 1 BERKSHIRE HATHAWAY HOMESERVICES EUGENE, COASTAL, & SOUTHERN OREGON 2022 2023 NUMBER OF CLOSED UNITS
EUGENE ROSEBURG 12 15 NETARTS/ OCEANSIDE TILLAMOOK 546 407 186 135 FLORENCE 100 61 800 700 650 600 550 500 450 400 350 300 250 200 150 100 50 130 120 110 100 90 80 70 60 50 40 30 20 10 PACIFIC NORTHWEST 2023 MARKET REPORT Q1
Central Oregon
A sense of feeling rate locked coupled with limited options kept would be home sellers on the sidelines this quarter, as was reflected in a 31% year-over-year decline in new listings. Active listings fell just 3% as days on market lengthened.
AVERAGE SALES PRICE
Average sales price for the region retreated by 4% this year, dropping to $717,709 from $749,761 last year. In Bend, average sales price fell 8% from year-ago figures to end the quarter at $808,205. Sunriver posted the highest average sales price in Central Oregon ($845,760), which represented a 16% increase compared with Q1 2022.
CLOSED TRANSACTIONS & PENDING SALES
Closed transactions fell 41% throughout the region to end Q1 2023 at 730. Bend posted the highest number of closed units this quarter (441), though closed units decreased 37% from year-ago figures. Pending sales in the region were down 29% from this time last year.
NEW LISTINGS & ACTIVE LISTINGS
New listings declined 31% from year-ago figures to 1,050 while active listings (1,933) posted a 3% drop compared with Q1 2022.
DAYS ON MARKET
Average days on market in Central Oregon increased 100% from 33 days last year in Q1 to 66 days this quarter. Though average days on market jumped 97% year-over-year in Bend to 61 days, this average represents the lowest in the region.
$876,189 $559,362 $727,576 $ 808,205 $ 503,284 $ 845,760 31 61 28 64 33 64 BEND REDMOND/ TERREBONNE SUNRIVER 696 441 304 58 154 29 BERKSHIRE HATHAWAY HOMESERVICES CENTRAL OREGON 2022 2023 NUMBER OF CLOSED UNITS AVERAGE SOLD PRICE AVERAGE DAYS ON MARKET $0K $450K $150K $600K $300K $750K $900K
450 400 350 300 250 200 150 100 50 1,200 1,050 900 750 600 450 300 150 BEND REDMOND/ TERREBONNE SUNRIVER PACIFIC NORTHWEST 2023 MARKET REPORT Q1
CENTRAL OREGON
 ©2023 BHH Affiliates, LLC. An independently operated subsidiary of HomeServices of America, Inc., a Berkshire Hathaway affiliate, and a franchisee of BHH Affiliates, LLC. Berkshire Hathaway HomeServices and the Berkshire Hathaway HomeServices symbol are registered service marks of Columbia Insurance Company, a Berkshire Hathaway affiliate. Equal Housing Opportunity.