Annual Comprehensive Financial Report 2022
 Year Ended June 30, 2022 | An Enterprise Fund of the State of Arizona.
This page intentionally left blank.

Year Ended June 30, 2022 | An Enterprise Fund of the State of Arizona.
This page intentionally left blank.

by the
Fund of the State of
Introductory Section 4
Message from President Michael Crow 6
Letter of Transmittal 7
Certificate of Achievement for Excellence in Financial Reporting 11
ASU Organizational Chart 12
Arizona Board of Regents 13
Financial Section 14
Independent Auditors’ Report 16
Management’s Discussion and Analysis 20
Basic Financial Statements
Statement of Net Position 28
Statement of Financial Position - Component Units 29
Statement of Revenues, Expenses, and Changes in Net Position 30
Statement of Activities - Component Units 31
Statement of Cash Flows 32
Notes to Financial Statements 33
Required Supplementary Information 64
Schedule of the University’s Proportionate Share of the ASRS Net Pension Liability and ADOA Total OPEB Liability 66
Schedule of University Pension Contributions 67
Supplementary Information 68
Combining Statement of Financial Position - Nonmajor Discretely Presented Component Units 70 Combining Statement of Activities - Nonmajor Discretely Presented Component Units 71
Statistical Section 72
Narrative to the Statistical Section 74 Financial Trends
Net Position by Component 75 Statement of Net Position 76
Statement of Net Position – Adjusted for Pensions and Other Postemployment Benefits 77 Changes in Net Position 78
Operating Expenses by Natural Classification 81
Combined Sources and Uses 82
Revenue Capacity
Principal Revenue Sources 83
Academic Year Tuition and Required Fees 84
Composite Financial Index 85
Debt Capacity
Summary of Ratios 88
Debt Coverage for Senior and Subordinate Lien Bonds 90
Long-term Debt 91
Demographic and Economic Information
Admissions, Enrollment, and Degrees Earned 92
Demographic Data 94
Principal Employers 95
Operating Information Faculty and Staff 96 Capital Assets 97


As we advance the ASU charter -— the driving force behind all we do — I experience a "Sun Devil state of mind," where innovation meets ingenuity sparked by our students' enthusiasm and empowered by our outstanding faculty and devoted staff. Our partners and donors share the Sun Devil mindset and embrace our vision of improved, determined communities well-prepared for the challenges and successes ahead.
Over the past year, ASU established a new organizational design to better serve the ASU Charter. The ASU Public Enterprise is led by our five Executive Vice Presidents: Nancy Gonzales, ASU’s University Provost and leader of the ASU Academic Enterprise; Sally Morton, leader of the ASU Knowledge Enterprise; Maria Anguiano, inaugural leader of the ASU Learning Enterprise; Morgan Olsen, ASU’s Treasurer and Chief Financial Officer; and Chris Howard, whom ASU was pleased to welcome earlier this year as our newest Executive Vice President and first-ever Chief Operating Officer of the ASU Enterprise. This is a team of very talented individuals who are focused on advancing the vision and goals of the ASU Charter and our mission of teaching, learning and discovery.
For instance, in fall 2021, the ASU team helped manage another consecutive year of enrollment growth:
• Total enrollment swelled to 135,729
• Roughly 57,000 students were taking ASU Online classes, a rise of more than 8 percent over fall 2020
• First-year student enrollment was 14,250, an 12 percent increase over fall 2020; 46 percent were from minority backgrounds — our most diverse class ever
• First-year student retention rate was 86 percent, making us No. 1 among Arizona's public universities
• Approximately 10,800 international students from 152 countries joined on-campus and online degree programs, about a 25 percent surge over fall 2020.
Our expanding enrollment provides us more opportunities to be sustainable and innovative. According to U.S. News & World Report, ASU has remained the No. 1 most innovative university for eight consecutive years, while the Times Higher Education Impact Rankings place ASU second in the world for sustainability efforts and first in the U.S. The Times ratings address 17 Sustainable Development Goals adopted by 193 United Nations member states in 2015. Additionally, Sierra Magazine named ASU the No. 1 "coolest school" in its 15th annual sustainability rankings of 328 North American colleges and universities.
For those who are committed to creating a sustainable environment, the new Rob and Melani Walton Center for Planetary Health opened this past year allowing students, faculty and staff to focus on interdisciplinary collaboration through teaching, learning and discovery. The 281,000 gross-square-foot building was named in honor of the Walton family's loyalty to ASU for nearly 20 years. The Tempe campus facility features glass fiber-reinforced concrete exterior panels based on biomimicry of a saguaro's orientation to the sun that absorbs and stores less heat. A "mechanical tree" captures carbon emissions, and a large atrium biome purifies waste air and recycles water using natural, bio-based methods.
Students studying global environmental and climate science can benefit from a new university partner, the Bermuda Institute of Ocean Sciences (BIOS) on St. George's Island, Bermuda. The non-profit BIOS studies ocean processes in the Western Hemisphere. For example, students can train and research the complex problems of our planet's rising carbon dioxide levels.
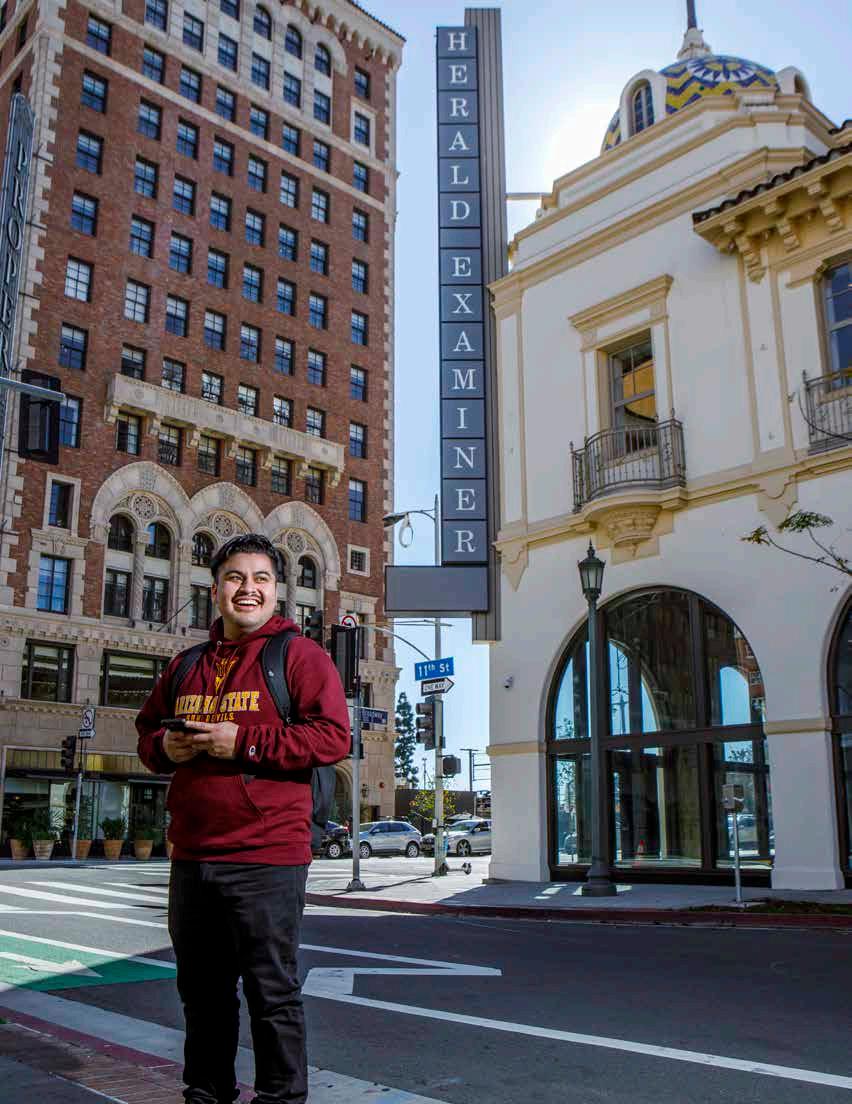
Sun Devils with entertainment aspirations now have several new program options, either here in Arizona in the newly launched ASU Media and Immersive eXperience (MIX) Center at Mesa City Center Complex or on the West Coast at our ASU California Center in Los Angeles in the newly opened Herald Examiner Building. Students enrolled in ASU's Sidney Poitier New American Film School are poised for real-world opportunities in Mesa, Los Angeles or both.
ASU also launched the new global headquarters of the Thunderbird School of Global Management in a new 111,000-square-foot downtown Phoenix campus building, which opened this past year. Thunderbird also received a historic gift — $25 million — earmarked to educate 100 million people worldwide by 2030. As part of the Francis and Dionne Najafi 100 Million Learners Global Initiative, the accredited certificate consists of five courses in 40 languages. Students will have lifelong learning options through Thunderbird and ASU or can transfer the credits to other universities worldwide. The giving spirit of all our donors furthers our global impact. The ASU endowment topped $1.25 billion at the close of the fiscal year 2021, with more than 100 new endowed funds.
As you embed yourself in one of ASU’s campuses or locations throughout the U.S., you can see that the ASU Charter is rooted in all we do. We begin 2023 with terrific opportunities, and through the support of our university partners, we offer even more chances for Sun Devils to learn and succeed, from Bermuda to the City of Angels and beyond. I am pleased to say that ASU’s sustained growth shows no signs of slowing and extends our Sun Devil state of mind to educate, innovate, inspire and create.
October 31, 2022
Dear President Crow, Members of the Arizona Board of Regents, and University Stakeholders:
Enclosed is the Arizona State University Annual Comprehensive Financial Report (ACFR) for the year ended June 30, 2022. The report includes the annual financial statements, Management’s Discussion and Analysis (MD&A) and supplemental information to assist the reader in clearly understanding the University’s financial activities and outcomes.
University management is responsible for the accuracy and completeness of the information presented, including all disclosures. We believe our system of internal controls is robust and sufficient to prevent material misstatements and to provide management with reasonable, although not absolute, assurance that assets are safeguarded against loss from unauthorized use or disposition. Because the cost of a control should not exceed the benefits that can be derived from it, the objective is to provide reasonable, rather than absolute, assurance that the financial statements are free of material misstatements.
The University’s internal auditors also perform fiscal, compliance, information technology and operational audits. University Audit and Advisory Services prepares an annual audit plan based on ASU’s Enterprise Risk Assessment model. The audit plan is approved by the University President and the Arizona Board of Regents Audit Committee.

State law, federal guidelines, and certain bond covenants require that the University’s accounting and financial records be audited each year. The University’s annual audit is performed by the Arizona Auditor General. The reports resulting from the audit are shared with University management and the Arizona Board of Regents. The audit of the University’s federal assistance programs is performed by the Arizona Auditor General in conjunction with the Statewide Single Audit. For the year ended June 30, 2022, the Arizona Auditor General has issued an unmodified opinion on Arizona State University’s financial statements, the most favorable outcome possible. The independent auditors’ report is displayed in the front of the financial section of the Report.
ASU remains committed to effective budgetary planning and sound financial management as it pursues excellence in teaching, research and public service. We have prepared Management’s Discussion and Analysis to provide a narrative introduction, overview and analysis of the basic financial statements, as well as information regarding the University’s financial position and the results of operations for the year ended June 30, 2022. The MD&A immediately follows the independent auditors’ report, complements this letter of transmittal and should be read in conjunction with it.
ASU’s charter, mission and goals demonstrate leadership in both academic outcomes and program accessibility. ASU strives to establish national standing in the academic quality and impact of all ASU colleges and schools; to establish ASU as a global center for interdisciplinary research, discovery and development; and to enhance our local impact and social embeddedness. These aspirations provide the framework for ASU’s continued development as a leading, global research university.
ASU offers more than 800 degree programs and concentrations led by expert faculty from highly-ranked colleges and schools. Each distinctive academic program exemplifies the hallmark of ASU— an exceptional education inspired by vision, scholarship and creativity. ASU is accredited by the North Central Association’s Higher Learning Commission and many programs also maintain additional accreditation through specialized accrediting agencies.
ASU was founded as the Territorial Normal School in 1885 by an act of the Thirteenth Territorial Legislature, in response to the growing demand for teachers and leaders in the region. In 1915, agriculture was added to the curriculum in response to the completion of the Roosevelt Dam and subsequent expansion of irrigated farming in the Valley. In 1958, after a series of name changes, the citizens of Arizona voted in favor of a ballot initiative to change the name of the institution to Arizona State University. ASU today is composed of four campuses in the metropolitan Phoenix area, ASU Online, and programs and locations available across Arizona and around the world.
The Arizona Board of Regents (ABOR) governs Arizona State University, as well as the state’s other two public universities. ABOR is composed of twelve members, including appointed, ex-officio and student regents. The Governor of Arizona appoints and the Arizona Senate confirms the eight appointed regents to staggered, eight-year terms as voting members of ABOR. The Governor and Superintendent of Public Instruction serve as ex-officio, voting members while they hold office. Two student regents serve staggered two year terms, the first year as a nonvoting board member and the second year as a voting member
The University is considered a part of the reporting entity for the State of Arizona’s financial reporting purposes and is included in the State of Arizona Annual Comprehensive Financial Report. The financial reporting entity for ASU’s financial statements is comprised of the University and nine component units. The University’s financial statements and the financial statements for the University’s three blended component units, the Bermuda Institute of Ocean Sciences, the Thunderbird School of Global Management and the ASU Athletic Facilities District, are prepared in accordance with Governmental Accounting Standards Board (GASB) reporting requirements. Separate financial
statements for the University’s six discretely presented component units are compiled in accordance with GASB Statement Nos. 39 and 61, and include ASU Enterprise Partners; Arizona Capital Facilities Finance Corporation (ACFFC); ASU Alumni Association; Arizona State University Research Park, Inc.; ASU Preparatory Academy, Inc. and Sun Angel Foundation. These component units are non-profit, taxexempt organizations and are discretely presented based on the nature and significance of their relationships to the University
The University is responsible for using its resources to fulfill its educational, research and public service mission. It also is responsible for planning, developing and controlling budgets within authorized allocations in accordance with University, ABOR, state and federal policies. The University submits its annual operating budget, which includes revenue from state investment, student tuition and fees, auxiliary enterprises, grants and contracts, private gifts and other income, to ABOR for approval. The state legislature reviews the University’s local funds budget and adopts and appropriates the general-purpose funds budget through legislation. University colleges and departments utilize financial reports to review financial transactions and monitor budgets. The University also provides periodic financial reporting to the Arizona Board of Regents. The report includes a comparison of budget to actual revenue and expenses, projections for revenues, expenses and net position for the fiscal year end, and variance explanations.
The following economic summary is based on the Arizona Office of Economic Opportunity Employment Projections, released on February 24, 2021, and data compiled by the JPMorgan Chase Economic Outlook Center at the ASU W.P. Carey School of Business.
In its February 2021 forecast, the Arizona Office of Economic Opportunity is forecasting significant gains in Arizona nonfarm employment for the 2021-2023 projection time period, with 266,000 new nonfarm jobs (4.2% annualized growth) expected from 2021 through 2023. Job growth is expected across all eleven of Arizona's job super-sectors with the leisure/hospitality and construction super-sectors expected to add the largest number of jobs of approximately 44,000 (annualized growth rate of 6.7%), and approximately 21,000 (annualized growth rate of 5.6%), respectively. Super-sectors expected to grow at the lowest annualized growth rates are government at 0.6% and natural resources and mining at 0.4%.
At a national level, disruptions to capital and debt markets, manufacturing capacities, and supply chain deliverables persist through the third quarter of 2022 and overall economic indicators continue to show mixed evidence with low levels of unemployment and rebounding activity in major employment sectors offset by high levels of inflation, rising interest rates and diminished consumer confidence. The Federal Reserve has continued to raise the federal funds effective rate over the last year from near zero in September 2021 to 3.25% in September 2022 to combat decades-high inflation rates on all goods and services. The rising federal funds effective rate has a negative impact on financial lending institutions and customers, with the stated intention of constraining the nation-wide 12-month inflation rate of 8.3% as of August 2022. According to the U.S. Bureau of Labor Statistics, the national unemployment rate decreased from 5.2% in August 2021 to 3.7% in August 2022. Employee hiring and retention remains a significant challenge across all industries with job openings and labor turnover remaining largely unchanged nationally from August 2021 through August 2022 with more than 11 million jobs available. Approximately 5 million more job openings remain available when compared to the total number of unemployed individuals. Locally, the Phoenix metropolitan rate of inflation of 13% on all goods continues to lead the nation, constraining consumer purchasing power, with other major metropolitan areas across the state showing decades-high rates as well. The Arizona unemployment rate continues to improve year-over-year and has decreased from 4.5% in August 2021 to 3.5% in August 2022. Arizona is outperforming the national average for unemployment and, based on positive fundamentals including job growth, net migration to the state and extraordinary levels of technological manufacturing investment, Arizona expects to see continued improvement. Demand for residential housing and near-record low rental vacancy rates continue to drive increases in residential single-family home prices.
Despite economic trends that remain positive for Arizona’s economic growth, constraints on budgets persist for a large number of households due to inflationary factors. Long-term structural issues in the state economy continue to include low national rankings in per capita income, lagging levels of higher education attainment, education funding challenges, higher-than-average poverty rates and needed critical infrastructure improvements to match increasing population demands.
As part of the ABOR strategic plan, Impact Arizona, key performance metrics are used to measure the success of ASU and the other state universities in achieving institutional and system-wide goals. Impact Arizona goals measure progress in delivering a high-quality university education; increasing the number of Arizonans with a college degree or certificate; creating new knowledge, collaborations, inventions and technology to solve critical problems; and engaging our communities through initiatives and partnerships to improve Arizona’s economy and competitiveness. Key measures of progress toward achieving these goals are continually reviewed and monitored by ABOR and the universities. Overarching ASU goals as part of this strategic plan include demonstrating leadership in academic excellence and accessibility; achieving national standing in academic quality and impactful colleges and schools in every field; obtaining recognition as a global center for interdisciplinary research, discovery and development; and enhancing local impact and social embeddedness.
With our Charter as the guiding principle, Arizona State University continues to make measurable progress toward the challenging goals set by the Arizona Board of Regents.
ASU remains committed to ongoing institutional redesign to reach the next iteration of the public research university while simultaneously taking fundamental responsibility for the communities we serve.
Major milestones of the past year highlight the variety of accomplishments of the University and include the following:
• ASU provides students access to a world-renowned faculty that includes 40 Guggenheim fellows, 23 National Academy of Sciences members, 26 American Academy of Arts and Sciences members, 11 Pulitzer Prize winners nine National Academy of Engineering members, six MacArthur fellows and five Nobel laureates. ASU’s 18-to-1 student to faculty ratio ensures that students receive individualized access to this remarkable faculty and highlights the University’s commitment to expanding pathways to higher education and ensuring the quality of that education are simultaneously possible within an optimal institutional design framework.
• The U.S. National Science Foundation (NSF) announced the addition of five new NSF Innovation Corps (I-Corps) Hubs to its National Innovation Network and named ASU as the lead institution for one of its hubs, the Desert and Pacific region. Established in 2011, the I-Corps program is designed to create and implement tools, resources and training activities that enhance the nation’s innovation capacity, identify promising research that can generate economic value and share innovation practices on a national scale to impact economic growth. This new designation will expand the scope and scale of economic and entrepreneurial output.
• In October 2021, the Bermuda Institute of Ocean Sciences joined ASU's Julie Ann Wrigley Global Futures Laboratory. BIOS, in St. George's Island, Bermuda, is the premier deep-ocean observatory in the Western Hemisphere. ASU's Global Futures Laboratory has a wide range of dedicated scientists and scholars working to understand the current state of the planet and its inhabitants, and developing new ways of acquiring and analyzing data from all components of the Earth system, utilizing them to learn about the health of the planet. Together, BIOS and ASU will advance the understanding of the ocean's contributions to Earth's overall health and explore what is needed to secure these resources in the future.
• ASU expanded its large-scale computing capacity to further advance research and learning across the university and the region through its design partnership with Dell Technologies to expand supercomputing access to the university community. An initiative of ASU Knowledge Enterprise Research Computing, the Sol supercomputer was co-designed by Dell Technologies. Currently in early access, Sol will provide additional computing capacity, power and speed to the existing ASU supercomputing infrastructure by an order of magnitude and will allow researchers and partners to expand research opportunities that provide impact and value. The addition of Sol to the University’s supercomputing capacity doubles the number of available CPU-hours.
• ASU continues to move forward in providing the necessary physical assets to further the University’s knowledge assets and meet the demands of the University's core mission of instruction, research and public service. Recently completed, the University opened the MIX Center in downtown Mesa. The new Media and Immersive eXperience (MIX) Center provides film and digital arts, top-tier filmmaking and media production facilities. The cutting-edge building is capable of producing a wide range of digital media, from a blockbuster superhero movie to VR videogames and provides the necessary technology to teach students the skills needed to succeed in a digital economy. Taking fundamental responsibility for the community in which we reside, the project is a partnership between the University and the city of Mesa in which ASU contributed $35 million for interior work and digital equipment and the city of Mesa contributed $63.5 million toward the project.
• The $80 million, 150,000 gross-square-foot Health Future Center was completed in North Phoenix adjacent to the Mayo Clinic hospital, providing a location for ASU and Mayo to bring together their scientists and physicians in a state-of-the-art facility supporting biomedical scientific advancements and commercialization efforts.
• ASU in August 2022 was recognized by Forbes magazine as one of America's Best Employers, based on a survey of employees across 25 industry sectors conducted by Statista, a global polling and ranking provider. The ranking considered employee experiences regarding working conditions, compensation, potential for growth, diversity and other factors.
The Government Finance Officers Association of the United States and Canada (GFOA) awarded a Certificate of Achievement for Excellence in Financial Reporting to the University for its ACFR for the fiscal year ended June 30, 2021. The Certificate of Achievement is a prestigious national award recognizing conformance with the highest standards for preparation of state and local government financial reports. To receive a Certificate of Achievement, a report issuer must publish an easily readable and efficiently organized ACFR, and must satisfy both generally accepted accounting principles and applicable legal requirements. A Certificate of Achievement is valid for a period of one year. The University will submit its ACFR for the fiscal year ended June 30, 2022 to the GFOA and anticipates this year’s report will continue to meet the Certificate of Achievement Program's requirements.
Preparation of this ACFR in a timely manner would not have been possible without the coordinated efforts of the Financial Services Office and other University administrators, faculty and staff. In addition, the Arizona Auditor General provided invaluable assistance.
Sincerely, Morgan R. Olsen Executive Vice President, Treasurer and Chief Financial Officer Arizona State University
Presented to Arizona State University
For its Annual Comprehensive Financial Report
For the Fiscal Year Ended June 30, 2021
Executive Director/CEO
Maria Anguiano
James W. O’Brien
Chris Howard
José A. Cárdenas
Senior Vice President and General Counsel
James A. Rund
Senior Vice President for Educational Outreach and Student Services
Doug Ducey, Governor of Arizona
Kathy Hoffman, Arizona Superintendent of Public Instruction
Appointed
Lyndel Manson, Chair
Cecilia Mata, Secretary
Larry Penley, Treasurer
Fred DuVal, Chair Elect
Robert Herbold
Jessica Pacheco
Doug Goodyear
Gregg Brewster
Rachel Kanyur, Student Regent
Northern Arizona University
Katelynn Rees, Student Regent University of Arizona

 ARIZONA AUDITOR GEN ERALLINDSEY A. PERRY AUDITOR GENERAL

The Arizona Board of Regents
We have audited the accompanying financial statements of the business type activities and aggregate discretely presented component units of Arizona State University as of and for the year ended June 30, 2022, and the related notes to the financial statemen ts, which collectively comprise the University’s basic financial statements as listed in the table of contents.
In our opinion, based on our audit and the reports of the other auditors, the financial statements referred to above present fairly, in all material respects, the respective financial position of the business type activities and aggregate discretely presented component units of the University as of June 30, 2022, and the respective changes in financial position and, where applicable, cash flows thereof for the year then ended in accordance with U.S. generally accepted accounting principles.
We did not audit the financial statements of the Thunderbird Scho ol of Global Management (TSGM), the Bermuda Institute of Ocean Sciences (BIOS), and the aggregate discretely presented component units, which account for the following percentages of the assets and deferred outflows of resources, liabilities and deferred inflows of resources, revenues, and expenses of the opinion units affected:
Assets and deferred outflows
Liabilities and deferred inflows Revenues Expenses
Business type activities TSGM 0.12% 0.10% 0.17% 0.25% Business type activities BIOS 0.77% 0.18% 0.49% 0.48% Discretely presented component units 100% 100% 100% 100%
Those statements were audited by other auditors, whose reports have been furnished to us, and our opinion, insofar as it relates to the amounts included for TSGM, BIOS, or the aggregate discretely presented component units, is based solely on the other auditors’ reports.
We conducted our audit in accordance with U.S. generally accepted auditing standards and the standards applicable to financial audits contained in Government Auditing Standards, issued by the U.S. Comptroller General. Our responsibilities under those standards are further described in the auditors’ responsibilities for the audit of the financial statements section of our report. We are required to be independent of the University and to meet our other ethical responsibilities, in accordance with the relevan t ethical
requirements relating to our audit. We believe that the audit evidence we have obtained is sufficient and appropriate to provide a basis for our audit opinions. The other auditors did not audit the aggregate discretely presented component units’ financial statements, except for the ASU Preparatory Academy, Inc., in accordance with Government Auditing Standards
As discussed in Note A to the financial statements, for the year ended June 30, 2022, the University adopted new accounting guidance, Governmental Accounting Standards Board Statement No. 87, Leases. Our opinion is not modified with respect to this matter.
As discussed in Note A to the financial statements, beginning in fiscal year 2022, BIOS is reported as a blended component unit, which represents a change in the University’s reporting entity. Our opinion is not modified with respect to this matter.
As discussed in Note A to the financial statements, the University’s financial statements are intended to present the financial position, the changes in financial position, and, where applicable, cash flows of only those portions of the business type activities, major fund, and aggregate discretely presented component units of the State of Arizona that are attributable to the transactions of the University. They do not purport to, and do not, present fairly the financial position of the State of Arizona as of June 30, 2022, the changes in its financial position, or, where applicable, its cash flows for the year then ended in conformity with U.S. generally accepted accounting principles. Our opinion is not modified with respect to this matter.
Management is responsible for the preparation and fair presentation of the financial statements in accordance with U.S. generally accepted accounting principles, and for the design, implementation, and maintenance of internal control relevant to the preparation and fair presentation of financial statements that are free from material misstatement, whether due to fraud or error.
In preparing the financial statements, management is required to evaluate whether there are conditions or events, considered in the aggregate, that raise substantial doubt about the University’s ability to continue as a going concern for 12 months beyond the financial statement date, including any currently known information that may raise substantial doubt shortly thereafter.
Our objectives are to obtain reasonable assurance about whether the financial statements as a whole are free from material misstatement, whether due to fraud or error, and to issue a report that includes our opinions. Reasonable assurance is a high level of assurance but is not absolute assurance and therefore is not a guarantee that an audit conducted in accordance with generally accepted auditing s tandards and Government Auditing Standards will always detect a material misstatement when it exists. The risk of not detecting a material misstatement resulting from fraud is higher than for one resulting from error, as fraud may involve collusion, forgery, intentional omissions, misrepresentatio ns, or the override of internal control. Misstatements are considered material if there is a substantial likelihood that, individually or in the aggregate, they would influence the judgment made by a reasonable user based on the financial statements.
In performing an audit in accordance with generally accepted auditing standards and Government Auditing Standards, we:
• Exercise professional judgment and maintain professional skepticism throughout the audit.
• Identify and assess the risks of material misstatement of the financial statements, whether due to fraud or error, and design and perform audit procedures responsive to those risks. Such procedures include examining, on a test basis, evidence regarding the amounts and disclosures in the f inancial statements.
• Obtain an understanding of internal control relevant to the audit in order to design audit procedures that are appropriate in the circumstances but not for the purpose of expressing an opinion on the effectiveness of the University’s internal control. Accordingly, we express no such opinion.
• Evaluate the appropriateness of accounting policies used and the reasonableness of significant accounting estimates made by management, as well as evaluate the overall presentation of the financial statements.
• Conclude whether, in our judgment, there are conditions or events, considered in the aggregate, that raise substantial doubt about the University’s ability to continue as a going concern for a reasonable period of time
We are required to communicate with those charged with governance regarding, among other matters, the audit’s planned scope and timing, significant audit findings, and certain internal control related matters that we identified during the audit
U.S. generally accepted accounting principles require that the management’s discussion and analysis on pages 20 through 27, schedule of the University’s proportionate share of the net pension liability on page 66, schedule of the University’s proportionate share of the total OPEB liability on page 66, and schedule of University pension contributions on page 67 be presented to supplement the basic financial statements. Such information is management’s responsibility and, although no t a part of the basic financial statements, is required by the Governmental Accounting Standards Board, who considers it to be an essential part of financial reporting for placing the basic financial statements in an appropriate operational, economic, or historical context. We have applied certain limited procedures to the required supplementary information in accordance with U.S. generally accepted auditing standards, which consisted of inquiries of management about the methods of preparing the information and comparing the information for consistency with management’s responses to our inquiries, the basic financial statements, and other knowledge we obtained during our audit of the basic financial statements. We do not express an opinion or provide any assurance on the information because the limited procedures do not provide us with sufficient evidence to express an opinion or provide any assurance.
Our audit was conducted for the purpose of forming opinions on the financial sta tements that collectively comprise the University’s basic financial statements. The combining statements on pages 70 and 71 are presented for purposes of additional analysis and are not a required part of the basic financial statements. Such information is management’s responsibility and was derived from and relates directly to the underlying accounting and other records used to prepare the basic financial statements. The information has been subjected to the auditing procedures applied in the audit of the basic financial statements and certain additional procedures, including comparing and reconciling such information directly to the underlying accounting and other records used to prepare the basic financial statements or to the basic financial statements themselves, and other additional procedures in accordance with U.S. generally accepted auditing standards by us and the other auditors. In our opinion, based on our audit, the procedures performed as described above, and the reports of the other auditors, t he combining statements are fairly stated, in all material respects in relation to the basic financial statements as a whole.
Management is responsible for the other information included in the annual report. The other information comprises the introductory and statistical sections but does not include the basic financial statements and
our report thereon. Our opinions on the basic financial statements do not cover the other information, and we do not express an opinion or any form of assurance on the other information.
In connection with our audit of the basic financial statements, our responsibility is to read the other information and consider whether a material inconsistency exists between the other information and the basic financial statements, or the other information otherwise appears to be materially misstated. If, based on the work performed, we conclude that an uncorrected material misstatement of the other information exists, we are required to describe it in our report.
In accordance with Government Auditing Standards, we will issue our report on our consideration of the University’s internal control over financial reporting and on our tests of its compliance with certain provisions of laws, regulations, contracts, and grant agreements and other matters at a future dat e. The purpose of that report is solely to describe the scope of our testing of internal control over financial reporting and compliance and the results of that testing, and not to provide an opinion on the effectiveness of the University’s internal control over financial reporting or on compliance. That report is an integral part of an audit performed in accordance with Government Auditing Standards in considering the University’s internal control over financial reporting and compliance.
Lindsey A. Perry Lindsey A. Perry, CPA, CFE Auditor General October 31, 2022The Management’s Discussion and Analysis (MD&A) provides readers of Arizona State University’s financial statements an understanding of the financial position and revenue and expense activities for the year ended June 30, 2022. This discussion has been prepared by University management and should be read in conjunction with the financial statements and notes to the financial statements.
Arizona State University (ASU, University) is a knowledge enterprise committed to knowledge creation, innovation, meaningful impact to our community and global engagement. The University is comprised of an educational network of more than 800 accredited undergraduate majors, highly ranked graduate degrees, and concentrations. ASU’s fall 2021 enrollment was over 135,000 students comprised of 107,000 undergraduate students and 28,000 graduate students, including over 57,000 students participating in ASU’s renowned online degree programs. The University is classified as a state instrumentality and since fiscal responsibility for the University remains with the State of Arizona, the University is considered a part of the reporting entity for the State’s financial reporting purposes.

The University’s financial report includes three basic financial statements: the Statement of Net Position; the Statement of Revenues, Expenses, and Changes in Net Position; and the Statement of Cash Flows. Financial information for FY 2021 is included in MD&A in order to illustrate increases and decreases with FY 2022 data. The financial statements and notes along with MD&A have been prepared in accordance with generally accepted accounting principles as defined by the Governmental Accounting Standards Board (GASB) for public colleges and universities.
The University’s financial statements encompass the University and its three blended component units and six discretely presented component units. MD&A focuses only on the University and blended component units, unless otherwise stated. Information on the component units can be found in the component units’ Statement of Financial Position and Statement of Activities, as well as Note B - ASU Component Units, Note N – Summary Financial Information for ASU Component Units, and Combining Statements of the nonmajor discretely presented component units.
Effective for FY 2022, the University implemented the provisions of GASB Statement No. 87, Leases, as amended by GASB Statement No. 99, Omnibus 2022. GASB Statement No. 87 establishes a single model for lease accounting based on the foundational principle that leases are financings of the right to use an underlying asset. Concurrently, the University elected to early implement the provisions of GASB Statement No. 99, Omnibus 2022, specifically the lease-related topics in paragraphs 11-17.
Additionally, the University implemented GASB Statement No. 89, Accounting for Interest Cost Incurred before the End of a Construction Period. GASB Statement No. 89 eliminates
the practice of capitalizing interest costs incurred during the construction period of capital assets.
The University strengthened its financial foundation in FY 2022 with a $244 million increase in net position compared to a $248 million increase in FY 2021. This represents the 17th straight year in which ASU reported an increase in net position. At June 30, 2022 the University had total assets of $6.0 billion and net position of $1.9 billion. Overall, FY 2022 funding sources and uses increased at scale with both categories increasing four percent from FY 2021.
Tuition and fees are ASU’s primary revenue source (48 percent), with grants and contracts, state appropriations, financial aid grants and auxiliary enterprise activities also providing significant resources. $1.5 billion was spent on instruction related expenses in FY 2022, representing nearly one-half of the University’s total expenses. Scholarships and fellowships combined with student services expenses was the second largest expense category with $470 million in FY 2022 expenses, while research and public service expenses were $462 million, with the categories reflecting a two percent increase and five percent decrease over FY 2021, respectively.
The statement of net position presents the financial position of the University at the end of the fiscal year and reports all assets, deferred outflows, liabilities and deferred inflows, and segregates assets and liabilities into current and noncurrent categories. Assets are resources controlled by ASU that can be used to support its mission and goals. A deferred outflow of resources is a use of net position that is applicable to future reporting periods. Liabilities are obligations of the University. A deferred inflow of resources is the acquisition of net position in future periods.
The change in net position (assets plus deferred outflows of resources less liabilities less deferred inflows of resources) between years is one indicator of whether the overall financial condition of the University has improved or worsened during the fiscal year.
A summary comparison of the University’s financial position as of June 30, 2022 and June 30, 2021 follows.
FY 2022 FY 2021
Current assets $ 813.4 $ 773.1
Noncurrent assets 1,534.1 1,292.2
Noncurrent capital assets, net 3,604.7 3,227.9
Total assets $ 5,952.2 $ 5,293.2
Deferred outflows of resources $ 266.1 $ 287.0
Current liabilities $ 698.0 $ 697.1
Noncurrent liabilities 859.6 1,108.7
Noncurrent long-term obligations 2,413.3 2,133.3
Total liabilities $ 3,970.9 $ 3,939.1
Deferred inflows of resources $ 354.8 $ 31.1
Net investment in capital assets $ 1,147.4 $ 1,107.1
Restricted: Nonexpendable 104.7 91.7 Expendable 203.2 175.9 Unrestricted 437.3 235.3
Total net position $ 1,892.6 $ 1,610.0
Total assets at June 30, 2022 of $6.0 billion reflect a 12 percent increase from June 30, 2021. Current assets are used to support operations and include cash and cash equivalents, short-term investments and accounts receivables. Current assets increased $40 million between years primarily due to increased short-term investments at June 30, 2022. The University strategically invested available cash balances to maximize returns and maintain reasonable liquidity to fund short-term unforeseen obligations, as needed.
Noncurrent assets increased $619 million between years primarily due to a $377 million increase in net capital assets, a $30 million increase in endowment investments, a $184 million increase in long-term investments partially offset by a $35 million decrease in restricted cash and cash equivalents. The increase in net capital assets is attributable to an increase in right-to-use lease assets due to the implementation of GASB Statement No. 87, ongoing retrofitting of the ASU California Center at the Herald Examiner Building, tenant improvements to the Phoenix Biomedical Building (Wexford), and the new Multipurpose Arena as well as the blending of capital assets associated with BIOS, a new blended component unit of the University in FY 2022. ASU’s endowment investments increased $30 million as a result of an additional $50 million investment in ASU’s quasi-endowment partially offset by unrealized losses in endowment investments. ASU's endowment investments are managed by the ASU Foundation. Other investments increased $184 million due to rebalancing
efforts to move some mid-term investments to long-term in conformity with ASU’s overall investment strategy. Restricted cash and cash equivalents decreased $35 million due to expenditures on capital projects exceeding new restricted cash resources created by the issuance of system revenue bonds in FY 2022
Deferred outflows of resources decreased $21 million between years primary due to a decrease in other postemployment benefits (OPEB) activity due to actuarial differences between expected and actual experience as well as changes in actuarial assumptions. The overall decrease in deferred outflows of resources was partially offset by increases in pension-related actuarial differences between projected and actual earnings on pension plan investments.
Total liabilities increased $32 million for the year ended June 30, 2022 to $4.0 billion, with current liabilities increasing nominally between years primarily due to increases in unearned revenues. Unearned revenues increased due to an increase in fixed grant awards with corresponding grant revenues being received prior to all grant obligations being fulfilled resulting in the recognition of the revenue in future periods. Accounts payable decreased primarily due to timing of payments associated with accrued liabilities at year-end and the remittance of short-term custodial deposits.
Noncurrent liabilities increased $31 million between years with noncurrent lease liabilities increasing $219 million and long-term debt increasing by $61 million, largely offset by decreases in the University's allocated portion of pension and OPEB liabilities, decreasing $154 million and $89 million, respectively. Noncurrent lease liabilities increased $219 million due to the implementation of GASB Statement No. 87. Long-term debt increased due to the issuance of the 2022 system revenue bonds to fund Bateman Physical Sciences Center Improvements, Durham Language and Literature renovation, the Multipurpose Arena and various infrastructure and deferred maintenance projects. The decrease in pension liability resulted from actuarial differences between projected and actual earnings on pension plan investments as net plan assets increased substantially as of the measurement date. The decrease in the OPEB liability resulted from actuarial differences between expected and actual experience relative to economic and demographic factors, partially offset by the decrease in the discount rate from 2.45 percent as of June 30, 2020 to 1.92 percent as of June 30, 2021.
Deferred inflows of resources increased $324 million between years due to increased pension and OPEB plan deferrals due to actuarial changes in assumptions in the measurement of the plan liabilities to be recognized in future periods. Deferred inflows of resources also increased due to the implementation of GASB Statement No. 87 which resulted in deferred inflows of resources associated with leases where the University is lessor.
Net position increased $244 million between years to over $1.9 billion. ASU’s increase in net position over the last ten years has averaged $114 million annually reflecting the University’s steady growth in net position allowing the University to accumulate unrestricted net position sufficient to absorb the reduction in net position related to GASB pension plan and OPEB liability standards and still retain positive unrestricted net position to support strategic initiatives. Net position is reported as follows:
• Net investment in capital assets represents the University’s investment in capital assets such as equipment, buildings, land and infrastructure, net of accumulated depreciation and outstanding debt obligations related to those capital assets.
• Restricted-nonexpendable net position primarily represents the University’s permanent endowment funds received from donors for the purpose of creating permanent funding streams for specific programs or activities. These funds are held in perpetuity and are not available for expenditure by the University. The earnings on these funds support the programs and activities as determined by donors.
• Restricted-expendable net position is the resources which the University is legally or contractually obligated to spend in accordance with restrictions placed by donors, grantors or other external parties.
• Unrestricted net position is composed of all other funds available to ASU for purposes related to its mission. Unrestricted net position is typically designated or committed for specific academic programs, research initiatives, strategic investments or capital projects.
The statement of revenues, expenses, and changes in net position presents the University’s operating results for the fiscal year. A positive increase in net position would typically indicate the financial condition of the University has improved over the prior year. In accordance with GASB, the University recognizes certain essential revenues such as state appropriations, financial aid grants, and private gifts, as nonoperating revenues even though those revenues are used to support the University’s core instructional mission and are a significant component of the University's funding model.
FY 2022 FY 2021
Tuition and fees, net $ 1,689.8 $ 1,598.2 Research grants and contracts 416.7 364.4
Auxiliary enterprises, net 243.5 124.1
Other operating revenues 141.9 134.1
Total operating revenues $ 2,491.9 $ 2,220.8 Operating expenses 3,160.0 3,036.0
Operating loss $ (668.1) $ (815.2)
Net nonoperating revenues (expenses)
State appropriations $ 385.5 $ 306.3
Other nonoperating revenues 520.2 767.2
Nonoperating expenses (83.2) (84.4)
Income before other revenues, expenses, gains, or losses $ 154.4 $ 173.9
Capital appropriations and other revenues 89.5 74.0
Increase in net position $ 243.9 $ 247.9
Net position at beginning of year, as restated 1,648.7 1,362.1
Net position at end of year $ 1,892.6 $ 1,610.0
The difference between FY 2021 ending net position and FY 2022 beginning net position is due to the restatement of net position as a result of blending the Bermuda Institute of Ocean Sciences (BIOS). For additional information, please refer to Note A - Basis of Presentation and Significant Accounting Policies.
Operating revenues represent resources generated by the University to fulfill its instruction, research, and public service missions. Student tuition and fees, research grants and contracts, and auxiliary enterprise activities are the primary operating revenues of the University.
Operating revenues increased $271 million, or 12 percent, to $2.5 billion in FY 2022 with the most significant increases occurring in net tuition and fees, auxiliary enterprises and grants and contracts. The $92 million increase in tuition and fee revenues is primarily the result of a four percent increase in FTE enrollment, including online enrollment growth of eight percent. The University did not increase tuition rates for the second straight year in response to the challenges facing students and their families as a result of the pandemic.
Auxiliary enterprises, net, increased $119 million, or 96 percent, due to the restoration of pre-pandemic levels of operating activities. Increases in all auxiliary activities, including $38 million for Sun Devil Athletics due to increases in ticket sales and sponsorship revenues, $22 million for resumption of Gammage Broadway Series events, $20
million for dining services due to increased meal plan participation, $17 million for residential life due to increased housing demand and $12 million in parking and transit revenues as students, faculty and staff returned to campus in greater numbers when compared to the prior year. Research grants and contracts increased $52 million, or 14 percent, due to increased sponsored research award activity and the inclusion of BIOS as a blended component unit of the University.
Expenses are categorized as operating or nonoperating per GASB. The University reports operating expenses by functional category (instruction, research, etc.) in the statement of revenues, expenses, and changes in net position and displays expenses by their natural classification (personal services and benefits, supplies and services, scholarships and fellowships and depreciation) in Note I – Operating Expenses by Natural Classification.
Operating expenses increased $124 million, or four percent, in FY 2022 with the increase largely reflecting growth in instructional and auxiliary activities as well as a significant increase in depreciation and amortization expenses. Depreciation and amortization represents the largest category of expense growth, an increase of $49 million, due to the implementation of GASB Statement No. 87, which requires yearly amortization of right-to-use lease assets, with auxiliary enterprises increasing $41 million due to restored auxiliary operations across all auxiliary units as described above in the operating revenues section. Instruction and academic support increased $26 million due to increased enrollment and corresponding programmatic demands.
Pensions and OPEB expenses totaled $27 million in FY 2022 impacting all functional classifications. Pensions and OPEB expenses increased due to recognition of actuarial differences between expected and actual experience as well as changes in actuarial assumptions.
Tuition and fees, net $ 1,689.8 48% $ 1,598.2 48% 6%
Grants and contracts 678.8 20% 757.4 22% (10)%
State appropriations (includes capital appropriations) 411.5 12% 332.2 10% 24%
Financial aid grants 200.8 6% 198.4 6% 1% Auxiliary enterprises, net 243.6 7% 124.1 4% 96%
Private and capital gifts 104.9 3% 79.9 2% 31%
Sales and services 104.0 3% 93.3 3% 11% Share of state sales tax (TRIF) 44.6 1% 36.8 1% 21%
Other sources 9.2 0% 148.0 4% (94)%
Total sources $ 3,487.2 100% $ 3,368.3 100% 4%
Instruction and academic support $ 1,472.8 45% $ 1,446.5 46% 2% Research and public service 462.1 14% 485.3 16% (5)% Scholarships and fellowships and student services 470.0 15% 459.6 15% 2% Institutional support and operation of plant 328.4 10% 307.3 10% 7%
Auxiliary enterprises 225.5 7% 184.8 6% 22% Depreciation and amortization 201.3 6% 152.5 5% 32%
Interest on debt and other expenses 83.2 3% 84.4 2% (1)%
Total uses $ 3,243.3 100% $ 3,120.4 100% 4%
Due to the required classification of key revenue sources such as state appropriations, financial aid grants, and private gifts as nonoperating revenues, operating expenses will typically exceed operating revenues for public universities, resulting in an operating loss each year. Total nonoperating and capital revenues decreased $152 million between years, primarily due to a $135 million decrease in net investment returns, a $123 million decrease in nonoperating grants and contracts, and a $21 million decrease in proceeds from the sale of land, partially offset by increases of $79 million in state appropriations, $21 million in capital commitments, and $25 million in capital and private gifts. Unrealized losses on investments and endowments was partially offset by interest earnings on operating fund investments. Nonoperating grants and contracts revenues related to Higher Education Emergency Relief Funds (HEERF) of $178 million were comparable with the amount recognized in FY 2021 of $175 million, and the decrease between years for nonoperating grants is primarily due to the receipt of a one-time supplemental grant from the State of Arizona Governor’s Emergency Education Relief Fund (GEERF) of $46 million in FY 2021, and a significant reduction in testing and vaccination grant revenues from $110 million in FY 2021 to $23 million in FY 2022 associated with the Arizona Department of Health Services COVID-19 testing and vaccination services contract with the University. The increase in financial aid grants is primarily related to Pell grant activity.
A summary comparison of cash flows for the University’s FY 2022 and FY 2021 activities follows.
Condensed Summary of Cash Flows (Dollars in millions)
Cash provided by/(used for):
FY 2022 FY 2021
Operating activities $ (555.8) $ (536.2)
Noncapital financing activities 1,051.9 934.3
Capital and related financing activities (259.3) (255.5)
Investing activities (292.6) (75.1) Net increase/(decrease) in cash and cash equivalents $ (55.8) $ 67.5
Cash and cash equivalents at beginning of year 618.0 546.4
Cash and cash equivalents at end of year $ 562.2 $ 613.9
The statement of cash flows provides additional information about the University’s financial results by reporting the major sources and uses of cash and cash equivalents. Cash flows from operating activities present the net cash generated or used by the operating activities of the University. Due to the categorization of operating and nonoperating revenues and expenses by GASB, cash flows
from operating activities are typically a net cash use. Major operating funding sources include student tuition and fees, research grants and contracts, and auxiliary enterprises revenues. Operating expenses include employee salaries and bene fi ts and vendor payments for services and supplies. Net cash flows from noncapital financing activities is a major funding source for operating expenses and includes cash from state appropriations, nonoperating grants and contracts, financial aid grants, and private gifts. Cash flows from capital financing activities include all capital assets and related long-term debt activities, including proceeds from the issuance of debt, capital asset purchases, and principal and interest paid on long-term debt. Cash flows from investing activities show the net sources and uses of cash related to purchasing or selling investments and income earned on those investments.
The University is required by state statute and Arizona Board of Regents policy to prepare an annual Capital Improvement Plan (CIP). The CIP details the University’s three-year strategic plan of space use and capital investments to enable the success of current and future students and represents the University’s commitment to the people of Arizona regarding research discovery and economic development.
The CIP also outlines any plans to issue debt to finance capital acquisitions or construction to address academic, research and student programmatic needs.
Overall the University’s capital assets, net of accumulated depreciation and deletions, increased by $377 million in FY 2022, a 12 percent increase over FY 2021, due to the implementation of GASB Statement No. 87 and new capital projects and equipment acquisitions.
Significant FY 2022 new capital projects included the following:
• Tempe Classroom Office Building. This project will provide needed classroom, instructional, collaboration and office space to support the growth of academic programs that will enable student success. The facility will be located In the heart of the Tempe Campus, just west of the Hayden Library. The planned facility will replace Wilson Hall, which is currently inadequate due to age and will address the growing demand for student-centric spaces that will accommodate technology and support the evolving program needs associated with new field of learning and teaching methodologies. The new approximately 170,000 grosssquare-foot building will be comprised of classrooms of various sizes, academic office and support space, collaboration areas and student services spaces that will serve the entire university community.
• Mill Avenue Parking. This multi-level parking structure will replace an existing surface lot on a mixed-use
development site at the northwest corner of Mill Avenue and Tenth Street in Tempe. The structure will provide the parking capacity to support the academic, cultural and social activities on the Tempe campus, a new on-site hotel and conference center and future site development. The project will also include the installation of the required infrastructure to support the future addition of a thermal energy storage system under the parking structure. This infrastructure will support and integrate with the future construction of an adjacent district utility plan to provide essential utility services to campus facilities and an adjacent structure to provide needed space for university academic programs and local retail establishments.
Additional information about the University’s capital assets is presented in Note D – Capital Assets.
A summary of the University’s outstanding debt including average interest rates, final maturity and outstanding balances for its bonds, certificates of participation and financed purchases, is presented in Note E – Long-Term Debt and Lease Obligations. In March 2022, the University issued $172 million in system revenue bonds to fund the Bateman Physical Sciences Center Improvements, Durham Language and Literature renovation, the Multipurpose Arena, and other infrastructure and deferred maintenance projects.
ASU’s current bond ratings are Aa2 by Moody’s Investor Services and AA by Standard and Poor’s.
ASU has blended financial activity for three of its component units, the Bermuda Institute of Ocean Sciences, the Thunderbird School of Global Management (TSGM) and the ASU Athletic Facilities District. There was no financial activity for the ASU Athletic Facilities District during FY 2022.
For its discretely presented component units, the University presents the financial statements on separate pages from the University’s basic financial statements. These component units are reported in distinct financial statements due to their use of different financial reporting models than the University and to emphasize their separation from the University. ASU component units discretely presented in these statements are ASU Enterprise Partners (ASUEP), Arizona Capital Facilities Finance Corporation (ACFFC),
ASU Alumni Association, Arizona State University Research Park, Inc., Sun Angel Foundation, and ASU Preparatory Academy, Inc. Even though the component units support the University, they are not subsidiaries of the University.
For more information on these component units, please refer to Note B – ASU Component Units and Note N –Summary Financial Information for ASU Component Units
FY 2022 FY 2021
Cash and investments $ 1,864.3 $ 1,703.9 Capital assets, net 134.3 146.0 Receivables, net 264.8 246.7 Other assets 95.4 96.8 Total assets $ 2,358.8 $ 2,193.4
Long-term debt $ 281.0 $ 298.2 Other liabilities 509.2 490.8
Total liabilities $ 790.2 $ 789.0
Without Donor RestrictionsUnrestricted $ 286.2 $ 187.4
With Donor RestrictionsTemporarily restricted 610.3 592.7
With Donor RestrictionsPermanently restricted 672.1 624.3
Total net assets $ 1,568.6 $ 1,404.4
FY 2022 FY 2021
Contributions $ 224.3 $ 166.1 Other revenues 293.7 412.6
Total revenues $ 518.0 $ 578.7 Expenses
Payments to the benefit of ASU $ 163.7 $ 124.1 Other expenses 187.1 199.6
Total expenses $ 350.8 $ 323.7
Capital and other losses (3.0) (5.4)
Increase in net assets $ 164.2 $ 249.6
Net assets at beginning of year 1,404.4 1,154.8
Net assets at end of year $ 1,568.6 $ 1,404.4
The ASU Public Enterprise reflects the financial activity of the University and its discretely presented component units and resulted in an increase in net position/net assets at June 30, 2022 of $447 million in FY 2022, including a $283 million increase for the University and its blended component units which includes a $39 million increase due to the blending of BIOS and a $164 million increase for the discretely presented component units. Revenues for the discretely presented components units decreased $55 million, or 10 percent, between years primarily due to a $100 million decrease in net investment return, and a $43 million decrease in other revenues, partially offset by an increase in contributions of $58 million. Expenses
for the component units increased by $30 million, or nine percent, between years with increases in cash donation transfers to ASU of $32 million and management and general expenses, partially offset with decreases in other expenses. Other revenues and expenses decreased primarily due to a significant reduction in COVID-19 testing and vaccination services provided to community partners. ASU Enterprise revenues are presented as gross amounts, excluding the impact of scholarship allowances, which are presented as expenses of the ASU Public Enterprise. Financial impacts of transactions between the University and its discretely presented component units during the fiscal years presented are not eliminated in this presentation and are presented consistent with the amounts reported in the audited financial statements for each entity.
FY 2022
ASU
ASU Component Units
Total ASU
FY 2021
ASU Component Units Total
Operating, nonoperating and capital-related revenues, gross $ 4,095.4 $ 518.0 $ 4,613.4 $ 3,919.2 $ 573.3 $ 4,492.5
Operating and nonoperating expenses, including scholarship allowances 3,851.5 353.8 4,205.3 3,671.3 323.7 3,995.0
Increase in net position/net assets $ 243.9 $ 164.2 $ 408.1 $ 247.9 $ 249.6 $ 497.5 Net position/net assets at beginning of year, as restated 1,648.7 1,404.4 3,053.1 1,362.1 1,154.8 2,516.9
Net position/net assets at end of year $ 1,892.6 $ 1,568.6 $ 3,461.2 $ 1,610.0 $ 1,404.4 $ 3,014.4
The net position increase for the ASU Public Enterprise at June 30, 2022 of $447 million included increases for the University and its blended component units unrestricted net position, $202 million, net investment in capital assets, $40 million, and restricted net position, $41 million. The University’s discretely presented component unit unrestricted net assets increased by $99 million
while temporarily restricted and permanently restricted component unit net assets increased by $17 million and $48 million, respectively. Restricted net position/net assets for the ASU Public Enterprise must be spent in compliance with donor directions, and are typically restricted for use by a specific academic department or program.
End of the Year Net Position of ASU and Net Assets of ASU Component Units on a Combined Basis (Dollars in millions)
FY 2022
ASU
ASU Component Units Combined ASU
FY 2021
ASU Component Units Combined
Net investment in capital assets $ 1,147.4 $ 1,147.4 $ 1,107.1 $ 1,107.1 Unrestricted net position/net assets without donor restrictions 437.3 $ 286.2 723.5 235.3 $ 187.4 422.7
Restricted net position/net assets with donor restrictions:
Expendable/Temporarily 203.2 610.3 813.5 175.9 592.7 768.6 Nonexpendable/Permanently 104.7 672.1 776.8 91.7 624.3 716.0 Net position/net assets at end of year $ 1,892.6 $ 1,568.6 $ 3,461.2 $ 1,610.0 $ 1,404.4 $ 3,014.4
In the two decades since the implementation of President Crow’s vision for a New American University, ASU has undergone an institutional transformation to become a global leader in the discovery and delivery of knowledge, while assuming fundamental responsibility for the economic, social, cultural and overall health of the communities that it serves. The University has demonstrated that extraordinary growth at scale and simultaneous improvement in measurable performance metrics in each of its Academic, Knowledge and Learning enterprises is not only achievable, it is a necessary feature of the ASU Public Enterprise. The University has grown into an internationally-recognized leader in combining academic excellence with accessibility, a global center for interdisciplinary research of value, and a positive force for local impact and social embeddedness in the communities in which it resides.
The University has experienced market-outlier growth in enrollment, from 47,085 full-time equivalent students in Fall 2001 to 121,770 in Fall 2021 where nearly half of first-year students were students of color and over half of first-year students came from family household incomes of less than $40,000 per year. Increased accessibility is further reflected in the number of Pell grant recipients which have increased from approximately 10,000 to over 44,000, and first-generation student enrollment has tripled from 7,560 to 28,052. The University has created geographic diversity with a student body that includes 10,800 international students from 152 countries, reflecting the market presence of the University and its global demand. First-year retention rates have improved from 78.0 percent for Arizona first-year students and 76.7 percent for all first-year students to 88.7 percent for Arizona first-year students and 86.2 percent for all first year students in Fall 2021, both nearing the institutional goal of 90 percent retention rates. Graduation rates have increased from 28.4 percent to 55.8 percent for 4-Year cohort and 49.3 percent to 66.5 percent for 5-Year cohort further proving that increased accessibility to the institution does not negatively impact academic performance.
The recognition of ASU’s academic, research and public service efforts are keystones to the university’s reputation among its peers as a leader in innovation and academic quality. Recent recognition for ASU’s innovation and educational efforts from external sources include:
• #1 university in the U.S. for innovation, for the eighth year in a row; (U.S. News and World Report)
• #1 in the U.S. and #2 in the world for global impact in research, outreach and stewardship; (Times Higher Education)
• #1 public university in the U.S. chosen by international students; (Institute of International Education)
• Top 10 in U.S. patents awarded to universities; (U.S. National Academy of Investors and the Intellectual Property Owners Association)
• Top 10 in the U.S. for best online bachelor's programs; (U.S. News and World Report)
• Top 10 “Best Buy” of public universities; (Fiske Guide to Colleges)
• Top 10 in the world for employer-student connections; (QS World University Rankings)
• A top producer of Fulbright scholars for 11 consecutive years; (Chronicle of Higher Education)
• A top university for graduate education with 13 programs in the top 10 in the U.S.; (U.S. News and World Report)
Challenges continue to exist in the local and national economies with 50-year high inflation rates, particularly in the Phoenix metropolitan area which, as of September 2022, was showing the highest rate of inflation among U.S. cities at 13 percent. Significant budgetary pressures resulting from inflation, competitive wage growth, and employee recruitment and retention remain items of focus in the short-term. Multi-year challenges persist relative to enrollment as Arizona remains one of the lowest states for college attainment in part due to the lack of state-based financial aid and a lack of awareness among primary and secondary school students of financial pathways that are available to ensure that financial considerations are not a barrier to educational attainment. To meet this long-term challenge, the University is embarking on a state-wide effort to educate 8th grade resident students regarding available financial and performance pathways to college entry and provide measurable and trackable steps to enroll and succeed toward degree attainment. Due to the transformational efforts of the institution into a public enterprise, ASU is designed and well-positioned to respond to these future challenges and opportunities.
Certain information provided by the university, including written as outlined above or oral statements made by its representatives, may contain forward-looking statements as defined in the Private Securities Litigation Reform Act of 1995.
All statements, other than statements of historical facts, which address activities, events or developments that the university expects or anticipates will or may occur in the future contain forward-looking information. In reviewing such information, it should be kept in mind that actual results may differ materially from those projected or suggested in such forward-looking information. This forward-looking information is based upon various factors and was derived using various assumptions.
The university does not undertake to update forwardlooking information contained in this report or elsewhere to reflect actual results, changes in assumptions or changes in other factors affecting such forward-looking information.
Current Assets:
Cash and cash equivalents (Note C) $ 354,327
Short-term investments (Note C) 87,153
Accounts receivable, net (Note A) 350,201 Lease receivables (Note A) 3,527 Other assets 18,167
Noncurrent Assets:
Total Current Assets $ 813,375
Restricted cash and cash equivalents (Note C) $ 207,879 Endowment investments (Note C) 401,426 Other investments (Note C) 856,615
Student loans receivable, net 3,674 Lease receivables (Note A) 60,103
Other assets 4,411
Capital assets, net (Note D) 3,604,752
Total Noncurrent Assets $ 5,138,860
Total Assets $ 5,952,235
Deferred Outflows of Resources
Interest rate swap (Note F) $ 5,842
Unamortized loss on refunding debt 19,672 Pensions related (Note J) and other postemployment benefits (Note K) 240,575
Total Deferred Outflows of Resources $ 266,089
Current Liabilities:
Accounts payable and accrued liabilities $ 182,654 Compensated absences (Note H) 6,033
Unearned revenues 295,152 Funds held for others 20,412
Lease liabilities (Note E) 22,132
Current portion of long-term debt (Note E) 171,655
Total Current Liabilities $ 698,038
Noncurrent Liabilities:
Compensated absences (Note H) $ 42,455
Other liabilities 23,696
Derivative instrument - Interest rate swap (Note F) 5,842
Net Pension (Note J) and other postemployment benefits liability (Note K) 787,549
Lease liabilities (Note E) 219,448
Long-term debt (Note E) 2,193,845
Total Noncurrent Liabilities $ 3,272,835
Total Liabilities $ 3,970,873
Deferred Inflows of Resources
Unamortized gain on refunding debt $ 2,013 Pensions related (Note J) and other postemployment benefits (Note K) 289,380
Leases 63,420
Total Deferred Inflows of Resources $ 354,813
Net investment in capital assets $ 1,147,404 Restricted (Total of $307,940):
Nonexpendable: Student aid 87,652 Academic department uses 17,077
Expendable: Student aid 81,345 Academic department uses 115,207 Debt service 6,659
Unrestricted (Note G) 437,294
Total Net Position $ 1,892,638
See Notes to Financial Statements.
June 30, 2022 (Dollars in thousands)
Cash and cash equivalents $ 75,755 Pledges receivables, net 179,481 Other receivables, net 85,297
Investments in securities 1,708,233 Other investments 80,324 Other assets 46,688
Net investment in direct financing leases 48,679 Property and equipment, net 134,360
Total Assets $ 2,358,817 Liabilities
Accounts payable and accrued liabilities $ 60,724 Deferred revenue 16,128
ASU endowment trust liability 384,081 Other liabilities 48,277
Long-term debt 280,940
Total Liabilities $ 790,150
Without Donor Restrictions - Unrestricted $ 286,211
With Donor Restrictions - Temporarily restricted 610,393
With Donor Restrictions - Permanently restricted 672,063
Total Net Assets $ 1,568,667
See Notes to Financial Statements.
Year ended June 30, 2022 (Dollars in thousands)
Student tuition and fees, net of scholarship allowances of $586,481
$ 1,689,832 Research grants and contracts, including $310,570 in federal funding and $93,949 in nongovernmental funding 416,703
Sales and servicesAuxiliary enterprises, net of scholarship allowances of $21,760 243,554 Educational departments 103,957 Other revenues 37,918
Total Operating Revenues $ 2,491,964
Educational and generalInstruction $ 1,076,407
Research 414,259
Public service 47,842
Academic support 396,339
Student services 176,664
Institutional support 212,285 Operation and maintenance of plant 116,116
Scholarships and fellowships 293,349
Auxiliary enterprises 225,493 Depreciation and amortization 201,287
Total Operating Expenses $ 3,160,041
Operating Loss $ (668,077)
Nonoperating Revenues (Expenses)
State appropriations $ 385,527
Share of state sales tax - technology and research initiatives fund 44,600
Financial aid grants, including $200,504 in federal funding 200,843 Grants and contracts, including $218,898 in federal funding, $26,904 in state funding and $9,575 in nongovernmental funding 256,969
Private gifts 76,602
Net investment loss (58,838) Interest on debt (76,122) Other expenses (7,102)
Net Nonoperating Revenues $ 822,479
Income Before Other Revenues and Gains $ 154,402
Capital appropriations - Research Infrastructure and University Capital Infrastructure $ 25,985 Capital commitments, including Arizona Lottery revenue of $8,925 30,122
Capital private gifts 28,290
Capital grants 5,120
Additions to permanent endowments 27
Increase in Net Position $ 243,946
Net Position at Beginning of Year, as restated (Note A) 1,648,692
Net Position at End of Year $ 1,892,638
See Notes to Financial Statements
Year ended June 30, 2022 (Dollars in thousands)
Contributions $ 21,524 $ 152,502 $ 50,259 $ 224,285
Rental revenues 29,783 29,783 Sales and services 48,632 48,632
Net investment return 85,668 18,472 (3,860) 100,280
Net assets released from restrictions 156,115 (157,435) 1,320
Grants and aid 72,007 5,889 77,896
Other revenues 36,866 293 37,159
Total Revenues $ 450,595 $ 19,721 $ 47,719 $ 518,035 Expenses
Payments to the benefit of ASUCash donation transfers to ASU $ 132,502 $ 132,502 Vendor payments 7,523 7,523 Scholarship fund transfers to ASU 14,202 14,202 Rent payments to ASU 9,467 9,467
Management and general 148,870 148,870
Interest expense 8,576 8,576 Depreciation/amortization 12,077 12,077
Other expenses 17,553 17,553
Total Expenses $ 350,770 $ 350,770
Increase in Net Assets, before Losses $ 99,825 $ 19,721 $ 47,719 $ 167,265
Loss on Uncollectible Pledges (2,074) (2,074) Loss on Disposal of Assets (978) (978) Increase in Net Assets, after Losses $ 98,847 $ 17,647 $ 47,719 $ 164,213
Net Assets at Beginning of Year 187,364 592,746 624,344 1,404,454 Net Assets at End of Year $ 286,211 $ 610,393 $ 672,063 $ 1,568,667
See Notes to Financial Statements.
Year ended June 30, 2022 (Dollars in thousands)
Student tuition and fees $ 1,654,167
Research grants and contracts 412,536
Sales and services of auxiliary enterprises 249,413
Sales and services of educational activities 105,746
Payments for employees’ salaries and benefits (1,649,237)
Payments to vendors for supplies and services (1,017,199)
Payments for scholarships and fellowships (283,253)
Funds held for others received 292,432
Funds held for others disbursed (350,688)
Other receipts 30,296
Net cash used for operating activities $ (555,787)
State appropriations $ 385,527
Share of state sales tax - technology and research initiatives fund 42,500
Grants and contracts 547,568
Private gifts for other than capital purposes 75,957
Direct lending program receipts 649,948
Direct lending program disbursements (649,635)
Net cash provided by noncapital financing activities $ 1,051,865
Capital appropriations - Research Infrastructure and University Capital Infrastructure $ 25,985
Capital commitments and Build America Bonds - federal subsidy 33,085
Capital gifts and grants 31,369
Proceeds from issuance of capital debt 189,904
Purchases of capital assets (336,522)
Principal paid on capital debt and leases (106,804) Interest paid on capital debt and leases (96,307)
Net cash used for capital and related financing activities $ (259,290)
Purchases of investments (311,565)
Interest received on investments 18,939
Net cash used for investing activities $ (292,626)
Net decrease in cash and cash equivalents (55,838)
Cash and cash equivalents at beginning of year, as restated 618,044 Cash and cash equivalents at end of year $ 562,206
Reconciliation of operating loss to net cash used for operating activities:
Operating loss $ (668,077)
Adjustments to reconcile operating loss to net cash used for operating activities: Depreciation and amortization 201,287
Miscellaneous nonoperating expenses (6,276)
Changes in assets, deferred outflows of resources, liabilities and deferred inflows of resources: Net pension and other postemployment benefits liability (242,958)
Deferred outflows of resources related to pensions and other postemployment benefits 9,742
Deferred inflows of resources related to pensions and other postemployment benefits 260,458
Receivables, net (72,809)
Accounts payable and accrued liabilities (72,395)
Unearned revenues 37,983
Compensated absences (1,428) Funds held for others 4,540
Other assets (5,854)
Net cash used for operating activities $ (555,787)
Unrealized loss on investments and endowments (78,370)
Amortization of bond premiums and discounts 23,961
See Notes to Financial Statements.
June 30, 2022
The accounting policies of Arizona State University (ASU, University) conform to U.S. generally accepted accounting principles applicable to public institutions engaged only in business-type activities adopted by the Governmental Accounting Standards Board (GASB).
Arizona State University is one of the largest public research universities in the United States under a single administration. Located on four campuses across metropolitan Phoenix, ASU had fall 2021 enrollment of 135,753 student s The accompanying statements of the University include the activity of the Tempe campus, West campus (located in northwest Phoenix adjacent to Glendale), Polytechnic campus (located in Mesa) and the Downtown Phoenix campus, and the University’s online degree programs, as well as its component units. Information on component units can be found in Note BASU Component Units and Note N - Summary Financial Information for ASU Component Units.
For financial reporting purposes, the University’s portion of the statements includes those funds directly controlled by the University. Control by the University is determined on the basis of financial accountability. The University is classified as a state instrumentality. Since fiscal responsibility for the University remains with the State of Arizona, the University is considered a part of the reporting entity for the State’s financial reporting purposes.
The accompanying financial statements of the University include a statement of net position; a statement of revenues, expenses, and changes in net position; and a statement of cash flows, each of which provide a comprehensive, entity-wide perspective of the University. The statement of net position provides information about the assets, deferred outflows of resources, liabilities, deferred inflows of resources, and net position of the University at the end of the fiscal year. Assets and liabilities are classified as either current or noncurrent. Net position is classified according to external donor restrictions, or availability of assets to satisfy the University’s obligations. The statement of revenues, expenses, and changes in net position provides information about the University’s financial activities during the fiscal year. Revenues and expenses are classified as either operating or nonoperating, and all changes in net position are reported, including capital additions and additions to endowments. The statement of cash flows provides information about the University’s sources and uses of cash and cash equivalents during the year. Increases and decreases in cash and cash equivalents are classified as operating, noncapital financing, capital and related financing, or investing activities.
For financial reporting purposes under GASB, the University is considered a public institution engaged only in business-type activities. Accordingly, the University’s financial statements have been presented under the economic resources measurement focus and the accrual basis of accounting. The economic resources measurement focus emphasizes the long-term effects of operations on overall net resources (i.e., total assets, total deferred outflows of resources, total liabilities, and total deferred inflows of resources). The statement of revenues, expenses, and changes in net position prepared using the economic resources measurement focus includes only transactions and events that increase or decrease net position during the year. Under the accrual basis, revenues are recognized when earned and expenses are recorded when an obligation has been incurred, or benefit has been received. All significant intra-university transactions have been eliminated.
The following new GASB Statements were effective for the current year:
GASB Statement No. 87, Leases, as amended by GASB Statement No. 99, Omnibus 2022. GASB Statement No. 87 establishes criteria for lease accounting to better meet the information needs of users by improving and standardizing the reporting of leases by governmental entities. The standard establishes a single model based on the foundational principle that leases are financings of the right to use an underlining asset. As a result, the University's financial statements have been modified to reflect the recognition of certain lease assets and liabilities for leases that were previously classified as operating leases and recognized as inflows or outflows of resources based on the contract payment provisions. Additional information on the impact of this statement can be found in Note D – Capital Assets and Note E – Long-Term Debt and Lease Obligations. The University elected to implement the lease-related topics, paragraphs 11-17, of GASB Statement No. 99.
GASB Statement No. 89, Accounting for Interest Cost Incurred before the End of a Construction Period , establishes accounting requirements for interest cost incurred before the end of a construction period, enhances the relevance and comparability of information about capital assets and the cost of borrowing for a reporting period and simplifies accounting for certain interest costs. Prior to the issuance of GASB Statement No. 89, interest incurred during the construction phase of projects was capitalized, net of interest earned on the invested proceeds over the same period.
Bermuda Institute of Ocean Sciences (BIOS)
BIOS, a New York nonprofit organization and unit of the ASU Global Futures Laboratory, was acquired by the
University in October 2021. For FY 2022, BIOS is reported as a blended component unit under the criteria of GASB Statement No. 61, The Financial Reporting Entity: Omnibus – an amendment of GASB Statements No. 14 and No. 34, and GASB Statement No. 90, Majority Equity Interests, an amendment of GASB Statements No. 14 and No. 61, and included in the University’s financial statements. BIOS primarily exists to benefit the University by providing an Atlantic Ocean hub for research and instructional activities.
The inclusion of BIOS as a blended component unit of the University resulted in the following restatement to the University’s net position reported as of June 30, 2021 (Dollars in thousands):
Net position at June 30, 2021, as previously reported $1,610,015 BIOS blending adjustments 38,677 Net position at July 1, 2021, as restated $1,648,692
The impact of blending BIOS resulted in an increase to the University’s net position.
Implementation of GASB Statement No. 87 resulted in a restatement of beginning capital assets and associated accumulated depreciation at July 1, 2021 in Note D –Capital Assets, regarding the University’s 20-year lease with ASUF DC, LLC, an Arizona limited liability company, whose sole member is the University Realty LLC, whose sole member is ASU Enterprise Partners, for the multi-use office building in Washington, D.C. that was previously accounted for as a capital lease. The original asset value and associated amortization is presented in the beginning right-to-use lease assets balance at July 1, 2021. Additionally, the University's beginning liability balance was restated from FY 2021. For additional information, please see Note E - Long-Term Debt and Lease Obligations. There was no impact to the University’s net position as a result of this restatement within net capital assets.
Cash and cash equivalents. In accordance with GASB Statement No. 9, Reporting Cash Flows of Proprietary and Nonexpendable Trust Funds and Governmental Entities
That Use Proprietary Fund Accounting, all highly liquid investments with an original maturity of three months or less, are considered to be cash and cash equivalents. Funds invested in money market funds or through the State Treasurer’s Local Government Investment Pool are also considered cash equivalents. In accordance with GASB, all restricted cash and cash equivalents, including funds held by a bond trustee, are shown as noncurrent cash and cash equivalents.
Endowment Spending Rate Policy. Arizona State law permits the University to expend the entire net appreciation of endowment fund investments. When determining the spending rate for endowment funds, the University administration considers long and short-term needs, total investment return and price level trends, and general economic conditions. For FY 2022, the spending rate utilized the constant growth formula which increases spending distributions by the trailing one-year inflation rate (as measured by CPI-U, Consumer Price Index for all Urban Consumers) mid-fiscal year, as long as distributions do not exceed 4.25 percent or fall below 3.25 percent of the trailing 12-quarter average market value of each endowment fund. The inflation rate used was 7.0 percent for FY 2022.
Investments. Short-term, endowment, and other investments are stated at fair value at June 30, 2022. Fair value typically is the quoted market price for investments. Investment returns include realized and unrealized gains and losses on investments.
Accounts receivable. Total accounts receivable at June 30, 2022 were $350.2 million. Included in the receivables balance are $137.3 million related to tuition and fee payments due from students and others making payments on behalf of students. Additionally, there are $178.9 million in receivables from grant and contract sponsors primarily for the reimbursement of allowable expenses made pursuant to the University’s grants.
Student loans receivable. Loans receivable from students bear interest primarily at 5 percent and are generally repayable in installments to the University over a ten-year period commencing nine months from date of separation from the University. Student loans receivable is recorded net of an allowance for estimated uncollectible amounts and related collection costs.
Capital assets. Capital assets are recorded at cost at the date of acquisition. Capital assets that are gifted to the University are recorded at acquisition value at the date of donation. The University’s capitalization policy includes all equipment and works of art and historical treasures with a unit cost of $5,000 or more. In addition, all equipment under a unit cost of $5,000 purchased in bulk for a newly constructed, acquired, or leased facility to become initially operational is also capitalized on a vintage concept basis and depreciated over five years. All library resources acquired for use in University libraries are capitalized as a collection. Intangible assets with a unit price of $5,000,000 or more are capitalized. Right-to-use lease assets of $500,000 or more are subject to lease accounting. New construction, as well as renovations to buildings, infrastructure, and land acquisitions and improvements that have a project cost of at least $100,000 are capitalized. Non-capital equipment and facility costs, routine repairs, and maintenance are charged to operating expenses in the year in which the expense was incurred.
Depreciation is computed using the straight-line method over the estimated useful lives of the assets, generally 40 years for non-research buildings and infrastructure, 10 to 50 years for research buildings, 10 years for library resources, 7 years for intangible assets, and 5 to 12 years for equipment. Right-to-use leased assets are amortized on a straight-line basis over the shorter of the lease term or useful life of the asset. For additional information, please see Note D - Capital Assets. The University does not depreciate works of art and historical treasures that are considered inexhaustible and are held for exhibition, education, research, and public service.
The University utilizes the componentized depreciation method for its research buildings, which is consistent with the method used for government cost-reimbursement purposes. Under the componentized depreciation method, building costs are segregated into component categories with useful lives ranging from 10 to 50 years, and depreciated on a straight-line method basis.
Compensated absences. Compensated absences are employee vacation leave balances earned but not used at fiscal year end. Vacation leave benefits are accrued as a liability on the statement of net position and reported as an expense in the statement of revenues, expenses, and changes in net position.
Unearned revenues. Unearned revenues consist primarily of student tuition and fees and sponsored grants activities related to the ensuing year. Also included are amounts received from athletic and cultural events which have not yet been earned.
Pensions. For purposes of measuring the net pension liability, deferred outflows of resources and deferred inflows of resources related to pensions, and pension expense, information about the pension plan’s fiduciary net position and additions to or deductions from the plan’s fiduciary net position have been determined on the same basis as they are reported by the plan. For this purpose, benefit payments (including refunds of employee contributions) are recognized when due and payable in accordance with the benefit terms. Investments are reported at fair value.
Other postemployment benefits (OPEB). For purposes of measuring the OPEB liability, deferred outflows of resources and deferred inflows of resources related to OPEB, and OPEB expenses, information about the OPEB plans and additions to or deductions from have been determined on the same basis as they are reported by the plans.
Leases. The University, as lessee, leases real estate and equipment and determines the classification of the lease at commencement of the contract. For leases that have a maximum possible term of 12 months or less at commencement, assuming all possible lease extensions contemplated in a given lease, the University recognizes an outflow of resources based on the provisions of the
contract. For all leases in excess of 12 months and that do not have mutual termination provisions, does not transfer the asset to the University at the term of the lease, and is an exchange or exchange-like transaction, the University recognizes a right-to-use lease asset and a corresponding lease liability. The lease liability is measured at commencement of the lease based on the present value of the future minimum lease payments expected to be made. The lease liability is reduced by the principal portion of the payments made with a corresponding interest expense component. The right-to-use lease asset is initially measured at the value of the lease liability, less any payments made prior to lease commencement plus direct costs incurred to place the asset into service, less any incentives received prior to commencement.
Key estimates and judgements include the determination of the discount rate used to calculate the present value of the lease payments, the lease term and the lease payments. The University utilizes the rate implicit in the lease when it is readily determinable, otherwise the University employs professional judgement to determine the best estimate, generally derived from the incremental borrowing rate based on the University's most recent taxable debt issuance.
The University’s threshold for lease accounting, as both the lessee and lessor, is for all leases where the present value of the minimum lease payments is $500,000 or more for both equipment and real property.
The University, as lessor, leases real estate and equipment to third parties and determines the classification of the lease at commencement of the contract. For leases where the University is the lessor, a lease receivable and deferred inflow of resources is recognized at the inception of the lease. The lease receivable is recorded at the present value of the future payments using the stated rate in the lease or, if not readily determined, at the University’s incremental borrowing rate utilizing professional judgment as described above. Over the lease term, the University recognizes revenue from interest income and the amortization of the deferred inflow of resources on a straight-line basis.
During FY 2022, the University recorded $3.5 million in current lease receivables and $60.1 million in non-current lease receivables. The University recognized lease-related revenues of $3.7 million.
Net investment loss. Net investment loss is composed of interest, dividends, and net changes in the fair value of applicable investments.
Derivative instrument - Interest rate swap. In accordance with GASB Statement No. 53, Accounting and Financial Reporting for Derivative Instruments, the University records the hedging derivative instrument on the statement of net position by presenting a liability for the fair value of the derivative instrument at fiscal year end and a deferred outflow of resources.
Net position. The University’s net position is classified based on the following three categories:
• Net investment in capital assets: includes capital assets, net of accumulated depreciation and outstanding principal balances of debt and lease obligations attributable to the acquisition, construction, or improvement of those assets.
• Restricted:
• Nonexpendable – gifts that have been received for endowment purposes, the corpus of which cannot be expended, and the balance in the Perkins Loan program.
• Expendable – gifts, grants, contracts, earnings on endowments, expendable gifts that have been received for endowment purposes and other resources that have been externally restricted for specific purposes.
• Unrestricted: all other resources, including those designated by management for specific purposes. Substantially all unrestricted resources are designated for academic and research programs, strategic investments and capital projects.
When an expense is incurred that can be paid from either restricted or unrestricted resources, the University’s policy is to allow the department incurring the expense to determine the appropriate funding source. Factors used by departments to determine which resources to use include relative priorities of the department in accordance with the University’s strategic initiatives, externally imposed matching requirements of certain restricted funds, and any pertinent lapsing provisions of the available restricted or unrestricted funding resources. Major capital purchases are regularly split-funded from multiple restricted and unrestricted funding sources.
Revenues/Expenses. Revenues and expenses are classified as operating or nonoperating. Operating expenses are those incurred in conducting the primary programs and services of the University. Operating revenues generally result from exchange and exchangelike transactions. Accordingly, revenues derived from tuition and auxiliary charges are considered to be operating revenues. In addition, grants and contracts for the purposes of providing research are considered operating revenues because of the exchange and exchange-like nature of these activities (i.e., financial assistance is provided to acquire property or activity for the government’s direct benefit). Other revenues, such as state appropriations, gifts and non-research grants and contracts not generally generated from exchange transactions, are considered to be nonoperating revenues.
Nonexchange grants and contracts include those for the purpose of student financial aid, primarily Pell financial aid grants, and those for purposes other than organized
research, since the providers of these grants and contracts do not typically receive direct benefits, of equal or significant value, for those grants and contracts. Operating expenses, in accordance with GASB Statement No. 35, Basic Financial Statements—and Management’s Discussion and Analysis—for Public Colleges and Universities—an amendment of GASB Statement No. 34, include salaries, wages, benefits, supplies, services, and depreciation and amortization of capital assets, irrespective as to whether the revenues associated with these expenses are operating or nonoperating revenues. Other expenses, such as interest expense on debt, are considered to be nonoperating expenses.
Scholarship allowances. Student tuition and fee revenues and other student related auxiliary revenues are reported net of scholarship allowances in the statement of revenues, expenses, and changes in net position. Scholarship allowances are the difference between the stated charge for services provided by the University, and the amount that is paid by the students (and/or third parties making payments on a student’s behalf). To the extent that revenues from programs such as Pell grants and University funded scholarships are used to satisfy tuition and fees, and other student charges, the University has recorded a scholarship allowance.
Not included in scholarship allowances is $24.9 million in faculty and staff tuition waivers that are recorded as program expenses on the statement of revenues, expenses, and changes in net position and as personal services and benefits expenses, in Note I - Operating Expenses by Natural Classification
Share of state sales tax - technology and research initiative fund (TRIF). As the governing board of the three state universities, the Arizona Board of Regents (ABOR) administers the portion of the Education 2000 (Proposition 301) sales tax which funds the universities’ TRIF initiatives. ABOR receives funding requests from each university and determines the amount and duration of awards. The Governor and the Legislature receive an annual report from ABOR which includes a detailed set of performance measures used to determine the overall effectiveness of each TRIF funded initiative.
The University earned FY 2022 credit card rebates of $1.1 million from JP Morgan, $0.4 million from Commerce Bank, and travel card rebates of $0.2 million from U.S. Bank.
ASU’s component units are separate legal entities controlled and governed by independent boards of directors whose goals are to support the University or have a close affiliation with the University. Even though these organizations support the University or have a close affiliation with the University, they are not subsidiaries of the University and, with the exception of the Bermuda Institute of Ocean Sciences, the Thunderbird School of Global Management and the ASU Athletic Facilities District, they are neither directly nor indirectly controlled by the University. The University does not have ownership of the financial and capital resources or assets of the component units and does not have the authority to mortgage, pledge, or encumber the assets of these organizations.
Component units can be defined as legally separate entities for which the University is considered to be financially accountable. GASB Statement No. 14, The Financial Reporting Entity and GASB Statement No. 61, The Financial Reporting Entity: Omnibus an Amendment of GASB Statement Nos. 14 and No. 34, have set forth criteria to be considered in determining financial accountability. For organizations that previously were required to be included as component units by meeting the fiscal dependency criterion under GASB Statement No. 14, a financial benefit or burden relationship also would need to be present between the primary government and the organization for it to be included in the reporting entity as a component unit. Further, for organizations that do not meet the financial accountability criteria for inclusion as component units but that, nevertheless, should be included because the primary government’s management determines that it would be misleading to exclude them. GASB Statement No. 61 clarifies the manner in which that determination should be made and the types of relationships that generally should be considered in making that determination.
GASB Statement No. 39, Determining Whether Certain Organizations Are Component Units an amendment of GASB Statement No. 14, provides additional criteria for determining whether certain organizations are component units. GASB Statement No. 80, Blending Requirements for Certain Component Units - an Amendment of GASB Statement No. 14, amends the blending requirements for component units that are incorporated as a not-for-profit corporation in which the primary government is the sole corporate member.
Organizations that are legally separate, tax-exempt entities and that meet all of the following criteria should also be considered component units, with discrete presentation. These criteria are (1) the economic resources received or held by the separate organization are entirely or almost entirely for the direct benefit of the University, its component units, or its constituents; (2) the University or its component units, is entitled to, or has the ability to otherwise access, a majority of the economic resources received or held by
the separate organization; (3) the economic resources received or held by an individual organization that the University, or its component units, is entitled to, or has the ability to otherwise access, are significant to the University; and (4) the component unit is organized as a not-for-profit corporation in which the primary government is the sole corporate member, as identified in the entity's articles of incorporation and bylaws.
Financial statements of these component unit organizations are audited by independent auditors. All of the component units except for the Bermuda Institute of Ocean Sciences have a fiscal year end of June 30, 2022. The Bermuda Institute of Ocean Sciences operates on a calendar year and has a fiscal year end of December 31, 2021. Because the University’s discretely presented component units use a nongovernmental generally accepted accounting principles (GAAP) reporting model, the University has chosen to present the discretely presented component units’ aggregated financial information on pages separate from the financial statements of the University. To obtain individual audited financial statements for any of the University’s component units, please contact ASU Financial Services at (480) 965-3601.
The Bermuda Institute of Ocean Sciences (BIOS), a New York nonprofit corporation, is reported as a blended component unit and included in the University’s financial statements. BIOS primarily exists to benefit the University by providing an Atlantic Ocean hub for research and instructional activities. The University directs the activities of BIOS through the BIOS Board of Trustees and through its integration into the operation of the ASU Julie Ann Wrigley Global Futures Laboratory. BIOS holds assets that are material to its overall financial position, primarily the BIOS campus and its research boat fleet, which are all controlled and managed by the University and used to support the University’s research and academic programs.
The Thunderbird School of Global Management (TSGM), an Arizona nonprofit corporation, is reported as a blended component unit and included in the University’s financial statements. TSGM primarily exists to benefit the University by providing a platform for global education programming.
The ASU Athletic Facilities District (AFD), a component unit of the University, is reported as a blended component unit and included in the University’s financial statements. The AFD is a university athletic facilities district formed pursuant to the provisions of Arizona Revised Statutes (A.R.S.) Title 48, Chapter 26. The AFD supports the University’s efforts to construct, reconstruct, finance, furnish, maintain and improve intercollegiate athletic facilities located on
ASU’s property, including utilities, roads, parking areas or buildings necessary for full use of the athletic facilities. The AFD resides within the Novus Innovation Corridor. Separate financial statements for the AFD are not available as of June 30, 2022, as there was no financial activity.
Arizona State University’s discretely presented component units, all Arizona nonprofit corporations, include two major component units, ASU Enterprise Partners (ASUEP) and the Arizona Capital Facilities Finance Corporation (ACFFC), and several smaller component units listed below. The University has determined that ASUEP and ACFFC are major component units based on an evaluation of (1) services provided by the component unit to the University are such that separate reporting as a major component unit is considered to be essential to financial statement users, (2) significant transactions with the University, or (3) significant financial benefit or burden relationship with the University.
A description of the University’s discretely presented component units and the basis for including each as a component unit in the University’s financial report follows.
• ASU Enterprise Partners (ASUEP) - disburses resources at the discretion of its independent board of directors, in accordance with donor directions and ASU Enterprise Partners policy. The majority of assets held by the ASU Enterprise Partners are endowments restricted for donor specified programs and purposes, the principal of which may not be spent. The directors of the ASU Enterprise Partners make all decisions regarding the ASU Enterprise Partners business affairs, including distributions made to the University. Affiliates of ASUEP include: Arizona State University Foundation for a New American University (ASU Foundation), ASU Research Enterprise, Enterprise Collaboratory at ASU and Subsidiaries (formally known as Research Collaboratory at ASU), Skysong Innovations (formally known as Arizona Science and Technology Enterprises, LLC), University Realty LLC and ASUEP Holdings, LLC. In FY 2022, the ASU Enterprise Partners distributed $123.7 million in cash donation transfers to the University.
• ASU Alumni Association - receives funds primarily through donations, dues, and affinity partners, which are used to promote the welfare of the University and its alumni.
• Sun Angel Foundation - receives funds primarily through donations and contributes funds to the University in support of various athletic programs.
The three component units above meet all of the criteria for a legally separate, tax-exempt organization to be reported discretely as a component unit. The economic resources held by these component units are for the direct benefit of
the University and the University has the ability to access their economic resources and the economic resources of these component units are significant to the University.
• Arizona Capital Facilities Finance Corporationprovides facilities for use by students of the University or the University itself.
• Arizona State University Research Park, Inc. (Park) - manages a research park to promote and support research activities, in coordination with the University. In developing the research park, the Park has issued bonds guaranteed by the University.
Per GASB Statement No. 14, as amended by GASB Statement No. 61, a fiscal dependency and financial benefit/burden exists between the University and these two component units. ACFFC and the Park do not meet the blending requirements since each component unit has a separate board of directors, services provided by the component units do not exclusively benefit the University and the total debt outstanding of the component units is not expected to be paid entirely or almost entirely with University resources.
ASU Preparatory Academy, Inc. (ASU Prep) - prepares Arizona K-12 students for success with a universityembedded academic program that empowers them to complete college, compete globally and contribute to their communities.
The University is able to impose its will on the entity and the University appoints the voting majority of its board. Additionally, a fiscal dependency and financial benefit/ burden exists between the University and ASU Prep. ASU Prep does not meet the blending requirements in GASB Statement No. 14, as amended by GASB Statement No. 61, since its board of directors is not substantively the same as ASU, the services it provides do not exclusively benefit the University, any outstanding debt of the entity is not expected to be repaid from University resources and the University is not the sole corporate member of the entity.
For financial reporting purposes at the University level, only the discretely presented component units’ statement of financial position and statement of activities are included in the University’s financial statements as required by generally accepted accounting principles for public colleges and universities.
The University’s deposits and investments are discussed below in our analysis of deposit and investment risk, as required by GASB Statement No. 40, Deposit and Investment Risk Disclosures—an amendment of GASB Statement No. 3 ; and fair value of investment assets, as required by GASB Statement No. 72, Fair Value Measurement and Application
Included in the University’s deposits and investments are $207.9 million in capital projects and bond debt service funds, which are held in trust and invested with the bond trustee, $354.3 million in cash and cash equivalents, and $943.8 million in short-term and other investments. In addition, of the $401.4 million in endowment funds, $383.6 million is managed by the ASU Foundation and $17.8 million is part of the Bermuda Institute of Ocean Sciences (BIOS), Inc. endowment. The funds managed by the ASU Foundation, an Arizona nonprofit corporation, are held in pooled endowment funds under a service contract with the ASU Foundation and invested in the ASU Foundation Long Term Investment Pool and the Sustainable Responsible Impact Pool (Pool). The BIOS endowment funds are currently administered through Commonfund Global MultiAsset Portfolio.
The ASU Foundation is responsible for oversight establishing investment policies and management of the Pool. The endowment assets managed by the ASU Foundation are maintained separately on the financial system of the ASU Foundation and receive a proportional share of the Pool activity. As such, the ASU Foundation owns the assets of the Pool; the University has an interest in the Pool, which is considered an external investment pool to the University. The Pool invests in a variety of asset classes, including common stocks, fixed-income, foreign investments, private equity and hedge funds. The ASU Foundation Endowment Pool is not registered with the
Securities and Exchange Commission as an investment company.
The ASU Foundation Board of Directors-appointed Investment Committee, which includes members of the ASU Foundation Board of Directors, is responsible for oversight of the Pool in accordance with ASU Foundation and ASU Enterprise Partners policies. The fair value of the University’s position in the Pool is based on the University’s proportionate share of the Pool, which is marked-to-market monthly. For additional information refer to Note NSummary Financial Information for ASU Component Units.
The University also participates in the Arizona Student Financial Aid Trust, which was established by the Arizona Board of Regents (ABOR) and is funded by the Arizona State Legislature and student fees.
For nonendowment (operating) funds, Arizona Revised Statutes (Statutes) requires that deposits of the University not covered by federal deposit insurance be secured through participation in the State of Arizona Collateral Pool administered by the State Treasurer’s Office which holds pledged collateral of at least 102 percent of uninsured deposits in eligible depositories. Further policy regarding deposits is provided by the Arizona Board of Regents. The Statutes do not specifically address investment policy of the universities, rather ABOR policy governs in this area. ABOR policy requires that each university arrange for the safekeeping of securities by a bank or other financial institutions approved by ABOR. ABOR and University investment policies applicable to University investments are consistent with the Arizona State Treasurer’s authorizing statutes and investment policy. Investment of capital project funds are governed by the financing indenture agreements. With regard to endowments, ABOR policy dictates that these funds are to be invested under the direction of an investment committee designated by the president of each university.
Investment Description
Standard and Poor’s
AAA/AAAm/ AAAf A-1+/SP-1+ AA A-1/SP-1 A BBB <BB
Money market mutual funds $ 546,280 $ 546,280 Corporate bonds 391,004 $ 4,650 1,743 $ 3,378 $ 160,715 $ 219,272 $ 1,246
Asset backed securities 68,212 14,736 45,346 6,952 1,178
Federal agency securities 34,203 34,203
Municipal bonds 25,500 2,707 543 11,781 8,488 1,981
Mortgage backed securities 24,417 21,810 2,607
Certificate of Deposit 2,226 1,906 320
State of Arizona LGIP (Pool 5) 1,588 1,588
Commercial paper 497 497
Total $ 1,093,927 $ 46,306 $ 598,107 $ 56,314 $ 169,523 $ 222,431 $ 1,246
At Arizona State University, the Investment Committee is responsible for advising on the definition, development and implementation of investment objectives, policies, and restrictions. However, if donors restrict the investments, ABOR policy requires that the University invest those funds separately as directed by the donor, and the individual endowments bear all changes in value.
ABOR policy addresses requirements for concentration of credit risk and interest rate risk, but neither ABOR policy nor the Statutes include any specific requirements on foreign currency risk for investments of the universities. The State of Arizona Board of Investment provides oversight for the State of Arizona Treasurer’s pools. The fair value of a participant’s portion in the pool approximates the value of that participant’s pool shares and the participant’s shares are not identified with specific investments.
Custodial Credit Risk. University policy for its operating funds requires collateralization for all certificates of deposit and repurchase agreements. Beyond this requirement and those established by Statute or ABOR, the University does not have a policy that specifically addresses custodial credit risk.
Credit Risk. With regard to credit risk, ABOR policy requires that negotiable certificates of deposit, corporate bonds, debentures and notes, bankers acceptances and State of Arizona bonds carry a minimum BBB or better rating from Standard and Poor’s Rating Service or Baa or better rating from Moody’s Investors Service at the time of purchase and that the investment will be sold in an orderly manner or held until maturity without further investments being made if it falls below this credit rating; and that commercial paper be rated by at least two nationally recognized statistical rating organizations (NRSROs) and be of the two highest rating categories for short-term obligations of at least two of the NRSROs. Capital projects and bond debt service funds are invested by the bond trustee in accordance with the applicable financing indenture, generally limited to United States Treasury securities and other Federal agency securities, certificates of deposit (minimum rating of P-1/A-1), commercial paper (minimum rating of P-1/A-1+), and money market funds rated AAAm or better invested in short-term debt securities. The University does not have a formal policy that specifically addresses credit risk over endowment funds. The endowment funds managed by the ASU Foundation are invested in an unrated external investment pool subject to the ASU Enterprise Partners investment policy. The investment committee that directs the investments held in the Pool manages the credit risk associated with the Pool by following the credit quality and guideline restrictions stated in the investment policy.
Concentration of Credit Risk. Other than United States Treasury securities and other federal agency securities, which can represent greater than five percent of total investments, University policy limits investment in a single issuer to five percent or less of the fair value of the total portfolio. Except for those issuers allowed by policy, the University does not have an investment in any single issuer that exceeds five percent of the overall portfolio. At June 30, 2022, the University had investments in United States Treasuries of $362.9 million or 18.8 percent of total investments.
Interest Rate Risk. ABOR and University policies do not limit the overall maturity of the investments held by the operating and endowment funds, however, the operating fund investment policy includes guidelines addressing diversification and liquidity. The capital projects funds portfolio is not limited as to the overall maturity of its investments, with the funds invested per the financing indentures to coincide with capital spending needs and debt service requirements, which are typically less than three years, with the additional limitation that certificates of deposit and commercial paper have maximum maturities of 360 days and 270 days.
Interest Rate Risk for the University’s Debt Investments at June 30, 2022 - utilizing the weighted average maturity method (Dollars in thousands)
Fair Value
Weighted Average Maturity (Years)
Money market mutual funds $ 546,280 0.1 Corporate bonds 391,004 2.9 Asset backed securities 68,212 3.4
Federal agency securities 34,203 18.6 Municipal bonds 25,500 2.9 Mortgage backed securities 24,417 26.2 Certificate of Deposit 2,226 0.2
State of Arizona LGIP (Pool 5) 1,588 0.1 Commercial paper 497 0.3
Subtotal, before U.S. Treasury securities $ 1,093,927
U.S. Treasury securities 362,916 8.3 Total $ 1,456,843
Foreign Currency Risk. Non-endowment funds may not be invested in foreign-denominated securities, and the University has no non-endowment investments exposed to foreign currency risk. The endowment funds managed by the ASU Foundation are invested in an external investment pool, which include U.S. dollar denominated foreign investments.
The University measures and categorizes its investments using the fair value measurement guidelines established by generally accepted accounting principles. These guidelines establish a three-tier hierarchy of inputs to valuation techniques used to measure fair value, as follows:
• Level 1 - Quoted prices for identical investments in active markets that are accessible at the measurement date;
• Level 2 - Inputs, other than quoted market prices included in Level 1, that are observable, either directly or indirectly;
• Level 3 - Prices or valuations that require inputs that are significant to the fair value measurement and unobservable.
Investments Classified in Fair Value Hierarchy. Investments categorized as Level 1 of the fair value hierarchy are valued using unadjusted prices quoted for identical assets in active, exchange and brokered markets for
those securities. Investments categorized as Level 2 of the fair value hierarchy are valued using a matrix pricing technique. Matrix pricing is used to value securities based on the securities’ relationship to benchmark quoted prices. Investments categorized as Level 3 of the fair value hierarchy are valued using various methods. Real estate is valued by using the income approach to measuring fair value which discounts future amounts to a single current amount. When the income approach is used, the fair value measurement reflects current market expectations about those future amounts.
Other Investments at Fair Value. The fair value of a participant’s portion in the State of Arizona LGIP (Pool 5) approximates the value of that participant’s pool shares and the participant’s shares are not identified with specific investments. Investments in the State Treasurer’s investment pools are valued at the pool’s share price multiplied by the number of shares the University held. The fair value of the University’s position in the ASU Foundation Endowment Pool is based on the University’s proportionate share of the Pool, which is valued at markedto-market monthly.
As of 06/30/2022
Money market mutual funds $ 546,280 $ 4,910 $ 541,370
Corporate bonds 391,004 391,004
U.S. Treasury securities 362,916 362,916
Real estate 71,812 $ 71,812
Asset backed securities 68,212 68,212
Federal agency securities 34,203 34,203 Municipal bonds 25,500 25,500
Mortgage backed securities 24,417 24,417
Certificate of Deposit 2,226 2,226
Commercial paper 497 497
Total Investments Classified in Fair Value Hierarchy $ 1,527,067 $ 367,826 $ 1,087,429 $ 71,812
Other Investments at Fair Value State of Arizona LGIP (Pool 5) $ 1,588
ASU Foundation Endowment Pool (ASU Portion) 383,597
ASU BIOS Endowment Funds 17,829
Total Other Investments at Fair Value $ 403,014
Total University Investments at Fair Value $ 1,930,081
Construction in progress additions represent expenses for approved projects net of capital assets placed in service. It is estimated $182.6 million in additional expenses will
be required to complete the approved projects under construction at June 30, 2022. Construction in progress encumbrances committed through purchase orders at June 30, 2022, totaled $153.3 million.
Capital asset activity for the year ended June 30, 2022 follows: Capital asset activity for the year ended June 30, 2022 (Dollars in thousands)
Balance 07/1/2021 (as restated)
Additions/ Increases Retirements/ Decreases Balance 06/30/2022
Non-depreciated capital assets
Land and land improvements $ 137,060 $ 137,060 Construction in progressBuildings 371,333 $ 193,635 $ (389,522) 175,446 Infrastructure 4,861 5,124 (9,985)
Works of art and historical treasures 28,155 65 (57) 28,163
Total non-depreciated capital assets $ 541,409 $ 198,824 $ (399,564) $ 340,669
Depreciable capital assets
Infrastructure $ 263,014 $ 24,711 $ (11) $ 287,714 Buildings 3,638,450 426,191 (5,659) 4,058,982 Equipment 558,263 62,967 (24,118) 597,112 Software 48,984 48,984
Library books 136,906 12,474 (10,565) 138,815
Total depreciable capital assets 4,645,617 526,343 (40,353) 5,131,607
Less accumulated depreciation
Infrastructure (78,860) (6,798) 6 (85,652) Buildings (1,371,075) (112,890) 3,211 (1,480,754) Equipment (410,842) (34,504) 22,995 (422,351) Software (36,362) (3,155) (39,517)
Library books (73,971) (11,907) 10,565 (75,313)
Total accumulated depreciation (1,971,110) (169,254) 36,777 (2,103,587)
Depreciated capital assets, net $ 2,674,507 $ 357,089 $ (3,576) $ 3,028,020
Capital assets, net $ 3,215,916 $ 555,913 $ (403,140) $ 3,368,689
Buildings $ 269,636 $ 1,146 $ 943 $ 271,725 Equipment 1,943 847 2,790
Total right-to-use assets $ 271,579 $ 1,993 $ 943 $ 274,515
Less accumulated amortization
Buildings $ (37,755) $ (37,755) Equipment (697) (697)
Total accumulated amortization $ (38,452) $ (38,452)
Total right-to-use assets, net $ 271,579 $ (36,459) $ 943 $ 236,063
As of June 30, 2022 the University had issued a combination of fixed and variable rate bonds, fixed rate certificates of participation (COPs), direct placements and financed purchases, of which $2.4 billion is outstanding. The University’s long-term obligations generally are structured with semi-annual interest payments and call options at a prescribed date.
Certain revenue bonds of the University have been defeased through advance refundings by depositing sufficient cash and/or U.S. Government securities in an irrevocable trust to pay all future debt service. Accordingly, the liabilities for these defeased bonds are not included in the University’s financial statements. The principal amount of defeased bonds outstanding at June 30, 2022 totaled $187.7 million.
Average Interest Rate Final Maturity
Balance 07/01/2021 (as restated) Additions Reductions
Balance 06/30/2022 Current Portion Bonds:
2008A/B Variable Rate Demand System Refunding Bonds 0.90% 07/01/34 $ 72,735 $ (3,715) $ 69,020 $ 69,020
2010A/B System Revenue Bonds 5.99%¹ 07/01/39 142,220 (5,215) 137,005 5,395
2010A/B SPEED Revenue Bonds 5.48%² 08/01/21 2,070 (2,070)
2011 SPEED Revenue Bonds 3.93% 08/01/21 1,680 (1,680)
2012A/B System Revenue and Refunding Bonds 3.64% 07/01/28 15,905 (4,160) 11,745 8,995
2013A/B System Revenue and Refunding Bonds 3.47% 07/01/25 10,170 (2,750) 7,420 2,835
2014 SPEED Revenue Bonds 3.72% 08/01/44 64,780 (2,925) 61,855 3,075
2015A/B/C System Revenue and Refunding Bonds 3.34% 07/01/46 319,475 (21,135) 298,340 17,145
2015D System Revenue Bonds 3.67% 07/01/46 98,190 (1,255) 96,935 2,805
2016A System Revenue Refunding Bonds 2.29% 07/01/31 33,340 (15) 33,325 5,230
2016B/C System Revenue Bonds 3.25% 07/01/47 216,040 (3,530) 212,510 5,030
2017A/B/C System Revenue and Refunding Bonds 3.38% 07/01/43 191,315 (6,860) 184,455 2,120
2019A/B System Revenue Bonds 3.32% 07/01/49 193,050 (1,965) 191,085 2,310
2020A/B/C Bonds 2.84% 07/01/50 184,455 (880) 183,575 1,355
2021A/B/C Revenue and Refunding Bonds 2.43% 07/01/53 283,255 283,255 2,590
2021 SPEED Refunding Bonds 0.96% 08/01/31 36,870 36,870 3,145
2022A/B/C System Revenue Bonds 3.69% 07/01/53 $ 172,180 172,180
Subtotal: Par Amount of Bonds $ 1,865,550 $ 172,180 $ (58,155) $ 1,979,575 $ 131,050
Certificates of Participation:
2006 Certificates of Participation 4.53% 06/01/31 8,330 (680) 7,650 710
2011A Mercado Refunding Certificates of Participation 4.27% 07/01/24 3,045 (715) 2,330 740
2013A/B Refunding Certificates of Participation 3.09% 09/01/26 45,230 (8,385) 36,845 8,820 Subtotal: Par Amount of COPs $ 56,605 $ (9,780) $ 46,825 $ 10,270
Direct Placements:
2014A/B Refunding Certificates of Participation 3.04% 09/01/30 59,565 (175) 59,390 185 2017 Refunding Certificates of Participation 1.87% 07/01/26 24,735 (6,995) 17,740 3,415
Subtotal: Par Amount of Direct Placements $ 84,300 $ (7,170) $ 77,130 $ 3,600
Financed Purchases:
Fulton Center 4.01% 06/15/34 17,990 (1,085) 16,905 1,130 Flexible Display Center 3.25% 03/01/34 23,832 (1,535) 22,297 1,603
Hassayampa Academic Village 5.36% 06/10/39 9,714 (237) 9,477 264
Nursing and Health Innovation 4.84% 01/01/36 8,115 8,115 446
Other Lease Purchases 3.60% 02/07/22 21 (21)
Subtotal: Financed Purchases $ 59,672 $ (2,878) $ 56,794 $ 3,443
Total Par Amount of Bonds, COPs and Financed Purchases $ 2,066,127 $ 172,180 $ (77,983) $ 2,160,324 $ 148,363
Premium/(Discount) on Sale of Bonds and COPs 211,413 17,724 (23,961) 205,176 23,292
Total Bonds Payable/COPs/Financed Purchases $ 2,277,540 $ 189,904 $ (101,944) $ 2,365,500 $ 171,655
1 The average interest rate net of the Build America bonds federal direct payment subsidy is 3.94%.
2 The average interest rate net of the Build America bonds federal direct payment subsidy is 3.74%.
The University has pledged gross revenues as defined in the bond indentures towards the payment of debt related to various senior lien system revenue bonds outstanding at June 30, 2022. These related system revenue bonds are primarily for new academic and research facilities, academic and laboratory renovations, and technology and infrastructure improvements. The pledged revenues include student tuition and fees, certain auxiliary enterprise revenue, net investment income, and indirect cost recovery revenue. Pledged revenues do not include state appropriations, gifts, endowment income, or other restricted revenues. For the year ended June 30, 2022, pledged revenues totaled $2.16 billion of which 6.4 percent ($137.7 million, net of federal direct payments) was required to cover current year debt service.
In April 2022, the University issued $172.2 million of system revenue bonds, Series 2022A, B and C, with an average maturity of 16.9 years and an average interest rate of 3.69 percent. The bonds were issued to fund the construction and improvements to the Bateman Physical Sciences Center, Durham Hall Language and Literature Building, Infrastructure and Deferred Maintenance and the Multipurpose Arena. In addition to using pledged revenues to pay the debt service, the University will pay half the debt service of the 2022A bonds from the Capital Infrastructure Fund (CIF) established by the State pursuant to ARS 151671. Pursuant to the CIF Law, State General Fund monies will be appropriated and deposited into the University’s CIF for FY 2019 through FY 2043. The annual deposit will be adjusted annually by a growth rate of 2.0 percent or the change in the U.S. Gross Domestic Product Price Deflator between the two prior fiscal years, whichever is less, but not less than the prior fiscal year’s appropriated amount. CIF funds are available exclusively for either paying the costs of, or paying up to one-half of the debt service on debt financing for, capital projects of the University. While funding for the payment of debt service will be made as described, pledged revenues secure all of the 2022 Bonds.
In June 2008, the State of Arizona Legislature approved the Stimulus Plan for Economic and Educational Development (SPEED) which provides Arizona universities with capital improvement funds for critical construction and deferred maintenance projects. SPEED projects are debt financed with revenue bonds and repaid primarily with Arizona Lottery revenues. Specifically, up to 80 percent of SPEED debt service is paid from Arizona Lottery revenues, with the balance being the responsibility of the University as evidenced by the subordinated pledge of University revenues.
The University has outstanding two series of direct placement Certificates of Participation (COPs), the Series 2014 Refunding COPs and the 2017 Refunding COPs. The direct placement COPs were issued with similar terms to the University’s other outstanding COPs with no acceleration or priority provisions. The University utilizes COPs to acquire buildings, equipment and land. The COPs are generally callable and collateralized by the acquired asset which is subject to a leasehold interest by the trustee. In the event of a default the underlying asset value would be removed from the University’s financial statements.
The University has two series of variable rate demand system revenue refunding bonds outstanding, Series 2008A and Series 2008B, totaling $69.0 million with final maturities of July 1, 2034. The interest rate in effect on June 30, 2022 was 0.90 percent for the Series 2008A bonds and 0.89 percent for the Series 2008B bonds.
The University’s variable rate demand bonds have remarketing features which allow bondholders to put debt back to the University. In accordance with GASB Interpretation No. 1, Demand Bonds Issued by State and Local Government Entities, the total outstanding principal balance for variable rate demand bonds is required to be classified as a current liability. As of May 4, 2016 the University executed a self-liquidity facility agreement to provide liquidity if the bonds are put by bondholders. It is the University’s intent to repay its variable rate demand bonds in accordance with the maturities set forth in the official statement, however, in the absence of a “take out agreement” the University has classified the total outstanding principal balance of the 2008 bonds as a current liability.
In October 2003, the University entered into a 30 year financed purchase agreement with ASUF, LLC, an Arizona limited liability company, of which the sole member is the University Realty LLC, an Arizona limited liability company, whose sole member is ASU Enterprise Partners, an Arizona nonprofit corporation and component unit of the University, to occupy four floors of office space in the Fulton Center and the related parking structure. In April 2004, the University entered into a 30 year financed purchase agreement with Nanotechnology Research, LLC, an Arizona limited liability company, whose sole member is Arizona Capital Facilities Finance Corporation (ACFFC), for the Flexible Display Center located at the ASU Research Park. In December 2017, ASU Nanotechnology LLC refunded the 2009 Refunding Bonds for savings. The issuance of the refunding bonds resulted in a $2.9 million reduction in the University’s future payments. In July 2005, the University
entered into a 34 year financed purchase agreement with McAllister Academic Village, LLC, an Arizona limited liability company, whose sole member is ACFFC, to utilize the nonresidential portion of the McAllister Academic Village (MAV), which operates under the name of Hassayampa Academic Village. ACFFC has overall responsibility for the residential portion, comprising approximately 92 percent of the facility, with the University maintaining the nonresidential portion of the facility. In November 2008, the University committed to an intergovernmental agreement with the City of Phoenix related to construction of the fourth and fifth floors of the Nursing and Health Innovation building at ASU’s Downtown Phoenix campus. In August 2020, the City of Phoenix refunded the 2011 bonds for savings. The issuance of the refunding bonds resulted in a $2.8 million reduction in the University’s future payments. In December 2014, the University entered into a 20 year lease with ASUF DC, LLC, an Arizona limited liability company, whose sole member is the University Realty LLC, an Arizona limited liability company, whose sole member is ASU Enterprise Partners, to lease a multi-use office building in Washington, D.C. Previously recorded as a capital lease, the ASUF DC facility is subject to GASB Statement No. 87 lease accounting and is now reported as a right-to-use lease asset and a corresponding lease liability. Buildings under financed purchases are as follows:
Financed purchases book value as of June 30, 2022 (Dollars in thousands)
Value
Depreciation Net Book Value
Fulton Center $ 29,551 $ (13,577) $ 15,974
Flexible Display Center 37,314 (16,715) 20,599 Hassayampa Academic Village 12,451 (4,836) 7,615
Nursing and Health Innovation 11,788 (3,580) 8,208
Future pledged revenues required to pay all remaining debt service for the University’s senior and subordinate revenue bonds through final maturity of July 1, 2053 total $3.1 billion. In addition to a senior pledge of revenues for ASU system revenue bonds, the University has pledged the same revenues on a subordinated basis to secure the ASU SPEED revenue bonds.
The Taxable Series 2010A System Revenue Bonds were issued as Build America Bonds under the provisions of the American Recovery and Reinvestment Act (ARRA). As such, the University is eligible to receive Federal Direct Payments from the United States Treasury equal to 35 percent of the interest owed on each interest payment date. The amount paid to the University by the Federal government may be reduced or limited due to such issues as failure by the University to submit the required
information, offsets to reflect any amounts owed by the University to the Federal government, or changes in the law that would reduce or eliminate such payments. During FY 2022, ASU recorded Federal Direct Payments totaling $2.8 million, net of a $0.2 million or 5.7 percent reduction due to the federal budget sequestration. For accounting purposes, any direct payments received from the U.S. Treasury are recorded as nonoperating revenue. FY 2022 is the last year the federal subsidy will be received for the 2010A SPEED revenue bonds that were refunded by the 2021 SPEED refunding bonds.
Securities and cash restricted for bonds and COPs debt service held by the trustee at June 30, 2022 totaled $110.7 million and $4.4 million, respectively. Payment commitments to investors, including interest, for bonds, COPs and other lease obligations, using the interest rate in effect at June 30, 2022 for variable rate issues, are shown on the following page.
Funding responsibility for the June 30, 2022 outstanding debt and financed purchases (Dollars in thousands)
Current Portion Noncurrent Portion Total
From Arizona State University operating revenues

$ 149,275 $ 1,798,156 $ 1,947,431
From State of Arizona appropriations and other State monies 22,380 395,689 418,069
Total $ 171,655 $ 2,193,845 $ 2,365,500
Principal Interest
Net Payments on Swap Agreement
Federal Direct Payments Principal Interest Principal Interest Principal Interest
2023 $ 65,930 $ 87,075 $ 1,944 $ (2,689) $ 10,270 $ 1,888 $ 3,600 $ 2,051 $ 3,443 $ 1,741
2024 70,235 84,172 1,821 (2,587) 10,795 1,360 3,670 1,980 3,705 1,645
2025 80,795 80,809 1,693 (2,479) 11,335 806 3,740 1,908 3,868 1,543 2026 83,610 77,271 1,559 (2,366) 5,200 507 9,610 1,689 4,011 1,435 2027 90,580 73,337 1,417 (2,239) 5,455 243 9,855 1,435 4,141 1,322 2028-2032 432,285 307,702 4,706 (9,285) 3,770 419 46,655 2,393 22,858 4,713 2033-2037 418,790 209,954 616 (5,289) 13,060 1,425 2038-2042 398,935 111,745 (683) 1,708 126 2043-2047 265,690 32,707 2048-2052 59,985 6,300 2053-2054 12,740 252
Total $ 1,979,575 $1,071,324 $ 13,756 $ (27,617) $ 46,825 $ 5,223 $ 77,130 $ 11,456 $ 56,794 $ 13,950
The University presently plans to issue up to $210.0 million in system revenue bonds during FY 2023.
The University has entered into leases with various entities for equipment, classroom, office, research and student housing and activity space. The following leases constitute significant right-to-use lease assets and corresponding lease liabilities for the University:
Brickyard. In July 2004, the University entered into a 25 year master lease of the Brickyard, owned by the ASUF Brickyard, LLC, an Arizona limited liability company, of which the sole member is University Reality, LLC, an Arizona limited liability company, whose sole member is ASU Enterprise Partners. The majority of the facility is being used by the University for classrooms, offices and research areas, with the remaining portion being leased by the University to various firms for retail and restaurant operations. In June 2018, the University entered into an additional 5 year lease in the interest of executing a mixed-use project of existing improvements consisting of a parking garage and commercial building.
SkySong. In June 2006, the University entered into a 15 year lease, for approximately 80,000 square feet of office space within a development known as SkySong. The University’s use of the leased space focuses on supporting entrepreneurial activities and interdisciplinary research programs in engineering-related fields and education technology. The University has since entered into multiple leases for additional space within the SkySong development for an additional 72,212 square feet of office space for similar uses.
Herald Examiner Building. In August 2018, the University entered into a 12 year lease for 85,118 square feet of office space known as Herald Examiner Building located in Downtown Los Angeles to create the ASU California Center. The century-old former newspaper headquarters provides educational, community engagement and other programming space for the Herberger Institute, the Walter Cronkite School of Journalism and Mass Communication and other University programs.
Phoenix Biomedical Building (Wexford). In December 2018, the University entered into a 15 year lease for 113,615 square feet of the Wexford facility. Wexford is the first public-private development effort between the city of Phoenix, the University and Wexford Science and Technology and serves as a global center for interdisciplinary research, discovery and development. The University portion of the facility houses academic research and clinical space.
Ascentris-224. In March 2019, the University entered into a 10 year lease with Ryan University Realty, LLC for 169,223 square feet of office and ground floor retail space located within the Novus Innovation Corridor. The University utilizes the property for general office, administrative and educational purposes including classrooms and collaborative spaces.
ASU Barrett and O’Connor Washington Center. In December 2014, the University entered into a 20 year lease for a multi-use office building in Washington, D.C. Previously reported as a capital lease, the implementation of GASB Statement No. 87, Leases, required a restatement of net capital assets amounts between subcategories and a restatement of lease liabilities.
Lease liability activity for the year ended June 30, 2022 follows:
Lease Liabilities at June 30, 2022 (Dollars in thousands)
Balance 07/1/2021 (as restated) Additions Remeasure ments Deductions Balance 06/30/2022 Current Portion
Total $ 264,488 $ 1,993 $ 943 $ (25,844) $ 241,580 $ 22,132
The following schedule details minimum lease payments to maturity for the University's leases payable at June 30, 2022:
Future Annual Lease Payments at June 30, 2022 (Dollars in thousands)
Year ending June 30: Principal Interest Total
2023 $ 22,132 $ 5,299 $ 27,431 2024 22,902 4,846 27,748 2025 23,552 4,373 27,925 2026 23,085 3,885 26,970 2027 19,862 3,398 23,260 2028-2032 93,247 10,261 103,508 2033-2037 30,061 1,739 31,800 2038-2042 733 464 1,197 2043-2047 767 533 1,300 2048-2052 685 608 1,293 2053-2057 403 733 1,136 2058-2062 391 895 1,286 2063-2067 378 1,077 1,455 2068-2072 366 1,280 1,646 2073-2077 355 1,507 1,862 2078-2082 343 1,764 2,107 2083-2087 333 2,051 2,384 2088-2092 322 2,375 2,697 2093-2097 312 2,740 3,052 2098-2102 302 3,151 3,453 2103-2107 292 3,614 3,906 2108-2112 283 4,137 4,420 2113-2117 274 4,726 5,000 2118-2121 200 3,974 4,174
Total $ 241,580 $ 69,430 $ 311,010
Effective January 1, 2007, the University entered into a $103 million notional amount swap agreement (hedging derivative instrument) expiring on July 1, 2034, in conjunction with the 2008 variable rate demand system revenue refunding bonds (2008 Bonds). The outstanding $68.6 million notional amount at June 30, 2022 is not exchanged; it is only the basis on which the interest payments are calculated and it decreases as principal payments are made on the 2008 Bonds. The intention of the swap is to effectively convert the variable rate interest on the 2008 Bonds to a synthetic fixed rate. Under the terms of the swap agreement, the University pays the counterparty interest calculated at a fixed rate of 3.91 percent and receives payments from the counterparty based on the Securities Industry and Financial Markets Association (SIFMA) Municipal Swap Index set weekly. The SIFMA rate at June 30, 2022 was 0.91 percent. At June 30, 2022, the synthetic fixed interest rate on the bonds was:
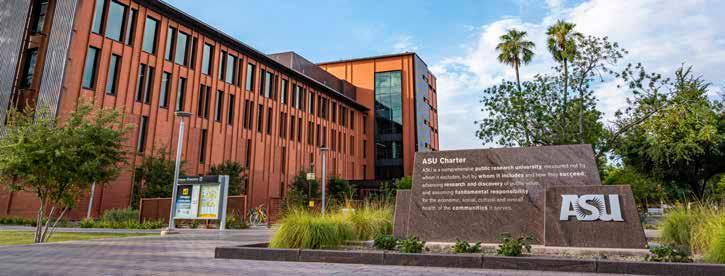
Interest Rate Swap: Terms Rates (%)
Fixed payment to counterparty Fixed 3.91
Variable payment from the counterparty SIFMA (0.91)
Net interest rate swap payments 3.00
Variable rate bond coupon payments Spread to SIFMA 0.91
Synthetic fixed interest rate on bonds 3.91
The University continues to pay interest to the bondholders at the variable rate provided by the bonds. However, during the term of the swap agreement, the University effectively pays a fixed rate on the debt. If the counterparty defaults or if the swap is terminated, the University will revert to paying a variable rate. A termination of the swap agreement may also result in the University making or receiving a termination payment. The University is exposed to interest rate risk based on the SIFMA indexed variable payment received from the counterparty versus the variable rate
paid to bondholders. The swap exposes the University to basis risk should the weekly SIFMA rate paid by the counterparty fall below the weekly interest rate due on the bonds. As of June 30, 2022, the University was not exposed to credit risk because the swap had a negative fair value. However, should interest rates change and the fair value of the swap become positive, the University would be exposed to credit risk in the amount of the derivative’s fair value. The swap counterparty was rated AA by Fitch, A+ by Standard & Poor’s and Aa2 by Moody’s Investor Services as of July 1, 2022.
Based on current ratings, the counterparty was not required to provide collateral. In the event a rating downgrade occurs, the counterparty may be required to provide collateral if the University’s overall exposure exceeds predetermined levels.
Collateral may be held by the University or a third party custodian. As of June 30, 2022, the swap had a fair value of $(5.8) million, which represents the cost to the University to terminate the swap. The June 30, 2021 fair value was $(15.0) million. The fair value was developed by an independent third party, with no vested interest in the transaction, using the zero coupon discounting method. This method calculates the future payments required by the swap, assuming the current forward rates implied by the yield curve are the market’s best estimate of future spot interest rates. These payments are then discounted using the spot rates implied by the current yield curve for a hypothetical zero-coupon rate bond due on the date of each future net settlement on the swaps. In accordance with GASB 53, Accounting and Financial Reporting for Derivative Instruments, the fair value of the University’s hedging derivative instrument is reported on the statement of net position as a deferred outflow of resources and a liability (derivative instrument).
As discussed in the Summary of Significant Accounting Policies, the University follows accounting standards for external reporting purposes that require net position to be classified for accounting and reporting purposes into one of three net position categories according to externally imposed restrictions. Unrestricted net position, as defined by GASB, is not subject to externally imposed stipulations; however, it is subject to internal designations.
The University has recorded a liability for accruals of vacation leave earned, but not taken at fiscal year end. At fiscal year end the University accrued up to the maximum 22 days allowed by University policy for which an employee can be paid upon termination of employment.
For example, unrestricted net position may be designated for specific purposes by actions of management or may otherwise be limited by contractual purchase obligation agreements with outside parties. As of June 30, 2022, substantially all of the University’s unrestricted net position was from University-generated revenues and was internally designated for academic and research programs, strategic investments and capital projects.
Changes in accrued compensated absences for the year ended June 30, 2022 consisted of the following (Dollars in thousands):
Beginning Balance $ 49,916 Additions 65,093 Reductions (66,521)
Ending Balance $ 48,488
Current Portion $ 6,033
Operating expenses by functional and natural classification for the year ended June 30, 2022, are summarized as follows (Dollars in thousands):
Year ended June 30, 2022
Personal Services and Benefits Supplies and Services Student Aid Depreciation Total Instruction $ 780,423 $ 295,984 $ 1,076,407 Research 238,834 175,425 414,259
Public service 31,130 16,712 47,842 Academic support 265,320 131,019 396,339 Student services 119,168 57,496 176,664 Institutional support 131,726 80,559 212,285
Operation and maintenance of plant 29,317 86,799 116,116 Scholarships and fellowships $ 293,349 293,349 Auxiliary enterprises 85,765 139,728 225,493 Depreciation $ 201,287 201,287
Total Operating Expenses $ 1,681,683 $ 983,722 $ 293,349 $ 201,287 $ 3,160,041
The University participates in the Arizona State Retirement System (ASRS), a cost-sharing, multiple-employer defined benefit pension plan, and two defined contribution plans which are described on page 52. The University also contributes to the Public Safety Personnel Retirement System (PSPRS), which is comprised of a state administered agent multiple-employer defined benefit pension plan and a defined contribution plan. Although a PSPRS net pension liability has been recorded at June 30, 2022, PSPRS has
not been further disclosed due to its relative insignificance to the University’s financial statements.
The University’s net pension liability at June 30, 2022, was comprised of the following (Dollars in thousands):
ASRS $ 512,172 PSPRS 21,502
Defined contribution pension plans 28,603
Total net pension liability $ 562,277
Changes in the University’s net pension liability during the fiscal year ended June 30, 2022, were as follows (Dollars in thousands):
Beginning balance $ 715,961 Increases 158,057 Decreases (311,741) Ending balance $ 562,277
Arizona State Retirement System (ASRS). The ASRS administers a cost-sharing multiple-employer defined benefit pension plan. Certain eligible staff categories are required and eligible University faculty and other staff categories have the option to participate in the ASRS defined benefit plan. The Arizona State Retirement System Board governs the ASRS according to the provisions of A.R.S. Title 38, Chapter 5, Article 2. The ASRS is a component unit of the State of Arizona. The ASRS issues a publicly available financial report that includes its financial statements and required supplementary information. That report may be obtained by visiting www.azasrs.gov.
Benefits Provided. The ASRS provides retirement and survivor benefits. Retirement benefits for members who joined the ASRS prior to September 13, 2013, are subject to automatic cost-of-living adjustments based on excess investment earnings. Members with a membership date on or after September 13, 2013, are not eligible for cost-ofliving adjustments. Survivor benefits are payable upon a member’s death. For retired members, the survivor benefit is determined by the retirement benefit option chosen. For all other members, the beneficiary is entitled to the member’s account balance that includes the member’s contributions and employer’s contributions, plus interest earned. State statute establishes benefit terms. Retirement benefits are calculated on the basis of age, average monthly compensation, and service credit as follows:
Contributions. In accordance with state statutes, annual actuarial valuations determine active member and employer contribution requirements. The combined active member and employer contribution rates are expected to finance the costs of benefits employees earn during the year, with an additional amount to finance any unfunded accrued liability. For the year ended June 30, 2022, active ASRS members were required by statute to contribute at the actuarially determined rate of 12.22 percent of the members’ annual covered payroll, and the University was required by statute to contribute at the actuarially determined rate of 12.01 percent of the active members’ annual covered payroll. In addition, the University was required by statute to contribute at the actuarially determined rate of 10.13 percent of annual covered payroll of retired members who worked for the University in positions that would typically be filled by an employee who contributes to the ASRS. The University’s contributions to the pension plan for the year ended June 30, 2022, were $54.3 million.
Pension Liability. At June 30, 2022, the University reported a liability of $512.2 million for its proportionate share of the ASRS’ net pension liability. The net pension liability (NPL) was measured as of June 30, 2021. The total pension liability used to calculate the net pension liability was determined using update procedures to roll forward the total pension liability from an actuarial valuation as of June 30, 2020, to the measurement date of June 30, 2021. The total liabilities as of June 30, 2021, reflect changes in actuarial assumptions based on the results of an actuarial experience study for the 5-year period ended June 30, 2020, including decreasing the discount rate from 7.5 percent to 7.0 percent and changing the projected salary increases from 2.7 - 7.2 percent to 2.9 - 8.4 percent.
The University’s proportion of the net pension liability was based on the University’s actual contributions to the plan relative to the total of all participating employers’ contributions for the year ended June 30, 2021. The University’s proportion measured as of June 30, 2021 was 3.898 percent which was an increase of 0.075 from its proportion measured as of June 30, 2020.
Years of service and age required to receive benefit
Before July 1, 2011
Sum of years and age equals 80
10 years / age 62
years / age 50*
Any years / age 65
On or after July 1, 2011
30 years / age 55
25 years / age 60
10 years / age 62
5 years / age 50*
Any years / age 65
Final average salary is based on
Benefit percent per year of service
*With actuarially reduced benefits
Highest 36 consecutive months of last 120 months
to 2.3%
Highest 60 consecutive months of last 120 months
to 2.3%
Pension Expense and Deferred Outflows/Inflows of Resources. For the year ended June 30, 2022, the University recognized pension expense for ASRS of $58.1 million. At June 30, 2022, the University reported deferred outflows of resources and deferred inflows of resources related to pensions from the following sources (Dollars in thousands):
Deferred Outflows of Resources
Differences between expected and actual experience $ 7,808
Changes of actuarial assumptions or other inputs 66,663
Changes in proportion and differences between University contributions and proportionate share of contributions
Deferred Inflows of Resources
Actuarial assumptions used in the June 30, 2020 valuation were based on the results of an actuarial experience study for the 5-year period ended June 30, 2020. The long-term expected rate of return on ASRS pension plan investments was determined to be 7.0 percent using a building-block method in which best-estimate ranges of expected future real rates of return (expected returns, net of pension plan investment expense and inflation) are developed for each major asset class. These ranges are combined to produce the long-term expected rate of return by weighting the expected future real rates of return by the target asset allocation percentage and by adding expected inflation. The target allocation and best estimates of geometric real rates of return for each major asset class are summarized in the following table:
7,869 $ 162,274
University contributions subsequent to the measurement date 54,327
Total $ 136,667 $ 162,274
The $54.3 million reported as deferred outflows of resources related to ASRS pensions resulting from University contributions subsequent to the measurement date will be recognized as a reduction of the net pension liability in the year ending June 30, 2023. Other amounts reported as deferred outflows of resources and deferred inflows of resources related to ASRS pensions will be recognized in pension expense as follows. (Dollars in thousands, positive amount indicates an increase in pension expense):
Year ending June 30, 2023 $ 6,334 2024 5,426 2025 (35,773) 2026 (55,921)
Actuarial Assumptions. The significant actuarial assumptions used to measure the total pension liability are as follows:
Actuarial valuation date June 30, 2020
Actuarial roll forward date June 30, 2021
Actuarial cost method Entry age normal Investment rate of return 7.0%
Projected salary increases 2.9% - 8.4% Inflation 2.3%
Permanent benefit increase Included Mortality rates 2017 SRA Scale U-MP
Equity 50% 4.90%
Fixed income - credit 20% 5.20%
Fixed income - interest rate sensitive 10% 0.70%
Real estate 20% 5.70%
Total 100%
Discount Rate. At June 30, 2021, the discount rate used to measure the ASRS total pension liability was 7.0 percent, which was a decrease of 0.5 from the discount rate used as of June 30, 2020. The projection of cash flows used to determine the discount rate assumed that contributions from participating employers will be made based on the actuarially determined rates based on the ASRS Board’s funding policy, which establishes the contractually required rate under Arizona statute. Based on those assumptions, the pension plan’s fiduciary net position was projected to be available to make all projected future benefit payments of current plan members. Therefore, the long-term expected rate of return on pension plan investments was applied to all periods of projected benefit payments to determine the total pension liability.
Sensitivity of the University’s Proportionate Share of the ASRS Net Pension Liability to Changes in the Discount Rate. The following table presents the University’s proportionate share of the net pension liability calculated using the discount rate of 7.0 percent, as well as what the University’s proportionate share of the net pension liability would be if it were calculated using a discount rate that is 1 percentage point lower (6.0 percent) or 1 percentage point higher (8.0 percent) than the current rate (Dollars in thousands):
University’s proportionate share of the NPL
1% decrease (6.0%) $ 805,604
Current discount rate (7.0%) 512,172 1% increase (8.0%) 267,531
Pension Plan Fiduciary Net Position. Detailed information about the pension plan’s fiduciary net position is available in the separately issued ASRS financial report.
Pension Contributions Payable. The University reported accrued payroll and employee benefits of $3.0 million for outstanding pension contribution amounts payable to ASRS for the year ended June 30, 2022.
Plan Description. In accordance with A.R.S. section 151628, University faculty and most University staff have the option to participate in defined contribution pension plans. For the year ended June 30, 2022, plans offered by TIAA and Fidelity Investments Tax-Exempt Services Company (Fidelity) were approved by the Arizona Board of Regents. Benefits under these plans depend solely on the contributed amounts and the returns earned on investments of those contributions. Contributions made by members vest immediately; University contributions vest after five years of full-time employment. Non-vested contributions held by the University earn interest. Member
Note K - Other Postemployment Benefits (OPEB)
Other postemployment benefits provided as part of University employment include the Arizona Department of Administration sponsored single-employer defined benefit postemployment plan as well as the ASRS sponsored cost-sharing, multi-employer defined benefit plan for the Long-Term Disability and the Health Benefit Supplement Fund. University public safety personnel participate in the Public Safety Personnel Retirement System (PSPRS). PSPRS administers an agent multi-employer defined benefit health insurance premium benefit plan. Although an ASRS net OPEB liability and PSPRS net OPEB asset have been recorded at June 30, 2022, these plans have not been further disclosed due to the relative insignificance to the University’s financial statements.
The University’s net OPEB liability at June 30, 2022, was $225.3 million. Changes in the University’s net OPEB liability during the fiscal year ended June 30, 2022, were as follows (Dollars in thousands):
Beginning balance $ 313,786
Increases 42,336
Decreases (130,850)
Ending balance $ 225,272
and University contributions and associated returns earned on investments may be withdrawn upon termination of employment, death, or retirement. The distribution of member contributions and associated investment earnings are made in accordance with the member’s contract with the applicable insurance and annuity companies.
Funding Policy. The Arizona State Legislature establishes the contribution rates for active plan members and the University. The Arizona Revised Statutes define the authority under which benefit terms are established or may be amended. For the year ended June 30, 2022, plan members and the University were each required by statute to contribute an amount equal to 7 percent of a member’s compensation.
Pension Liability. At June 30, 2022, the University reported a liability of $28.6 million, of which $27.1 million is nonvested defined contributions. If individuals terminate employment prior to vesting, any non-vested University contributions are retained by the University.
Pension Expense. For the year ended June 30, 2022, the University recognized pension expense for Defined Contribution Plans of $36.5 million, which excludes $2.0 million in forfeitures.
Pension Contributions Payable. The University’s accrued payroll and employee benefits included $1.5 million of outstanding pension contribution amounts payable to TIAA and Fidelity for the year ended June 30, 2022.
Plan Description. The Arizona Department of Administration (ADOA) administers a single-employer defined benefit postemployment plan (ADOA Plan) that provides medical and accident benefits to retired state employees and their dependents, including University employees and their dependents. For financial reporting purposes, the University presents its proportionate share of the ADOA Plan total liability and the related note disclosures similar to a multi-employer plan.
Title 38, Chapter 4 of the A.R.S. assigns the authority to establish and amend the benefit provisions of the ADOA Plan to the Arizona State Legislature. The ADOA pays the medical costs incurred by retired employees, net of related premiums that are paid entirely by the retiree or on behalf of the retiree. These premium rates are based on a blend of active employee and retiree experience, resulting in a contribution basis that is lower than the expected claim costs for retirees, creating an implicit subsidization of retirees by the ADOA Plan. A portion of the ADOA Plan’s implicit rate subsidy represents an obligation of the University for its proportionate share of the total OPEB liability.
Funding Policy and Contributions. The ADOA’s current funding policy is pay-as-you-go for OPEB benefits. There
are no dedicated assets at this time to offset the actuarial accrued liability.
Benefits Provided. The ADOA provides medical and accident benefits to retired University employees and their dependents. The ADOA pays the medical costs incurred by retired employees who choose to participate in the plan minus a specified premium amount which is paid for entirely by the retiree or on behalf of the retiree. Premium rates are based on a blend of active employee and retiree experience, resulting in a contribution basis which is lower than the expected claim costs for retirees only, which results in an implicit subsidization of retirees by the University. Dental and vision benefits are also available, but are not valued as there is no implicit subsidization in the retiree rates.
OPEB Liability. At June 30, 2022, the University reported a liability of $244.2 million for its proportionate share of the ADOA total OPEB liability. The total OPEB liability was measured as of June 30, 2021 and was determined using an actuarial valuation as of June 30, 2021. The University’s proportion of the total OPEB liability was based on the University’s actual contributions to the plan relative to the total of all participating employers’ contributions for the year ended June 30, 2021.
The total OPEB liability as of June 30, 2021 reflects the following changes in benefit terms and actuarial assumptions:
- The discount rate decreased to 1.92%, down from 2.45%, due to changes in the tax-exempt municipal bond index rate.
- Updated Arizona State Retirement System Annual Actuarial Valuation as of June 30, 2021.
- Updated mortality tables and changes in health care fund rates.
The University’s proportion measured as of June 30, 2020 was 19.87 percent and as of June 30, 2021 was 20.38 percent.
OPEB Expense and Deferred Outflow/Inflows of Resources. For the year ended June 30, 2022, the University recognized ADOA OPEB expense of $31.6 million. At June 30, 2022, the University reported deferred outflows of resources and inflows of resources related to OPEB from the following sources (Dollars in thousands):
University benefit payments subsequent to the measurement date $ 4,963
Changes of assumptions or other inputs 58,497 $ 19,001
Difference between expected and actual experience in the Total OPEB Liability 31,395 88,413
Total $ 94,855 $ 107,414
The $5.0 million reported as deferred outflows of resources related to ADOA OPEB resulting from University benefit payments subsequent to the measurement date will be recognized as a reduction of the OPEB liability in the year ending June 30, 2023. Other amounts reported as deferred outflows of resources and deferred inflows of resources related to ADOA OPEB will be recognized in pension expense as follows (Dollars in thousands):
Year ending June 30, 2023 $ (1,712) 2024 (1,712) 2025 1,522 2026 4,356 2027 (2,652)
Thereafter (17,324)
Actuarial Assumptions. Projections of ADOA Plan benefits for financial reporting purposes include the types of benefits provided at the time of each valuation and the pattern of sharing of cost between the employer and the ADOA Plan member to that point. The actuarial methods and assumptions used include techniques that are designed to reduce short-term volatility in actuarial accrued liabilities, consistent with the long-term perspective of the calculations. Actuarial assumptions used in the June 30, 2021 valuation were based on the results of an actuarial experience study for the 5-year period ended June 30, 2020.
The ADOA Plan’s actuarial methods and significant assumptions for the most recent actuarial valuation are as follows:
Actuarial valuation date June 30, 2021
Actuarial cost method Entry-Age Normal
Projected salary increases 2.90% - 8.40% varying by years of service
Healthcare cost trend rates:
Medical (pre-65) 7.00% graded to 4.15% Medical (post-65) 5.30% graded to 4.15%
Administrative costs None
Discount rate 1.92%
Mortality rates: Level dollar, open
Employees Pub-2010 General Employee Mortality Table projected generationally from 2017 utilizing Ultimate MP scales
Healthy retirees and spouses 2017 State Retirees of Arizona Mortality Tables projected generationally from 2017
Disabled retirees Pub-2010 Disabled Retiree Mortality Tables projected generationally from 2017 utilizing Ultimate MP scales
Discount Rate. The discount rate used to measure the total OPEB liability was 1.92 percent which was set based on the Fidelity “20-Year Municipal GO (General Obligation) AA Index” as of the measurement date.
Sensitivity of the University’s Proportionate Share of the ADOA total OPEB liability to Changes in the Discount Rate.
The following table presents the University’s proportionate share of the total OPEB liability calculated when using the discount rate of 1.92 percent, as well as what the University’s proportionate share of the total OPEB liability would be if it were calculated using a discount rate that is 1 percentage point lower (0.92 percent) or 1 percentage point higher (2.92 percent) than the current rate (Dollars in thousands):
University’s proportionate share of the total OPEB liability
1% decrease (0.92%) $ 294,134
Current discount rate (1.92%) 244,247 1% increase (2.92%) 205,610
The following table presents the University’s proportionate share of the total OPEB liability calculated when using the current trend rate as well as what the University’s proportionate share of the total OPEB liability would be if it were calculated using a trend rate that is 1 percentage point lower or 1 percentage point higher than the current trend rates (Dollars in thousands):
University’s proportionate share of the total OPEB liability
1% decrease in trend rates $ 198,686
Current rate trends 244,247 1% increase in trend rates 305,207
Risk Management Insurance. Pursuant to A.R.S. section 41-621, the University participates in a self-insurance program administered by the State of Arizona, Department of Administration, Risk Management Section. The State’s Risk Management Program covers the University, subject to certain deductibles, for risks of loss related to such situations as theft, damage and destruction of property, buildings, and equipment; errors and omissions; injuries to employees; natural disasters; and liability for acts or omissions of any nature while acting in authorized governmental or proprietary capacities and in the course and scope of employment or authorization, except as prescribed in A.R.S. section 41-621. Loss risks not covered by the Risk Management Section and where the University has no insurance coverage are losses arising
from contractual breaches and losses that arise out of and are directly attributable to an act or omission determined by a court to be a felony. From time to time, various claims and lawsuits associated with the normal conduct of University business are pending or may arise against the University.
In the opinion of University management, any losses from the resolution of any other pending claims or litigation not covered by the Risk Management Section should not have a material effect on the University’s financial statements. Also, in accordance with the disclosure requirements of GASB Statement No. 10, Accounting and Financial Reporting for Risk Financing and Related Insurance Issues, all estimated losses for unsettled claims and actions of the State are determined on an actuarial basis and are included in the State of Arizona Annual Comprehensive Financial Report
The University, as lessor, leases University-owned property to private student housing developers to construct student housing facilities on its various campuses. For additional information, please see Note A - Basis of Presentation and Significant Accounting Policies.
American Campus Communities. The University has entered into ground lease agreements with American Campus Communities (ACC) for student housing projects that provide approximately 7,700 beds and are located on land owned by the University that is ground leased to ACC. Upon completion of the projects, ACC transfers title to the facilities to the University, subject to a leasehold interest under which ACC will maintain and operate the facilities. The ground leases are each for a period of 65 years with two ten-year options to renew. The University has no obligation to support the facilities financially or to guarantee occupancy.
• Vista del Sol, opened in August 2008 on the Tempe campus, consists of apartment-style beds, with amenities such as a pool, community center, parking garage and retail space.
• Villas at Vista del Sol, an expansion of the Vista del Sol complex, opened in August 2012 on the Tempe campus and includes a mix of apartment-style housing and townhome units.
• Barrett Honors College, opened in August 2009 on the Tempe campus, provides housing and academic space for the Barrett Honors College including classrooms, faculty office and dining facilities.
• Casa de Oro, opened in August 2012 on the West campus, features double occupancy suite-style beds.
• Manzanita, a renovated facility, re-opened in August 2013 on the Tempe campus and consists of double occupancy suite-style beds.
• Fulton Schools Residential Community at Tooker House, opened in August 2017 on the Tempe campus, features double occupancy suite-style beds.
• The Greek Leadership Village, opened in August 2018 on the Tempe campus, provides housing for ASU fraternities and sororities.
University House Mesa, LLC. The University entered into a ground lease with University House Mesa, LLC (UHM) for development of student housing on the Polytechnic campus. During the term of the ground lease, 65 years with two ten-year options to renew, UHM is responsible for all costs and expenses of operating and maintaining the housing project. The University has no obligation to support the facility financially or to guarantee occupancy.
• Century Hall, opened in August 2012 on the Polytechnic campus, features double occupancy suite-style beds.
HRSE-Capstone Mesa, LLC. The University entered into a group lease with HRSE-Capstone Mesa, LLC (HRSE) for development of student housing on the Polytechnic campus. During the term of the ground lease, 65 years with two ten-year options to renew, HRSE is responsible for all costs and expenses of operating and maintaining the housing project. The University has no obligation to support the facility financially or to guarantee occupancy.
• Lantana Hall, opened in August 2020 on the Polytechnic campus, features four-bedroom, single occupancy suites and double occupancy suite-style beds.

Downtown Phoenix Student Housing, LLC. The University entered into a ground sublease with Capstone Development Corporation and Downtown Phoenix Student Housing, LLC (DPSH) for development of student housing on the Downtown Phoenix campus. During the term of the ground lease, the earlier of 40 years from the issuance of the financing for the project or the date on which the financing and all obligations have been fully repaid, DPSH is responsible for all costs and expenses of operating and maintaining the housing project. The University has no obligation to support the facility financially or to guarantee occupancy.
• Taylor Place, opened in August 2008 (South Tower) and January 2009 (North Tower) on the Downtown Phoenix campus, features double occupancy suitestyle beds.
Downtown Phoenix Student Housing II, LLC. The University entered into a ground sublease with Downtown Phoenix Student Housing II, LLC (DPSH II) for development of student housing on the Downtown Phoenix campus. During the term of the ground lease, up to 45 years, DPSH II is responsible for all costs and expenses of operating and maintaining the housing project. The University has no obligation to support the student housing financially or to guarantee occupancy.
• DPSH II, opened in August 2021 on the Downtown Phoenix campus, features studio, two-bedroom and four-bedroom apartment-style units.
Arizona State University’s discretely presented component units are comprised of two major component units, ASU Enterprise Partners (ASUEP), and Arizona Capital Facilities Finance Corporation (ACFFC), and several smaller component units consisting of the ASU Alumni Association, Arizona State University Research Park, Inc., Sun Angel Foundation, and ASU Preparatory Academy, Inc. For additional information refer to Note B – ASU Component Units.
Basis of presentation. The component unit financial statements have been prepared on the accrual basis of accounting according to generally accepted accounting principles (GAAP). Information regarding their financial position and activities is reported according to three classes of net assets: without donor restrictions - unrestricted net assets, with donor restrictions - temporarily restricted net assets, and with donor restrictions - permanently restricted net assets.
Income taxes. All of ASU’s component units, except ACFFC, qualify as tax-exempt organizations under Section 501(c)(3) of the Internal Revenue Code and, therefore, there is no provision for income taxes. In addition, they qualify for the charitable contribution deduction and have been classified as organizations that are not private foundations. Any income determined to be unrelated business taxable income would be taxable. ACFFC is classified as a Section 501(c)(4) organization, a tax-exempt organization but not qualified for the charitable contribution deduction.
Use of estimates. The preparation of the component units’ financial statements, in conformity with U.S. generally accepted accounting principles, requires management to make estimates and assumptions that affect the reported amounts of assets and liabilities, disclosure of contingent assets and liabilities at the date of the financial statements, and the reported amounts of revenues and expenses during the reporting period. Actual results could differ from those estimates.
Contributions. Contributions received are recorded as without donor restrictions - unrestricted, with donor restrictions - temporarily restricted, or with donor
restrictions - permanently restricted support, depending on the existence and/or nature of any donor restrictions. All donor-restricted support is reported as an increase in with donor restrictions - temporarily or with donor restrictions - permanently restricted net assets, depending on the nature of the restriction. When a restriction expires (that is, when a stipulated time restriction ends, or the purpose of the restriction is accomplished), with donor restrictions - temporarily or with donor restrictions - permanently restricted net assets are reclassified to without donor restrictions - unrestricted net assets and reported in the Statement of Activities as net assets released from restrictions.
ASUEP pledges receivable (unconditional promises to give) are recorded at their net realizable value, which is net of a discount and loss allowance. Pledges are discounted using the applicable risk free rate at the date the pledge was recognized. The discount rates range from 0.6 percent to 6.0 percent. An allowance for uncollectible pledges is estimated based on the ASUEP’s collection history and is recorded as a reduction to contribution support revenue and an increase in the allowance for uncollectible pledges.
The Sun Angel Foundation’s pledges receivable are recorded at their net realizable value using a discount rate determined by management ranging from 0.6 percent to 5.1 percent for the year ended June 30, 2022.
Members of the ASUEP’s Board of Directors and Board of Trustees have made contributions and pledges to ASUEP in the current and prior years. At June 30, 2022, net unconditional pledges receivable from these members included approximately $853 thousand. The ASUEP had conditional pledges receivable totaling $167.8 million at June 30, 2022; none are included in pledges receivable. Conditional pledges receivable are recorded when the conditions are substantially met.
ASUEP investments are recorded at fair value. Fair value is defined as the price that would be received to sell an asset or paid to transfer a liability in an orderly transaction between market participants at the measurement date. US GAAP establishes a framework for measuring fair value, establishes a fair value hierarchy based on the inputs used to measure fair value and enhances disclosure
Receivable in one year $ 71,914 $ 10,657 $ 82,571 Receivable in two to five years 80,854 15,797 96,651 Receivable after five years 64,059 1,219 65,278
Total gross pledges to be received $ 216,827 $ 27,673 $ 244,500
requirements for fair value measurements. This guidance maximizes the use of observable inputs and minimizes the use of unobservable inputs by requiring that the observable inputs be used when available. Observable inputs that market participants would use in pricing the asset or liability are based on market data obtained from independent sources. Unobservable inputs reflect assumptions that market participants would use in pricing the asset or liability based on the best information available in the circumstances. The hierarchy is broken down into three levels based on the transparency of inputs as follows:
Level 1 – Quoted prices are available in active markets for identical assets or liabilities as of the report date. A quoted price for an identical asset or liability in an active market provides the most reliable fair value measurement because it is directly observable to the market.
Level 2 – Pricing inputs are other than quoted prices in active markets, which are either directly or indirectly observable as of the report date. The nature of these securities include investments for which quoted prices are available but traded less frequently and investments that are fair valued using other securities, the parameters of which can be directly observed.
Level 3 - Securities that have little to no pricing observability as of the report date. These securities are measured using management’s best estimate of fair value, where the inputs included in the determination of fair value are not observable and require significant management judgment or estimation.
ASUEP reports investments in accordance with SFAS No. 124, Accounting for Certain Investments Held by Not-forProfit Organizations. The fair values of publicly traded securities are based on quoted market prices and exchange rates, if applicable. The fair values of nonmarketable securities are based on valuations provided by external investment managers.
ASUEP exercises due diligence in assessing the policies, procedures and controls implemented by external investment managers. Investment income is recorded on an accrual basis, and purchases and sales of investment securities are reflected on a trade-date basis. Realized gains and losses are calculated using the average cost for securities sold. Investment securities, in general, are exposed to various risks, such as interest rate, credit and
overall market volatility.
ASUEP spending policy for the consolidated investment pools follows the objectives of the investment policy and establishes the amount made available for spending in the endowment pools.
• The current spending policy is based on a constant growth formula, in which the amount available for spending is based on the prior year spending amount plus an inflation factor (7.0 percent), collared by a cap and floor of 4.25 percent and 3.25 percent, respectively, of a 12-quarter moving average calculated mid-fiscal year.
• In the event the current market value of the endowment is less than the historical gift value, spending will continue, unless the gift agreement does not permit spending in this circumstance.
ASUEP has ownership of certain cash and cash equivalents that are not in the possession of ASUEP but are held, along with other marketable securities, by outside investment managers for the benefit of the ASUEP. Although these cash and cash equivalents are readily available to ASUEP, it is the intent of ASUEP to hold these cash and cash equivalents for investment purposes and, accordingly, these cash and cash equivalents are classified as investment assets in the accompanying combined financial statements.
Investments, in general, are exposed to various risks, such as interest rate, credit and market. Due to the level of risk associated with certain investment securities, it is at least reasonably possible that changes in the near term could materially affect account balances and the amounts reported in the accompanying consolidated financial statements.
ASU Enterprise Partners. ASUEP leases a portion of the Fulton Center building (ASUEP headquarters) to the University under a direct financing lease. At the end of the lease, ASUEP will gift their portion of the building to the University and the University will receive title to the building. ASUEP net investment in this direct financing lease at June 30, 2022 is $17.0 million.
Arizona Capital Facilities Finance Corporation (ACFFC). Pursuant to a sublease agreement, dated April 7, 2004
Money market funds and cash equivalents $ 10,746 $ 16,980 $ 27,726
Global equities 541,076 541,076
Global fixed income 281,301 281,301
Diversifying strategies 210,963 210,963
Real assets 188,847 188,847
Private capital 436,171 436,171 Other securities $ 22,149 22,149 Other investments 80,324 80,324
Total investments $ 1,749,428 $ 16,980 $ 22,149 $ 1,788,557
(Dollars in thousands)
Assets at fair value (recurring basis)
Global equities $ 7,739 $ 425,227 $ 108,111
Global fixed income 65,769 166,436 $ 5,883 43,213 Diversifying strategies 164,590 3,390 3,000 39,982 Real assets 99 51,404 137,344 Private capital 818 435,353 Cash and cash equivalents 10,723 23 Total investments at fair value $ 238,197 $ 657,998 $ 8,883 $ 764,026
Charitable trust receivable 1,593 Land and buildings held for investment 80,324 Assets with limited use 8,873 Assets held under split-interest agreements 8,300 Total assets at fair value $ 238,197 $ 675,171 $ 8,883 $ 845,943
Liabilities at fair value (recurring basis)
Assets held for other entities $ 406,233
Unrealized swap liability $ 3,290 Total liabilities at fair value $ 3,290 $ 406,233
and amended on December 1, 2017 (the Sublease), Nanotechnology Research, LLC (Nano), a wholly-owned subsidiary of ACFFC, leases its interest in the ASU Research Park to the University.
The University will make lease payments at times in amounts sufficient to pay all principal and interest on the Series 2009B and 2017 Bonds. The Sublease has successive annual renewals without action from either party through March 31, 2034. The Sublease is subject to early termination by Nano or the University upon the payment in full of the Series 2009B and 2017 Bonds. Upon termination or expiration of the Sublease, the ACFFC’s interest in the premises, including all buildings and improvements on the leased premises, transfers to the University without further consideration. ACFFC’s net investment in the
Nanotechnology facility direct financing lease is $22.3 million at June 30, 2022.
Pursuant to a University lease agreement, dated July 1, 2005, McAllister Academic Village, LLC, a whollyowned subsidiary of ACFFC, leases its interest in the non-residential portion of Hassayampa Academic Village (Hassayampa, HAV) to the University which consists of the academic, tutorial, retail and food service facilities. The lease was amended effective July 1, 2016 to change the annual renewal period through June 30, 2039 to correspond with the maturity of the Hassayampa 2016 Bonds. Any right, title or interest of Hassayampa in and to the academic portions of the Hassayampa Project will pass to the University without further cost upon the payment in full of the Hassayampa 2016 Bonds. Lease payments
are based on the fixed interest rates determined by the Hassayampa 2016 Bonds maturity schedules. ACFFC’s net investment in the McAllister (HAV) direct financing lease is $9.5 million at June 30, 2022.
The University entered into a contingent agreement which allows the University to contribute funding to the extent a funding shortfall occurs during the fiscal year. The agreement for Hassayampa Academic Village (ACFFC) allows the University to fund deficiencies for debt service and operating expense shortfalls.

Sun Devil Energy Center. In November 2004, the University entered into a privatized/third party agreement with ACFFC for the construction and operation by a third party energy management firm of a co-generation power plant on the University’s Tempe campus with the power plant providing to the University a portion of its energy (electrical, chilled water and steam) needs. In June 2018, $23.6 million in additional Tax-Exempt Revenue Bonds were issued by Sun Devil Energy Center LLC to add a second turbine to the existing facility in order to meet the university’s heating, cooling and electric generating needs for the new Biodesign C facility and future research facilities. The contract with ACFFC is effective through 2038, along with the related ground lease, and calls for minimum annual energy purchase obligations on the part of the University of approximately $10.9 million to cover ACFFC’s fixed management services and capital costs. Additional billing amounts will be based on a pass through to the University of the service provider’s variable costs, primarily natural gas.
Polytechnic Central Plant. In December 2008, the University entered into a privatized/third party agreement with ACFFC for the construction and operation by a third party energy management firm of a central plant on the University’s Polytechnic campus to provide chilled water and emergency power for certain buildings on that campus. In October 2017, Energy Center LLC issued $11.3 million in Tax-Exempt Revenue Refunding Bonds (Energy Center 2017 Bonds). The proceeds of the Energy Center 2017 Bonds were used to refund and redeem $10.5 million of the Energy Center 2008 Bonds for savings. The contract with ACFFC is effective through 2028, along with the related ground lease, and calls for minimum annual purchase obligations by the University of approximately $1.9 million to cover ACFFC’s fixed management services and capital costs. Additional billing amounts will be based on a pass through to the University of the service provider’s variable costs, primarily electricity.
Management of the ASUEP’s endowment is governed by laws in the State of Arizona created under the Arizona Management of Charitable Funds Act (MCFA). The ASUEP has interpreted the statute as requiring the preservation of the fair value of the original gifts as of the gift date of the donor-restricted endowment funds absent explicit donor stipulations to the contrary. As a result of this interpretation, the ASUEP classifies as permanently restricted net assets: (a) the original value of gifts donated to the permanent endowment; (b) the original value of subsequent gifts to the permanent endowment; and (c) accumulations to the permanent endowment made in accordance with the direction of the applicable donor gift instrument at the time the accumulation is added to the fund. From time to time, the fair value of assets associated with the individual donor-restricted endowment funds may fall below the level required to be held in perpetuity. For these funds, the change in value is shown as with donor restrictionstemporarily restricted net investment return and is reported in with donor restrictions - temporarily restricted net assets. The remaining portion of the donor-restricted endowment fund that is not classified as with donor restrictionspermanently restricted net assets is classified as with donor restrictions - temporarily restricted net assets.
ASUEP endowment is invested in the Long Term Investment Pool (LTIP) and the Sustainable Responsible Impact Pool (SRIP). ASUEP investment policies for the LTIP and SRIP are reviewed periodically. The long-term financial objectives of the Pools are to produce a relatively predictable and stable payout stream that increases over time at least as fast as the general rate of inflation and to preserve inter-generational equity by achieving growth of the Pools at a rate that at least keeps pace with the general rate of inflation, net of spending.
Without Donor Restrictions
Temporarily Restricted Permanently Restricted Total
Donor-restricted endowments $ 157,881 $ 616,822 $ 774,703 Quasi-endowments 110,294 110,294
Total funds $ 268,175 $ 616,822 $ 884,997
Without Donor Restrictions Temporarily Restricted Permanently Restricted Total
Endowment net assets, June 30, 2021 $ 285,826 $ 560,251 $ 846,077 Contributions and other additions 3,079 59,111 62,190
Investment return:
Interest and dividends 24,809 348 25,157 Net realized and unrealized gains (43,494) (3,040) (46,534)
Changes in assets due to other entities 28,211 28,211
Total investment return 9,526 (2,692) 6,834
Appropriation for expenditure (43,942) (1,168) (45,110) Reclassification of donor intent 13,686 1,320 15,006 Endowment net assets, June 30, 2022 $ 268,175 $ 616,822 $ 884,997
Property and equipment consist of (Dollars in thousands)
ASU Enterprise Partners ACFFC
Other Component Units Total
Cost or donated value: Buildings and improvements $ 17,384 $ 196,723 $ 1,887 $ 215,994 Furniture, fixtures, and equipment 8,592 79,165 3,845 91,602 Leasehold improvements 16,773 16,773 Software 12,356 12,356
Total cost or donated value 25,976 275,888 34,861 336,725
Accumulated depreciation (12,815) (171,281) (18,269) (202,365)
Net property and equipment $ 13,161 $ 104,607 $ 16,592 $ 134,360
Final Maturity
ASU Enterprise Partners ACFFC
Other Component Units Total
Series 2018 Tax-Exempt Revenue Bonds (Sun Devil Energy Center) 2038 $ 20,960 $ 20,960
Series 2017 Tax-Exempt Lease Revenue Refunding Bonds (Nanotechnology Research) 2034 22,825 22,825
Series 2017 Tax-Exempt Lease Revenue Refunding Bonds (ASU Energy Center) 2028 8,005 8,005
Series 2016 Tax-Exempt Revenue Refunding Bonds (Hassayampa Academic Village) 2039 113,355 113,355
Series 2014A Tax-Exempt Lease Revenue Bonds (DC Project) 2035 $ 27,910 27,910
Series 2014A Revenue Refunding Bonds (Fulton) 2034 30,425 30,425
Series 2012 Revenue Bonds (Phoenix Collegiate Academy Project) 2042 $ 4,835 4,835
Series 2009 Revenue Bonds (Energy Management Services) 2024 11,190 11,190
Series 2008 Variable Rate Demand Revenue Refunding Bonds (Sun Devil Energy Center) 2030 23,260 23,260
Series 2004A Variable Rate Revenue Bonds (Brickyard) 2034 22,420 22,420
Series 2004B Variable Rate Revenue Bonds (Brickyard) 2022 295 295
Unamortized loan costs (1,656) (1,656) Deferred Cost of Refunding (12,980) (12,980)
Unamortized bond premium (discount) (979) 11,324 (249) 10,096 $ 80,071 $ 196,283 $ 4,586 $ 280,940
The
Year
ACFFC
Other Component Units Total
4,600 $ 12,035 $ 4,586 $ 21,221
4,800 12,720 17,520
13,420 18,430
5,225 10,110 15,335
10,715 16,185
137,283 192,249
80,071 $ 196,283 $ 4,586 $ 280,940
The following represents summary financial information for ASU’s two major component units (ASU Enterprise Partners and ACFFC) and all nonmajor component units combined:
Statement of Financial Position June 30, 2022 (Dollars in thousands)
ASU Enterprise Partners ACFFC
Nonmajor Component Units Total Assets
Cash and cash equivalents $ 24,194 $ 6,956 $ 44,605 $ 75,755
Pledges receivables, net 155,822 23,659 179,481 Other receivables, net 9,087 402 75,808 85,297 Investments in securities 1,669,104 16,980 22,149 1,708,233 Other investments 80,324 80,324
Other assets 28,719 9 17,960 46,688
Net investment in direct financing leases 16,905 31,774 48,679 Property and equipment, net 13,161 104,607 16,592 134,360
Total Assets $ 1,997,316 $ 160,728 $ 200,773 $ 2,358,817
Accounts payable and accrued liabilities $ 39,373 $ 11,291 $ 10,060 $ 60,724 Deferred revenue 16,128 16,128 ASU endowment trust liability 384,081 384,081 Other liabilities 29,339 18,938 48,277 Long-term debt 80,071 196,283 4,586 280,940
Total Liabilities $ 532,864 $ 207,574 $ 49,712 $ 790,150
Without Donor Restrictions - Unrestricted $ 212,344 $ (46,846) $ 120,713 $ 286,211
With Donor Restrictions - Temporarily restricted 580,045 30,348 610,393 With Donor Restrictions - Permanently restricted 672,063 672,063
Total Net Assets (Deficit) $ 1,464,452 $ (46,846) $ 151,061 $ 1,568,667
Statement of Activities
Year ended June 30, 2022 (Dollars in thousands)
ASU Enterprise Partners ACFFC
Nonmajor Component Units Total Revenues
Contributions $ 206,803 $ 17,482 $ 224,285
Rental revenues 779 $ 16,518 12,486 29,783 Sales and services 31,883 12,716 4,033 48,632
Net investment return 99,998 16 266 100,280 Grants and aid 77,896 77,896
Other revenues 12,671 4,540 19,948 37,159
Total Revenues $ 352,134 $ 33,790 $ 132,111 $ 518,035
Payments to the benefit of ASUCash donation transfers to ASU $ 123,738 $ 8,764 $ 132,502 Vendor payments 7,523 7,523 Scholarship fund transfers to ASU 14,202 14,202 Rent payments to ASU $ 3,891 5,576 9,467
Management and general 48,375 10,495 90,000 148,870 Interest expense 1,166 7,410 8,576
Depreciation/amortization 1,271 10,407 399 12,077 Other expenses 16,193 60 1,300 17,553
Total Expenses $ 212,468 $ 32,263 $ 106,039 $ 350,770
Increase in Net Assets before Loss 139,666 1,527 26,072 167,265
Loss of uncollectible pledges (2,074) (2,074) Loss on disposal of assets (978) (978) Increase in Net Assets after Loss 139,666 1,527 23,020 164,213
Net Assets (Deficit), Beginning of Year 1,324,786 (48,373) 128,041 1,404,454 Net Assets (Deficit), End of Year $ 1,464,452 $ (46,846) $ 151,061 $ 1,568,667


Reporting Fiscal Year (Measurement Date)
2022 (2021) 2021 (2020) 2020 (2019) 2019 (2018) 2018 (2017) 2017 (2016) 2016 (2015) 2015 (2014)
University’s proportion of the net pension liability 3.90% 3.82% 3.82% 3.67% 3.48% 3.39% 3.19% 3.05%
University’s proportionate share of the net pension liability $ 512,172 $ 662,381 $ 555,246 $ 511,370 $ 542,354 $ 546,672 $ 497,351 $ 451,741
University’s covered payroll (trailing) $ 439,041 $ 418,542 $ 402,882 $ 365,389 $ 340,502 $ 318,111 $ 295,068 $ 276,395 University’s proportionate share of the net pension liability as a percentage of its covered payroll 116.66% 158.26% 137.82% 139.95% 159.28% 171.85% 168.55% 163.44%
Plan fiduciary net position as a percentage of the total pension liability 78.58% 69.33% 73.24% 73.40% 69.92% 67.06% 68.35% 69.49%
2013 through 2014
Information not available
Reporting Fiscal Year (Measurement Date) 2022 (2021) 2021 (2020) 2020 (2019) 2019 (2018) 2018 (2017) 2017 (2016) 2013 through 2016 University’s proportion of the total OPEB liability 20.38% 19.87% 19.87% 16.16% 15.95% 15.95%
University’s proportionate share of the total OPEB liability $ 244,247 $ 313,792 $ 252,852 $ 140,836 $ 134,500 $ 173,187
Actuarially-determined University’s covered payroll $ 911,715 $ 874,270 $ 851,285 $ 731,068 $ 711,848 $ 781,648 University’s proportionate share of the total OPEB liability as a percentage of its covered payroll 26.8% 35.9% 29.7% 19.3% 18.9% 22.2%
Information not available
Schedule of University Pension Contributions Arizona State Retirement System (Dollars in thousands) 2022 2021 (1) (as restated) 2020 (1) (as restated) 2019 (1) (as restated) 2018 (1) (as restated) 2017 (1) (as restated) 2016 (1) (as restated) 2015 2014 2013 Statutorily required contribution $ 54,327 $ 51,050 $ 47,844 $ 44,992 $ 39,726 $ 36,607 $ 34,408 $ 32,026 $ 29,447 $ 26,714 University’s contributions in relation to the statutorily required contribution $ 54,327 51,050 47,844 44,992 39,726 36,607 34,408 32,026 29,447 26,714 University’s contribution deficiency (excess) $ 0 $ 0 $ 0 $ 0 $ 0 $ 0 $ 0 $ 0 $ 0 $ 0
University’s covered payroll $ 453,460 $ 439,041 $ 418,542 $ 402,882 $ 365,389 $ 340,502 $ 318,111 $ 295,068 $ 276,395 $ 261,965 University’s contributions as a percentage of covered payroll 11.98% 11.63% 11.43% 11.17% 10.87% 10.75% 10.82% 10.85% 10.65% 10.20% (1) University contributions are based on the employer contributions in the University’s records. Each year there is an immaterial difference between employer pension contributions ASRS recognized and the employer contributions in the University’s records due to timing differences. Prior year University contributions have been restated using the employer contributions ASRS recognized.


Combining Statement of Financial Position June 30, 2022 (Dollars in thousands)
Cash and cash equivalents $ 647 $ 30,222 $ 6,218 $ 7,518 $ 44,605 Pledges receivables, net 23,659 23,659 Other receivables, net 184 12,690 54,278 8,656 75,808 Investments in securities 22,149 22,149
Other assets 72 15,123 2,476 289 17,960 Property and equipment, net 11,867 4,725 16,592
Total Assets $ 23,052 $ 69,902 $ 67,697 $ 40,122 $ 200,773
Accounts payable and accrued liabilities $ 138 $ 9,511 $ 145 $ 266 $ 10,060 Deferred revenue 108 3,085 12,935 16,128 Other liabilities 26 14,336 4,576 18,938 Long-term debt 4,586 4,586
Total Liabilities $ 272 $ 31,518 $ 17,656 $ 266 $ 49,712
Without Donor RestrictionsUnrestricted $ 22,696 $ 38,360 $ 50,041 $ 9,616 $ 120,713
With Donor RestrictionsTemporarily restricted 84 24 30,240 30,348
With Donor RestrictionsPermanently restricted
Total Net Assets $ 22,780 $ 38,384 $ 50,041 $ 39,856 $ 151,061
Contributions $ 1,139 $ 1,661 $ 14,682 $ 17,482 Rental revenues $ 12,486 12,486 Sales and services 1,323 2,258 452 4,033 Net investment return 255 3 8 266 Grants and aid 77,896 77,896 Other revenues 14 19,428 122 384 19,948
Total Revenues $ 2,731 $ 101,243 $ 12,611 $ 15,526 $ 132,111 Expenses
Payments to the benefit of ASUCash donation transfers to ASU $ 8,764 $ 8,764 Rent payments to ASU $ 5,576 5,576 Management and general $ 3,149 $ 84,856 1,191 804 90,000 Depreciation/amortization 399 399 Other expenses 71 150 1,079 1,300
Total Expenses $ 3,220 $ 84,856 $ 7,316 $ 10,647 $ 106,039
Increase/(Decrease) in Net Assets, before Loss (489) 16,387 5,295 4,879 26,072
Loss of uncollectible pledges (2,074) (2,074) Loss on disposal of assets (978) (978) Increase/(Decrease) in Net Assets after Loss (489) 15,409 5,295 2,805 23,020
Net Assets, Beginning of Year 23,269 22,975 44,746 37,051 128,041 Net Assets, End of Year $ 22,780 $ 38,384 $ 50,041 $ 39,856 $ 151,061

These schedules contain trend information to help the reader understand how the University’s financial performance has changed over time.
• Net Position by Component
• Net Position
• Changes in Net Position
• Operating Expenses by Natural Classification
• Combined Sources and Uses
These schedules contain information to help the reader assess the University’s revenue sources.
• Principal Revenue Sources
• Academic Year Tuition and Required Fees
These schedules present information used to determine the Composite Financial Index which is a measurement of the Institution’s financial health based on four core ratios.
• Primary Reserve Ratio
• Return Net Position/Net Asset Ratio
• Net Operating Revenues Ratio
• Viability Ratio
These schedules present information to help the reader assess the University’s current level of outstanding debt.
• Summary of Ratios
• Debt Coverage for Senior and Subordinate Lien Bonds
• Long-term Debt
These schedules contain demographic and economic indicators to help the reader understand the environment in which the University’s financial activities take place.
• Admissions, Enrollment, and Degrees Earned
• Demographic Data
• Principal Employers
These schedules contain service and infrastructure data to help the reader understand how the University’s financial information relates to the activities it performs.
• Faculty and Staff
• Capital Assets
Fiscal year ended June 30, 2022 2021 2020 2019 2018 2017 2016 2015 2014 2013 (Dollars in thousands)
Net investment in capital assets (1) $ 1,147,404 $ 1,107,148 $ 1,042,673 $ 985,149 $ 956,220 $ 852,262 $ 778,867 $ 718,642 $ 695,591 $ 664,867 Restricted, Nonexpendable 104,729 91,623 87,497 84,714 78,813 74,102 70,544 64,833 59,476 55,572 Restricted, Expendable 203,211 175,937 127,614 118,626 119,410 124,703 117,977 109,664 113,948 104,880 Unrestricted (2) 437,294 235,307 104,279 166,899 115,542 282,765 253,728 161,623 563,307 511,298
Total Net Position $ 1,892,638 $ 1,610,015 $ 1,362,063 $1,355,388 $ 1,269,985 $ 1,333,832 $ 1,221,116 $ 1,054,762 $ 1,432,322 $ 1,336,617
Expressed as a percent of the total % % % % % % % % % %
Net investment in capital assets 60.6 68.8 76.6 72.7 75.3 63.9 63.8 68.1 48.5 49.7 Restricted, Nonexpendable 5.5 5.7 6.4 6.3 6.2 5.6 5.8 6.2 4.2 4.2 Restricted, Expendable 10.8 10.9 9.4 8.8 9.4 9.3 9.6 10.4 8.0 7.8 Unrestricted 23.1 14.6 7.6 12.2 9.1 21.2 20.8 15.3 39.3 38.3
Total Net Position 100.0 100.0 100.0 100.0 100.0 100.0 100.0 100.0 100.0 100.0
Percentage increase/(decrease) from prior year % % % % % % % % % %
Net investment in capital assets 3.6 6.2 5.8 3.0 12.2 9.4 8.4 3.3 4.6 3.4 Restricted, Nonexpendable 14.3 4.7 3.3 7.5 6.4 5.0 8.8 9.0 7.0 5.0 Restricted, Expendable 15.5 37.9 7.6 (0.7) (4.2) 5.7 7.6 (3.8) 8.6 13.2 Unrestricted 85.8 125.7 (37.5) 44.4 (59.1) 11.4 57.0 (71.3) 10.2 10.4
Total Net Position 17.6 18.2 0.5 6.7 (4.8) 9.2 15.8 (26.4) 7.2 6.8
(1) Balances prior to FY 2014 have not been adjusted for the implementation of GASB Statement No. 65, Items Previously Reported as Assets and Liabilities. Balances prior to FY 2016 have not been adjusted for the implementation of GASB Statement No. 72, Fair Value Measurement and Application (2) Balances prior to FY 2015 have not been adjusted for the implementation of GASB Statement No. 68, Accounting and Financial Reporting for Pensions – an amendment of GASB Statement No. 27, as amended by GASB Statement No. 71, Pension Transition for Contributions Made Subsequent to the Measurement Date – an amendment of GASB Statement No. 68. Balances prior to FY 2016 have not been adjusted for the implementation of GASB Statement No. 72, Fair Value Measurement and Application. Balances prior to FY 2018 have not been adjusted for the implementation of GASB Statement No. 75, Accounting and Financial Reporting for Postemployment Benefits Other then Pensions, as amended by GASB Statement No. 85, Omnibus 2017.
Cash and cash equivalents $ 354,327 $ 370,630 $ 272,636 $ 239,203 $ 78,147 $ 167,188 $ 72,543 $ 47,316 $ 33,551 $ 49,964
Short-term investments 87,153 48,819 89,712 70,908 43,789 45,739 68,527 30,775 71,760 118,330
Accounts receivables, net 350,201 341,511 240,862 238,119 134,045 143,601 120,235 110,561 92,554 72,510
Lease receivables 3,527
Receivables from State of Arizona 90,575 90,575 90,575 Other assets 18,167 12,149 12,664 5,714 2,623 4,282 3,344 3,377 8,863 2,188 Total Current Assets $ 813,375 $ 773,109 $ 615,874 $ 553,944 $ 258,604 $ 360,810 $ 264,649 $ 282,604 $ 297,303 $ 333,567
Restricted cash and cash equivalents $ 207,879 $ 243,260 $ 273,773 $ 280,166 $ 215,942 $ 298,730 $ 236,711 $ 247,270 $ 137,343 $ 140,110
Endowment investments 401,426 371,178 256,932 250,356 137,372 130,118 113,659 116,252 114,146 99,822
Other investments 856,615 672,140 594,531 595,537 814,098 732,745 729,729 572,558 501,779 360,591
Student loans receivable, net 3,674 5,452 6,397 7,820 8,185 10,365 10,923 10,668 11,262 10,872
Lease receivables 60,103
Other assets/equity interest for Thunderbird 4,411 185 195 361 595 526 17,200 17,401 1,473 7,018
Capital assets, net 3,604,752 3,227,901 2,949,115 2,749,258 2,634,819 2,433,826 2,226,823 2,076,892 1,945,532 1,876,261
Total Noncurrent Assets $ 5,138,860 $ 4,520,116 $ 4,080,943 $ 3,883,498 $ 3,811,011 $ 3,606,310 $ 3,335,045 $ 3,041,041 $ 2,711,535 $ 2,494,674
Total Assets $ 5,952,235 $ 5,293,225 $ 4,696,817 $ 4,437,442 $ 4,069,615 $ 3,967,120 $ 3,599,694 $ 3,323,645 $ 3,008,838 $ 2,828,241
Deferred Outflows of Resources
Interest rate swap $ 5,842 $ 15,058 $ 20,107 $ 15,298 $ 11,043 $ 15,379 $ 23,206 $ 16,772 $ 14,135 $ 14,078 Unamortized loss on refunding debt 19,672 21,650 27,536 29,594 31,968 30,449 40,912 42,475 17,763 Pensions related and other postemployment benefits 240,575 250,317 185,322 115,338 103,546 138,215 77,199 72,481
Total Deferred Outflows of Resources $ 266,089 $ 287,025 $ 232,965 $ 160,230 $ 146,557 $ 184,043 $ 141,317 $ 131,728 $ 31,898 $ 14,078
Liabilities
Current Liabilities
Accounts payable and accrued liabilities $ 182,654 $ 259,009 $ 208,749 $ 187,417 $ 149,666 $ 127,029 $ 131,156 $ 94,998 $ 80,259 $ 76,697 Compensated absences 6,033 5,528 4,844 3,919 3,723 3,286 3,235 3,167 3,297 3,057 Unearned revenues 295,152 244,487 196,674 167,545 78,192 65,619 51,385 55,176 61,964 42,645 Funds held for others 20,412 15,871 13,338 19,961 17,898 23,350 29,054 18,270 12,476 11,409
Lease liabilities 22,132
Current portion of long-term debt 171,655 172,197 168,432 165,240 158,716 153,132 159,784 70,780 66,844 50,206
Total Current Liabilities $ 698,038 $ 697,092 $ 592,037 $ 544,082 $ 408,195 $ 372,416 $ 374,614 $ 242,391 $ 224,840 $ 184,014
Noncurrent Liabilities
Compensated absences $ 42,455 $ 44,388 $ 41,093 $ 33,352 $ 31,570 $ 28,772 $ 27,441 $ 26,847 $ 24,476 $ 23,825 Other liabilities 23,696 19,557 17,496 10,819 11,614 2,577 3,558 25,815 39,158 12,574
Derivative instrument - Interest rate swap 5,842 15,058 20,107 15,298 11,043 15,379 23,206 16,772 14,135 14,078 Net Pension and other postemployment benefits liability 787,549 1,029,747 860,875 700,057 719,592 631,938 559,071 484,133
Lease liabilities 219,448
Long-term debt 2,193,845 2,133,253 1,967,018 1,835,792 1,690,670 1,697,622 1,489,533 1,525,037 1,305,805 1,271,211
Total Noncurrent Liabilities $ 3,272,835 $ 3,242,003 $ 2,906,589 $ 2,595,318 $ 2,464,489 $ 2,376,288 $ 2,102,809 $ 2,078,604 $ 1,383,574 $ 1,321,688
Total Liabilities $ 3,970,873 $ 3,939,095 $ 3,498,626 $ 3,139,400 $ 2,872,684 $ 2,748,704 $ 2,477,423 $ 2,320,995 $ 1,608,414 $ 1,505,702
Deferred Inflows of Resources Unamortized gain on refunding debt $ 2,013 $ 2,218 $ 1,607 $ 1,761 $ 1,894 $ 1,116 Pensions related and
71,609 67,511 $ 42,472 $ 79,616 Leases 63,420
Total Deferred Inflows of Resources $
Net Position
$
$
$
$
$ 68,627 $ 42,472 $ 79,616
$
$
$ 778,867 $ 718,642 $ 695,591 $ 664,867 Restricted
6,737 5,648 4,618 4,000 Expendable:
aid
Academic department uses
projects and debt
Unrestricted
Total Net Position
Balances prior to FY 2015 have not been adjusted for the
pensions
$
38,907
6,536 1,636
$
$
46,498
$
Balances prior to FY 2018 have not been adjusted for the implementation of GASB OPEB standards.
Cash and cash equivalents $ 354,327 $ 370,630 $ 272,636 $ 239,203 $ 78,147 $ 167,188 $ 72,543 $ 47,316 $ 33,551 $ 49,964
Short-term investments 87,153 48,819 89,712 70,908 43,789 45,739 68,527 30,775 71,760 118,330
Accounts receivables, net 350,201 341,511 240,862 238,119 134,045 143,601 120,235 110,561 92,554 72,510
Lease receivables 3,527
Receivables from State of Arizona 90,575 90,575 90,575 Other assets 18,167 12,149 12,664 5,714 2,623 4,282 3,344 3,377 8,863 2,188
Total Current Assets $ 813,375 $ 773,109 $ 615,874 $ 553,944 $ 258,604 $ 360,810 $ 264,649 $ 282,604 $ 297,303 $ 333,567
Restricted cash and cash equivalents $ 207,879 $ 243,260 $ 273,773 $ 280,166 $ 215,942 $ 298,730 $ 236,711 $ 247,270 $ 137,343 $ 140,110
Endowment investments 401,426 371,178 256,932 250,356 137,372 130,118 113,659 116,252 114,146 99,822
Other investments 856,615 672,140 594,531 595,537 814,098 732,745 729,729 572,558 501,779 360,591
Student loans receivable, net 3,674 5,452 6,397 7,820 8,185 10,365 10,923 10,668 11,262 10,872
Lease receivables 60,103
Other assets/equity interest for Thunderbird 4,411 185 195 361 595 526 17,200 17,401 1,473 7,018 Capital assets, net 3,604,752 3,227,901 2,949,115 2,749,258 2,634,819 2,433,826 2,226,823 2,076,892 1,945,532 1,876,261
Total Noncurrent Assets $ 5,138,860 $ 4,520,116 $ 4,080,943 $ 3,883,498 $ 3,811,011 $ 3,606,310 $ 3,335,045 $ 3,041,041 $ 2,711,535 $ 2,494,674
Total Assets $ 5,952,235 $ 5,293,225 $ 4,696,817 $ 4,437,442 $ 4,069,615 $ 3,967,120 $ 3,599,694 $ 3,323,645 $ 3,008,838 $ 2,828,241
Deferred Outflows of Resources
Interest rate swap $ 5,842 $ 15,058 $ 20,107 $ 15,298 $ 11,043 $ 15,379 $ 23,206 $ 16,772 $ 14,135 $ 14,078 Unamortized loss on refunding debt 19,672 21,650 27,536 29,594 31,968 30,449 40,912 42,475 17,763
Total Deferred Outflows of Resources $ 25,514 $ 36,708 $ 47,643 $ 44,892 $ 43,011 $ 45,828 $ 64,118 $ 59,247 $ 31,898 $ 14,078
Liabilities
Current Liabilities
Accounts payable and accrued liabilities $ 194,577 $ 270,284 $ 219,696 $ 196,100 $ 157,300 $ 136,679 $ 137,378 $ 99,910 $ 80,259 $ 76,697
Compensated absences 6,033 5,528 4,844 3,919 3,723 3,286 3,235 3,167 3,297 3,057 Unearned revenues 295,152 244,487 196,674 167,545 78,192 65,619 51,385 55,176 61,964 42,645
Funds held for others 20,412 15,871 13,338 19,961 17,898 23,350 29,054 18,270 12,476 11,409 Lease liabilities 22,132
Current portion of long-term debt 171,655 172,197 168,432 165,240 158,716 153,132 159,784 70,780 66,844 50,206
Total Current Liabilities $ 709,961 $ 708,367 $ 602,984 $ 552,765 $ 415,829 $ 382,066 $ 380,836 $ 247,303 $ 224,840 $ 184,014
Noncurrent Liabilities
Compensated absences $ 42,455 $ 44,388 $ 41,093 $ 33,352 $ 31,570 $ 28,772 $ 27,441 $ 26,847 $ 24,476 $ 23,825 Other liabilities 40,377 36,126 34,490 28,786 27,427 17,229 18,206 38,302 39,158 12,574
Derivative instrument - Interest rate swap 5,842 15,058 20,107 15,298 11,043 15,379 23,206 16,772 14,135 14,078
Lease liabilities 219,448 Long-term debt 2,193,845 2,133,253 1,967,018 1,835,792 1,690,670 1,697,622 1,489,533 1,525,037 1,305,805 1,271,211
Total Noncurrent Liabilities $ 2,501,967 $ 2,228,825 $ 2,062,708 $ 1,913,228 $ 1,760,710 $ 1,759,002 $ 1,558,386 $ 1,606,958 $ 1,383,574 $ 1,321,688
Total Liabilities $ 3,211,928 $ 2,937,192 $ 2,665,692 $ 2,465,993 $ 2,176,539 $ 2,141,068 $ 1,939,222 $ 1,854,261 $ 1,608,414 $ 1,505,702
Deferred Inflows of Resources Unamortized gain on refunding debt $ 2,013 $ 2,218 $ 1,607 $ 1,761 $ 1,894 $ 1,116 Leases 63,420
Total Deferred Inflows of Resources $ 65,433 $ 2,218 $ 1,607 $ 1,761 $ 1,894 $ 1,116
Net Position
Restricted
$
$
$
$ 956,220 $ 852,262 $ 778,867 $ 718,642 $ 695,591 $ 664,867
Changes in Net Position (Dollars
Student tuition and fees, net $ 1,689,832 $ 1,598,180 $ 1,550,581 $ 1,423,052 $ 1,323,268 $ 1,250,828 $ 1,157,535 $ 1,021,014 $ 896,921 $ 802,965
Research grants and contracts 416,703 364,375 365,498 344,128 313,558 271,730 253,158 237,489 244,293 238,031
Auxiliary enterprises 243,554 124,080 170,182 183,534 166,057 161,797 149,734 145,008 140,535 122,453
Educational departments 103,957 93,279 72,451 78,508 94,158 81,543 69,523 67,230 58,449 56,006 Other revenues 37,918 40,872 21,884 19,347 18,745 16,326 14,387 12,001 8,447 8,018
Total Operating Revenues $ 2,491,964 $ 2,220,786 $ 2,180,596 $ 2,048,569 $ 1,915,786 $ 1,782,224 $ 1,644,337 $ 1,482,742 $ 1,348,645 $ 1,227,473
Expenses
Educational and general Instruction $ 1,076,407 $ 1,053,721 $ 1,016,720 $ 961,580 $ 881,696 $ 810,656 $ 749,722 $ 686,397 $ 617,091 $ 548,998 Research 414,259 384,431 359,936 323,623 297,448 267,303 261,055 244,763 235,720 225,453 Public service 47,842 100,908 38,415 36,140 37,524 35,378 36,807 36,201 40,209 44,860
Academic support 396,339 392,787 371,378 304,645 299,208 294,706 265,540 247,700 225,853 204,831
Student services 176,664 159,384 166,131 151,295 136,125 123,377 111,018 98,491 72,409 65,908
Institutional support 212,285 201,507 188,937 171,016 159,109 152,226 155,172 151,613 136,334 124,546
Operation and maintenance of plant 116,116 105,823 113,640 122,567 119,349 116,456 108,454 102,167 98,901 91,077
Scholarships and fellowships 293,349 300,202 292,914 247,194 211,811 187,124 152,802 136,675 127,468 112,363
Auxiliary enterprises 225,493 184,771 191,862 179,578 175,130 154,794 147,562 143,184 130,550 119,509
Depreciation 201,287 152,440 143,587 137,064 132,814 123,705 116,381 114,617 112,270 106,992
Total Operating Expenses $ 3,160,041 $ 3,035,974 $ 2,883,520 $2,634,702 $ 2,450,214 $ 2,265,725 $ 2,104,513 $ 1,961,808 $ 1,796,805 $ 1,644,537 Operating Loss $ (668,077) $ (815,188) $ (702,924) $ (586,133) $ (534,428) $ (483,501) $ (460,176) $ (479,066) $ (448,160) $ (417,064)
Nonoperating Revenues (Expenses)
State appropriations $ 385,527 $ 306,346 $ 323,332 $ 303,370 $ 306,778 $ 296,913 $ 281,385 $ 338,042 $ 314,493 $ 297,402 Share of state tax - TRIF 44,600 36,833 34,075 34,604 32,540 31,326 31,075 26,526 27,785 25,225
Financial aid grants 200,843 198,432 186,818 168,230 152,500 128,474 124,188 115,070 106,855 104,415 Grants and contracts 256,969 379,817 71,623 57,365 58,624 56,233 56,743 49,037 35,863 42,195
Private gifts 76,602 76,335 76,803 82,731 75,791 74,282 99,612 57,651 64,928 59,807 Financial aid trust funds (1) 16,019 14,833 13,615 12,393 11,114
Net investment return (loss) (58,838) 75,808 44,756 60,603 12,778 23,038 9,382 5,133 20,263 9,494 Interest on debt (76,122) (67,838) (65,342) (63,413) (61,903) (69,135) (59,972) (53,428) (52,674) (53,331)
Other expenses (7,102) (16,573) (15,982) (22,341) (8,590) (7,610) (16,039) (9,814) (9,642) (10,995)
Net Nonoperating Revenues $ 822,479 $ 989,160 $
Income (loss) before other revenues, expenses, gains, or
Capital appropriations $
Capital
Capital
$ 154,402 $
$
$
$ 568,518 $ 549,540 $ 541,207 $ 541,832 $ 520,264 $ 485,326
$
$ 66,039 $ 81,031 $ 62,766 $ 72,104 $ 68,262
$
$
$
Additions to permanent endowments 27 1,348 170 426 34 13 1,577 2,089 904 77 Gain on the sale of real property
Special Items (5,294)
Extraordinary Item - insurance recovery 3,900 Increase in Net Position $ 243,946 $
Total Revenues $
$
$
$ 63,074 $ 99,373 $ 108,504 $ 92,240 $ 103,313 $ 85,049
2,289,028 $ 2,117,290 $ 1,962,434 $
1,859,121
108,504
92,240
103,313
Changes in Net
Operating Revenues
Student tuition and fees, net
12.1 11.1 11.1 11.2 12.4 13.2
51.2 50.6 48.2 45.7 44.6 Research grants and contracts
Auxiliary enterprises 7.0 3.7
6.5 6.4 6.6 6.5 6.9 7.2 6.8 Educational departments 3.0 2.8 2.5 2.8 3.7 3.4 3.0 3.2 3.0 3.1
Other revenues
Total Operating Revenues
Educational and general Instruction
0.7 0.7 0.6 0.6 0.4 0.4
73.0 71.8 70.1 68.7 68.1
35.3 35.0 34.6 34.4 33.9 33.2 32.0 Research 12.8 12.3 12.1 11.9 11.8 11.4 12.0 12.1 12.7 13.2 Public service 1.5 3.2 1.3 1.3 1.5 1.5 1.7 1.8 2.2 2.6
Academic support 12.2 12.6 12.5 11.2 11.9 12.6 12.2 12.2 12.1 11.9 Student services 5.4 5.1 5.6 5.6 5.4 5.3 5.1 4.9 3.9 3.8 Institutional support 6.5 6.5 6.4 6.3 6.3 6.5 7.1 7.5 7.3 7.3
Operation and maintenance of plant 3.6 3.4 3.8 4.5 4.7 5.0 5.0 5.0 5.3 5.3
Scholarships and fellowships 9.0 9.6 9.9 9.1 8.4 8.0 7.0 6.7 6.9 6.6
Auxiliary enterprises 7.0 5.9 6.6 6.6 6.9 6.6 6.7 7.1 7.0 7.0
Depreciation 6.2 4.9 4.8 5.0 5.3 5.3 5.3 5.7 6.0 6.2
Total Operating Expenses 90.7 90.1 97.3 93.9 94.8 92.8 91.9 92.7 91.5 91.4
Operating Loss (19.2) (24.2) (23.6) (20.9) (20.7) (19.8) (20.1) (22.6) (22.8) (23.3)
Nonoperating Revenues (Expenses)
State appropriations 11.1 9.1 10.9 11.0 11.9 12.2 12.3 16.0 16.0 16.5
Share of state tax - TRIF 1.3 1.1 1.1 1.2 1.3 1.3 1.4 1.3 1.4 1.4 Financial aid grants 5.8 5.9 6.3 6.0 5.9 5.3 5.4 5.4 5.4 5.8
Grants and contracts 7.4 11.3 2.4 2.0 2.3 2.3 2.5 2.3 1.8 2.3 Private gifts 2.2 2.3 2.6 2.9 2.9 3.0 4.4 2.7 3.3 3.3
Financial aid trust funds (1) 0.0 0.0 0.0 0.0 0.0 0.6 0.6 0.6 0.6 0.6 Net investment return (loss) (1.8) 2.3 1.5 2.2 0.5 0.9 0.4 0.2 1.0 0.5 Interest on debt 2.3 2.2 2.2 2.4 2.5 2.9 2.8 2.6 2.8 3.1
Other expenses 0.2 0.5 0.5 0.8 0.3 0.3 0.7 0.5 0.5 0.6
Net Nonoperating Revenues 23.5 29.3 22.1 22.1 22.0 22.5 23.6 25.6 26.5 27.0 Income (loss) before other revenues, expenses, gains, or losses 4.3 5.1 (1.5) 1.2 1.3 2.7 3.5 3.0 3.7 3.8
Capital appropriations 0.7 0.8 0.9 0.9 0.5 0.5 0.5 0.7 0.7 0.8
Capital commitment 0.9 0.3 0.3 0.3 0.4 0.6 0.4 0.2 0.1 0.2
Capital grants 0.1 0.4 0.0 0.0 0.0 0.0 0.0 0.0 0.0 0.0
Capital private gifts 0.8 0.1 0.6 0.5 0.2 0.3 0.2 0.4 0.4 0.1 Additions to permanent endowments 0.0 0.0 0.0 0.0 0.0 0.0 0.1 0.1 0.0 0.0 Gain on the sale of real property 0.0 0.5 0.0 0.0 0.0 0.0 0.0 0.0 0.0 0.0
Special Items 0.0 0.0 0.0 0.0 0.0 0.0 0.0 0.0 0.0 (0.3)
Extraordinary Item - insurance recovery
Increase in Net Position
0.0 0.0 0.0 0.0 0.0 0.2 0.0
4.1 4.7 4.4 5.3 4.7
Balances prior to FY 2018 presented Financial Aid Trust funds as a nonoperating revenue source. In FY 2018 Financial Aid Trust fund activities were included in student tuition and fees, net and state appropriations.
Percent of Total Expense is italicized.
Changes in Net Position (Percentage increase (decrease) from prior year)
Student tuition and fees, net 5.7 3.1 9.0 7.5 5.8 8.1 13.4 13.8 11.7 6.0 Research grants and contracts 14.4 (0.3) 6.2 9.7 15.4 7.3 6.6 (2.8) 2.6 3.6
Auxiliary enterprises 96.3 (27.1) (7.3) 10.5 2.6 8.1 3.3 3.2 14.8 16.1 Educational departments 11.4 28.7 (7.7) (16.6) 15.5 17.3 3.4 15.0 4.4 4.0
Other revenues (7.2) 86.8 13.1 3.2 14.8 13.5 19.9 42.1 5.4 (10.4)
Total Operating Revenues 12.2 1.8 6.4 6.9 7.4 8.4 10.9 9.9 9.9 6.2
Educational and general Instruction 2.2 3.6 5.7 9.1 8.8 8.1 9.2 11.2 12.4 5.8 Research 7.8 6.8 11.2 8.8 11.3 2.4 6.7 3.8 4.6 6.6
Public service (52.6) 162.7 6.3 (3.7) 6.1 (3.9) 1.7 (10.0) (10.4) (4.4) Academic support 0.9 5.8 21.9 1.8 1.5 11.0 7.2 9.7 10.3 10.2 Student services 10.8 (4.1) 9.8 11.1 10.3 11.1 12.7 36.0 9.9 8.5 Institutional support 5.3 6.7 10.5 7.5 4.5 (1.9) 2.3 11.2 9.5 3.4
Operation and maintenance of plant 9.7 (6.9) (7.3) 2.7 2.5 7.4 6.2 3.3 8.6 5.0
Scholarships and fellowships (2.3) 2.5 18.5 16.7 13.2 22.5 11.8 7.2 13.4 (0.7)
Auxiliary enterprises 22.0 (3.7) 6.8 2.5 13.1 4.9 3.1 9.7 9.2 3.2
Depreciation 32.0 6.2 4.8 3.2 7.4 6.3 1.5 2.1 4.9 9.2
Total Operating Expenses 4.1 5.3 9.4 7.5 8.1 7.7 7.3 9.2 9.3 5.5
Operating Loss (18.0) 16.0 19.9 9.7 10.5 5.1 (3.9) 6.9 7.5 3.5
Nonoperating Revenues (Expenses)
State appropriations 25.8 (5.3) 6.6 (1.1) 3.3 5.5 (16.8) 7.5 5.7 (3.4)
Share of state tax - TRIF 21.1 8.1 (1.5) 6.3 3.9 0.8 17.1 (4.5) 10.1 6.0
Financial aid grants 1.2 6.2 11.0 10.3 18.7 3.5 7.9 7.7 2.3 (5.3)
Grants and contracts (32.3) 430.3 24.9 (2.1) 4.3 (0.9) 15.7 36.7 (15.0) (14.3) Private gifts 0.3 (0.6) (7.2) 9.2 2.0 (25.4) 72.8 (11.2) 8.6 8.1
Financial aid trust funds (1) n/a n/a n/a n/a (100.0) 8.0 8.9 9.9 11.5 0.8
Net investment return (loss) (177.6) 69.4 (26.1) 374.3 (44.5) 145.6 82.8 (74.7) 113.4 (682.8)
Interest on debt 12.2 3.8 3.0 2.4 (10.5) 15.3 12.2 1.4 (1.2) 10.9
Other expenses (57.1) 3.7 (28.5) 160.1 12.9 (52.6) 63.4 1.8 (12.3) 31.6
Net Nonoperating Revenues (16.9) 50.8 5.6 9.3 3.5 1.5 (0.1) 4.1 7.2 (2.8)
Income (loss) before other revenues, expenses, gains, or losses (11.2) (471.4) (233.8) 2.7 (48.4) (18.5) 29.1 (13.0) 5.6 (29.0)
Capital appropriations 0.6 0.9 0.9 88.5 20.5 (2.0) (23.9) 3.7 0.0 0.0
Capital commitment 232.7 (5.1) 0.1 (0.1) (38.1) 61.7 86.2 87.4 (36.0) 159.3
Capital grants (61.3) 1,035.0 1,779.0 (43.1) (65.9) n/a (99.4) (82.3) 17.3 (53.5)
Capital private gifts 694.4 (79.1) 13.8 157.0 (8.9) 29.5 (30.5) (14.5) 231.9 (65.3)
Additions to permanent endowments (98.0) 692.9 (60.1) 1,152.9 161.5 (99.2) (24.5) 131.1 1,074.0 2,466.7 Gain on the sale of real property n/a n/a n/a n/a n/a n/a n/a n/a n/a n/a
Special Items n/a n/a n/a n/a n/a n/a n/a n/a n/a n/a
Extraordinary Item - insurance recovery n/a n/a n/a n/a n/a n/a n/a n/a n/a n/a Increase (Decrease) in Net Position (1.6) 3,614.6 (92.2) 35.4 (36.5) (8.4) 17.6 (10.7) 21.5 (29.8)
(1) Balances prior to FY 2018 presented Financial Aid Trust funds as a nonoperating revenue source. In FY 2018 Financial Aid Trust fund activities were included in student tuition and fees, net and state appropriations.
Fiscal year ended June 30, 2022 2021 2020
(Dollars in thousands)
Personal services $ 1,265,232 $ 1,192,165 $ 1,166,804 $ 1,090,068 $1,019,332 $ 949,189 $ 888,936 $ 830,440 $ 761,778 $ 711,641 Benefits 389,209 386,644 380,162 357,601 343,363 309,033 298,199 285,991 268,025 236,380 Pensions and OPEB (1) 27,242 65,410 55,906 (5,016) 355 33,458 29,605 4,069
Personal services and benefits 1,681,683 1,644,219 1,602,872 1,442,653 1,363,050 1,291,680 1,216,740 1,120,500 1,029,803 948,021 Supplies and services 983,722 939,113 844,147 807,791 742,539 663,216 601,218 576,345 514,355 464,452 Student aid, net scholarship al lowance 293,349 300,202 292,914 247,194 211,811 187,124 170,174 150,346 140,377 125,072 Depreciation 201,287 152,440 143,587 137,064 132,814 123,705 116,381 114,617 112,270 106,992
Total Operating Expenses by Natural Classification $ 3,160,041 $ 3,035,974 $ 2,883,520 $ 2,634,702 $2,450,214 $2,265,725 $2,104,513 $1,961,808 $1,796,805 $ 1,644,537 Expressed as a percent of the total %
Personal services
% % % % %
41.7 41.9 42.2 42.3 42.4 43.3 Benefits 12.3 12.7
14.0 13.6 14.2 14.6 14.9 14.4 Pensions and OPEB (1) 0.9 2.2 1.9 (0.2) 0.0 1.5 1.4 0.2
Personal services and benefits 53.2 54.2 55.6 54.8 55.6 57.0 57.8 57.1 57.3 57.7 Supplies and services 31.1 30.9 29.2 30.6 30.3 29.2 28.6 29.4 28.6 28.2
Student aid, net scholarship al lowance 9.3 9.9 10.2 9.4 8.7 8.3 8.1 7.7 7.8 7.6
Depreciation 6.4 5.0 5.0 5.2 5.4 5.5 5.5 5.8 6.3 6.5
Total Operating Expenses by Natural Classification 100.0 100.0 100.0 100.0 100.0 100.0 100.0 100.0 100.0 100.0
Percentage increase/(decrease) from prior year % % % % % % % % % %
Personal services 6.1 2.2 7.0 6.9 7.4 6.8 7.0 9.0 7.0 4.7 Benefits 0.7 1.7 6.3 4.1 11.1 3.6 4.3 6.7 13.4 2.2 Pensions and OPEB (1) (58.4) 17.0 1,214.6 (1,513.0) (98.9) 13.0 627.6
Personal services and benefits 2.3 2.6 11.1 5.8 5.5 6.2 8.6 8.8 8.6 4.1
Supplies and services 4.8 11.2 4.5 8.8 12.0 10.3 4.3 12.1 10.7 9.6
Student aid, net scholarship al lowance (2.3) 2.5 18.5 16.7 11.8 10.0 13.2 7.1 12.2 (0.5)
Depreciation 32.0 6.2 4.8 3.2 7.4 6.3 1.5 2.1 4.9 9.2
Total Operating Expenses by Natural Classification 4.1 5.3 9.4 7.5 8.0 7.7 7.3 9.2 9.3 5.5
(1) Implementations of GASB 45/75 (OPEB) and GASB 68 (Pensions) resulted in recognition of benefit-related operating expenses each year. The impact of these implementations has been presented separately
Student Tuition and Fees, net $ 1,689.8 $ 1,598.2 $ 1,550.6 $ 1,423.1 $ 1,323.3 $ 1,250.8 $ 1,157.5 $ 1,021.0 $ 896.9 $ 803.0
Gross Tuition and Fees 2,276.3 2,134.3 2,013.3 1,825.6 1,697.4 1,585.4 1,453.8 1,278.0 1,117.8 1,005.8
Scholarship Allowance 586.5 536.1 462.7 402.5 374.1 334.6 296.3 257.0 220.9 202.8
State Appropriation 411.5 332.2 348.9 328.8 320.3 308.1 292.8 353.0 329.0 311.9
Capital Appropriation 26.0 25.8 25.6 25.4 13.5 11.2 11.4 15.0 14.5 14.5
Grants and Contracts 678.8 757.4 423.2 401.5 372.3 328.3 309.9 286.7 281.1 281.0 Federally Funded 593.6 489.1 301.1 304.5 262.0 238.3 242.3 229.9 247.9 225.4
Financial Aid Grants 200.8 198.4 186.8 168.2 152.5 128.5 124.2 115.1 106.9 104.4 Federally Funded 200.5 198.1 186.5 167.9 152.2 128.2 123.9 114.8 106.4 104.0 Auxiliary Enterprises, net 243.6 124.1 170.2 183.5 166.1 161.8 149.7 145.0 140.5 122.5
Private and Capital Gifts 104.9 79.9 93.8 97.7 81.6 80.7 106.2 66.8 74.1 62.3 Capital Gifts 28.3 3.6 17.0 15.0 5.8 6.4 4.9 7.1 8.3 2.5
Sales and Services 104.0 93.3 72.5 78.5 94.1 81.5 69.5 67.2 58.4 56.0 Technology and Research Initiatives Funds (TRIF) 44.6 36.8 34.1 34.6 32.5 31.3 31.1 26.5 27.8 25.2
Other Sources 9.2 148.0 91.5 89.9 41.1 70.8 48.1 35.9 47.7 32.9
Total Sources $ 3,487.2 $ 3,368.3 $ 2,971.6 $ 2,805.8 $ 2,583.8 $ 2,441.8 $ 2,289.0 $ 2,117.2 $ 1,962.4 $ 1,799.2 Uses Instruction $ 1,076.5 $ 1,053.7 $ 1,016.7 $ 961.6 $ 881.7 $ 810.6 $ 749.7 $ 686.4 $ 617.1 $ 549.0
Organized Research 414.3 384.4 360.0 323.6 297.5 267.3 261.1 244.8 235.7 225.5 Public Service 47.8 100.9 38.4 36.1 37.5 35.4 36.8 36.2 40.2 44.9
Academic Support 396.3 392.8 371.4 304.6 299.2 294.7 265.5 247.7 225.8 204.8 Student Services 176.7 159.4 166.1 151.2 136.1 123.4 111.0 98.4 72.4 65.9 Institutional Support 212.3 201.5 189.0 171.0 159.1 152.2 155.2 151.6 136.3 124.5 Operation and Maintenance of Plant 116.1 105.8 113.6 122.6 119.4 116.5 108.4 102.2 98.9 91.1 Scholarships and Fellowships 293.3 300.2 292.9 247.2 211.8 187.1 152.8 136.7 127.5 112.4 Auxiliary Enterprises 225.5 184.8 191.9 179.6 175.1 154.8 147.6 143.2 130.6 119.5 Depreciation 201.3 152.5 143.6 137.1 132.8 123.7 116.4 114.6 112.3 107.0 Academic and Research Buildings 112.9 100.0 93.8 84.9 80.6 73.8 69.4 67.6 63.9 60.0 Other Expenses 83.2 84.4 81.3 85.8 70.5 76.7 76.0 63.2 62.3 69.6
Fiscal year ended June
Tuition and Fees, net of scholarship allowance $ 1,689,832 $ 1,598,180 $ 1,550,581 $1,423,052 $1,323,268 $1,250,828 $1,157,535 $1,021,014 $ 896,921 $ 802,965 percent of total revenue 48% 47% 52% 51% 51% 51% 51% 48% 46% 45% percent increase from prior year 6% 3% 9% 8% 6% 8% 13% 14% 12% 6%
State of Arizona Government State appropriations $ 385,527 $ 306,346 $ 323,332 $ 303,370 $ 306,778 $ 296,913 $ 281,385 $ 338,042 $ 314,493 $ 297,402 Technology and research initiative fund 44,600 36,833 34,075 34,604 32,540 31,326 31,075 26,526 27,785 25,225
Capital appropriations and capital commitments 34,910 34,894 35,159 34,938 24,434 20,731 20,959 20,121 17,204 16,642 State grants and contracts 38,028 132,062 9,675 14,529 11,640 12,328 8,536 6,848 3,055 1,514 Financial aid trust fund 5,986 5,986 5,986 5,989 5,899 5,724 5,483 5,350 4,920 Capital grants 152 195
State of Arizona Government $ 503,217 $ 516,316 $ 408,227 $ 393,427 $ 381,381 $ 367,197 $ 347,679 $ 397,020 $ 367,887 $ 345,703 percent of total revenue 14% 15% 14% 14% 15% 15% 15% 19% 19% 19% percent increase (decrease) from prior year (3%) 26% 4% 3% 4% 6% (12%) 8% 6% (5%)
Federal Government Federal grants and contracts $ 529,468 $ 489,070 $ 316,277 $ 304,503 $ 262,007 $ 238,293 $ 242,299 $ 229,925 $ 247,015 $ 224,603 Financial aid grants 200,504 198,120 186,504 167,931 152,238 128,207 123,945 114,816 106,360 103,965 Capital grants 4,968 12,630 859 761
Federal Government $ 734,940 $ 699,820 $ 502,781 $ 472,434 $ 414,245 $ 366,500 $ 366,244 $ 344,741 $ 354,234 $ 329,329 percent of total revenue 21% 21% 17% 17% 16% 15% 16% 16% 18% 18% percent increase (decrease) from prior year 5%
6% 14% 13% 0% 6% (3%) 8% (4%)
Total from principal revenue sources $ 2,927,989 $ 2,814,316 $ 2,461,589 $2,288,913 $2,118,894 $1,984,525 $1,871,458 $1,762,775 $1,619,042 $1,477,997 percent of total revenue
percent increase from prior year
1%
Arizona State University (1) $11,348 $11,338 $11,338 $10,822 $10,792 $10,640 $10,478 $10,127 $ 9,861 $ 9,724 percent increase from prior year 0.1% 0.0% 4.8% 0.3% 1.4% 1.5% 3.5% 2.7% 1.4% 0.0%
PAC-12 Public Average $12,436 $12,237 $12,081 $11,821 $11,680 $11,175 $11,173 $10,972 $10,729 $10,484 percent increase from prior year 1.6% 1.3% 2.2% 1.2% 4.5% 0.0% 1.8% 2.3% 2.3% 6.6%
ABOR Peers Average $13,171 $12,865 $12,942 $12,671 $12,481 $12,166 $12,005 $11,871 $11,675 $11,440 percent increase from prior year 2.4% (0.6)% 2.1% 1.5% 2.6% 1.3% 1.1% 1.7% 2.1% 5.5%
Arizona State University (1) $29,438 $29,428 $29,428 $28,336 $27,372 $26,470 $25,458 $24,503 $23,654 $22,977 percent increase from prior year 0.0% 0.0% 3.9% 3.5% 3.4% 4.0% 3.9% 3.6% 2.9% 2.9%
PAC-12 Public Average $36,375 $35,729 $35,344 $34,599 $33,962 $32,937 $31,810 $30,469 $29,436 $28,653 percent increase from prior year 1.8% 1.1% 2.2% 1.9% 3.1% 3.5% 4.4% 3.5% 2.7% 4.2%
ABOR Peers Average $36,042 $35,309 $35,567 $34,527 $33,421 $32,159 $31,061 $30,003 $29,146 $28,297 percent increase from prior year 2.1% (0.7)% 3.0% 3.3% 3.9% 3.5% 3.5% 2.9% 3.0% 4.5%
Arizona State University $12,608 $12,608 $12,608 $12,134 $11,938 $11,776 $11,624 $11,303 $10,818 $10,517 percent increase from prior year 0.0% 0.0% 3.9% 1.6% 1.4% 1.3% 2.8% 4.5% 2.9% 2.9%
PAC-12 Public Average $14,201 $13,978 $14,088 $13,544 $13,383 $13,086 $12,937 $12,676 $12,374 $12,039 percent increase from prior year 1.6% (0.8)% 4.0% 1.2% 2.3% 1.2% 2.1% 2.4% 2.8% 4.7%
ABOR Peers Average $16,063 $15,643 $15,729 $15,212 $14,886 $14,540 $14,225 $13,955 $13,598 $13,207 percent increase from prior year 2.7% (0.5)% 3.4% 2.2% 2.4% 2.2% 1.9% 2.6% 3.0% 4.8%
Arizona State University $32,288 $32,288 $32,288 $30,926 $29,874 $28,882 $27,780 $26,736 $25,804 $25,066 percent increase from prior year 0.0% 0.0% 4.4% 3.5% 3.4% 4.0% 3.9% 3.6% 2.9% 3.0%
PAC-12 Public Average $29,977 $29,391 $29,635 $28,610 $28,097 $27,491 $26,912 $26,281 $25,597 $24,952 percent increase from prior year 2.0% (0.8)% 3.6% 1.8% 2.2% 2.2% 2.4% 2.7% 2.6% 3.7%
ABOR Peers Average $32,446 $31,396 $31,804 $30,874 $30,184 $29,367 $28,693 $27,958 $27,206 $26,485 percent increase from prior year 3.3% (1.3)% 3.0% 2.3% 2.8% 2.4% 2.6% 2.8% 2.7% 3.7%
Sources: Integrated Postsecondary Education Data System (IPEDS), Arizona State University Fact Book, and Office of Institutional Analysis (1)For FY 2020, class fees, technology fees and tuition surcharges were eliminated for undergraduate students and were replaced with undergraduate college fees. ASU’s tuition rates are approved by the Arizona Board of Regents (ABOR).
PAC-12 Public Average and ABOR Peers Average comparisons do not include ASU. PAC-12 Public Average calculations include only public institutions. Note: Data is not finalized per IPEDS.
+ Primary Reserve Ratio 0.43 0.35 0.24 0.28 0.25 0.32 0.29 0.27 0.45 0.43
/ Strength Factor 0.133 0.133 0.133 0.133 0.133 0.133 0.133 0.133 0.133 0.133
= Ratio / Strength Factor 3.23 2.63 1.80 2.08 1.89 2.41 2.18 2.03 3.38 3.23
* Weighting Factor 35% 35% 35% 35% 35% 35% 35% 35% 35% 35%
= Ratio Subtotal 1.13 0.92 0.63 0.73 0.66 0.84 0.76 0.71 1.18 1.13
+ Return on Net Position/Net Assets 13.4% 19.8% 2.1% 11.6% 6.3% 9.2% 5.8% 10.3% 8.5% 8.3%
/ Strength Factor 2.00% 2.00% 2.00% 2.00% 2.00% 2.00% 2.00% 2.00% 2.00% 2.00%
= Ratio / Strength Factor 6.70 9.90 1.06 5.81 3.15 4.60 2.90 5.15 4.25 4.15
* Weighting Factor 20% 20% 20% 20% 20% 20% 20% 20% 20% 20%
= Ratio Subtotal 1.34 1.98 0.21 1.16 0.63 0.92 0.58 1.03 0.85 0.83
+ Net Operating Revenues Ratio 6.6% 6.5% (1.3)% 3.3% 0.9% 4.1% 2.0% 3.4% 4.4% 3.9%
/ Strength Factor 1.30% 1.30% 1.30% 1.30% 1.30% 1.30% 1.30% 1.30% 1.30% 1.30%
= Ratio / Strength Factor 5.10 5.00 (1.00) 2.51 0.69 3.15 1.54 2.62 3.38 3.00
* Weighting Factor 10% 10% 10% 10% 10% 10% 10% 10% 10% 10%
= Ratio Subtotal 0.51 0.50 (0.10) 0.25 0.07 0.32 0.15 0.26 0.34 0.30
+ Viability Ratio 0.59 0.47 0.33 0.37 0.33 0.39 0.34 0.31 0.51 0.46
/ Strength Factor 0.417 0.417 0.417 0.417 0.417 0.417 0.417 0.417 0.417 0.417
= Ratio / Strength Factor 1.41 1.13 0.79 0.88 0.73 0.94 0.82 0.74 1.22 1.10
* Weighting Factor 35% 35% 35% 35% 35% 35% 35% 35% 35% 35%
= Ratio Subtotal 0.50 0.39 0.28 0.31 0.26 0.33 0.29 0.26 0.43 0.39
Composite Financial Index 3.48 3.79 1.02 2.45 1.62 2.41 1.78 2.26 2.80 2.65
The Composite Financial Index (CFI) provides a methodology for a single overall financial measurement of the institution’s health based on the four core ratios. The CFI uses a reasonable weighting plan and allows a weakness or strength in a specific ratio to be offset by another ratio result, which provides a more balanced measure. The CFI provides a more holistic approach to understanding the financial health of the institution. The CFI scores are not intended to be precise measures; they are indicators of ranges of financial health that can be indicators of overall institutional well-being when combined with non-financial indicators.
Composite Financial Index calculation includes component unit information. Detail of ratio calculations are on the following pages.
(1)Balances prior to FY 2015 have not been adjusted for the implementation of GASB Statement No. 68, Accounting and Financial Reporting for Pensions – an amendment of GASB Statement No. 27, as amended by GASB Statement No. 71, Pension Transition for Contributions Made Subsequent to the Measurement Date – an amendment of GASB Statement No. 68. Balances prior to FY 2016 have not been adjusted for the implementation of GASB Statement No. 72, Fair Value Measurement and Application. Balances prior to FY 2018 have not been adjusted for the implementation of GASB Statement No. 75, Accounting and Financial Reporting for Postemployment Benefits Other then Pensions, as amended by GASB Statement No. 85, Omnibus 2017.
Detail
Composite Financial Index Ratios(1)
Unrestricted Net Position $ 437,294 $ 235,307 $ 104,279 $ 166,899 $ 115,542 $ 282,765 $ 253,728 $ 161,623 $ 563,307 $ 511,298
Without Donor Restrictions - Unrestricted Net AssetsComponent Units
286,211 187,364 123,335 119,675 44,688 54,955 (2,912) 29,112 (28,470) (51,915)
Expendable Restricted Net Position 203,211 175,937 127,614 118,626 119,410 124,703 117,977 109,664 113,948 104,880
With Donor RestrictionsTemporarily Restricted Net Assets - Component Units 610,393 592,746 427,888 421,912 408,384 363,620 341,524 323,456 286,599 260,101
Expendable Net Position/ Net Assets $ 1,537,109 $ 1,191,354 $ 783,116 $ 827,112 $ 688,024 $ 826,043 $ 710,317 $ 623,855 $ 935,384 $ 824,364
Operating Expenses $ 3,160,041 $ 3,035,974 $ 2,883,520 $ 2,634,702 $2,450,214 $2,265,725 $2,104,513 $1,961,808 $ 1,796,805 $ 1,644,537 Nonoperating Expenses 83,224 84,411 81,324 85,754 70,493 76,745 76,011 63,242 62,316 64,326 Component Unit Total Expenses 350,770 323,676 303,974 283,224 252,963 228,083 280,389 266,791 201,738 186,523
Total Expenses $ 3,594,035 $ 3,444,061 $ 3,268,818 $ 3,003,680 $2,773,670 $2,570,553 $2,460,913 $2,291,841 $ 2,060,859 $ 1,895,386
Expendable Net Position/ Net Assets $ 1,537,109 $ 1,191,354 $ 783,116 $ 827,112 $ 688,024 $ 826,043 $ 710,317 $ 623,855 $ 935,384 $ 824,364
Total Expenses $ 3,594,035 $ 3,444,061 $ 3,268,818 $ 3,003,680 $2,773,670 $2,570,553 $2,460,913 $2,291,841 $ 2,060,859 $ 1,895,386 Ratio 0.43 0.35 0.24 0.28 0.25 0.32 0.29 0.27 0.45 0.43
Measures the financial strength of the institution by indicating how long the institution could function using its expendable reserves to cover operations should additional net position not be available. A positive ratio and an increase in the ratio over time denotes strength.
Change in Total Net Position/ Net Assets $ 408,159 $ 497,548 $ 52,103 $ 256,838 $ 131,399 $ 185,017 $ 109,055 $ 170,423 $ 163,969 $ 148,312
Total Net Position/Net Assets (Beginning of Year) $ 3,053,146 $ 2,516,921 $ 2,464,818 $2,207,980 $2,076,581 $2,018,485 $1,884,777 $1,656,504 $ 1,927,200 $ 1,786,613
Ratio 13.4% 19.8% 2.1% 11.6% 6.3% 9.2% 5.8% 10.3% 8.5% 8.3% Return on Net Position/Net Assets Ratio calculation includes component unit information.
Measures total economic return. While an increasing trend reflects strength, a decline may be appropriate and even warranted if it represents a strategy on the part of the institution to fulfill its mission.
(1)Balances prior to FY 2015 have not been adjusted for the implementation of GASB Statement No. 68, Accounting and Financial Reporting for Pensions – an amendment of GASB Statement No. 27, as amended by GASB Statement No. 71, Pension Transition for Contributions Made Subsequent to the Measurement Date – an amendment of GASB Statement No. 68. Balances prior to FY 2016 have not been adjusted for the implementation of GASB Statement No. 72, Fair Value Measurement and Application. Balances prior to FY 2018 have not been adjusted for the implementation of GASB Statement No. 75, Accounting and Financial Reporting for Postemployment Benefits Other then Pensions, as amended by GASB Statement No. 85, Omnibus 2017.
(2) The FY 2017 Return on Net Position/Net Assets ratio has been restated to adjust for the impact of the ASUEP restructure transfer.
Detail
Financial
Income (Loss) Before Other Revenues, Expenses, Gains, or Losses $ 154,402 $ 173,972 $ (46,841) $ 35,016 $ 34,090 $ 66,039 $ 81,031 $ 62,766 $ 72,104 $ 68,262
Component Units Change in Unrestricted Net Assets Before Extraordinary or Special Items 99,825 64,616 3,837 65,965 (9,501) 44,861 (32,024) 17,131 23,577 8,169
Adjusted Income (Loss) Before Other Revenues, Expenses, Gains or Losses and Component Units Change in Unrestricted Net Assets Before Extraordinary or Special Items
$ 254,227 $ 238,588 $ (43,004) $ 100,981 $ 24,589 $ 110,900 $ 49,007 $ 79,897 $ 95,681 $ 76,431
Total Operating Revenues $ 2,491,964 $ 2,220,786 $ 2,180,596 $ 2,048,569 $ 1,915,786 $ 1,782,224 $ 1,644,337 $ 1,482,742 $ 1,348,645 $ 1,227,473 State Appropriations and State Related Revenues 430,127 343,179 357,407 337,974 339,318 328,239 312,460 364,568 342,278 322,627
Non-capital Gifts and Grants, net 534,414 654,584 335,244 308,326 286,915 258,989 280,543 221,758 207,646 206,417 Financial aid trust 16,019 14,833 13,615 12,393 11,114 Investment Income (Loss), net (58,838) 75,808 44,756 60,603 12,778 23,038 9,382 5,133 20,263 9,494
Component Units Total Unrestricted Revenue 450,594 388,292 307,811 349,189 243,462 272,944 248,365 283,922 225,315 194,692
Adjusted Net Operating Revenue $ 3,848,261 $ 3,682,649 $ 3,225,814 $ 3,104,661 $ 2,798,259 $ 2,681,453 $ 2,509,920 $ 2,371,738 $ 2,156,540 $ 1,971,817
Adjusted Income (Loss) Before Other Revenues, Expenses, Gains or Losses and Component Units Change in Unrestricted Net Assets Before Extraordinary or Special Items
$ 254,227 $ 238,588 $ (43,004) $ 100,981 $ 24,589 $ 110,900 $ 49,007 $ 79,897 $ 95,681 $ 76,431
Adjusted Net Operating Revenue $ 3,848,261 $ 3,682,649 $ 3,225,814 $ 3,104,661 $ 2,798,259 $ 2,681,453 $ 2,509,920 $ 2,371,738 $ 2,156,540 $ 1,971,817 Ratio 6.6% 6.5% (1.3)% 3.3% 0.9% 4.1% 2.0% 3.4% 4.4% 3.9%
Measures whether the institution is living within available resources. A positive ratio and an increase in the ratio over time, generally reflects strength; a decline may be appropriate and even warranted if it represents a strategy on the part of the institution to fulfill its mission.
Unrestricted Net Position $ 437,294 $ 235,307 $ 104,279 $ 166,899 $ 115,542 $ 282,765 $ 253,728 $ 161,623 $ 563,307 $ 511,298 Without Donor Restrictions - Unrestricted Net Assets - Component Units 286,211 187,364 123,335 119,675 44,688 54,955 (2,912) 29,112 (28,470) (51,915)
Expendable Restricted Net Position 203,211 175,937 127,614 118,626 119,410 124,703 117,977 109,664 113,948 104,880
With Donor Restrictions - Temporarily Restricted Net Assets - Component Units 610,393 592,746 427,888 421,912 408,384 363,620 341,524 323,456 286,599 260,101 Expendable Net Position/Net Assets $ 1,537,109 $ 1,191,354 $ 783,116 $ 827,112 $ 688,024 $ 826,043 $ 710,317 $ 623,855 $ 935,384 $ 824,364
University Long-Term Debt, net financed purchases with Component Units $ 2,322,303 $ 2,241,062 $ 2,071,885 $ 1,928,622 $ 1,768,827 $ 1,771,961 $ 1,573,804 $ 1,511,891 $ 1,319,199 $ 1,266,524 Component Unit Long-Term Debt 280,940 298,250 316,614 333,784 347,987 340,602 499,844 514,409 509,339 521,101 Total Adjusted University Debt $ 2,603,243 $ 2,539,312 $ 2,388,499 $ 2,262,406 $ 2,116,814 $ 2,112,563 $ 2,073,648 $ 2,026,300 $ 1,828,538 $ 1,787,625
Expendable Net Position/Net Assets $ 1,537,109 $ 1,191,354 $ 783,116 $ 827,112 $ 688,024 $ 826,043 $ 710,317 $ 623,855 $ 935,384 $ 824,364
Total Adjusted University Debt $ 2,603,243 $ 2,539,312 $ 2,388,499 $ 2,262,406 $ 2,116,814 $ 2,112,563 $ 2,073,648 $ 2,026,300 $ 1,828,538 $ 1,787,625 Ratio 0.59 0.47 0.28 0.31 0.26 0.33 0.29 0.26 0.43 0.39
Measures the ability of the institution to cover its debt as of the statement of net position date, should the institution need to do so.
(1)Balances prior to FY 2015 have not been adjusted for the implementation of GASB Statement No. 68, Accounting and Financial Reporting for Pensions – an amendment of GASB Statement No. 27, as amended by GASB Statement No. 71, Pension Transition for Contributions Made Subsequent to the Measurement Date – an amendment of GASB Statement No. 68. Balances prior to FY 2016 have not been adjusted for the implementation of GASB Statement No. 72, Fair Value Measurement and Application. Balances prior to FY 2018 have not been adjusted for the implementation of GASB Statement No. 75, Accounting and Financial Reporting for Postemployment Benefits Other then Pensions, as amended by GASB Statement No. 85, Omnibus 2017.
Fiscal
Unrestricted Net Position $ 437,294 $ 235,307 $ 104,279 $ 166,899 $ 115,542 $ 282,765 $ 253,728 $ 161,623 $ 563,307 $ 511,298
Expendable Restricted Net Position 203,211 175,937 127,614 118,626 119,410 124,703 117,977 109,664 113,948 104,880
Expendable Net Position $ 640,505 $ 411,244 $ 231,893 $ 285,525 $ 234,952 $ 407,468 $ 371,705 $ 271,287 $ 677,255 $ 616,178
Expendable Net Position $ 640,505 $ 411,244 $ 231,893 $ 285,525 $ 234,952 $ 407,468 $ 371,705 $ 271,287 $ 677,255 $ 616,178 Total Bonds, COPS, and Financed Purchases $2,365,500 $2,305,450 $2,135,450 $2,001,032 $1,849,386 $1,850,754 $1,649,317 $1,595,817 $1,372,649 $1,341,332 Ratio 0.3 0.2 0.1 0.1 0.1 0.2 0.2 0.2 0.5 0.5
Measures the ability of the institution to cover its debt using expendable resources as of the balance sheet date, should the institution need to do so.
Unrestricted Net Position $ 437,294 $ 235,307 $ 104,279 $ 166,899 $ 115,542 $ 282,765 $ 253,728 $ 161,623 $ 563,307 $ 511,298 Expendable Restricted Net Position 203,211 175,937 127,614 118,626 119,410 124,703 117,977 109,664 113,948 104,880 Nonexpendable Restricted Net Position 104,729 91,623 87,497 84,714 78,813 74,102 70,544 64,833 59,476 55,572
Total Financial Resources $ 745,234 $ 502,867 $ 319,390 $ 370,239 $ 313,765 $ 481,570 $ 442,249 $ 336,120 $ 736,731 $ 671,750
Total Financial Resources $ 745,234 $ 502,867 $ 319,390 $ 370,239 $ 313,765 $ 481,570 $ 442,249 $ 336,120 $ 736,731 $ 671,750
Total Bonds, COPS, and Financed Purchases $2,365,500 $2,305,450 $2,135,450 $2,001,032 $1,849,386 $1,850,754 $1,649,317 $1,595,817 $1,372,649 $1,341,332 Ratio 0.3 0.2 0.2 0.2 0.2 0.3 0.3 0.2 0.5 0.5
A broader measure of the ability of the institution to cover its debt as of the balance sheet date, should the institution need to do so.
Net Cash Used for Operating Activities $(555,787) $(536,209) $(465,853) $(439,627) $ (384,847) $ (320,901) $ (315,803) $ (367,867) $ (319,052) $ (322,858) State Appropriations, Federal Stabilization Funds, and CARES Act Reimbursements 385,527 306,346 323,332 303,370 306,778 296,913 281,385 338,042 314,493 297,402
Share of State Sales Tax - TRIF 44,600 36,833 34,075 34,604 32,540 31,326 31,075 26,526 27,785 25,225
Non-capital Grants and Contracts, Gifts, Other (1) 534,414 654,584 335,244 308,326 286,915 275,008 295,376 235,373 220,039 217,531
Adjusted Cash Flow from Operations $ 408,754 $ 461,554 $ 226,798 $ 206,673 $ 241,386 $ 282,346 $ 292,033 $ 232,074 $ 243,265 $ 217,300
Total Bonds, COPS, and Financed Purchases $2,365,500 $2,305,450 $2,135,450 $2,001,032 $1,849,386 $1,850,754 $1,649,317 $1,595,817 $1,372,649 $1,341,332
Adjusted Cash Flow from Operations $ 408,754 $ 461,554 $ 226,798 $ 206,673 $ 241,386 $ 282,346 $ 292,033 $ 232,074 $ 243,265 $ 217,300 Ratio 5.8 5.0 9.4 9.7 7.7 6.6 5.6 6.9 5.6 6.2 (1) Includes financial aid grants, grants and contracts, private gifts, and financial aid trust funds. Measures the financial strength of the institution by indicating how long (in years) the institution would take to repay the debt using the cash provided by its operations. A decreasing ratio over time denotes strength.
Interest Paid on Debt
Leases
Principal Paid from Refinancing Activities (2)
Debt Service $ 154,105 $ 142,765 $
Debt Service $ 154,105 $
$
$
$
62,596 99,285 305,910 50,596 137,349
$ 69,135 $ 59,972 $ 53,428 $ 52,674 $ 53,331 Principal Paid on Debt
(196,830) (1,153) (39,415) (243,340) (90,955)
$ 117,149 $ 130,578 $ 119,842 $ 115,998 $ 103,270 $ 99,725
$ 117,149 $ 130,578 $ 119,842 $ 115,998 $ 103,270 $ 99,725
$2,634,702 $2,450,214 $2,265,725 $2,104,513 $1,961,808 $1,796,805 $1,644,537 Ratio
Operating Expenses $3,160,041
Obtained from “Bonds Payable, Certificates of Participation
Obtained amount from refunding bonds official statements.
Financed
5.9% 5.7%
included in the applicable fiscal year’s audited Notes to Financial Statements.
Measures the institution’s dependence on borrowed funds as a source of financing its mission and the relative cost of borrowing to overall expenditures. The ratio measures the relative cost of debt to overall expenses and a declining trend is generally desirable,
the ratio
during times of specific funding activity to support the institution’s strategic mission.
(1)Balances prior to FY 2015 have not been adjusted for the implementation of GASB Statement No. 68, Accounting and Financial Reporting for Pensions – an amendment of GASB Statement No. 27, as amended by GASB Statement No. 71, Pension Transition for Contributions Made Subsequent to the Measurement Date – an amendment of GASB Statement No. 68. Balances prior to FY 2016 have not been adjusted for the implementation of GASB Statement No. 72, Fair Value Measurement and Application. Balances prior to FY 2018 have not been adjusted for the implementation of GASB Statement No. 75, Accounting and Financial Reporting for Postemployment Benefits Other then Pensions, as amended by GASB Statement No. 85, Omnibus 2017.
Operating Expenses $ 3,160,041 $ 3,035,974 $ 2,883,520 $ 2,634,702 $ 2,450,214 $ 2,265,725 $ 2,104,513 $ 1,961,808 $ 1,796,805 $ 1,644,537 Scholarships and Fellowships (293,349) (300,202) (292,914) (247,194) (211,811) (187,124) (152,802) (136,675) (127,468) (112,363)
Interest on Debt 76,122 67,838 65,342 63,413 61,903 69,135 59,972 53,428 52,674 53,331
Total Adjusted Operating Expenses $ 2,942,814 $ 2,803,610 $ 2,655,948 $ 2,450,921 $ 2,300,306 $ 2,147,736 $ 2,011,683 $ 1,878,561 $ 1,722,011 $ 1,585,505
Research Expenses $ 414,259 $ 384,431 $ 359,936 $ 323,623 $ 297,448 $ 267,303 $ 261,055 $ 244,763 $ 235,720 $ 225,453
Total Adjusted Operating Expenses $ 2,942,814 $ 2,803,610 $ 2,655,948 $ 2,450,921 $ 2,300,306 $ 2,147,736 $ 2,011,683 $ 1,878,561 $ 1,722,011 $ 1,585,505 Ratio 14.1% 13.7% 13.6% 13.2% 12.9% 12.4% 13.0% 13.0% 13.7% 14.2%
Measures the institution’s research expense to the total operating expenses.
Student Tuition and Fees, net $ 1,689,832 $ 1,598,180 $ 1,550,581 $ 1,423,052 $ 1,323,268 $ 1,250,828 $ 1,157,535 $ 1,021,014 $ 896,921 $ 802,965
Financial Aid Grants 200,843 198,432 186,818 168,230 152,500 128,474 124,188 115,070 106,855 104,415 Scholarships and Fellowships (293,349) (300,202) (292,914) (247,194) (211,811) (187,124) (152,802) (136,675) (127,468) (112,363)
Net Tuition and Fees $ 1,597,326 $ 1,496,410 $ 1,444,485 $ 1,344,088 $ 1,263,957 $ 1,192,178 $ 1,128,921 $ 999,409 $ 876,308 $ 795,017
Net Tuition and Fees $ 1,597,326 $ 1,496,410 $ 1,444,485 $ 1,344,088 $ 1,263,957 $ 1,192,178 $ 1,128,921 $ 999,409 $ 876,308 $ 795,017
Student FTE 121,770 117,005 110,548 103,654 97,950 94,077 88,742 81,254 76,376 73,062
Net Tuition per Student (whole dollars) $ 13,118 $ 12,789 $ 13,067 $ 12,967 $ 12,904 $ 12,672 $ 12,721 $ 12,300 $ 11,474 $ 10,881
Measures the institution’s net student tuition and fees received per student.
State Appropriations $ 385,527 $ 306,346 $ 323,332 $ 303,370 $ 306,778 $ 296,913 $ 281,385 $ 338,042 $ 314,493 $ 297,402
Capital State Appropriations 25,985 25,840 25,622 25,406 13,479 11,190 11,422 15,000 14,471 14,472
Adjusted State Appropriations $ 411,512 $ 332,186 $ 348,954 $ 328,776 $ 320,257 $ 308,103 $ 292,807 $ 353,042 $ 328,964 $ 311,874
Adjusted State Appropriations $ 411,512 $ 332,186 $ 348,954 $ 328,776 $ 320,257 $ 308,103 $ 292,807 $ 353,042 $ 328,964 $ 311,874
Student FTE 121,770 117,005 110,548 103,654 97,950 94,077 88,742 81,254 76,376 73,062
Adjusted State Appropriations per Student (whole dollars) $ 3,379 $ 2,839 $ 3,157 $ 3,172 $ 3,270 $ 3,275 $ 3,300 $ 4,345 $ 4,307 $ 4,269
Measures the institution’s dependency on state appropriations.
Bond Resolution Covenant. The Board has covenanted in the Bond Resolution to fix, revise and collect tuition, registration, matriculation, health services, laboratory, and admission fees from students matriculated, registered or enrolled at or attending the University, and to fix, revise and collect all other fees, admissions, rentals and other charges received from students, faculty, staff members and others using or being served by the System of Building Facilities, in an aggregate amount so the Gross Revenues of the University for each fiscal year will be at least 150% of the Maximum Annual Debt Service due in any fiscal year on all outstanding senior lien bonds and sufficient at all times to continually operate and maintain the System of Building Facilities and to make necessary deposits at the times and in the amounts specified in the Bond Resolution.
Bond Resolution Requirement. Pursuant to the Bond Resolution, the Board may issue additional Parity Bonds if the Gross Revenues of the University for the fiscal year preceding the issuance of such Parity Bonds are at least equal to 300% of the Maximum Annual Debt Service on all Outstanding Parity Bonds and the Parity Bonds proposed to be issued.
Tuition and Fees, net of scholarship allowance $ 1,689,833 $ 1,598,180 $ 1,550,581 $ 1,423,051 $ 1,312,313 $ 1,250,828 $ 1,157,535 $ 1,021,014 $ 896,921 $ 802,965
Receipts from Other Major Revenue Sources (Facilities Revenue) 466,350 330,044 349,050 358,231 335,309 304,859 293,117 279,610 264,385 244,696
Net Revenues Available for Debt Service $ 2,156,183 $ 1,928,224 $ 1,899,631 $ 1,781,282 $ 1,647,622 $ 1,555,687 $ 1,450,652 $ 1,300,624 $ 1,161,306 $ 1,047,661
Interest on Debt $ 75,267 $ 67,685 $ 60,598 $ 58,683 $ 54,954 $ 53,077 $ 42,451 $ 46,842 $ 40,342 $ 42,079
Principal Paid on Debt 83,030 80,625 70,990 61,425 53,455 51,555 46,525 40,155 42,635 44,770
Senior Lien Bonds Debt Service Requirement (1) $ 158,297 $ 148,310 $ 131,588 $ 120,108 $ 108,409 $ 104,632 $ 88,976 $ 86,997 $ 82,977 $ 86,849
Coverage 13.62 13.00 14.44 14.83 15.20 14.87 16.30 14.95 14.00 12.06
Debt Service Assurance Agreement and SPEED Bond Resolution Covenant. The Board has further covenanted in the Debt Service Assurance Agreement entered into in connection with the 2006 ASU Research Park Bonds and in the bond resolution for the Board’s SPEED Revenue Bonds to fix, revise and collect Student Tuition and Fees Revenues and Facilities Revenues in an aggregate amount so that Gross Revenues of the University in any fiscal year will be at least equal to 100% of (i) the annual debt service due on all Outstanding Parity Bonds and the Subordinate Obligations in such fiscal year and (ii) the expense of operating and maintaining the System of Building Facilities.
Interest on Debt $ 75,267 $ 67,685 $ 60,598 $ 58,683 $ 54,954 $ 53,077 $ 44,482 $ 46,842 $ 38,584 $ 42,079
Principal Paid on Debt 83,030 80,625 70,990 61,425 53,455 51,555 43,435 40,155 42,640 44,770
Senior Lien Bonds Debt Service Requirement $ 158,297 $ 148,310 $ 131,588 $ 120,108 $ 108,409 $ 104,632 $ 87,917 $ 86,997 $ 81,224 $ 86,849
SUBORDINATE LIEN BONDS DEBT SERVICE
Interest on Debt $ 3,595 $ 3,595 $
$
$
$
$ 12,344 $ 13,562 $ 13,594 $ 13,594 $ 4,286
$ 4,640 $ 5,374 $ 5,374 $ 5,757 $ 7,154 $ 7,154 $ 3,441 Principal Paid on Debt 7,550 7,550 8,335 7,630 6,970 6,970 7,805 6,440 6,440 845 Subordinate Lien Bonds Debt Service Requirements $ 11,145 $
Combined
Coverage
$
$
$ 101,479 $ 100,591 $ 94,818 $
12.93 12.25
Fiscal year ended June 30, 2022 2021 2020 2019
System Revenue Bonds $ 1,979,575 $ 1,865,550 $ 1,691,205 $ 1,556,810 $ 1,404,350 $ 1,392,795 $ 1,212,240 $ 1,157,535 $ 1,002,655 $ 959,000 Unamortized Premium 203,619 209,133 191,967 170,948 150,794 144,377 105,470 91,298 42,844 37,946
Net System Revenue Bonds $ 2,183,194 $ 2,074,683 $ 1,883,172 $ 1,727,758 $ 1,555,144 $ 1,537,172 $ 1,317,710 $ 1,248,833 $1,045,499 $ 996,946
Certificates of Participation $ 123,955 $ 140,905 $ 157,265 $ 173,075 $ 188,325 $ 202,290 $ 213,710 $ 224,965 $ 235,505 $ 248,385 Unamortized Premium 1,557 2,280 3,074 3,869 4,666 6,470 7,574 8,731 9,892 11,202
Net Certificates of Participation $ 125,512 $ 143,185 $ 160,339 $ 176,944 $ 192,991 $ 208,760 $ 221,284 $ 233,696 $ 245,397 $ 259,587
Total Bonds Payable $ 2,183,194 $ 2,074,683 $ 1,883,172 $ 1,727,758 $ 1,555,144 $ 1,537,172 $ 1,317,710 $ 1,248,833 $ 1,045,499 $ 996,946 COPS Payable 125,512 143,185 160,339 176,944 192,991 208,760 221,284 233,696 245,397 259,587 Financed Purchases 56,794 87,582 91,939 96,330 101,251 104,822 110,323 113,288 81,753 84,799 Total $ 2,365,500 $ 2,305,450 $ 2,135,450 $ 2,001,032 $ 1,849,386 $ 1,850,754 $ 1,649,317 $ 1,595,817 $1,372,649 $1,341,332
per Student FTE (whole dollars) $ 19,426 $ 19,704 $ 19,317 $ 19,305 $ 18,881 $ 19,673 $ 18,586 $ 19,640 $ 17,972 $ 18,359 per Dollar of State Appropriations and State Capital Appropriations $ 5.75 $ 6.94 $ 6.12 $ 6.09 $ 5.77 $ 6.01 $ 5.63 $ 4.52 $ 4.17 $ 4.30 per Dollar of Total Grants and Contracts $ 3.48 $ 3.04 $ 5.05 $ 4.98 $ 4.97 $ 5.64 $ 5.32 $ 5.57 $ 4.88 $ 4.77
Data Used in Above Calculations
Total Student FTE 121,770 117,005 110,548 103,654 97,950 94,077 88,742 81,254 76,376 73,062 State Appropriations and State Capital Appropriations $ 411,512 $ 332,186 $ 348,954 $ 328,776 $ 320,257 $ 308,103 $ 292,807 $ 353,042 $ 328,964 $ 311,874 Grants and Contracts $ 678,792 $ 757,415 $ 438,286 $ 401,555 $ 372,291 $ 328,283 $ 309,902 $ 286,684 $ 281,049 $ 280,987 Student FTE based on fall enrollment of the fiscal year.
Admissions, Enrollment, and
ADMISSIONS - FIRST-YEAR
Earned
Applications (1) (2) 68,588 59,075 57,576 45,327 44,613 42,396 42,363 38,280 35,294 37,982 Accepted 59,233 51,325 47,151 36,856 34,712 32,653 32,400 30,028 26,915 26,986
Enrolled 16,830 15,161 15,606 13,974 12,337 12,119 12,004 11,079 10,232 9,265
Accepted as Percentage of Application 86% 87% 82% 81% 78% 77% 76% 78% 76% 71% Enrolled as Percentage of Accepted 28% 30% 33% 38% 36% 37% 37% 37% 38% 34%
Average SAT scores - Total (3) 1227 1199 1210 1210 1194 1184 1182 1182 1178 1182
Evidence-based reading and writing 612 598 603 603 598 594 594 594 592 593 Math 616 602 608 608 599 591 589 590 589 591
Student FTE 121,770 117,005 110,548 103,654 97,950 94,077 88,742 81,254 76,376 73,062 Student Headcount 135,753 128,815 119,979 111,291 103,567 98,177 91,357 83,301 76,771 73,378
African American (Headcount) 7,770 7,342 6,404 5,695 5,152 4,785 4,439 4,002 3,663 3,491 Percentage of Total 5.7% 5.7% 5.3% 5.1% 5.0% 4.9% 4.9% 4.8% 4.8% 4.8%
White (Headcount) 66,035 64,958 61,656 58,749 55,000 52,531 49,083 45,407 43,713 43,494 Percentage of Total 48.6% 50.4% 51.4% 52.8% 53.1% 53.5% 53.7% 54.5% 56.9% 59.3%
Other (Headcount) 61,948 56,515 51,919 46,847 43,415 40,861 37,835 33,892 29,395 26,393 Percentage of Total 45.7% 43.9% 43.3% 42.1% 41.9% 41.6% 41.4% 40.7% 38.3% 35.9%
Bachelor’s
Beginning
SAT scores for
test that began in March 2016. Student
based on
during fiscal
Fiscal Year Ended
Arizona Population 7,276,316 7,421,401 7,278,717 7,171,646 7,016,270 6,931,071 6,829,397 6,731,484 6,626,624 6,553,255
Arizona Personal Income (in millions) 395,111 363,274 335,243 313,040 292,108 278,925 266,756 255,089 244,011 235,781
Arizona Per Capita Personal Income 54,301 48,950 46,058 43,650 41,633 40,243 39,060 37,895 36,823 35,979
Arizona Unemployment Rate 4.90% 7.90% 4.70% 4.80% 4.90% 5.30% 6.10% 6.90% 8.00% 8.30%
Sources: U.S. Bureau of Economic Analysis and Arizona Commerce Authority.
Employer
Calendar Year Ended December 31, 2021
Full-Time Equivalent Employees Rank
Percentage of Total State Employment
Calendar Year Ended December 31, 2012
Full-Time Equivalent Employees Rank
Percentage of Total State Employment
State of Arizona 40,265 1 1.15% 52,076 1 1.72% Banner Health 39,094 2 1.11% 25,126 3 0.83% Walmart Inc. 36,995 3 1.05% 31,837 2 1.05%
Wells Fargo & Co. 16,300 4 0.46% 13,679 5 0.45% City of Phoenix 14,499 5 0.41% 14,983 4 0.50% Arizona State University 13,070 6 0.37% 12,222 8 0.40% Maricopa County 13,019 7 0.37% 13,308 6 0.44%
Dignity Health Arizona 12,485 8 0.36% Intel Corp. 11,553 9 0.33% HonorHealth 11,292 10 0.32% Bank of America 12,500 7 0.41% Raytheon Co. 11,500 9 0.38% JP Morgan Chase & Co. 11,407 10 0.38% 208,572 5.93% 198,638 6.56%
Sources: Phoenix Business Journal, Book of Lists 2021 and Arizona Department of Transportation CAFR 2013 for employers: Arizona Commerce Authority website, https://www.azcommerce.com/oeo/labor-market/unemployment/.
Faculty and Staff
FACULTY
Full-time 3,772 3,632 3,595 3,483 3,367 3,225 3,108 2,963 2,777 2,635 Part-time 317 304 320 291 310 330 394 515 375 276
Total Faculty 4,089 3,936 3,915 3,774 3,677 3,555 3,502 3,478 3,152 2,911
Percentage Tenured 51.8% 52.7% 52.9% 54.5% 55.0% 55.4% 55.9% 54.2% 58.0% 61.1%
Full-time 7,867 7,988 7,889 7,551 7,189 6,734 6,443 5,966 5,693 5,487 Part-time 5,334 4,797 4,925 4,819 4,519 4,414 4,168 4,183 3,565 3,684
Total Staff 13,201 12,785 12,814 12,370 11,708 11,148 10,611 10,149 9,258 9,171
Total Faculty and Staff 17,290 16,721 16,729 16,144 15,385 14,703 14,113 13,627 12,410 12,082
Sources: Arizona State University Fact Book and Institutional Analysis. Percentage Tenured includes tenured and tenure track faculty.
Fiscal
CAPITAL ASSETS (Number of Facilities)
Academic/Support Facilities
Auxiliary Facilities
Total
Source: Arizona State University Capital Improvement Plans
164 166 172 153 153
Beginning in FY 2014, facility count includes ASU partnership facilities to align with the Capital Improvement Plan submitted to the Arizona Board of Regents. FY 2013 has been restated to include ASU partnership facilities.

ASU is a comprehensive public research university, measured not by whom it excludes, but by whom it includes and how they succeed; advancing research and discovery of public value; and assuming fundamental responsibility for the economic, social, cultural and overall health of the communities it serves.”
Arizona State University Financial Services

University Services Building 1551 South Rural Road PO Box 875812 Tempe, Arizona 85287-5812 480-965-3601 cfo.asu.edu/fs
Compiled and edited by the ASU Financial Services Office. © 2022 Arizona Board of Regents. All rights reserved. Printed in the U.S.
Arizona State University vigorously pursues affirmative action and equal opportunity in its employment, activities, and programs.


Photography by: Architekton, Andy DeLisle, Sierra LaDuke, Chloe Merriweather and Jarod Opperman.

– ASU Charter