25 minute read
Quantifying Within-Day Abstract Skill Learning and Exploring its Neural Correlates

BY GABRIELLE SHVARTSMAN
GRADUATE STUDENT MENTOR: ELLEN ZIPPI RESEARCH SPONSOR (PI): JOSE CARMENA
ABSTRACT
Strengthened corticostriatal connections, particularly between the motor cortex and the dorsal striatum, emerge during abstract skill learning when studied on a multi-day scale. While behavioral data implicate that learning happens within-day as well, neural changes and adaptations over this timescale are not as well-studied. Here, a non-human primate (NHP) subject learned to control a brain-machine interface (BMI), initially with many single-day decoders. Novel behavioral analyses were used on this data to quantify within-day learning. The prefrontal cortex (PFC) and striatum were hypothesized to be responsible for changes in the brain underlying this learning. Using a coherence metric, the manner of communication between these brain regions was also studied. Though the results of the coherence calculations were inconclusive, the behavioral analyses support the presence of the hypothesized withinday learning and paves the way for further exploration of its underlying neural circuitry. This advances the field towards a deeper understanding of how neural changes on a day-to-day basis ultimately bring about long-term learning. Major, Year, and Department: Molecular and Cell Biology: Neurobiology; Undergraduate Senior; Department of Molecular and Cell Biology and Department of Electrical Engineering and Computer Science
INTRODUCTION
Skill learning is at the center of everyday life and results from neural plasticity, or changes in brain circuitry. Learning a new skill can be characterized by the type of skill, such as physical or abstract, and by the length of the learning timescale. A physical skill is one that requires practiced, coordinated movement to achieve a set goal. For example, learning to swing a tennis racquet is driven by the goal of hitting a ball over the net, and as one progresses from uncoordinated arm movements to consistently accomplishing this goal, the brain adapts in order to learn this physical skill. The same goal-to-skill trajectory is present when learning an abstract skill which does not require physical movement, such as mastering a new chess strategy or learning to categorize songs by genre. These skill learning processes have prompted neuroscientists to investigate which brain circuits are involved in and changing as a result of physical and abstract skill learning.1
Studies imply that corticostriatal circuits play a major role in physical skill learning.2,3,4 Corticostriatal circuits are functional connections between areas of the cortex, particularly regions of the frontal lobe such the premotor cortex (PMd), primary motor cortex (M1), and prefrontal cortex (PFC), and the deeper brain structures that make up the striatum, specifically the caudate nucleus (Cd). Setting up an experiment to test whether these same circuits are critical in abstract skill learning requires a control for predisposition to an abstract skill across test subjects. Brain machine interfaces (BMIs), one of many methods used to study neural plasticity during learning, provide such a control. BMIs involve learning to control neuroprosthetic actuators, such as the pitch of a tone or the position of a cursor on a screen, with only neural activity; this guarantees the learned strategy to be a de novo skill. A closed-loop BMI takes in a selected group of neurons as inputs to a decoding algorithm, which subsequently calculates and updates actuator movement. This movement results in visual or auditory feedback for the subject, ultimately enhancing the fine-tuning of the neural inputs and enabling abstract skill learning (Figure 1A). The skill is novel to the brain because the subject is causing movement of physical actuators in the absence of motor execution, a type of skill that is impossible to have been exposed to prior to a BMI implant, which allows experimenters to study the learning of a skill that is necessarily distinct from the subject’s prior skillset. This classic BMI learning paradigm has been shown to result in an emergence of a stable neuronal ensemble, a group of neurons involved in the same neural computation, linked with skill proficiency.5 Analysis of BMI abstract skill learning has shed light on many functional changes in the brain. In one of the first BMI experiments in non-human primates (NHP), neural units in PMd and M1 showed increased predictive power in the decoder, or algorithm that translated the neural signals into the behavioral output, as the subject learned.6 Predictive power measures the correlation between firing from an individual neuron and the behavioral task. For example, if a neuron has very low predictive power, that implies that the neuron is not very involved in the current task since its firing pattern cannot predict what is happening in the task. Both direct units, or neurons which the decoder was trained on, and indirect units, or the neurons that reside in the motor regions but were not used as inputs to the decoder, exhibited changes.7,8 This
Figure 1: BMI and task schematics. A) The closed-loop BMI used active PMd and M1 units as inputs to the decoder. A Kalman filter was used as the decoder, with adding CLDA for two-system adaptation. The decoder outputs the next predicted cursor location (red circle), resulting in visual feedback as the subject moves the cursor from the center target (yellow) to the peripheral target (blue). The light gray circles represent other possible peripheral target locations but only one appears at a time. An apple juice reward is administered for successful task trials. B) A center-out task where the subject must move the cursor (red) from center target (yellow) to one of eight peripheral targets (only one is shown in blue). During manual control, the subject is free to move within the 2-D constraints of the Kinarm (dark gray rectangle) while during BMI control, the subject’s arm does not affect the movement of the cursor and the neural inputs must adapt to move the cursor. A timeline of the task is also shown.
breadth of accessible knowledge makes the BMI learning paradigm a valuable technique for studying abstract skill learning.
In addition to physical or abstract, skill learning can also be categorized into short-term and long-term. Long-term learning in the context of NHP BMI is the period of time until proficiency, defined by a plateau of accuracy in trial completion, is achieved— usually on the order of days. Thus far, only the long-term emergence of functional connectivity, or correlation of activity between regions during task execution, in the brain has been studied.9 This raises the question of which, if any, connections arise within just one day of BMI learning and whether they are incremental adjustments towards net long-term changes and whether these connections aid in building the long-term connections we see.
Past studies have investigated which brain regions play a part in BMI abstract skill learning. PMd and M1 are regions specific to motor planning and execution, so it is expected that neurons in these regions would play a part in learning a movement-related BMI task. Studies in rodents have examined which brain regions may be responsible for causing motor area changes. One study has shown increased coherence—an indirect measure of communication— between M1 and the dorsal striatum, a part of the striatum involved in physical skill learning, over the course of BMI learning.1
PFC has also been implicated to play a part in abstract skill learning. The PFC is known to play a major role in goal-directed planning, including in operant conditioning wherein the subject learns to complete a task in return for a reward.10,11 Correctly guiding an actuator to a target in BMI learning is one such form of operant conditioning, since the subject is rewarded for accomplishing a goal. The lateral prefrontal cortex (LPFC) and Cd have been implicated in learning abstract associations, such as those that develop between actuator-movement and reward as a result of operant conditioning.12 Although frontostriatal communication between LPFC and Cd during abstract skill learning has been established, the dynamics of this communication are still muddled. The timescale of emergence of changes throughout associative learning has been shown to vary across these two regions: the Cd responds to reward associations more rapidly, while the LPFC and the frontal cortex respond more slowly.12,13 Based on these previous studies, we hypothesize that a more rapid, within-day circuit develops between the Cd and the frontal cortex, whether LPFC or M1, and later a slower across-day circuit develops within the frontal cortex in addition to strengthening of the frontal cortex and Cd connection.
In this paper, we propose a novel method of measuring withinday abstract learning in an NHP BMI task by comparing predicted and actual cursor trajectories. Using cursor trajectory information provides more information than the existing fraction correct and time to target metrics; while those rely heavily on only successfully completed trials, the cursor trajectory can incorporate all initiated trials since the reward time is not necessary for its calculation. Using our new method, we then compare potential short-term neural correlates of within-day behavioral trends with those of longerterm neural communication emergence. We hypothesize that the trajectory ratio will further solidify the presence of within-day learning and that neurons in LPFC and Cd will be modulated, or have controlling influence, on this learning, as demonstrated by increased coherence.
METHODS
NHP implant
One adult male rhesus macaque (Macaca mulatta), Y, was used in this study. A 124-channel large-scale semi-chronic microdrive
(Gray Matter Research, Bozeman, MT) was implanted in the subject’s left hemisphere. Unlike many traditional recording implants, each electrode in the microdrive could be lowered independently, permitting simultaneous recording across regions of different depths. This feature was especially important for this study as Cd is a deep structure whereas the cortical areas are closer to the surface.
Microelectrodes were successfully lowered into M1; PMd; dorsolateral prefrontal cortex (dlPFC), the dorsal subsection of the LPFC; Cd; and putamen (Pu) (Figure 2). The electrodes were capable of recording both spiking and local field potential (LFP) data. Spiking data refers to the action potentials of individual neurons, recorded as all-or-nothing signals in a time series. LFP data refers to the electric potential changes in the space surrounding an electrode, with likely some overlap in signals between neighboring electrodes at the same depths.
All procedures and experiments were conducted in compliance with the National Institutes of Health Guide for Care and Use of Laboratory Animals and were approved by the University of California, Berkeley Institutional Animal Care and Use Committee.
BMI
In this study, we used a closed-loop BMI. Spiking data from PMd and M1 neurons was used as input to a decoding algorithm (“decoder”) that controlled actuator movement. In this task, the actuator was a cursor on a screen in front of Y, the experimental subject. The movement of the cursor, along with a timed juice reward, provided feedback to the subject, driving changes in neural circuitry (Figure 1A). This ultimately resulted in neuroprosthetic abstract learning.
A Kalman filter was used as the decoder. A Kalman filter incorporates a history of observations with the current state and outputs a prediction of the next state, updating previous measurements using Bayes rule and calculating the prediction using the law of total probability.14,15 In this application, the decoder was fed past and present position, velocity, and motor unit spiking information as inputs in order to output the next position of the cursor. Upon successfully moving the cursor to complete the task on the screen, the subject was rewarded with apple juice. The updated actuator position and velocity and motor inputs were then fed back into the decoder, resuming the learning circuit.
Each day, the decoder was seeded with approximately 10 minutes of manual control data, from either earlier that same day or a previous day, in which the subject used physical arm movement to complete the task. Then the subject completed trials of the same task with BMI control of the cursor. The manual control seeding period each day served as a control for the BMI control trials since the behavior of the brain during a physical movement task has been well-characterized. The subject’s arm was restricted during BMI control trials to help mediate a context switch between the manual and BMI tasks. Closed-loop decoder adaptation (CLDA) was applied for 2 – 10 minutes to the initial decoder in order to make the decoder easier to learn, and then the subject worked on BMI control for 2 – 4 30-minute sessions. With CLDA, not only is the subject’s brain adapting to the decoder, but the decoder is also adapting based on the direct motor inputs it receives. This strategy allows for more rapid learning of effector control via a tag-team effort of the two systems.16
While the subject attempted BMI control for approximately 60 days, only the days with a substantial number of completed trials (> ~30), or where the subject’s proficiency was visually apparent to the researchers, were analyzed. This resulted in a dataset of 19 days, with both consecutive and non consecutive series of days.
Behavioral task
Y was trained to perform a self-initiated, two-dimensional, center-out task (Figure 1B). During the manual iteration of the task, the subject’s right arm rested in a Kinarm (BKIN Technologies, Kingston, ON) exoskeleton where the shoulder and elbow were restricted to movement in the horizontal plane. First a center target appeared on the screen, prompting trial initiation. The subject needed to hold his on-screen cursor in the center target for a prespecified hold time (0.1 – 0.5s) in order to initiate a trial. Upon initiation, one of eight peripheral targets, evenly distributed in a circle (radius = 6.5cm) around the center target, would appear and the subject would move the cursor to the peripheral target and
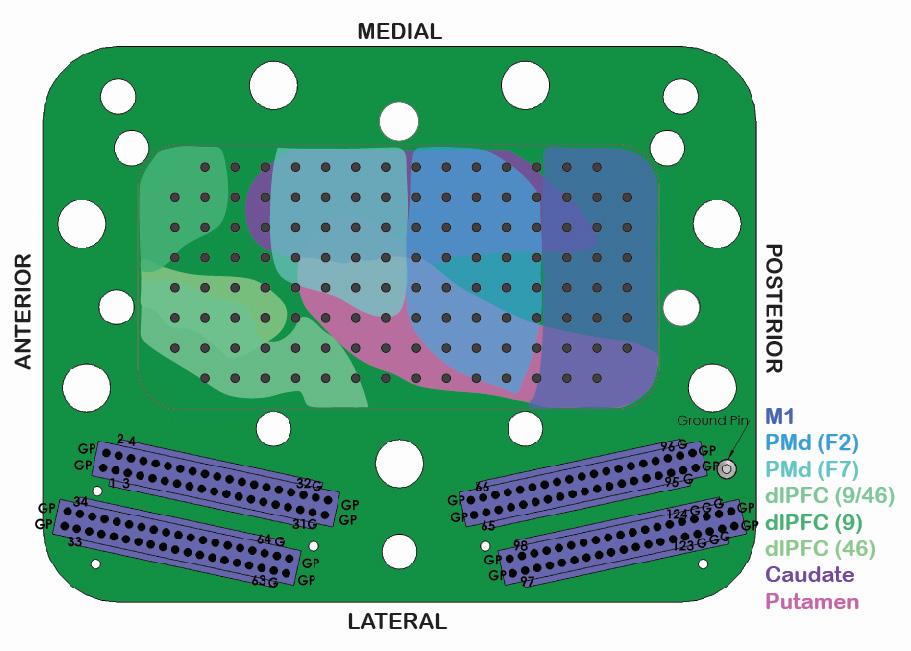
Figure 2: Schematic of 124-channel large-scale semi-
chronic microdrive from Gray Matter Research. The inner cavity of the microdrive outlines the brain regions that we are capable of recording from in Y. Each dark gray dot in the center represents one of the 124 electrodes. The bottom illustrates 4 32-channel connectors that transmit the electrode signals.
complete a hold (0.1 – 0.5s) in order to successfully complete the trial. Upon trial completion, the subject received an apple juice reward.
In the months prior to BMI trials, Y was trained to complete this task using manual control. Once the subject was proficient in manual control, he began to learn to use BMI control.
Data Analysis
While the BMI decoder used spike data as input, data analysis for this study was conducted exclusively on local field potential (LFP) data. In all data analyses, all 30-minute BMI sessions post-CLDA were concatenated and split into the first, middle, and last third of trials. In this analysis, early coherence is defined as the first third of trials within a day while late coherence is defined as the last third. Analysis was conducted to evaluate behavioral change and coherence between brain regions.
A. Behavioral: Three measures were used to quantify behavioral changes during the task. 1A. Fraction correct: Rewarded trials were binned into groups of 20 and the fraction correct was calculated for each bin by dividing the number of rewarded trials by the number of self-initiated trials. Trials were considered to be self-initiated if the center hold was successfully completed, indicating that trial initiation was intentional. 2A. Time to target: Timestamps of task events were used to calculate the average time to reach a peripheral target. Self-initiated trials were binned into groups of 20 trials and the mean time to reach the peripheral target was calculated as follows, where timestampentered is the time at which the peripheral target was entered and timestampappeared is the time at which the peripheral target first appeared:
3A. Trajectory ratio: This method was designed as a way to measure learning in the absence of many successful, rewarded trials. For each target, a subset of all available cursor space was defined as its region, where cursor movement was still relevant to the trajectory for the particular target (Figure 3). The region was defined as an eighth of a circle of radius equal to the reach radius (6.5 cm) plus twice the target radius (1.5 cm). The trajectory ratio metric is:
Trials were separated by peripheral target and binned into groups of 10 trials. The mean of the ratio of time was calculated across bins. The binned averages were then averaged across all targets since Y struggled more with some targets than others.
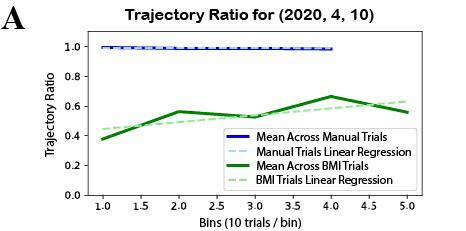
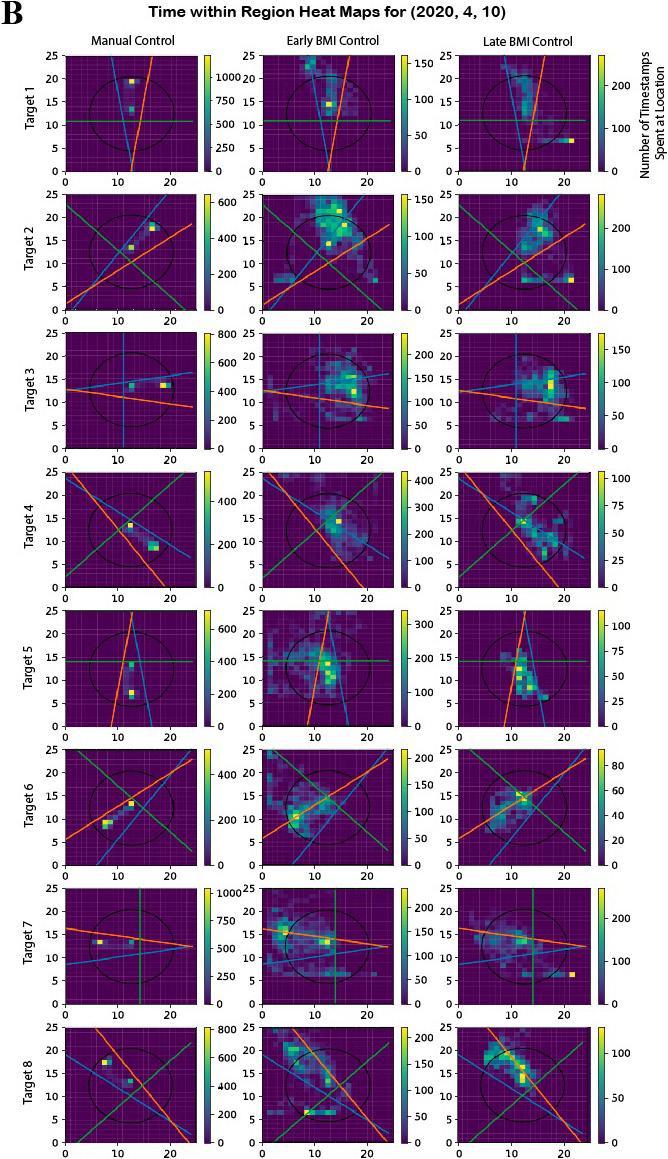
Figure 3: Representative data for trajectory ratio metric. The decoder from date (2020, 4, 10) was chosen because it showed results that were representative of the mean across days. A) The metric is effective in that it correctly returns a ratio of approximately 1 across manual control trials, which is expected as Y is proficient at the task under manual control. In the BMI control trials, there is an upwards trend depicted by the BMI trials linear regression. B) Visual representation of how the calculations are made. Note that in the manual control trials practically all of the time is spent within the circular and linear bounds. Most of the late BMI trials show noticeable improvement from early BMI. Early BMI here is classified as the first third of the trials whereas late BMI is the last third.
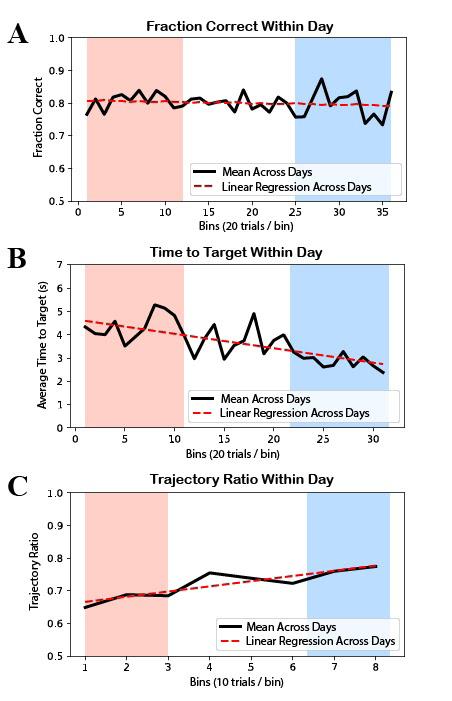
Figure 4: Behavioral analysis results. In all plots, the red range represents early within-day learning while the blue range represents late within-day learning. A) There was no significant increase in mean within-day fraction correct. The linear regression line has slope = -4.17e-4 and p-value of 0.412 (> 0.05) for the null hypothesis of a 0 slope. B) There was a significant decrease in mean within-day time to target. The linear regression line has slope = -0.705 and a p-value of 9.70e-6 (< 0.05) for the null hypothesis of a 0 slope. C) There was a significant increase in mean within-day trajectory ratio. The linear regression line has slope = 0.0159 and a p-value of 0.00312 (< 0.05) for the null hypothesis of a 0 slope.
B. Coherence: Coherence measures the degree of synchronization of oscillatory activity between brain regions. Synchronicity is estimated by taking into account consistency between amplitude and phase of two waveforms. While existence of coherence indicates functional connectivity, changes in the value of coherence can indicate strengthening in connectivity over time. When studied pairwise between units across regions, such an increase can be attributed to novel network connections forming over the time of study.17,18
For each region-to-region relationship examined, early and late thirds of the trials were iterated over, with calculations done pairwise across electrodes from the two regions. In each trial, calculations were taken for two time blocks: 1s before the reward and 1s after the go cue. This is because just after the go cue, or when the peripheral target appears, is the most likely time period to elicit activity from decision-making and planning parts of the brain, dlPFC and caudate, while just before and during achievement of the reward is most likely to elicit activity from the parts involved in associative learning, such as the dlPFC. Pairwise field-field coherence was calculated using the same method and parameters as in Koralek et al. 2012:
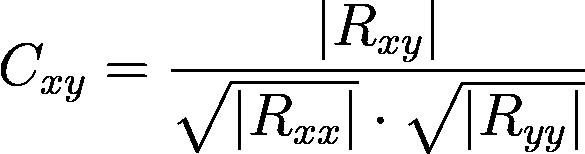
where x and y represent one channel from each region, R xx and R yy are their respective power spectra, and Rxy is the cross-spectrum between them.1 Pairwise calculations were done over a sliding window of width 0.5s and step size 0.05s across the indicated time block. For every region-to-region relation calculated over, these trialaveraged calculations were separated across four frequency bands: theta (4 – 8 Hz), alpha (8 – 12 Hz), beta (12 – 30 Hz), and an overlap of frequencies that was studied in Koralek et al. 2012 (6 – 14 Hz).
Once early and late coherence for each day was calculated, correlation with behavioral results was evaluated by plotting the difference between early and late coherence against the trajectory ratio slope for that day.
RESULTS
Calculations which were averaged across days used 19 distinct days of recording data.
Within-day Behavior
A linear regression was performed for the fraction correct, time to target, and trajectory ratio metrics. The p values that follow represent likelihood for the null hypothesis of a linear regression of slope = 0 (no change).
There was no significant increase in mean within-day fraction correct, with slope = -4.17e-4 and p = 0.412 (> 0.05) (Figure 4A). There was, however, significant change in both the time to target and trajectory ratio metrics. There was a significant decrease in mean within-day time to target, with slope = -0.705 and p = 9.70e-6 (< 0.05) (Figure 4B). There was a significant increase in mean trajectory ratio, with slope = 0.0159 and p = 3.12e-3 (< 0.05) (Figure 4C).
Within-day Coherence
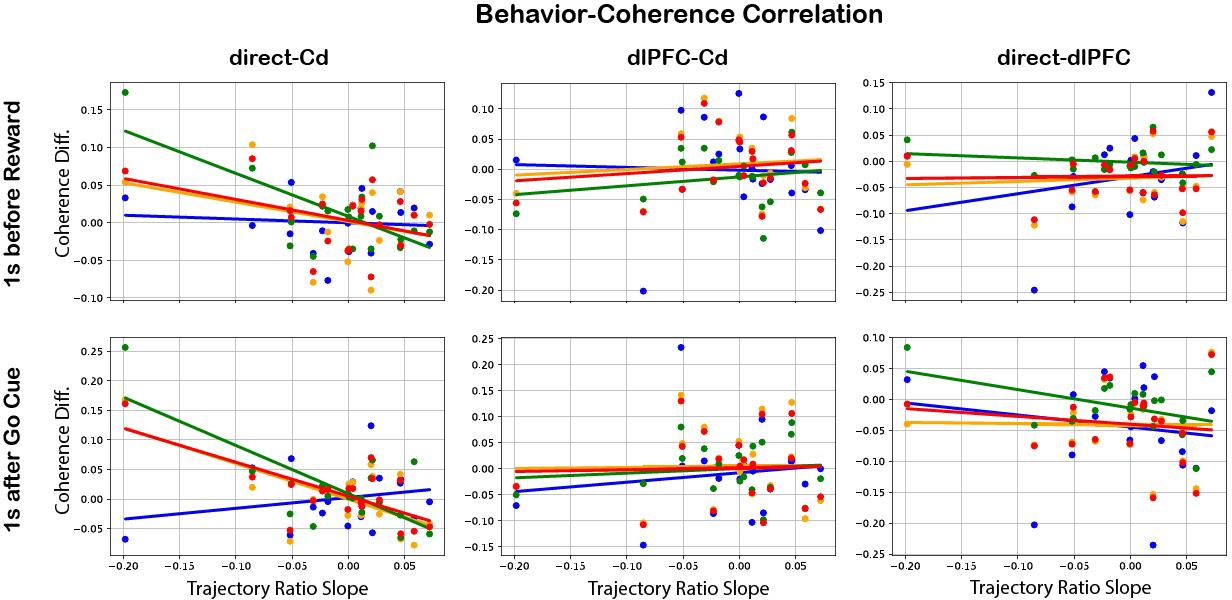
Upon plotting correlation of behavioral values with difference between early and late coherence, the regions and frequency bands which significantly predicted behavior were: M1/PMd and Cd after go cue in the alpha (p = 2.47e-3), beta (p = 4.88e-4), and 6 – 14 Hz (p = 1.02e-3) frequency bands (Figure 5). Interestingly, all of these have negative slopes, indicating an inverse relationship with trajectory ratio slope and thus with within-day learning.
Figure 5: Behavior-coherence correlation
results. For each day, Coherence Diff. (late coherence — early coherence) was plotted against the slope of the trajectory ratio for three region-to-region relations (direct-Cd, dlPFC-Cd, and directdlPFC), two events (reward and go cue), and four frequency bands (see legend). The regions and frequency bands which significantly predicted behavior were: M1/PMd and Cd after go cue in the alpha (slope = -0.607, p = 2.47e-3), beta (slope = -0.817, p = 4.88e-4), and 6 – 14 Hz (slope = -0.576, p = 1.02e-3) frequency bands. The negative slopes imply an inverse relationship with learning.
DISCUSSION
Within-day neuroprosthetic learning is apparent across singleday decoders. The time to target behavioral metric showed significant increase when averaged over the within-day data. The implications of the new trajectory ratio metric are even more convincing because the metric accounts for all self-initiated trials, even if they were not completed. This metric provides much more information in early learning when the subject may be initiating trials but unable to properly complete them. In contrast, the time to target metric can only use self-initiated rewarded trials by design since its calculation depends on the timestamp of entering a peripheral target. That the trajectory ratio metric showed significant increase in within-day BMI control, while capturing a near-perfect result in manual control, shows its effectiveness as a novel behavioral measure for short-term learning of the task.
We hypothesized that short-term modulation by Cd or dlPFC would be illuminated by changes in coherence. Past studies have indicated that both PFC and striatum were influenced by reward expectation and that reward information was encoded in increased beta band power in LFP.11,19 Furthermore, beta synchrony between the two regions has been shown to emerge during reward.20 However, dlPFC-Cd behavior-coherence analysis did not show significant modulation in the reward block. Other studies have found that motor cortex and striatum coherence in the 6 – 14 Hz band has also been shown to emerge over the course of long-term neuroprosthetic learning when time-locked to reward.1 In this within-day, short-term study, this same frequency range did not show significant modulation during reward. The lack of modulation in the reward block is contrary to what was expected, both from a reward conditioning perspective and from the literature in long-term neuroprosthetic learning.
The behavior-coherence analysis results demonstrated M1/ PMd - Cd modulation between alpha, beta, and 6 – 14 Hz frequency bands 1s after the go cue, inverse to behavior. The inverse modulation may indicate M1/PMd - Cd communication was very high at the beginning of each day, since getting reacquainted with the task may have required an especially high level of motor control, and then lessened as the subject eased back into the behavior. However, given the lack of expected results in reward block coherence, considering a vast body of past literature on frontostriatal and corticostriatal modulation, and given the similar methodology for analyses of both the go cue and reward blocks, it is likely that analyses parameters must be altered and repeated in both the reward and go cue blocks before any claims can be made on either. Particularly, developing a filtering metric for determining which LFP channels to include in each region’s analyses could establish more specificity in coherence measurements. For unknown reasons, some LFP channels exhibited lots of noise on select days during recording. Since coherence calculation is based on both phase and amplitude, high noise levels in several channels could greatly pollute mean coherence calculations across regions. Past methods developed for measuring recording effectiveness of microelectrodes based on LFP signal-to-noise ratio could be adapted to gain clarity in future results.21
Another possibility for the absence of PFC-Cd communication increase is that this emergence may occur on a longer timescale than predicted. Future studies will be done to measure PFC-Cd emergence in long-term, across-day neuroprosthetic learning. Additionally, repeating analyses with shorter early and late time periods could illuminate more time-specific coherence.
Once within-day functional connectivity is better established, effective connectivity analysis between implicated regions will give even more insight. While functional connectivity establishes a correlation in signaling between brain regions A and B, effective connectivity adds directionality information that functional connectivity lacks, determining whether the flow of information is from A to B or from B to A.9,17 Granger causality (g-causality) and transfer of entropy are two measures that examine the direction of flow of information and could be utilized in future analyses.22,23
Though the preliminary results of functional connectivity analysis were inconclusive, the establishment and quantification of within-day abstract learning paves the way for further investigation of these relationships. With improved and additional metrics, identification of involved brain regions will be possible, and the effects of their within-region and cross-region communication on neuroprosthetic learning will be illuminated.
1. Koralek, A. C., Jin, X., Long II, J. D., Costa, R. M., & Carmena,
J. M. (2012). Corticostriatal plasticity is necessary for learning intentional neuroprosthetic skills. Nature, 483(7389), 331–335. https://doi.org/10.1038/nature10845 2. Yin, H. H., Mulcare, S. P., Hilário, M. R. F., Clouse, E., Holloway,
T., Davis, M. I., Hansson, A. C., Lovinger, D. M., & Costa, R. M. (2009). Dynamic reorganization of striatal circuits during the acquisition and consolidation of a skill. Nature Neuroscience, 12(3), 333–341. https://doi.org/10.1038/nn.2261 3. Barnes, T. D., Kubota, Y., Hu, D., Jin, D. Z., & Graybiel, A. M. (2005). Activity of striatal neurons reflects dynamic encoding and recoding of procedural memories. Nature, 437(7062), 1158–1161. https://doi.org/10.1038/nature04053 4. Kimchi, E. Y., & Laubach, M. (2009). Dynamic encoding of action selection by the medial striatum. Journal of
Neuroscience, 29(10), 3148–3159. https://doi.org/10.1523/
JNEUROSCI.5206-08.2009 5. Ganguly, K., & Carmena, J. M. (2009). Emergence of a stable cortical map for neuroprosthetic control. PLOS Biology, 7(7), e1000153. https://doi.org/10.1371/journal.pbio.1000153 6. Carmena, J. M., Lebedev, M. A., Crist, R. E., O’Doherty, J. E.,
Santucci, D. M., Dimitrov, D. F., Patil, P. G., Henriquez, C. S., &
Nicolelis, M. A. L. (2003). Learning to Control a Brain–Machine
Interface for Reaching and Grasping by Primates. PLOS Biology, 1(2), e42. https://doi.org/10.1371/journal.pbio.0000042 7. Ganguly, K., Dimitrov, D. F., Wallis, J. D., & Carmena, J. M. (2011). Reversible large-scale modification of cortical networks during neuroprosthetic control. Nature Neuroscience, 14(5), 662–667. https://doi.org/10.1038/nn.2797 8. Hwang, E. J., Bailey, P. M., & Andersen, R. A. (2013). Volitional control of neural activity relies on the natural motor repertoire.
Current Biology, 23(5), 353–361. https://doi.org/10.1016/j. cub.2013.01.027 9. Park, H.-J., & Friston, K. (2013). Structural and functional brain networks: From connections to cognition. Science, 342(6158). https://doi.org/10.1126/science.1238411 10. Saito, N., Mushiake, H., Sakamoto, K., Itoyama, Y., & Tanji,
J. (2005). Representation of immediate and final behavioral goals in the monkey prefrontal cortex during an instructed delay period. Cerebral Cortex, 15(10), 1535–1546. https://doi. org/10.1093/cercor/bhi032 11. Kobayashi, S., Nomoto, K., Watanabe, M., Hikosaka, O.,
Schultz, W., & Sakagami, M. (2006). Influences of rewarding and aversive outcomes on activity in macaque lateral prefrontal cortex. Neuron, 51(6), 861–870. https://doi.org/10.1016/j. neuron.2006.08.031 12. Pasupathy, A., & Miller, E. K. (2005). Different time courses of learning-related activity in the prefrontal cortex and striatum. Nature, 433(7028), 873–876. https://doi.org/10.1038/ nature03287 13. Antzoulatos, E. G., & Miller, E. K. (2011). Differences between neural activity in prefrontal cortex and striatum during learning of novel abstract categories. Neuron, 71(2), 243–249. https://doi. org/10.1016/j.neuron.2011.05.040 14. Kim, Y., & Bang, H. (2018). Introduction to Kalman Filter and its applications. Introduction and Implementations of the Kalman
Filter. https://doi.org/10.5772/intechopen.80600 15. Wu, W., Shaikhouni, A., Donoghue, J. R., & Black, M. J. (2004).
Closed-Loop neural control of cursor motion using a Kalman filter. The 26th Annual International Conference of the IEEE
Engineering in Medicine and Biology Society, 2, 4126–4129. https://doi.org/10.1109/IEMBS.2004.1404151 16. Orsborn, A. L., Dangi, S., Moorman, H. G., & Carmena, J.
M. (2012). Closed-loop decoder adaptation on intermediate time-scales facilitates rapid BMI performance improvements independent of decoder initialization conditions. IEEE
Transactions on Neural Systems and Rehabilitation Engineering, 20(4), 468–477. https://doi.org/10.1109/TNSRE.2012.2185066 17. Bowyer, S. M. (2016). Coherence a measure of the brain networks: Past and present. Neuropsychiatric Electrophysiology, 2(1), 1. https://doi.org/10.1186/s40810-015-0015-7 18. Fries, P. (2015). Rhythms for cognition: communication through coherence. Neuron, 88(1), 220–235. https://doi.org/10.1016/j. neuron.2015.09.034 19. Kawagoe, R., Takikawa, Y., & Hikosaka, O. (1998). Expectation of reward modulates cognitive signals in the basal ganglia. Nature
Neuroscience, 1(5), 411–416. https://doi.org/10.1038/1625 20. Zhang, Y., Pan, X., Wang, R., & Sakagami, M. (2016). Functional connectivity between prefrontal cortex and striatum estimated by phase locking value. Cognitive Neurodynamics, 10(3), 245–254. https://doi.org/10.1007/s11571-016-9376-2 21. Suarez-Perez, A., Gabriel, G., Rebollo, B., Illa, X., Guimerà-
Brunet, A., Hernández-Ferrer, J., Martínez, M. T., Villa, R., & Sanchez-Vives, M. V. (2018). Quantification of signal-tonoise ratio in cerebral cortex recordings using flexible MEAs with co-localized platinum black, carbon nanotubes, and gold electrodes. Frontiers in Neuroscience, 12. https://doi. org/10.3389/fnins.2018.00862 22. Barnett, L., Barrett, A. B., & Seth, A. K. (2009). Granger causality and transfer entropy are equivalent for Gaussian variables. Physical Review Letters, 103(23), 238701. https://doi. org/10.1103/PhysRevLett.103.238701 23. Vicente, R., Wibral, M., Lindner, M., & Pipa, G. (2011). Transfer entropy—A model-free measure of effective connectivity for the neurosciences. Journal of Computational Neuroscience, 30(1), 45–67. https://doi.org/10.1007/s10827-010-0262-3
ACKNOWLEDGEMENTS
Thank you to Ellen Zippi for being a fantastic mentor and a phenomenal resource. Thank you to Maki Kitano, Paul Botros, and Emanuele Formente for helping with the data collection process and to the veterinary staff for all of their assistance. Thank you to Jose Carmena for welcoming me into the lab and allowing me to embark on this project.
