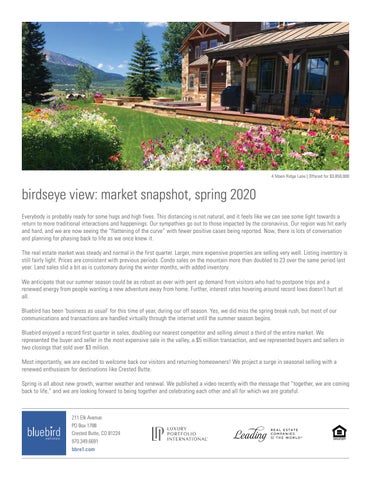
4 Moon Ridge Lane | Offered for $3,850,000
birdseye view: market snapshot, spring 2020 Everybody is probably ready for some hugs and high fives. This distancing is not natural, and it feels like we can see some light towards a return to more traditional interactions and happenings. Our sympathies go out to those impacted by the coronavirus. Our region was hit early and hard, and we are now seeing the “flattening of the curve” with fewer positive cases being reported. Now, there is lots of conversation and planning for phasing back to life as we once knew it. The real estate market was steady and normal in the first quarter. Larger, more expensive properties are selling very well. Listing inventory is still fairly light. Prices are consistent with previous periods. Condo sales on the mountain more than doubled to 23 over the same period last year. Land sales slid a bit as is customary during the winter months, with added inventory. We anticipate that our summer season could be as robust as ever with pent up demand from visitors who had to postpone trips and a renewed energy from people wanting a new adventure away from home. Further, interest rates hovering around record lows doesn’t hurt at all. Bluebird has been ‘business as usual’ for this time of year, during our off season. Yes, we did miss the spring break rush, but most of our communications and transactions are handled virtually through the internet until the summer season begins. Bluebird enjoyed a record first quarter in sales, doubling our nearest competitor and selling almost a third of the entire market. We represented the buyer and seller in the most expensive sale in the valley, a $5 million transaction, and we represented buyers and sellers in two closings that sold over $3 million. Most importantly, we are excited to welcome back our visitors and returning homeowners! We project a surge in seasonal selling with a renewed enthusiasm for destinations like Crested Butte. Spring is all about new growth, warmer weather and renewal. We published a video recently with the message that “together, we are coming back to life,” and we are looking forward to being together and celebrating each other and all for which we are grateful.
211 Elk Avenue PO Box 1788 Crested Butte, CO 81224 970.349.6691 bbre1.com
crested butte area property sales statistics Crested Butte Sales - Single Family Average Price Percent Change Price/ Square Foot Days on Market Active Listings Months of Inventory Mount Crested Butte Sales - Single Family Average Price Percent Change Price/ Square Foot Days on Market Active Listings Months of Inventory Mount CB Condo/TH Sales - Condo/TH Average Price Percent Change Price/ Square Foot Days on Market Active Listings Months of Inventory Crested Butte Rural Sales - Single Family Average Price Percent Change Price/ Square Foot Days on Market Active Listings Months of Inventory CB South Sales - Single Family Average Price Percent Change Price/ Square Foot Days on Market Active Listings Months of Inventory Land - All CB Sales - Land Average Price Percent Change Days on Market Active Listings Months of Inventory
2015
2016
2017
2018
3/19
2019
3/20
26 803,404
27 1,157,515 44.1% 546 175 15 6
23 1,363,624 17.8% 560 247 18 9
22 1,302,877 -4.5% 588 217 20 11
3 1,303,333 0.0% 585 134 16 16
21 1,734,224 33.1% 725 154 22 13
5 1,826,630 40.2% 790 199 20 12
22 1,149,801 18.7% 373 332 35 16
29 1,028,800 -10.5% 331 243 27 11
30 1,018,750 -1.0% 363 252 25 10
5 1,051,400 3.2% 323 286 19 11
24 1,102,063 8.2% 413 189 22 11
5 927,540 -11.8% 449 114 28 17
148 264,769 -1.0% 264 246 66 5
137 362,701 37.0% 311 161 49 4
122 397,107 9.5% 366 147 61 6
11 489,909 23.4% 448 129 58 16
86 479,264 20.7% 419 141 63 9
23 406,758 -17.0% 429 146 88 11
29 1,434,216 8.8% 439 275 44 17
38 1,496,539 4.3% 451 211 41 13
30 1,309,300 -12.5% 389 208 58 23
4 1,006,250 -17.7% 436 228 52 39
27 1,698,093 29.7% 511 246 53 24
4 2,168,750 74.1% 554 291 41 31
12 584,708 20.6% 251 119 4 2
18 632,445 8.2% 275 192 7 5
20 676,657 7.0% 287 144 6 4
4 725,000 25.0% 290 185 6 5
15 726,133 7.3% 302 140 6 5
2 747,500 3.1% 211 232 4 6
83 226,878 13.7% 319
117 273,255 20.4% 305 242 25
146 278,621 2.0% 292 211 17
21 384,342 26.1% 200 201 29
89 390,023 40.0% 230 248 33
11 227,000 -9.7% 221 249 68
450 245 16 7 26 968,404 337 221 43 18 84 267,523 230 249 127 18 31 1,318,661 361 229 44 16 18 484,972 221 106 8 4 104 199,468 397
*CREN, MLS Data, April 2020
*CREN MLS, 4.15.20