
16 minute read
Arizona and COVID-19: Two-Year Experience

Arizona and COVID-19: Two-Year Experience 2020-21
Howard J Eng, Mel and Enid Zuckerman College of Public Health, College of Pharmacy, University of Arizona.
Conflict of Interest The author has no conflicts of interest.
Funding This research was not funded.
Citation: Howard J Eng (2022) Arizona and COVID-19: Two-Year Experience 2020-21. Journal of Medical & Clinical Research 7(2):05-10.
Reprinted with permission from author.
continued on next page
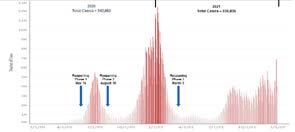
It had been more than two-years since COVID-19 appeared in the world. The first case recorded in Arizona was on January 22, 2020. There had been three Arizona Reopening Phases. During Arizona’s Reopening Phase 2 winter surge in 2020, ABC and NBC News reported that the state has the highest new cases per capital in the world. Arizona is the sixth largest in size of the United States 50 states. It is about the same size as Italy. The study examined the first two-years of the state’s COVID-19 pandemic. There were 1,381,488 COVID-19 cases, 91,523 hospitalizations, 24,229 deaths, and 9,826,846 vaccine doses administered at the end of the second year (December 31, 2021). The state COVID-19 cases in 2021 were higher than in 2020. The second half of 2021 had higher case numbers than the first half, but it had lower hospitalization and death numbers. The lower numbers in the second half were primarily due to the use of COVID-19 vaccines and therapeutics. In December 2019, COVID-19 first appears in Wuhan, China. Johns Hopkins University1 reports that there are 287,911,124 total cases and 5,435,753 deaths associated with the virus in the world on December 31, 2021. The United States has the highest total cases (54,570,527) and deaths (825,536) in the world.1 COVID-19 (coronavirus) is a respiratory disease (attacks primarily the lungs) that spreads by person to person through respiratory droplets (coughs, sneezes, and talks) and contaminated surfaces or objects. The world combats the virus by encouraging the public to practice health behaviors that reduces the risks of getting respiratory infections (e.g., coronavirus, flu, and cold), and using vaccines and therapeutics. The preventive health behaviors include, but not limited to, practicing physical and social distancing, washing hands frequently and thoroughly, and wearing face masks. Johns Hopkins reports that more than 9.14 billion vaccine doses have been administered in the world (December 31, 2021).1 The United States (U.S.) is ranked third in the world in vaccine doses administered following China and India.1 Of the U.S. 50 states, Arizona is the sixth largest in size (113,990 square miles/295,233 square kilometers).2 It is about the same size as Italy (301,340 square kilometer).3 The state population estimate is 7,276,316 on July 1, 2021.4 Arizona is ranked 13th in total COVID-19 cases (1,373,767) and 11th in total deaths (24,212) of the 50 U.S. states on December 31, 2021.1 There has been three Arizona Reopening Phases. During Arizona’s Reopening Phase 2 winter surge in 2020, ABC and NBC News report that the state has the highest new cases per capital in the world.5,6 The United States requires a partnership between the federal government and each of the 50 states to address the COVID-19 pandemic.7 The federal government provides the national guidance and needed logistical support (e.g., provide federal supplemental funding, needed medical personnel and resources, and other needed assistance), while the states decide on what actions to take and when to carry out those actions; the state COVID-19 restrictions; and when to carry out each reopening phase; and the state vaccination plan. The first COVID-19 recorded in Arizona was on January 22, 2020. On March 11, the World Health Organization had declared COVID-19 outbreak a pandemic.8 Soon after, the United States declared the COVID-19 pandemic as a national emergency on March 13.9 Arizona Governor Douglas Ducey issued a Stayat-Home Executive Order on March 30 (196 cases) that was in effect from March 31 to April 30.7 Arizona residents had to stay at home except for going out for essential services (e.g., grocery stores, pharmacies, doctor offices, gas stations) and working at approved essential service settings, and practiced preventive health behaviors.
continued on next page
• April 29 (393 cases): the Governor extended his Stay-at-Home Executive Order until May 15. • May 12 (488 cases): the Governor confirmed that his Stay-at-Home Executive Order would end on May 15, and May 16 began Reopening Phase 1. • June 26 (5,759 cases): the summer 2020 surge peaked [10]. • June 29 (5,486 cases): the Governor issued a new Executive Order that would address the COVID-19 outbreaks that closed bars, gyms, and theaters and prohibited large gathering until July 27. July 23 (1,743 cases): the Governor extended his June 29 Executive Order for another 2 weeks until August 10 and would review at that time whether to extend it for another two weeks. • August 10 (921 cases): the Governor began Reopening Phase 2 laid out his plans for easing the next COVID-19 restriction phase, and established reopening health benchmarks (e.g., for bars, gyms, and schools).7 • January 4, 2021 (12,402 cases): the winter 2020 surge peaked. • March 5 (805 cases): the Governor began Reopening Phase 3 after the state had administered more than two million vaccine doses and several weeks of declining cases, and the next phase of easing of COVID-19 restrictions.10 • August 16 (4,040 cases): the summer 2021 surge peaked. • November 29 (5,618 cases): the fall 2021 surge peaked. • December 30 (10,068 cases): the winter 2021 high. • December 31 (7,099 cases): daily case number end of second year. To get back to normal, the state needed to reach high enough population immunity to reduce the case numbers to manageable levels. Arizona had an aggressive statewide vaccination plan. The largest weekly numbers of fully vaccinated persons occurred during April 17 to 23, 2021 (249,755).11 Therapeutics kept the numbers of hospitalizations and deaths low. The Delta variant surged in July-September then small dip and surged again in October-November. In December, Omicron variant appeared in the state and surged. The study examined the first two-years of the COVID-19 pandemic (January 1, 2020 to December 31, 2021) looking at changes in the number new COVID-19 cases, hospitalizations, and deaths.
Methods
This was a two-year longitudinal study. It examined the changes in the numbers of new COVID-19 cases, hospitalized cases, deaths, and vaccines given. The data source for the study was from the Arizona Department of Health Services (the state health department) COVID-19 dashboard database. There were several data limitations. The COVID-19 case numbers represented the numbers of positive tests reported. When more than one test given to the same person (e.g., during hospitalization, at work, and mandatory testing), there were individual case duplications. Aggressive testing resulted in increases in false positive and false negative testing results. There were delays in the data submitted daily to the state health department that affected the timeliness of data reported and caused fluctuations in the number of cases, hospitalizations, deaths, and vaccinations. The state health department continued to adjust the reported numbers that may take more than a month to correct the numbers. The deaths associated with the coronavirus may be caused by more than one serious underlying medical conditions, and the virus may not be the primary cause of death.
Results
At the end of the second year of the COVID-19 pandemic (December 31, 2021), there were 1,381,488 COVID-19 cases, 91,523 case hospitalizations, 24,229 deaths associated with the virus, and 9,826,846 vaccine doses administered in Arizona (see Table 1). In 2021, there were more cases, hospitalizations, deaths, and vaccine doses administered than 2020. Even though the second half of 2021 had more cases than first half, the number of hospitalizations and deaths were fewer in the second half of year than the first half.
continued on next page
January 1 to June 30, 2020 79,894
July 1 to December 31, 2020 462,759
January 1 to December 31, 2020 542,653 4,989
33,167
38,156 1,653 NA
7,422 95,160
9,075 95,160
January 1 to June 30, 2021 352,323
July 1 to December 31, 2021 486,512 27,477
25,890 8,874 6,356,233
6,350 3,375,453
January 1 to December 31, 2021 838,835 53,367 15,224 9,731,686
January 1, 2020 to December 31, 2021 1,381,488 91,523 24,229 9,826,846
Source: Arizona Department of Health Services COVID-19 Dashboard. Arizona 2020 population is 7,151,502, April 1, 2020 and Arizona 2021 population estimate is 7,276,316, July 1, 2021-U.S. Census.
A case could be mild (no symptoms), moderate (sick, but can recover at home), and severe (require hospitalization and/or result in death). Most people recovered and did not require hospitalization. There were five case surges during the two-year period: two summers, one fall, and two winters (see Figure 1). Unlike 2020 summer and winter surges, there was no significant decline in cases during the 2001 summer, fall, and winter surges.
Figure 1: Arizona COVID-19 Daily Cases: January 1, 2020 to December 31, 2021
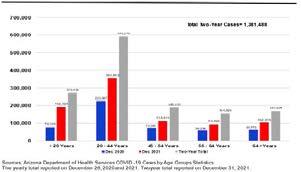
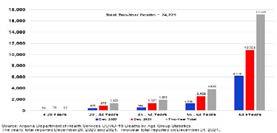
There were larger case numbers in 2021 (838,835) than in 2020 (542,653). The increases occurred in all five age groups (see Figure 2). The two age groups that had the largest case increases were 20-44 years (131,765) and younger than 20 years (116,075). There were more females (52%) than males (48%) who got the virus. The two largest state race/ethnicity groups diagnosed with COVID-19 were White, non-Hispanics (40%) and Hispanics (29%).
Figure 2: Arizona COVID-19 Cases by Age Groups for 2020, 2021, and Two-Year Total.
Figure 3: Arizona COVID-19 Daily Case Hospitalizations: January 1, 2020 to December 31, 2021.
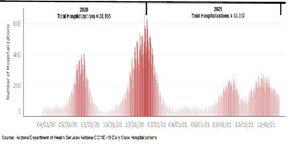
As expected, seniors had the highest percentage of the total hospitalizations (42.3%) and those under 20 years of age had the lowest percentage (3.7%) on December 31, 2021. Twentythree percent (23.1%) of seniors diagnosed with COVID-19 were hospitalized, while 1.2 percent of those under 20
continued on next page
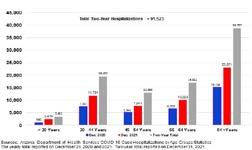
years of age were hospitalized. There were more males (52.5%) than females (47.5%) who were hospitalized. The second half of 2021 (25,890) had lower hospitalization numbers than first half of the year (27,477) most of the hospitalizations occurred in the beginning of 2021. The decrease hospitalizations in the second half of 2021 was due to the decrease hospitalization percentages of three age groups: less than 20 years (2.06% to 0.79%), 20 to 44 years (3.50% to 3.16%), and 65 years and older (25.26% to 19.25%). Figure 4 shows the hospitalization numbers for each age group in 2020, 2021, and two-year total.
Figure 4: Arizona COVID-19 Case Hospitalizations by Age Groups for 2020, 2021, and Two-Year Total.
In 2021, the total death numbers were higher than 2020 (15,224 and 9,075 respectively). Figure 5 shows Arizona daily deaths.
Figure 5: Arizona COVID-19 Daily Deaths: January 1, 2020 to December 31, 2021.

On December 31, 2021, seniors had the highest percentage of total deaths (70.7%) and those under 20 years of age had the lowest percentage (0.2%). Ten percent (10.2%) of the seniors diagnosed with COVID-19 died, while 0.02 percent of those under 20 years of age died. There were more males (59%) than females (41%) who died. The rate of fatalities per 100,000 population was 337.0. The second half of 2021 (6,350) had lower death numbers than first half (8,874) most of the deaths occurred at the beginning of the year. The decrease deaths in the second half of 2021 was due to the decrease death percentages of three age groups: less than 20 years (0.025% to 0.016%), 55 to 64 years (2.83% to 2.55%), and 65 years and older (13.22% to 7.42%). Figure 6 shows the death numbers for each age group in 2020, 2021, and twoyear total.
Figure 6: Arizona COVID-19 Deaths by Age Groups for 2020, 2021, and Two-Year Total.
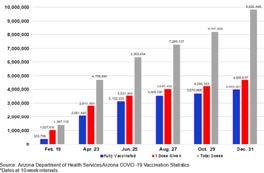
The first U.S. COVID-19 vaccine, Pfizer/BioNTech, was approved for use on December 11, 2020. Arizona began to administer vaccines in late December. Three vaccines were available in Arizona (Pfizer/BioNTech, Moderna, and Johnson & Johnson). The vaccines provided different levels of protection against COVID-19 and its variants. On January 8, 2021, the Arizona Department of Health Services reported 126,090 vaccine doses were administered and 124,322 who were partial protected against COVID-19. This had grown to 9,826,846 vaccine doses were administered and 3,955,021 who were fully vaccinated against the virus on December 31, 2021.The vaccination percentages of those who had received at least one dose by five age groups were less than 20 years - 28.4%; 20-44 years - 61.0%; 45-54 years - 69.9%; 55-64 years - 76.9%; and 65 years and older 93.5%. Figure 7 shows the numbers of COVID-19 vaccines that were given in Arizona (total doses given, persons receiving at least one dose, and persons fully vaccinated) during 2021.
Figure 7: Arizona COVID-19 Vaccination Numbers: February 19 to December 31, 2021*.
continued on next page
During most of the first year (2020) of the COVID-19 pandemic, there were no approved U.S. drug to treat the virus or vaccine. On October 22, 2020, the Food and Drug Administration (FDA) approved the first drug, Remdesivir for the treatment of COVID-19. The first U.S. vaccine (Pfizer-BioNTech) was approved for use on December 11. Without vaccines and therapeutics, the primary strategies in 2020 to confront the virus were to encourages the public to practice preventive health behaviors that reduces the risks of getting respiratory infections (e.g., coronavirus, flu, and cold) and stay-at-home. For those who have or have been exposed to the virus had to be quarantined. On March 13, 2020, the United States declared COVID-19 a pandemic.9 The Centers for Disease Control and Prevention (CDC) provided guidance to the states (e.g., on preventionstrategies, state reopening guidelines, and vaccine priorities). Arizona Governor Douglas Ducey issued a Stayat-Home Executive Order on March 30.7 State residents had to stay at home except for going out for essential services or going to work at approved essential jobs. The state encouraged the practicing of preventive health behaviors that included, but not limited to, social distancing, frequent hand washing, clean and disinfect potential contaminated surfaces or objects, and avoid crowds. The Executive Order was successful in keeping the COVID-19 cases low. On May 16, Arizona began its Reopening Phase 1. After six weeks of reopening the state, the COVID-19 cases spiked. The factors that contributed to the case increases included the easing of restrictions, the aggressive COVID-19 testing, significant numbers of people did not adhere to social distancing and preventive health recommendations, and large crowd events. On June 29, Governor Ducey issued a new Executive Order that addressed the COVID-19 outbreaks (e.g., delayed opening of some businesses, closed bars, gyms and theaters, limit business occupancy numbers, and prohibited large gathering).10 The state continued to encourage the practice of preventive health behaviors and staying-at-home. As the result of the aggressive state actions that lead to the decline of COVID-19 cases, the Governor began Reopening Phase 2 on August 10.10 The cases remained low until the first week of November when the cases rose and continued rising into 2020-21 winter. During the case surge, the state did not issue any new COVID-19 restrictions, but stopped the easing of existing restrictions. Some counties issued their own new restrictions (e.g.,Pima County implemented 10:00 p.m. to 5:00 a.m. voluntary/mandatory curfews). In the second year (2021), Arizona used a threepronged attack against the virus: (1) encourage preventive health behaviors, (2) increase vaccination numbers, and (3) use therapeutics. As more people were vaccinated and those infected recovered and have immunity against the virus; the numbers of cases, hospitalizations, and deaths would be low; COVID-19 would be manageable; and the state would be able to return to normal. At the end of December 2020, Arizona began to administer the COVID-19 vaccines. On January 4, 2021, the winter surge peaked at 12,402 new cases. ABC and NBC News reported that Arizona has the highest new cases per capital in the world.5,6 Soon after, the cases began to decline. On March 5, 2021, the Arizona Governor began Reopening Phase 3 after the state had administered more than two million vaccine doses and several weeks of declining cases.10 During the Reopening Phase 3, Arizona continued its efforts to vaccinate its population. The largest numbers of fully vaccinated persons occurred during the week of April 17 to23 (249,755).11 The pace of vaccination began to slow down in June. Arizona case numbers had decreased in the spring and early summer. At the end of June, the Arizona State Legislature and Governor had rescinded many of the state COVID-19 restrictions. During the month of July, the highly contagious Delta variant appeared in the state and began the summer surge. The state and locate health departments increased their vaccination efforts as the Delta variant rose. The number of vaccination sites expanded throughout the state that included pharmacy chains, doctor offices, and community centers and clinics. The state targeted vaccination efforts to hard-to-reach minority and rural communities. The local governments, schools and universities, and private employers acted on their own to address the virus increases. Even with the increase vaccination efforts and other actions, they were not enough to stop the Delta variant. The easing of the COVID-19 restrictions (e.g., those working at home returning to their workplaces, children and college students continued on next page
returning to in person classroom learning, and fans attending sport and entertainment events) made it easier for the virus to spread. This resulted in the fall surge. In December, the Omicron variant appeared in the state and began to surge. The three vaccines and therapeutics kept the number of hospitalizations and deaths low. Even with the occasion case surges, the state normal were low number of severe cases, manageable hospitalization numbers, and very low number of deaths.
Conclusion
At the end of the second year of the COVID-19 pandemic, there were 1,381,488 cases, 91,523 hospitalizations, 24,229 deaths, and 9,826,846 vaccine doses administered in Arizona. The state cases in 2021 were higher than in 2020. The second half of 2021 had higher case numbers than the first half, but it had lower hospitalization and death numbers. The low numbers were primary due to the high numbers of high-risk individuals and elderly had been vaccinated and the availability of drugs for treating the virus.
REFERENCES
1. 1. Johns Hopkins University Coronavirus Resource Center, https://coronavirus.jhu.edu/. 2. Britannica, Arizona state, United States, https://www. britannica.com/place/Arizona-state. 3. My Life Elsewhere, Arizona is around the same size as
Italy, https://www.mylifeelsewhere.com/country-sizecomparison/arizona-usa/italy. 4. United States Census Bureau, Quick Facts, https://www. census.gov/quickfacts/AZ. 5. Deliso, Meredith. “Arizona ‘hottest hot spot’ for COVID-19 as health officials warn of hospital strain: The state has the highest infections per capita globally, based on JHU data,
ABC News, January 7, 2021, https://abcnews.go.com/
US/arizona-hottesthot-spot-covid-19-health-officials/ story?id=75062175. 6. Chow, Denise and Joe Murphy. These three states have the worst Covid infection rates of anywhere in the world:
Arizona currently has the highest per capita rate of new
Covid-19 infections, with 785 cases per 100,000 people over the past seven days, followed closely by California and Rhode Island, NBC News, January 5, 2021 and updated on January 7, 2021, https://www.nbcnews.com/science/ science-news/thesethree-states-have-worst-covid infectionrates-anywhereworld-n1252861. 7. Eng Howard J (2020) Arizona and COVID-19. Med Clin Res 5(8):175-178. 8. Time, World Health Organization Declares COVID-19 a
‘Pandemic.’ Here’s What That Means, March 11, 2020, https://time.com/5791661/who-coronavirus-pandemicdeclaration/. 9. White House, Proclamation on Declaring a National
Emergency Concerning the Novel Coronavirus Disease
Med Clin Res, 2022 www.opastonline.com Volume 7 | Issue 2 | 10 Copyright: ©2022: Howard J Eng. This is an openaccess article distributed under the terms of the Creative
Commons Attribution License, which permits unrestricted use, distribution, and reproduction in any medium, provided the original author and source are credited. (COVID-19)
Outbreak, March 13, 2020, https://www.whitehouse.gov/ presidential-actions/proclamation-declaringnationalemergency-concerning-novel-coronavirus-diseasecovid-19outbreak/. 10. Eng Howard J (2021) Arizona Reopening Phase 2: Rise and
Fall of COVID-19 Cases,” Med Clin Res 6(4):114-118. 11. Eng Howard J (2021) Arizona Reopening Phase 3 and
COVID-19: Returning to Normal. Med Clin Res 6(9):687-691.

AzPA presents an innovative podcast intended for pharmacists and pharmacy technicians to obtain continuing education credit. The podcast also provides current health


