19 minute read
Does RO Make Sense for Cooling Tower Makeup?

Does RO Make Sense for Cooling Tower Makeup?
James McDonald, Chem-Aqua, Inc.
While introduced as a water-saving alternative to once-through applications, cooling towers still use large volumes of water. As communities strive to conserve our natural resources, cooling towers are an obvious target for saving water in industrial, commercial, and institutional settings. How much water they use is based on many variables, but it could easily be 20% to 30% of a facility’s total water usage. Cooling towers achieve their temperature-reducing effect through sensible (direct contact) and evaporative cooling. On average, evaporative cooling is the primary driving factor. As water evaporates, it leaves the nonvolatile components in the water (e.g., calcium, magnesium, bicarbonate, chlorides) behind. Eventually, these components will reach their saturation limits
and start to form scale and deposits within the water system, which can reduce heat transfer, increase corrosion, block flow, and negatively impact the system.
It is typically the saturation limits of these nonvolatile components that limit how concentrated the water can be allowed to get as the cooling tower continues to evaporate water. The cycles of concentration refers to how many times the cooling tower water is concentrated compared to the makeup water entering the system to maintain the system water level. A common range is 4 to 6 in many areas. The cycles of concentration is controlled by wasting a portion of the concentrated water by blowdown (i.e., bleed).
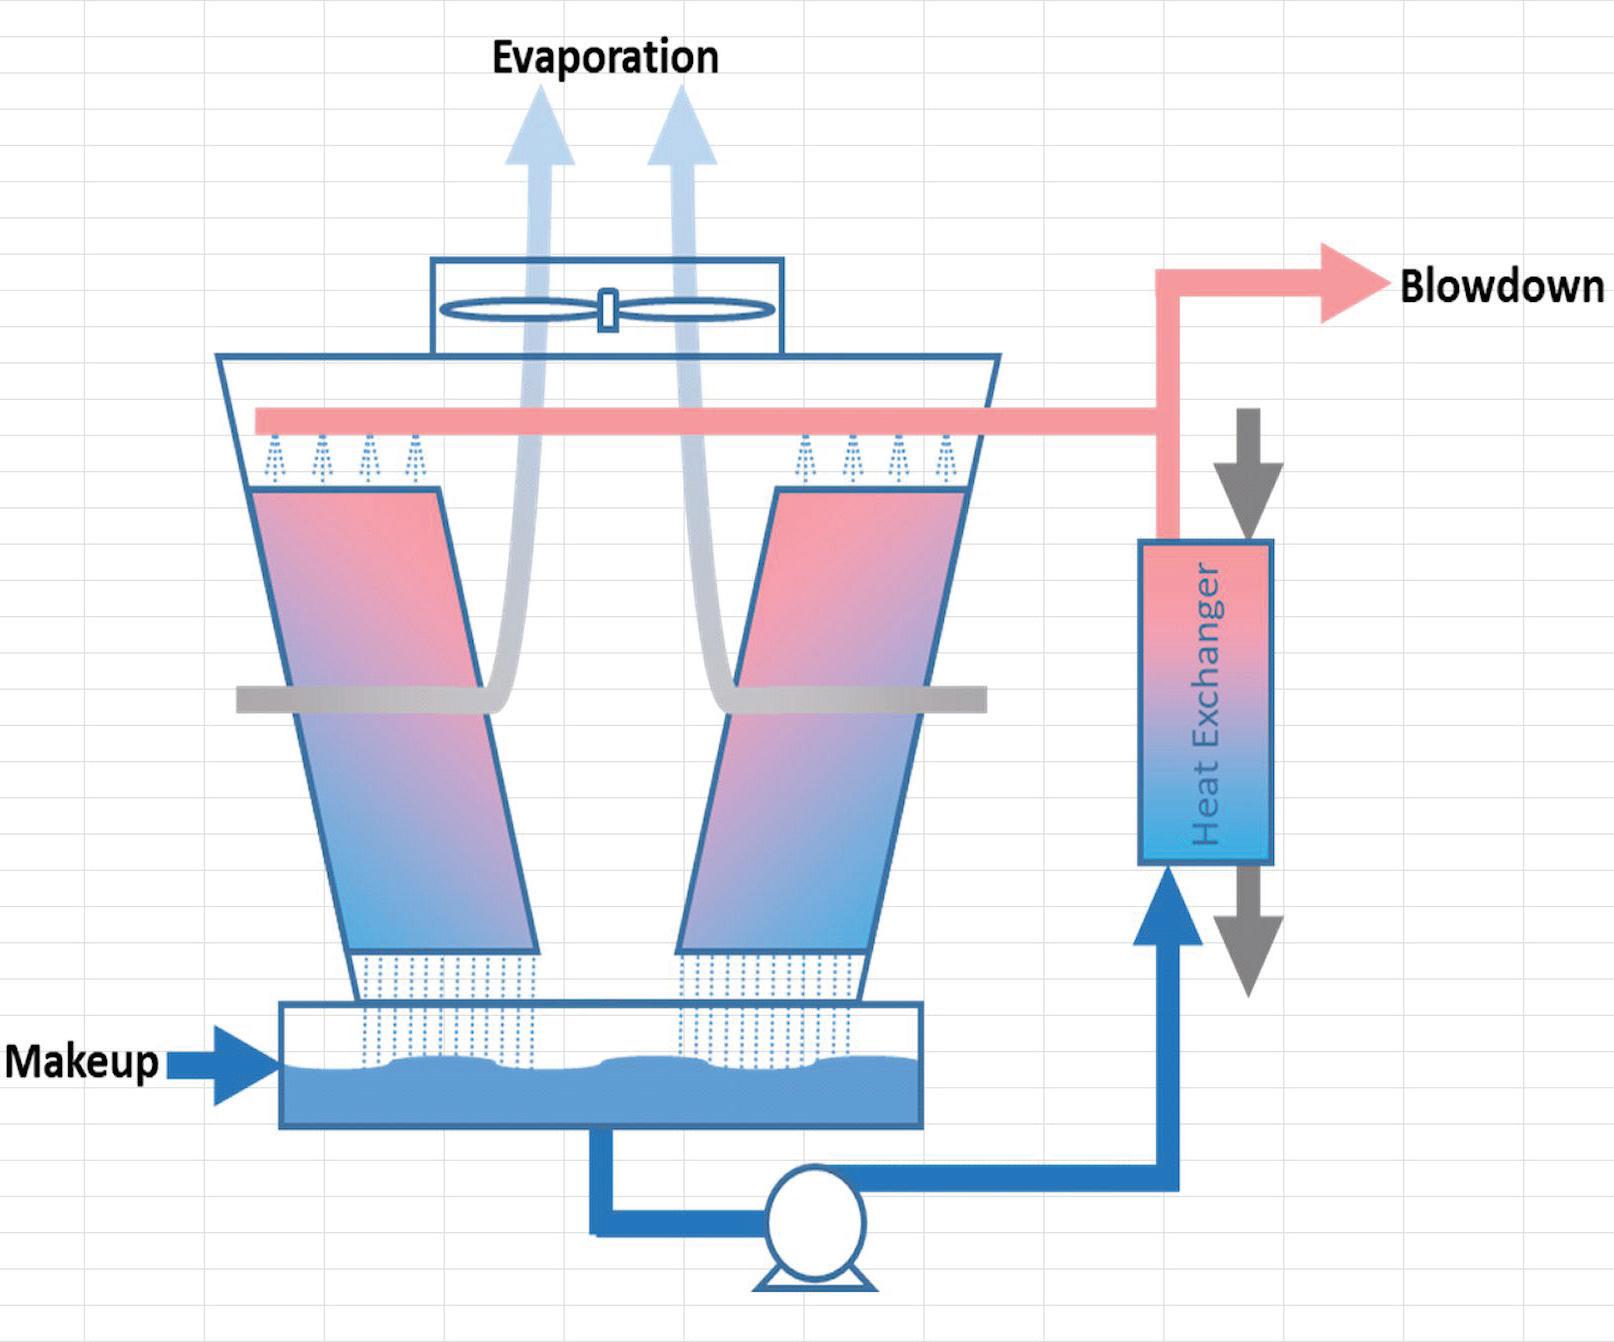
Equation 1 and Figure 1 show the overall mass balance around a cooling tower. Most of the makeup water requirements to a
cooling tower are to satisfy the evaporation demand, with blowdown being an ever-shrinking percentage as cycles of concentration are increased (as shown in Figure 2). While water treatment professionals typically have little to no control over the evaporation portion of the equation (which is determined by cooling load and current weather conditions), reducing the volume of blowdown may be within their control. Makeup = Evaporation + Blowdown Eq. 1
Figure 1: Cooling tower mass balance.
It is assumed in Figure 1 that both controlled and uncontrolled water loses (e.g., leaks, drift, windage) are each included in the general “blowdown” variable. Figure 2 shows cooling tower water usage per 100 tons of cooling load.
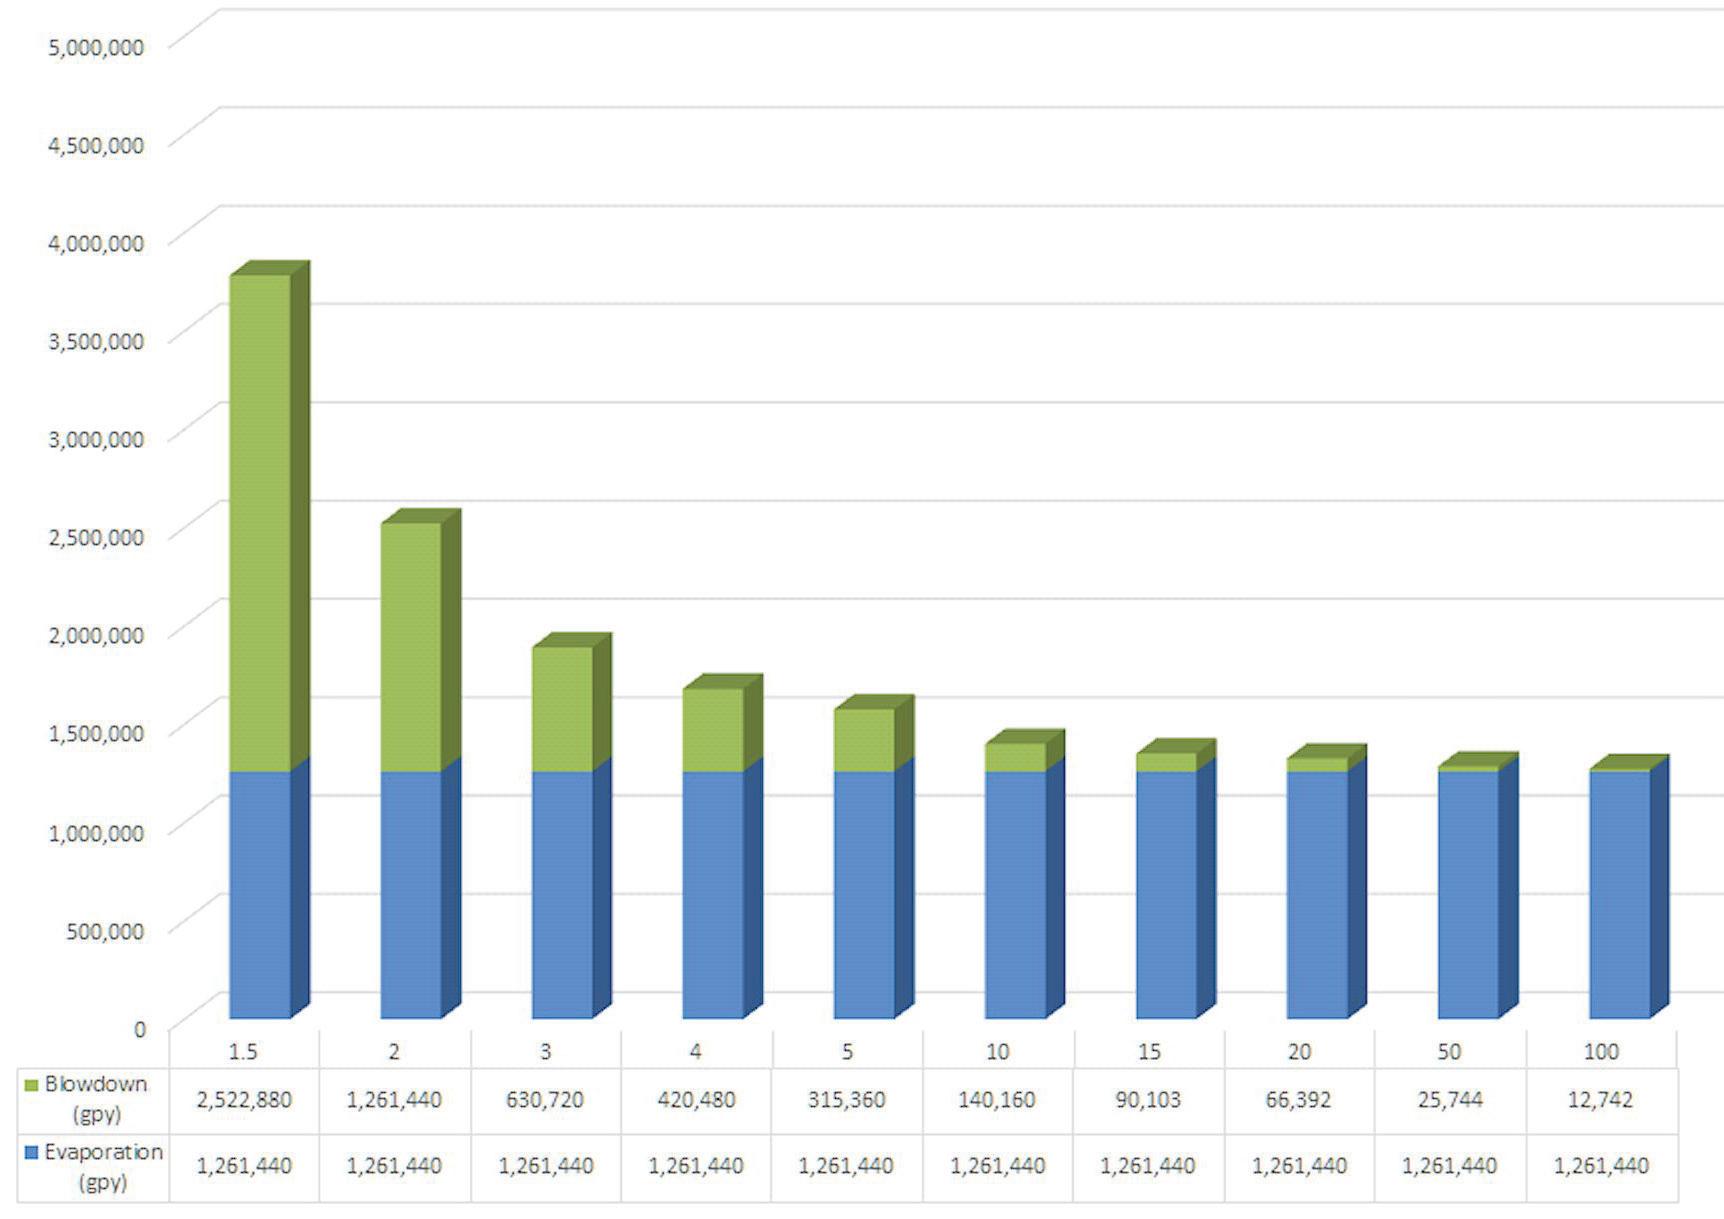
Figure 2: Cooling tower water usage per 100 tons cooling load.
Water-Saving Approaches Approaches to saving water in cooling towers focus on decreasing blowdown and, consequently, increasing the cycles of concentration. The approaches fall into the following categories, as illustrated in Figure 3: • Antiscalants (e.g., polymers, phosphonates, polyphosphates) • Removal/reduction of cycle-limiting components (e.g., water softeners, reverse osmosis) • Altering the water chemistry to increase solubility (e.g., lowering pH) • Filming of surfaces to inhibit scale buildup (e.g., filming amines) • Improved control (e.g., automatic online controllers) • Tightening up the system (e.g., fixing leaks, drift, windage, uncontrolled water loses) • Alternative makeup water sources (e.g., gray water, waste streams, reverse osmosis reject). While this may or may not actually save water usage within the cooling tower system itself, it may save water for the facility as a whole. The focus of this article will be on using reverse osmosis (RO) for the “removal/reduction of cycle-limiting components.”
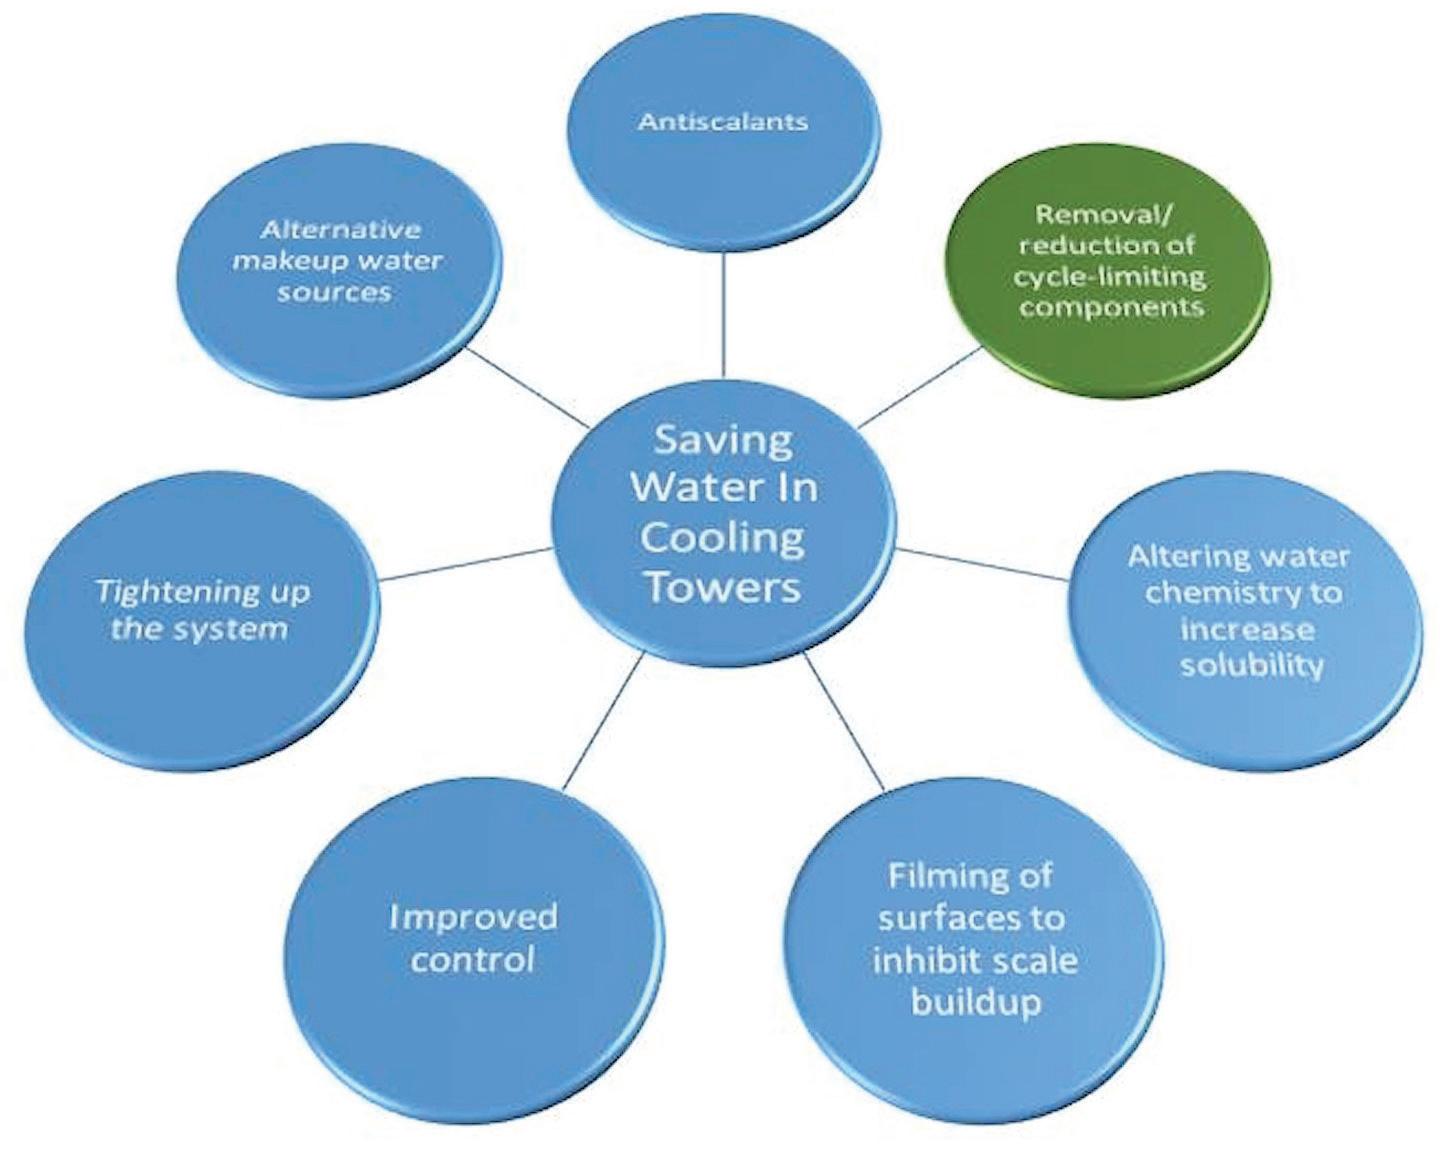
Figure 3: Water-saving approaches for cooling towers.
Using RO for Cooling Tower Makeup Does it make sense to use RO water for cooling tower makeup? The answer is “maybe,” but a mass balance around the entire water system must be considered, including both the RO and the cooling tower. At first glance, it may seem that removing the cycle-limiting components of water (i.e., calcium, magnesium, and silica) would allow the cooling tower blowdown to be reduced to near zero as cycles of concentration are greatly increased. In reality, it does not always save water and can even use more. Only by calculating the mass balance can the user be sure. Let’s dig a little deeper into the idea of using RO for cooling tower makeup. RO systems produce high-purity water by passing water through a semipermeable membrane. They are, however, limited by the same cycles of concentration concepts as cooling towers. The more concentrated the unwanted water components become (e.g., calcium, magnesium, silica), the greater the chance of forming scale on the membrane surfaces. Scaling can greatly reduce the ability of an RO to produce high-purity water and even lead to damage of the membranes themselves. Like in a cooling tower, a portion of the water is wasted to control how concentrated the water gets. This waste stream is called “concentrate” or “reject.” As Equation 2 and Figure 4 illustrate, the overall mass balances of both the RO and cooling tower are similar, with: • Makeup supplying water • High-purity water leaving as permeate/evaporation • Concentrated waste streams leaving as reject/blowdown Makeup = Permeate + Reject Eq. 2
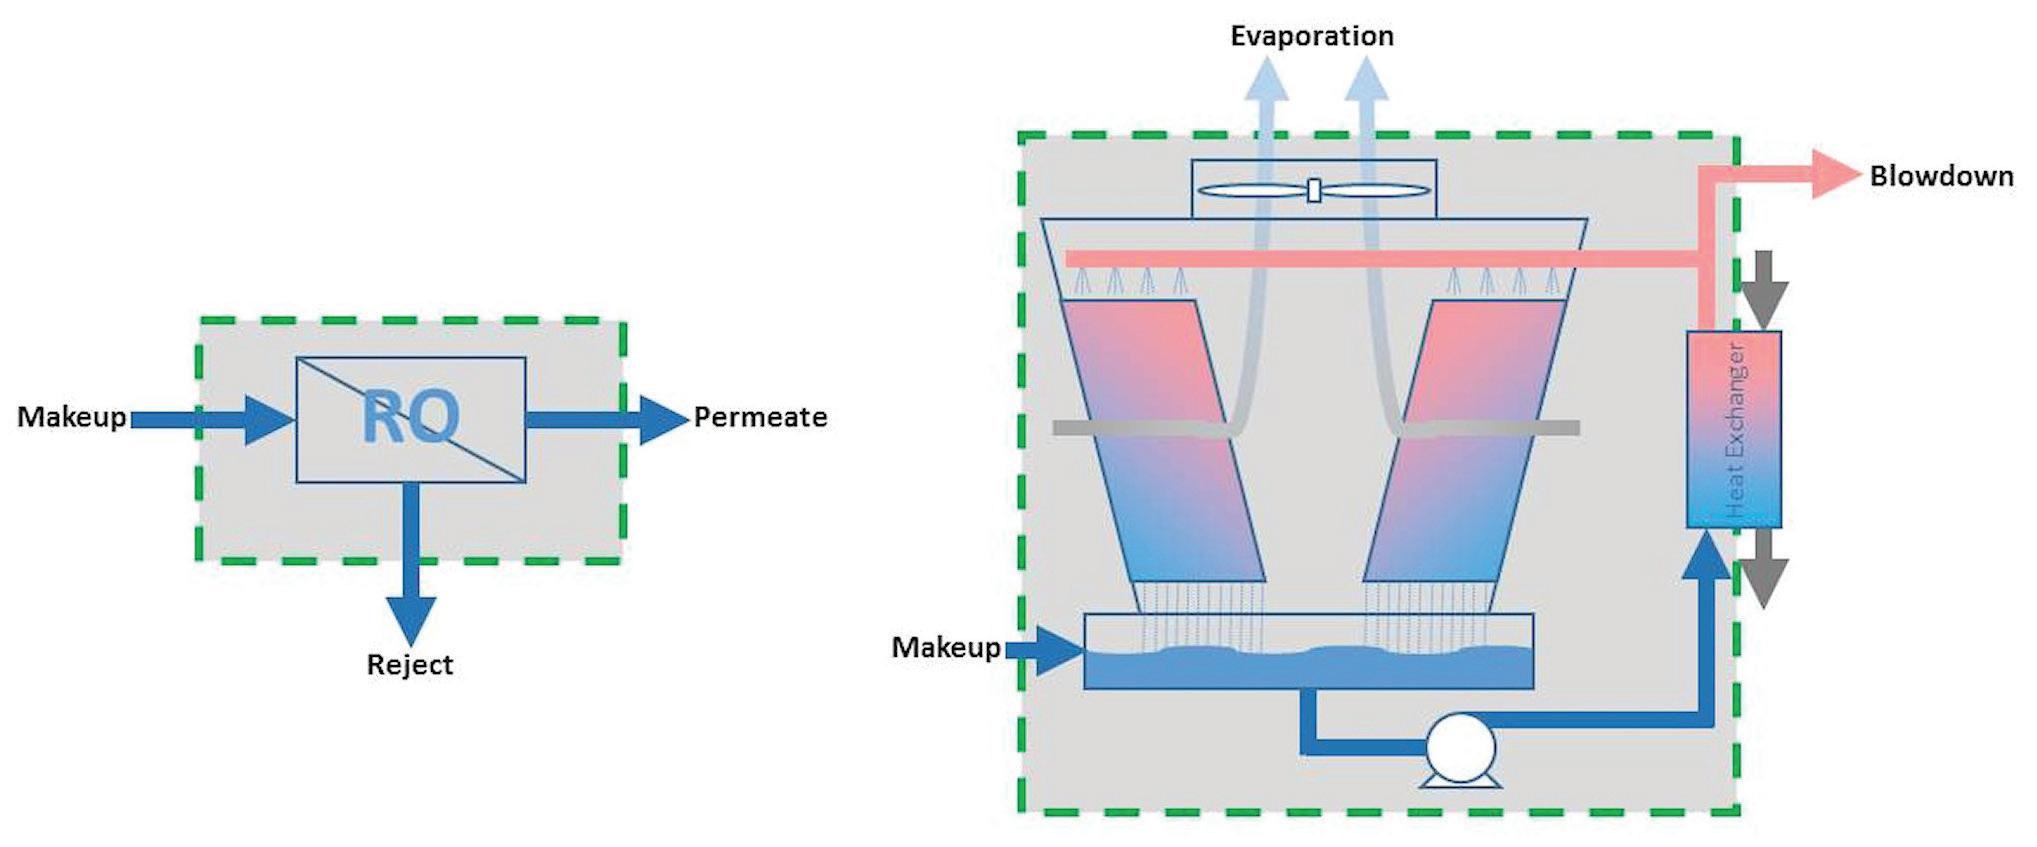
Figure 4: Reverse osmosis versus cooling tower mass balances.
Conventional ROs are typically designed to operate at 75% to 80% recovery. This means that 75% to 80% of the water going into an RO ends up as high-purity water (permeate) while 25% to 20%, respectively, ends up being wasted as reject water. How many times is the water within an RO concentrated? Using Equation 3, a 75% recovery RO operates at 4 cycles of concentration, while an 80% recovery RO operates at 5. See Table A for other comparisons. Cycles of Concentration = 1/ 1 – (% Recovery/100) Eq. 3
Table A: % Recovery versus Cycles Percent RO Recovery RO Cycles of Concentration 75% 4 80% 5 85% 6.7 90% 10 95% 20
Understanding that an RO can waste just as much water as a cooling tower running at 4 or 5 cycles is important to note. Sure, the cooling tower may be able to theoretically run at much higher cycles, but if the pretreatment unit providing all the makeup is only running at 4 or 5 cycles, that is the BEST that can be achieved if the cooling tower blowdown were completely eliminated. Equation 4 and Figures 5 and 6 illustrate the overall mass balance of a cooling tower utilizing 100% RO makeup. Makeup = Evaporation + Blowdown + Rejection Eq. 4
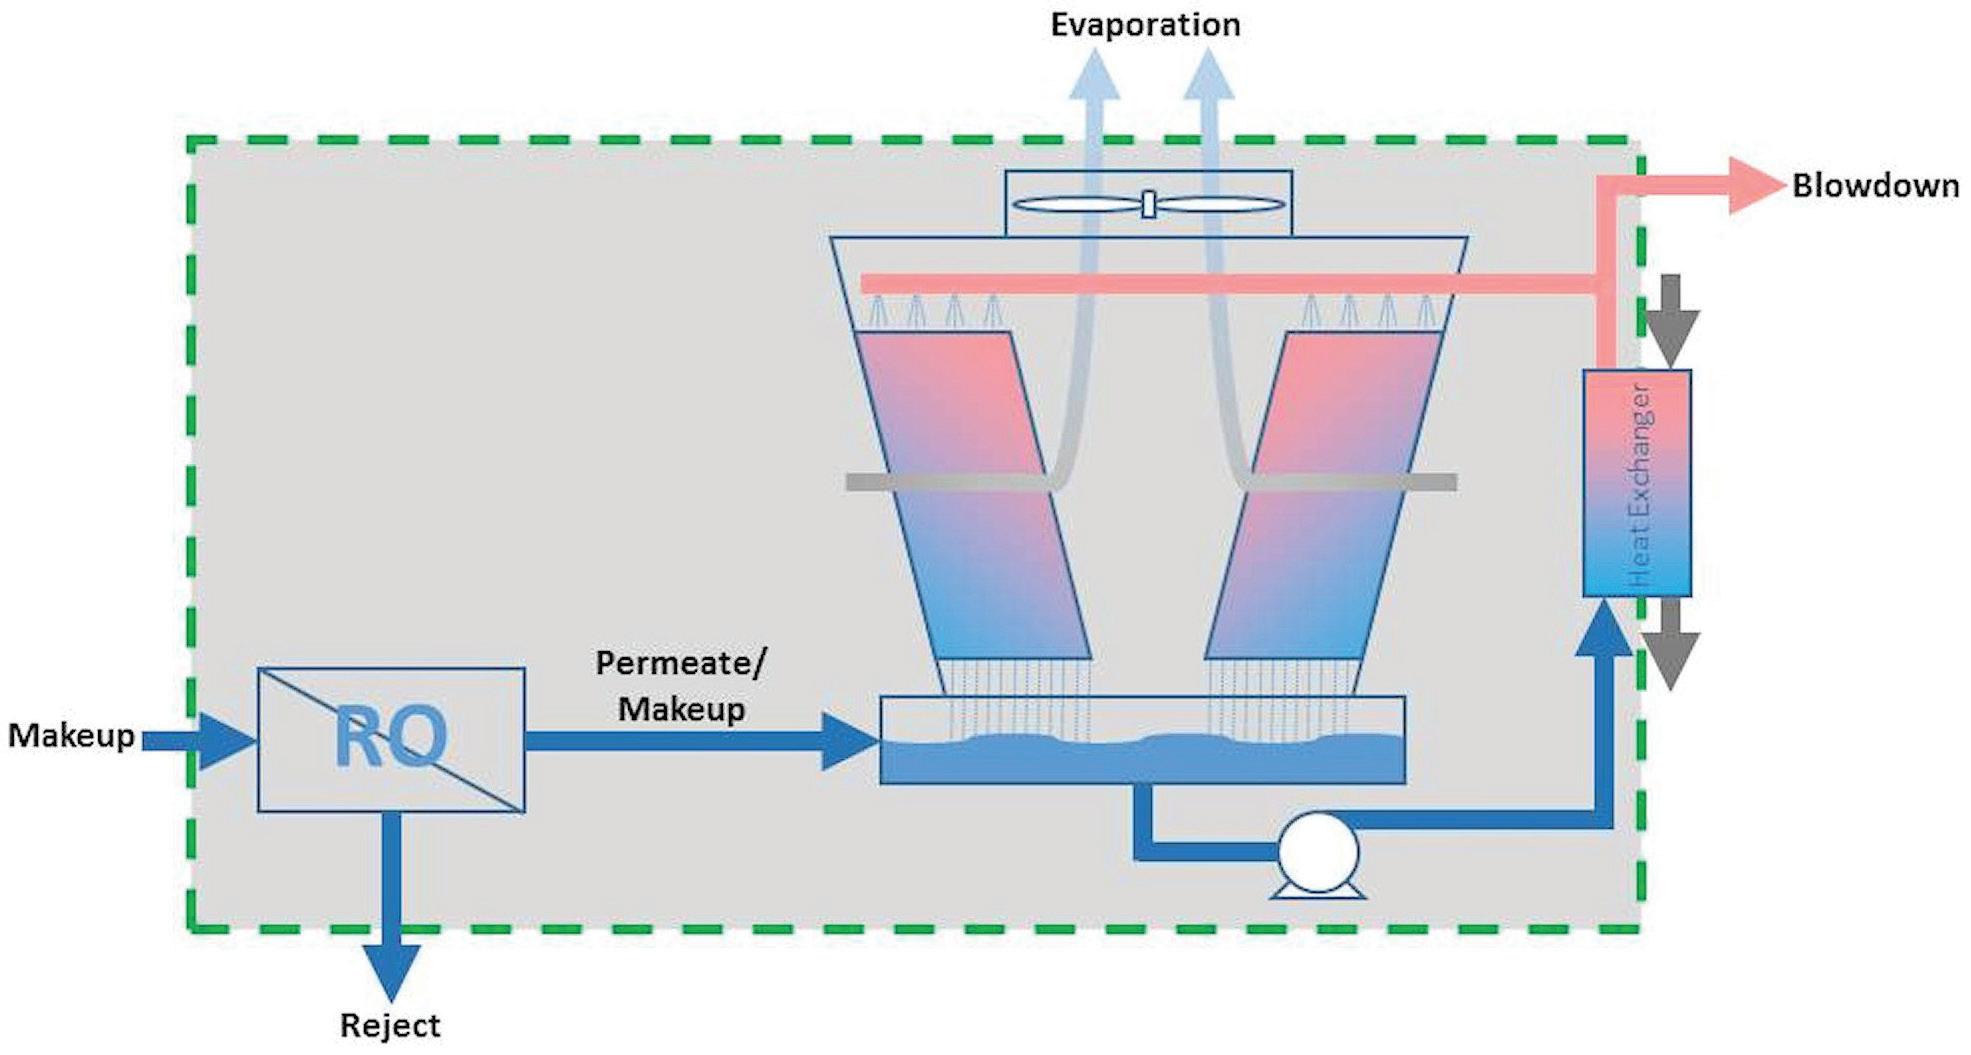
Figure 5: Mass balance of using RO for 100% cooling tower makeup.
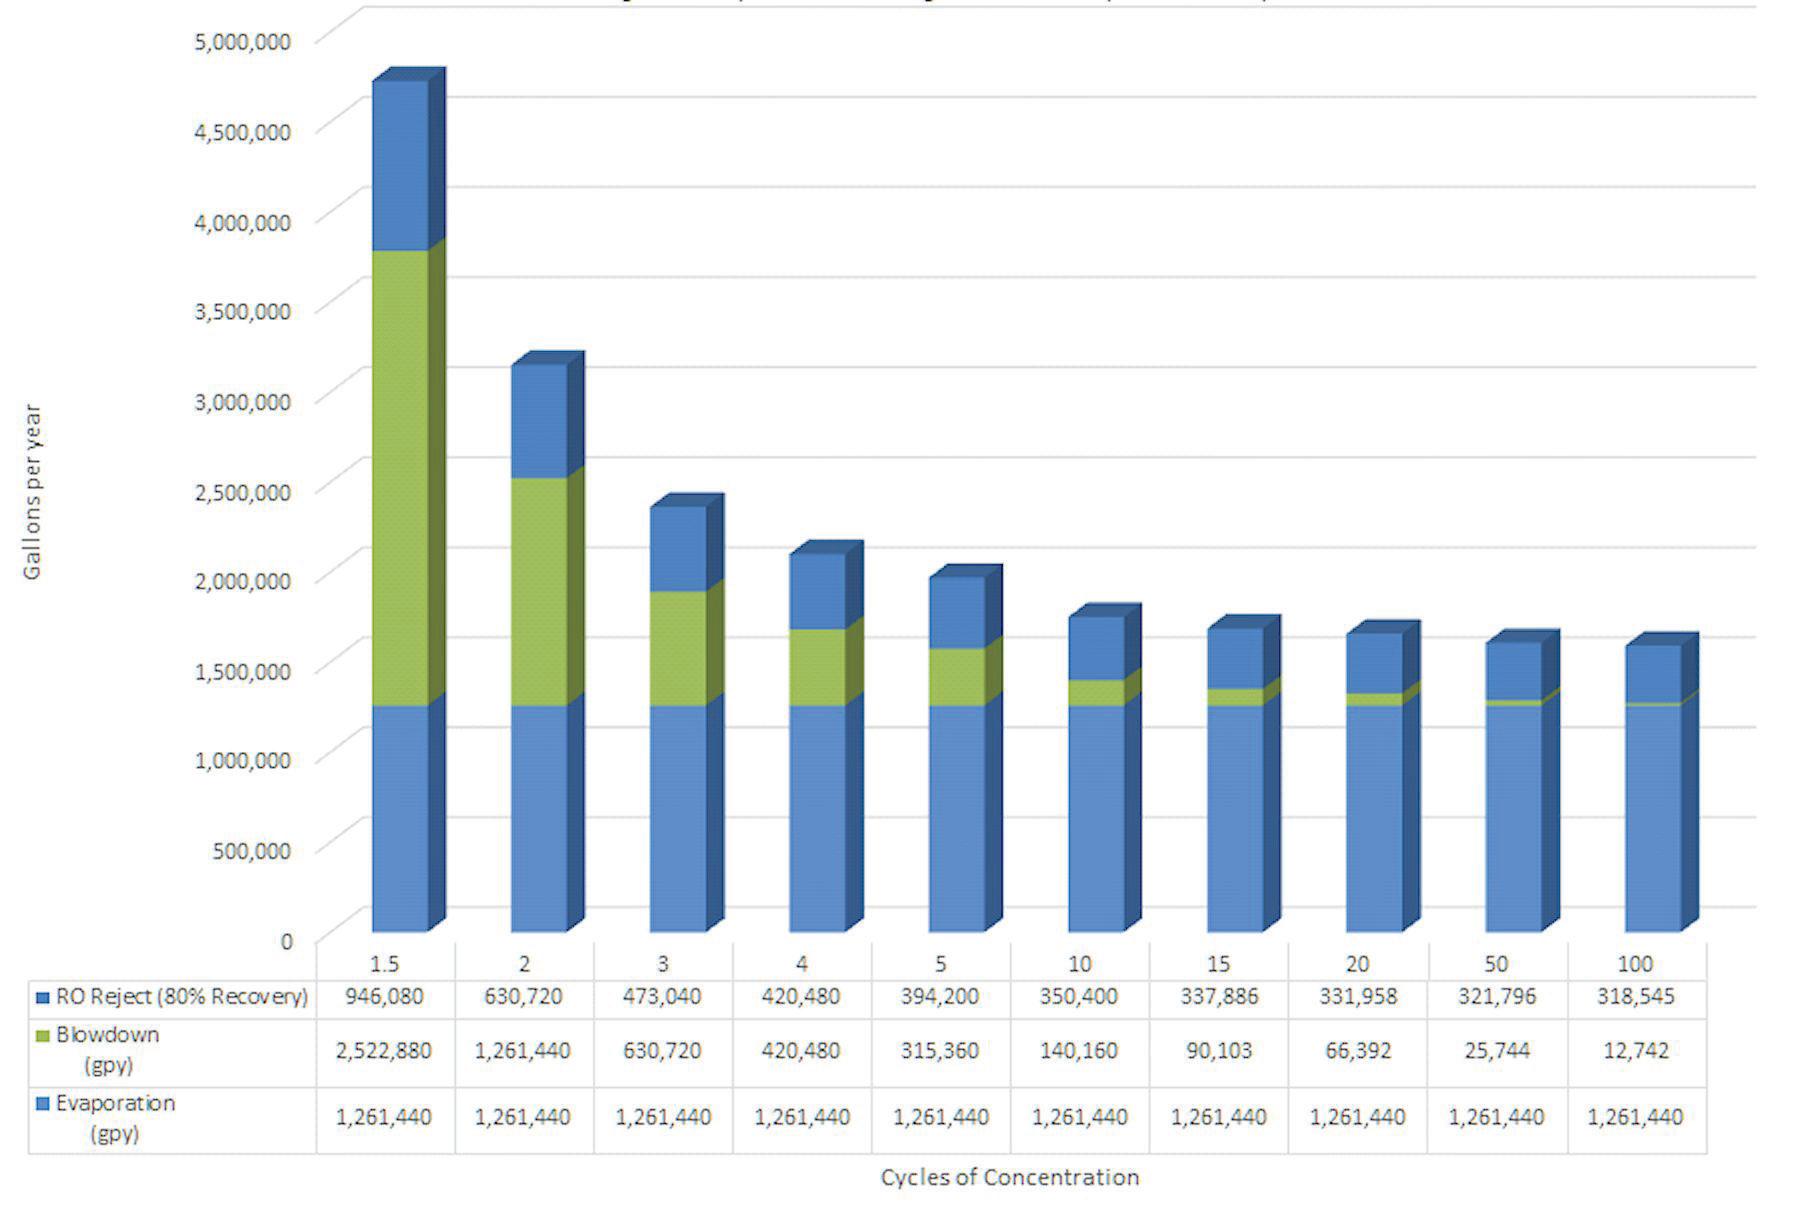
Figure 6: Cooling tower water usage per 100 tons cooling load, assuming 80% evaporative cooling and 10 ºF temperature drop.
Example of Using 100% RO for Cooling Tower Makeup Let’s illustrate this last point by considering the following cooling tower system. Table B lists the cooling tower blowdown and makeup requirements at various cycles. System conditions: • Recirculation rate = 10,000 gallons per minute (gpm) • Temperature drop = 10 °F • 80% evaporative cooling • Operating 24 hours a day, 365 days a year
Table B: Cooling Tower Water Requirements Cycles Makeup (gpm) Evaporation (gpm) Blowdown (gpm) 1.5 240 80 160 2 160 80 80 3 120 80 40 4 107 80 27 5 100 80 20 6 96 80 16 7 93 80 13 8 91 80 11 9 90 80 10 10 89 80 9 15 86 80 6 20 84 80 4 50 82 80 2 100 81 80 1
As Table B shows, the cooling tower running at 5 cycles of concentration would require 100 gpm of makeup to replace the 80 gpm evaporation and 20 gpm blowdown. Looking at the extreme of 100 cycles of concentration, it would still require 81 gpm to replace the 80 gpm evaporation and 1 gpm blowdown. For comparison, Table C adds one more column showing how much water would need to be supplied to an RO system (running at 80% recovery) to supply the makeup required to a cooling tower at various cycles. Table C: Cooling Tower and RO Water Requirements Cycles Cooling Tower Makeup (gpm) Cooling Tower Evaporation (gpm) Cooling Tower Blowdown (gpm) 100% RO Makeup @ 80% Recovery (gpm) 1.5 240 80 160 300 2 160 80 80 200 3 120 80 40 150 4 107 80 27 133 5 100 80 20 125 6 96 80 16 120 7 93 80 13 117 8 91 80 11 114 9 90 80 10 113 10 89 80 9 111 15 86 80 6 107 20 84 80 4 105 50 82 80 2 102 100 81 80 1 101 Table C clearly illustrates that even at the extreme of 100 cycles, the overall RO-cooling-tower system uses MORE makeup water than a cooling tower running at 5 cycles of concentration without RO makeup (at 80% recovery). Why is this? Remember from Table A that an RO running at 80% recovery is already cycling the water five times in the reject stream. Before the RO permeate even makes it to the cooling tower, it has already wasted as much water as if the cooling tower had achieved 5 cycles of concentration by itself. If the cooling tower has any blowdown at all, it uses more. Figures 7 and 8 illustrate this example. A cooling tower running by itself at five cycles without RO makeup and using standard chemistries, high-stress chemistries, or pH control would have saved more water than having to invest the capital funds and annual operational costs of the RO system.
Figure 7: Example of cooling tower mass balance at 5 cycles of concentration.
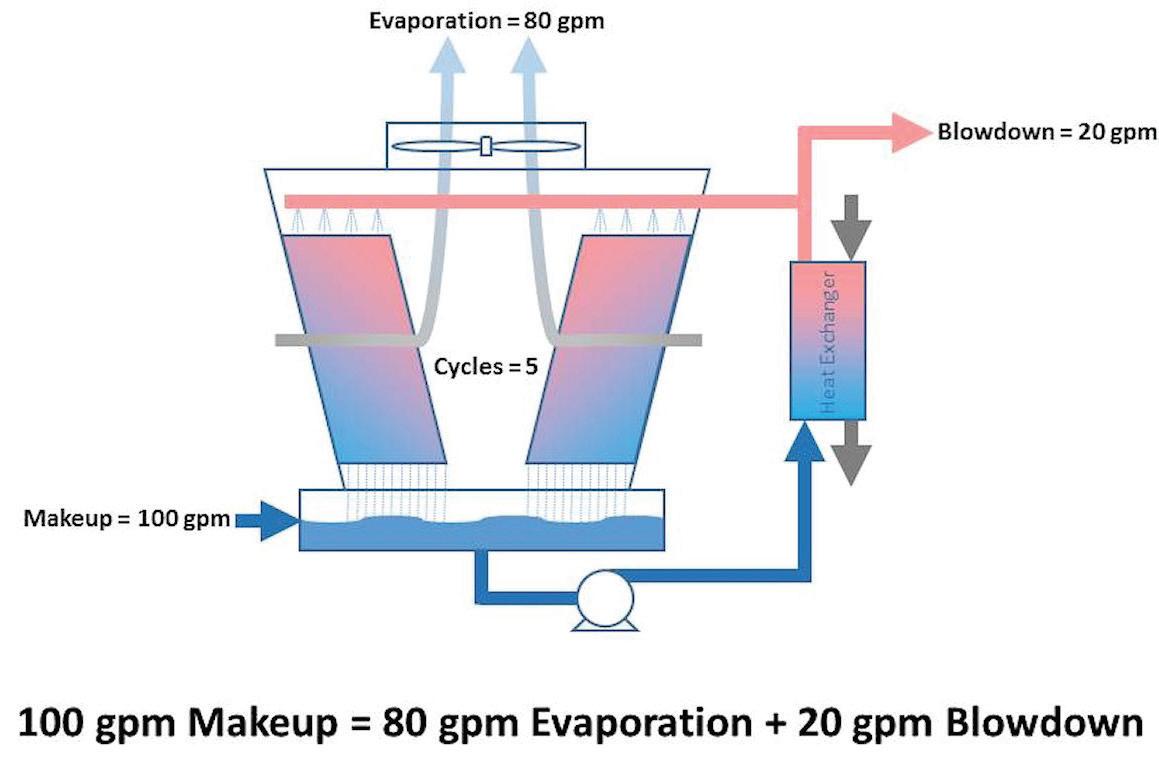
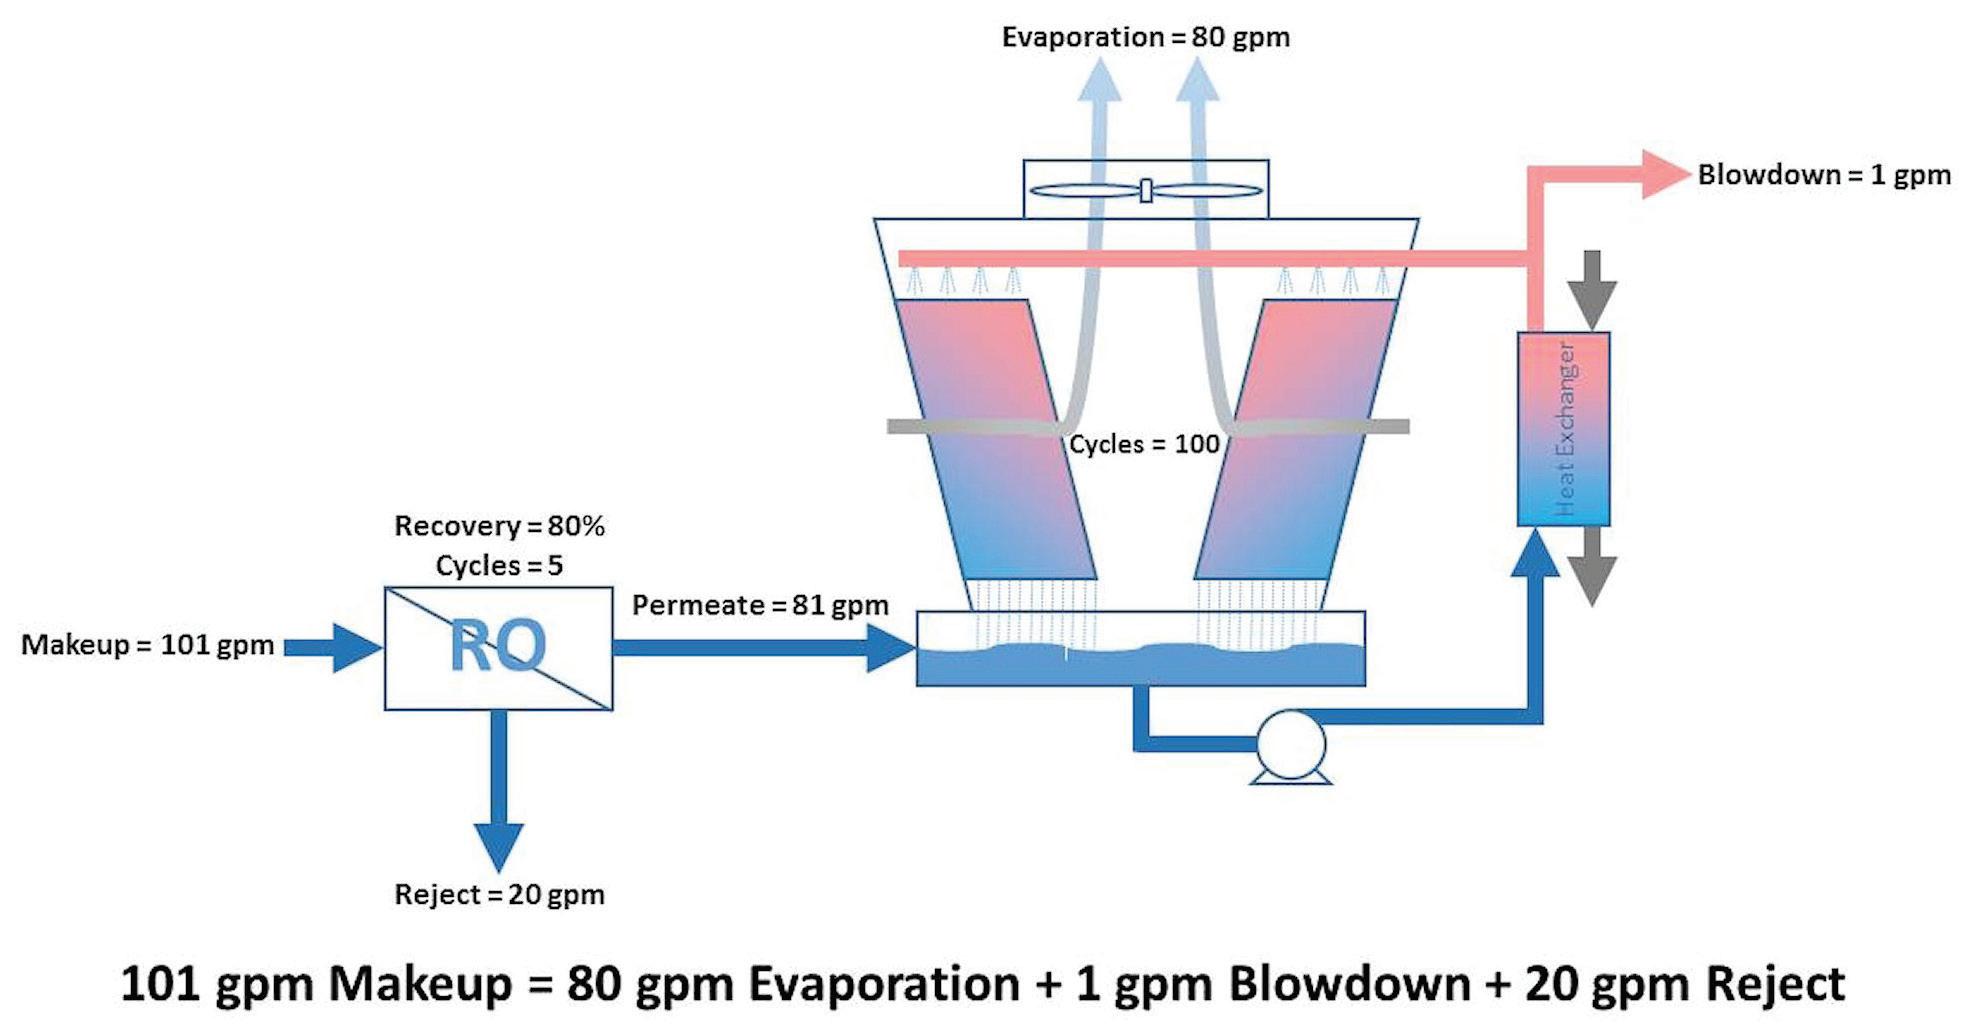
Figure 8: Example of cooling tower mass balance with RO makeup and 100 cycles of concentration.
If the cooling tower had originally been running at less than five cycles, then water savings are theoretically possible. As Table C shows, a cooling tower system requires 107 gpm makeup at four cycles of concentration without RO makeup. With RO makeup at 80% recovery, the system only needs 101 gpm at 100 cycles as an extreme. The question to be asked is if an RO can run at 80% recovery (i.e., five cycles) if the cooling tower itself could only run at four cycles of concentration without RO. Since ROs are often limited by the same scale-forming species as cooling towers, additional pretreatment, such as water softening, may be required. Then softener regeneration waters must be factored into the mass balance.
How Many Cycles Can a Cooling Tower Run? Running a cooling tower at 100 cycles is typically not possible because of leaks, windage, and drift, among other factors. Often, 10 to 20 cycles of concentration are found to be the maximum a cooling tower can physically achieve, and sometimes even less. This makes the comparison to using RO even worse. As Table C shows for an 80% recovery RO, running the cooling tower at 20 cycles equates to running the cooling tower without RO at between four to five cycles. At 10 cycles, this equates to between three to four cycles. Using an RO with 75% recovery makes the example even worse (e.g., running a cooling tower at 20 cycles with RO makeup equates to running a cooling tower without RO makeup at between three and four cycles). Table A is more telling than first implied because even at nearly infinite cycles, a cooling tower system with 100% RO makeup will NEVER use less water than a cooling tower system with
out RO makeup running at the same cycles of concentration as the RO itself (e.g., at 80% RO recovery and infinite cycles, the system will use the same amount of makeup as a cooling tower at five cycles of concentration without RO makeup).
14 the Analyst Technology Supplement 2019 Unconventional ROs We’ve been basing our assumptions on conventional RO designs that typically achieve 75% to 80% recovery, depending upon the makeup water quality. There are unconventional designs, such as reverse-flow and closed-circuit systems, that may achieve greater percent RO recoveries (90% to 98%) by taking advantage of the short residence time of the water within the RO versus the induction time for scaling to occur. Such systems also do not have to deal with higher temperatures of heat exchange surfaces that drive scale formation that must be accounted for with cooling tower systems. There are other high-recovery, patented RO designs available for reduction of cycle-limiting component such as silica.
Using our example of a cooling tower running at five cycles of concentration again, adding an RO for 100% makeup running at 90% recovery could potentially use less water if the cooling tower cycles could be pushed over nine cycles, as the tables in the next section will show. Blended RO Makeup When 100% RO makeup is not a viable option based upon the mass balance or other reasons, perhaps a blend of RO permeate and another source should be considered. Blending RO water with city, soft water, or other sources may reduce the offending component limiting cooling tower cycles. Examples include: • Alkalinity reduction may reduce the need to feed acid and/ or minimize white rust formation. • Silica reduction may reduce the potential for silica deposits. • Chloride reduction may reduce the corrosion potential for stainless steel components. • Total hardness reduction may reduce the potential for scale formation in systems with high skin temperatures at heat exchange surfaces.
As already discussed, and based on mass balance calculations, what would be the new cycles of concentration at which the blended-RO-makeup-water system would need to operate to truly save water? The math can be complicated, but Equation 5 and Tables D, E, F, and G show the break-even points. Running at cycles of concentration above those calculated or shown will start saving water, assuming the cooling tower water chemistry allows the cooling tower to run at such cycles.
Eq. 5
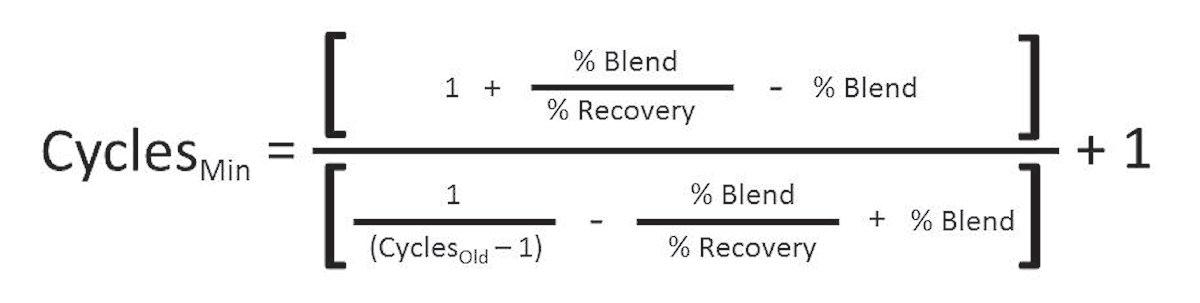
Where:
Cycles Old = Previous cycles of concentration with 0% RO makeup Cycles Min = Minimum cycles of concentration required when using RO water to break even with water usage of Cycles Old at various percent blends
% Blend = Percent of RO water in blended cooling tower makeup water % Recovery = RO design percent recovery
Table D: Break-Even Cycles of Concentration Using 75% Recovery RO Old Cycles of Concentration % Blend 25% 50% 75% 100% New Minimum Cycles of Concentration to Break Even using an RO with 75% Recovery 1.5 1.57 1.64 1.71 1.80 2 2.18 2.40 2.67 3.00 3 3.60 4.50 6.00 9.00 4 5.33 8.00 16.00 NA 5 7.50 15.00 NA NA 10 40.00 NA NA NA 15 NA NA NA NA 20 NA NA NA NA 50 NA NA NA NA 100 NA NA NA NA Table E: Break-even Cycles of Concentration Using 80% Recovery RO Old Cycles of Concentration % Blend 25% 50% 75% 100% New Minimum Cycles of Concentration to Break Even using an RO with 80% Recovery 1.5 1.55 1.60 1.66 1.71 2 2.13 2.29 2.46 2.67 3 3.43 4.00 4.80 6.00 4 4.92 6.40 9.14 16.00 5 6.67 10.00 20.00 NA 10 22.86 NA NA NA 15 120.00 NA NA NA 20 NA NA NA NA 50 NA NA NA NA 100 NA NA NA NA
Table F: Break-Even Cycles of Concentration Using 85% Recovery RO Old Cycles of Concentration % Blend 25% 50% 75% 100% New Minimum Cycles of Concentration to Break Even using an RO with 85% Recovery 1.5 1.53 1.57 1.61 1.65 2 2.09 2.19 2.31 2.43 3 3.29 3.64 4.08 4.64 4 4.61 5.44 6.63 8.50 5 6.07 7.73 10.63 17.00 10 16.59 48.57 NA NA 15 39.23 NA NA NA 20 123.64 NA NA NA 50 NA NA NA NA 100 NA NA NA NA Table G: Break-Even Cycles of Concentration Using 90% Recovery RO Old Cycles of Concentration % Blend 25% 50% 75% 100% New Minimum Cycles of Concentration to Break Even using an RO with 90% Recovery 1.5 1.52 1.54 1.57 1.59 2 2.06 2.12 2.18 2.25 3 3.18 3.38 3.60 3.86 4 4.36 4.80 5.33 6.00 5 5.63 6.43 7.50 9.00 10 13.33 20.00 40.00 NA 15 24.55 67.50 NA NA 20 42.35 NA NA NA 50 NA NA NA NA 100 NA NA NA NA
Accurately blended water can be a challenge to achieve. Will it be done by throttling valves, volumetrically, or some other method? Taking the time to engineer a reliable system is vital to such a program’s success.
RO Pretreatment The above discussion assumes there are no RO pretreatment water losses. If a water softener is used, for example, the regeneration wastewater will need to be factored into the overall mass balance as well. If a filter is used, the backwash water must be accounted for and will negatively impact the overall water savings. Mass Balance and Beyond There are other reasons and schemes for using RO for cooling tower makeup, not all of which save water. When water savings
is desired, one must always do an overall mass balance to determine if water usage is truly reduced. Other reasons include: Reusing RO water. RO permeate that is too contaminated from its original use (e.g., rinse water) could potentially be used for cooling tower makeup, depending upon the contaminants. Recovering wastewater. Using RO to recycle wastewater back to the cooling tower may be a possibility in water-stressed areas or where company or governmental policy mandates it. Using the proper pretreatment steps ahead of the RO is important (e.g., filtration, clarification, ultrafiltration, microfiltration, nanofiltration, disinfection). Excess RO capacity. RO systems may be overdesigned due to future plans or reduced need, or to meet peak demand. With the desire to keep the RO systems running to reduce up and down times and stagnant conditions, the plant may produce more RO water than can currently be used. This may be a candidate for cooling tower makeup, with a backup plan for when RO water is not available.
Using RO’s Other Water: Reject An RO may be producing high-quality permeate for another application, but the RO reject could still be of high enough quality to use for cooling tower makeup, particularly if the makeup water to the RO is softened. This has the benefit of using water that ordinarily would have been sent to the drain. It is important, of course, to consider the impact of RO reject on the overall cooling water chemistry. Can the RO reject provide 100% makeup or just a portion? Will the RO reject be collected in a storage tank? What happens when the RO is down? Will a backup soft water source be required? Is the RO close enough to the cooling tower to make it logistically possible? If the RO reject is blended with other makeup water sources (e.g., city water), how will this affect solubilities of calcium and other factors? Will acid feed be required to reduce alkalinity and pH? Will the cycles of concentration of other components, such as silica and chlorides, be an issue?
Other RO Makeup Considerations While this article has focused on mass balances, the need for economic and energy balances should not be forgotten. The total cost of operation of an RO system must be considered in addition to any water saving benefits (if any). Factors may include: • Capital costs • Electricity • Membrane replacement • Cleaning • Routine maintenance • Antiscalant • Dechlorination
• Microbiological control • RO reject destination • Softener costs • Other Pretreatment costs (e.g., carbon filters, macro filtration, ultrafiltration) • Footprint required for system installation
As cycles of concentration increase in a cooling tower system, the holding time index (HTI) increases as well. This means that whatever is in the cooling tower water will stay in the cooling tower water longer before leaving the system. This may impact the effective lifespan of corrosion inhibitors, antiscalants, and dispersants. Cooling towers also function as air scrubbers, removing pollen, blossoms, dirt, and dust from the surrounding air. This may require sidestream filtration to keep the system clean. The backwash water from any filtration system will need to be considered in the overall mass balance. Corrosion control may need to be a consideration. Water is the universal solvent, and high-purity water can increase corrosion potential. Is it cheaper to treat for corrosion or scale? Is blended water an economical option for corrosion control? When using RO for boiler makeup, the fuel savings typically make the scheme economically favorable. Considering these other considerations with RO for cooling tower makeup, however, economics and practical aspects may outweigh any advantages of water savings. The ability to control the cooling tower itself cannot be forgotten. Is the current controller working properly? Are probes regularly maintained, calibrated, and replaced? Are dosing pumps in working order and maintain prime? The higher the cycles of concentration in a cooling tower system, the higher the reliability of control needs to be for when things go wrong. A little bit of hardness getting to the system, for example, will be amplified at higher cycles. Is the cooling tower itself maintained to minimize uncontrolled water losses? Tracing down piping and referring to updated piping diagrams may be required to hunt down water loses. Water flow may need to be balanced over the distribution decks to prevent water from splashing onto the ground. Drift eliminators and fill may need to be replaced. Lastly, using RO as makeup to a cooling tower system is not likely to eliminate the need for adding water treatment chemicals. The system may still need dispersants, antiscalants, corrosion inhibitors, and microbicides.
Conclusion Using RO for cooling tower makeup may be a great solution or may not be. Does the treatment scheme really save water? Does it save or cost more money? It is important to know the overall water mass balance and consider all the factors to make an informed decision instead of falling for a mirage of water savings.

James McDonald, PE, CWT, is the technology and marketing manager at Chem-Aqua, Inc. He is the current chair of the AWT Certification Committee and incoming chair of the AWT Technical Committee. Mr. McDonald is the 2013 winner of the AWT Ray Baum Memorial Water Technologist of the Year Award. He has published numerous industrial water treatment papers in trade journals and has written the book Drop by Drop: Articles on Industrial Water Treatment. He is also the founder of Industrial Water Week, an annual global, grassroots, open-source celebration of the noble profession of industrial water treatment held during the first full business week of October.