the ANALYST The Voice of the Water Treatment Industry
Volume 29 Number 1
1300 Piccard Drive, Suite LL 14 • Rockville, MD 20850
Winter 2022
What Are the Do’s and Don’ts Related to the Proper Use of Fluorescent-Tagged Polymers? Part 2: What Are the Internal Treatment Programs Used Within Steam Generators? What Microbial Control Strategies Are Followed by AWT Members in Cooling Water Treatment? An Overview of Cooling Towers, Legionellosis, and Water Management Programs Volume 29 Number 1 Winter 2022
What to Look for When Analyzing RO and Demineralizer Makeup
Published by
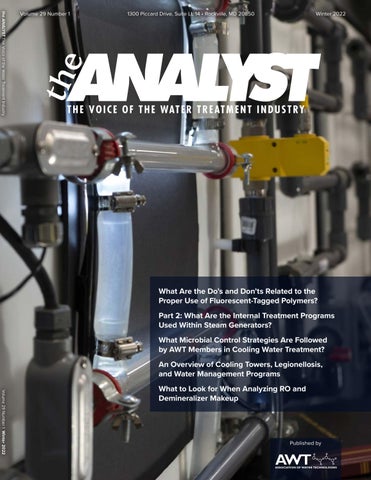
Cover Test heat exchangers used to evaluate cooling water additives. Photo courtesy of Mike Standish/Radical Polymers.
Winter 2022
8
Volume 29
Number 1
What Are the Do’s and Don’ts Related to the Proper Use of Fluorescent-Tagged Polymers? Michael L. Standish, Radical Polymers
Measurement of phosphonates or polymers requires cumbersome techniques that yield limited accuracy. One method that can overcome these limitations is the use of fluorescent tags that are covalently bound to the scale or corrosion inhibitor molecule. This article provides an overview of tagged polymers and fluorescence technology, reviews extensive pilot cooling testing to demonstrate limits of functionality, and provides practical use guidance for where the technology should be and should not be relied on.
24 Part 2: What Are the Internal Treatment Programs Used Within Steam Generators? Edward Beardwood, BC&T Inc.
A number of internal chemical treatment programs are available for use in the control of corrosion and deposition within steam-generating equipment. A common aspect of all these programs is the need for pH, alkalinity, silica, iron, and hardness control in the boiling waters. In this article, we examine internal chemical treatment programs that are available.
34 What Microbial Control Strategies Are Followed by AWT Members in Cooling Water Treatment? Ken Soeder, CWT, Jamestown Technologies Division; John Caloritis, CWT, The Metro Group, Inc.; Garret Garcia, Masters Company, Inc.; and Members of the AWT Cooling Water Technical Subcommittee
The purpose of this study was to directly survey AWT member companies to learn what is being used to properly control microbiological issues in their customers’ open cooling water systems. The information gathered from the two separate surveys has provided valuable insights on the daily concerns and choices made by our fellow AWT members when implementing their own microbiological control programs.
42 An Overview of Cooling Towers, Legionellosis, and Water Management Programs
4
Calendar of Events
5
President’s Message
6
Message From the President-Elect
65 Membership Benefits 66 Industry Notes 70 Discovering AWT 73 CWT Spotlight 74 Making a Splash 76 Tales From the Waterside 79 Life Beyond Water 83 T.U.T.O.R. 88 Business Notes 90 Advertising Index
Christopher J. Nagle, EVAPCO, Inc.
Recently, several jurisdictions have proposed or adopted regulations referencing sections of ASHRAE Standard 188, Legionellosis: Risk Management for Building Water Systems,” without inclusion of all potable and non-potable building water systems. Some of these regulations imposed rigid, prescriptive requirements on the program team. These more narrowly focused regulations have historically failed to produce measurable reductions in the occurrence of legionellosis. Data from two such jurisdictions will be presented as a preface to a broader discussion on water management programs, including cooling towers.
56 What to Look for When Analyzing RO and Demineralizer Makeup Ed Sylvester and Brad Buecker, ChemTreat, Inc.
Reverse osmosis (RO) has become popular for primary makeup water demineralization at steam-generating power plants and other industrial facilities. Often, and especially for high-pressure units, RO is followed by ion exchange (IX) polishing. This article discusses the importance of detecting and quantifying potentially harmful constituents in makeup waters, how they can affect RO and demineralizer operation and performance, and mitigation methods.
3
the ANALYST Volume 29 Number 1
1300 Piccard Drive, Suite LL 14 Rockville, MD 20850 (301) 740-1421 • (301) 990-9771 (fax) www.awt.org
2022 AWT Board of Directors President
Matt Jensen, CWT
Calendar of Events Association Events 2022 Technical Training Seminars, East
Secretary
March 30–April 2, 2022 Cleveland Marriott Downtown at Key Tower Cleveland, Ohio
Treasurer
2022 Business Owners Meeting
President-Elect
Stephen C. Hallier, CWT Noah Baskin
September 20, 2022 Pan Pacific Vancouver Hotel Vancouver, Canada
John D. Caloritis, CWT
Immediate Past President
Michael Bourgeois, CWT
Directors
Mark Coldren, CWT Tammy Faber, MBA Kyle Rossi, CWT Fred Shurtz
2022 Annual Convention & Exposition
Ex-Officio Supplier Representative
September 21–24, 2022 Vancouver Convention Centre Vancouver, Canada
Past Presidents
2023 Annual Convention & Exposition
Pam Simmons
Jack Altschuler John Baum, CWT R. Trace Blackmore, CWT, LEED AP Michael Bourgeois, CWT D.C. “Chuck” Brandvold, CWT Thomas Brandvold, CWT Brent W. Chettle, CWT Dennis Clayton Bernadette Combs, CWT, LEED AP Matt Copthorne, CWT James R. Datesh John E. Davies, CWT Jay Farmerie, CWT Gary Glenna Charles D. Hamrick Jr., CWT Joseph M. Hannigan Jr., CWT
Mark R. Juhl Brian Jutzi, CWT Bruce T. Ketrick Jr., CWT Bruce T. Ketrick Sr., CWT Ron Knestaut Robert D. Lee, CWT Mark T. Lewis, CWT Steven MacCarthy, CWT Anthony J. McNamara, CWT James Mulloy Alfred Nickels Scott W. Olson, CWT William E. Pearson II, CWT William C. Smith Marc Vermeulen, CWT David Wagenfuhr Casey Walton, B.Ch.E, CWT Larry A. Webb
Staff
Executive Director Heidi J. Zimmerman, CAE Deputy Executive Director Sara L. Wood, MBA, CAE Member Services Director Angela Pike Vice President, Meetings Grace L. Jan, CMP, CAE Meetings Coordinator Caroline Bentley Meetings Planner Tim Foley Exhibits and Sponsorship Manager Brandon Lawrence Senior Director, Creative Services/Marketing Jennifer Olivares Marketing Coordinator Mary Claire Gordon Managing Editor Lynne Agoston Production Manager Maryia Alenchyk Director of Accounting Services Dawn Rosenfeld
The Analyst Staff
Publisher, Heidi J. Zimmerman, CAE Managing Editor, Lynne Agoston Production Manager, Maryia Alenchyk Technical Editor Michael Henley, mdhenleywater@gmail.com, (303) 745-3890 Advertising Sales Manager Carol Nettles, carol@adboomadvertising.com The Analyst is published quarterly as the official publication of the Association of Water Technologies. Copyright 2022 by the Association of Water Technologies. Materials may not be reproduced without written permission. Contents of the articles are the sole opinions of the author and do not necessarily express the policies and opinions of the publisher, editor or AWT. Authors are responsible for ensuring that the articles are properly released for classification and proprietary information. All advertising will be subject to publisher’s approval, and advertisers will agree to indemnify and relieve publisher of loss or claims resulting from advertising contents. Editorial material in the Analyst may be reproduced in whole or part with prior written permission. Request permission by writing to: Managing Editor, the Analyst, 1300 Piccard Drive, Suite LL 14, Rockville, MD 20850, USA. Annual subscription rate is $100 per year in the U.S. (4 issues). Please add $25 for Canada and Mexico. International subscriptions are $200 in U.S. funds.
October 4–7, 2023 Amway Grand Hotel and Grand Rapids Convention Center Grand Rapids, Michigan
Also, please note that the following AWT committees meet on a monthly basis. All times shown are Eastern Time. To become active in one of these committees, please contact us at (301) 740-1421. Second Tuesday of each month, 11:00 am—Legislative/Regulatory Committee Second Tuesday of each month, 2:30 pm—Convention Committee Second Wednesday of each month, 11:00 am—Business Resources Committee Second Friday of each month, 10:00 am—Special Projects Subcommittee Second Friday of each month, 11:00 am—Cooling Subcommittee Second Friday of each month, 2:00 pm—Pretreatment Subcommittee Third Monday of each month, 9:00 am—Certification Committee Third Monday of each month, 3:30 pm—Young Professionals Task Force Third Tuesday of each month, 3:00 pm—Education Committee Third Friday of each month, 9:00 am—Boiler Subcommittee Third Friday of each month, 10:00 am—Technical Committee Quarterly (call for meeting dates), 10:00 am—Wastewater Subcommittee
Other Industry Events
NACE, Corrosion Risk Management Conference, March 6–10, 2022, San Antonio, Texas ACS, Spring National Meeting & Expo, March 20–27, 2022, San Diego, California WQA, Convention and Expo, April 6–8, 2022, Orlando, Florida AWWA, Annual Conference & Expo, June 12–15, 2022, San Antonio, Texas ASHRAE, Annual Conference, June 25–29, 2022, Toronto, Canada BOMA, International Conference and Expo, June 25–29, 2022, Nashville, Tennessee ASHE, Annual Convention & Expo, July 17–20, 2022, Boston, Massachusetts ACS, Fall National Meeting & Expo, August 21–25, 2022, Chicago, Illinois WEFTEC, Annual Exhibition and Conference, October 8–12, 2022, New Orleans, Louisiana IWC, Annual Conference, November 6–10, 2022, Orlando, Florida RETA, Annual Convention, November 7–10, 2022, Reno, Nevada
4
the ANALYST Volume 29 Number 1
President’s Message
By Matt Jensen, CWT
AWT Bylaws and the Amplify Campaign As you know, AWT has been working on addressing the sustainability of the association through our Amplify Campaign. The culmination of this campaign and these discussions will be a bylaws vote later this year. As a reminder, the two current proposals are to change the cap on water treatment company members to 500 employees or fewer and to add an individual membership category.
It’s hard to believe we’re already well into 2022. This is going to be another banner year for AWT.
Leadership Meeting At the end of last year, the AWT board, committees, subcommittees, task forces, and Related Trade Organization (RTO) liaisons got together to review our goals for 2022. I’m pleased to report that work continues on our four outcomes: training and education, member and industry advocate, an engaged membership, and charity.
At the recent board meeting, the board reviewed the proposed changes. These proposed revisions will be sent to the membership to review in the coming months. We ask for your feedback and comment. Our goal will be to have an electronic as well as in-person vote later this fall at the AWT Convention & Exposition in Vancouver.
AWT Training AWT Training will be held February 23–26 in Seattle, Washington, and March 30–April 2 in Cleveland, Ohio. Every year, the sessions are revised and updated based on feedback received from attendees. Programs include sessions on Sales, RO Training, Fundamentals and Applications, Wastewater (Seattle Only), and Water Treatment Training. Sign up now at www.awt.org.
We welcome your feedback on the proposed bylaws and encourage your company participation in the vote. Thank you for the opportunity to serve. I can be reached at president@awt.org.
Ask for Legiolert and deliver more accurate Legionella results The Legiolert® Test is a more accurate culture test for Legionella pneumophila Spread plate methods are notoriously inaccurate, with up to tenfold variability in results for the same sample.1 Multiple peer-reviewed studies have confirmed that the Legiolert Test provides more accurate and consistent results.2–5
See the difference the Legiolert Test can make at idexx.com/legiolertdifference. References
1. Lucas CE, Taylor TH Jr, Fields BS. Accuracy and precision of Legionella isolation by US laboratories in the ELITE program pilot study. Water Res. 2011;45(15):4428–4436. doi:10.1016/j.watres.2011.05.030 2. Petrisek R, Hall J. Evaluation of a most probable number method for the enumeration of Legionella pneumophila from North American potable and nonpotable water samples. J Water Health. 2018;16(1):25–33. doi:10.2166/wh.2017.118 3. Spies K, Pleischl S, Lange B, et al. Comparison of the Legiolert/Quanti-Tray MPN test for the enumeration of Legionella pneumophila from potable water samples with the German regulatory requirements methods ISO 11731-2 and ISO 11731. Int J Hyg Environ Health. 2018;221(7):1047–1053.doi:10.1016/j.ijheh.2018.07.006 4. Sartory DP, Spies K, Lange B, Schneider S, Langer B. Evaluation of a most probable number method for the enumeration of Legionella pneumophila from potable and related water samples. Lett Appl Microbiol. 2017;64(4):271–275. doi:10.1111/lam.12719 5. Barrette I. Comparison of Legiolert and a conventional culture method for detection of Legionella pneumophila from cooling towers in Québec. J AOAC Int. 2019;102(4):1235–1240. doi:10.5740/jaoacint.18-0245
© 2021 IDEXX Laboratories, Inc. All rights reserved. • 2485785-01 • All ®/TM marks are owned by IDEXX Laboratories, Inc. or its affiliates in the United States and/or other countries. The IDEXX Privacy Policy is available at idexx.com.
2485785-01 AWT Summer 2021.indd 1
5
the ANALYST Volume 29 Number 1
6/6/21 9:24 PM
Message From the President-Elect
We are hard at work planning the 2022 AWT Annual Convention & Exposition, September 21–24, 2022, in Vancouver, British Columbia, Canada! It’s shaping up to be a memorable event!
By Steve Hallier, CWT
the waterfront. The program will be moved to Friday evening with an awards presentation, dinner, and fireworks show. It will be a fun event and a nice way to honor our award recipients.
Visit Vancouver Once the convention is over, you might want to extend your stay. There is a lot to do in Vancouver and the surrounding areas. The world-class ski resort of Whistler is just two hours from downtown Vancouver. The mountain usually opens in November for skiing, but day trips to take in the mountain scenery are always recommended. The province’s capital city, Victoria, is also an easy day trip from Vancouver. And the Okanagan Valley, British Columbia’s wine country, is a short trip as well.
Educational Program We are currently putting together the program for the convention and have some great abstracts from which to choose. In addition, we have reached out to members about what sessions they want to see at the meeting. Based on your feedback, we are developing several sessions. Golf Tournament We’re looking forward to a great tournament this year at the Furry Creek Golf Club. Furry Creek is known as “British Columbia’s Most Scenic Golf Course,” and for good reason. Surrounded by Howe Sound Bay, towering aged trees and snow peaked mountains, Furry Creek encompasses what British Columbia is all about. This is one course you won’t want to miss!
Passport We’ll continue to remind everyone about this as we get closer to the convention—be sure to take your passport out now to check the expiration date. Your passport needs to be good through December 31, 2022, to gain entry to the convention. And if you don’t have a passport, you’ll want to start that process now, as there are currently long wait times.
Annual Reception and Awards Dinner We’re also looking forward to a great Annual Reception and Awards Dinner. We have the opportunity to be in an incredible space at the Convention Center for the Awards Dinner, with incredible views looking out at
As we continue to plan the 2022 Annual Convention, I welcome your feedback. I can be reached at steve@wetsolutionsinc.com. Thank you for the opportunity, and I look forward to serving you!
6
the ANALYST Volume 29 Number 1
Products available right away, when you need them most.
COOLING TOWER CONTROLLER Get simple, reliable and acccurate control of conductivity, pH, ORP and more.
TOROIDAL SENSOR Factory calibrated for the life of the probe and maintenance free to save you time and money.
PULSALINK COMMUNICATIONS Cloud managed controller with mobile access to live reports, settings and notifications anytime, anywhere.
MicroVision EX controllers make life simpler. Worry less about installation, programming and future maintenance. And do more through water conservation and lowering costs. With MicroVision EX, less equals more.
PULSAtron electronic metering pumps are reliable and accurate. The PULSAtron Series of pump features a premium construction with few moving parts and highly reliable electronics.
ROBUST Robust design keeps your pump operating for years with minimual maintenance.
SAFETY The accompanying bleed valve assembly ensures easy priming and leak free assurance.
Learn more at pulsatron.com or call 941-575-3880.
NSF 61 CERTIFIED Tested and Certified by WQA against NSF/ANSI 61 & 372. PVDF and PVC Degassing Head Pumps.
What Are the Do’s and Don’ts Related to the Proper Use of Fluorescent-Tagged Polymers? Michael L. Standish, Radical Polymers
8
the ANALYST Volume 29 Number 1
Abstract
broad market until recently. The aim of this article is to provide an overview of tagged polymers and fluorescence technology, review extensive pilot cooling testing to demonstrate limits of functionality, and provide practical use guidance for where the technology should be and should not be relied on.
Monitoring of chemical feed accuracy and product efficacy has been needed since the inception of industrial water treatment industry. Over the course of history, many techniques have been employed. For chemical feed rate testing, color (how orange is my chromate treated water?), added metal concentration (how much lithium or molybdenum am I measuring?), and more recently, fluorescent dye concentration (how much PTSA am I measuring?) have all been employed successfully. In the case of product efficacy evaluation, performance-based monitoring has been the primary tool used to distinguish between success and failure.
Knowledge Is Power, Right?
Performance-based testing can range from measurement of physical parameters, such as approach temperature, temperature deltas, flow rates, pressure differentials, and even visual inspection, to chemical parameters, such as delta phosphate, mass balance calculations, turbidity measurements, and many other factors. It has long been the desire of the industry to be able to accurately measure actual individual chemical levels in circulating waters as a proxy for real-time assessment of performance for mineral scale and corrosion control. Such measurement of scale and corrosion inhibitors can be achieved with existing techniques but with varying success. For instance, phosphate and polyphosphate mild steel inhibitors can be readily and accurately measured with simple colorimetric methods. On the other hand, measurement of phosphonates or polymers requires cumbersome techniques that yield limited accuracy. One method that can overcome these limitations is the use of fluorescent tags that are covalently bound to the scale or corrosion inhibitor molecule. This allows measurement of the molecule in situ based on the fluorescent characteristics of the tag. Polymers copolymerized with fluorescent monomers have been used in the water treatment industry for over 20 years. However, these polymers have not been available to the
We all know the phrase “Knowledge is Power.” This phrase can be traced back to Francis Bacon in Meditations Sacrae in 1597 (1). In 1817, Thomas Jefferson equated “knolege” to power, safety, and happiness in a letter penned to George Ticknor (2). An excerpt from the letter reads as follows: “…my hopes however are kept in check by the ordinary character of our state legislatures, the members of which do not generally possess information enough to percieve the important truths, that knolege is power, that knolege is safety, and that knolege is happiness. What does this have to do with industrial water treatment? More specifically, fluorescent-tagged polymers? This is particularly important to our industry if not uniquely important. Think about many of the icons in our industry, such as the late Dr. Art Freedman, Paul Puckorius, and Dr. Ben Boffardi, and also Tom Laronge and Rob Ferguson, among countless others. Their exceptionalism in our industry combined vast experience, superb technical skills, and a deep understanding of our subject matter. In my mind, this combination of experience, skills, and understanding equals knowledge or even “knolege” in 1817. It seems likely that the reader will agree with this overarching definition. However, what is the point other than to give credit to our friends in the industry to whom we owe gratitude? It is the author’s belief that things are changing. Better yet, things have already changed. Is knowledge power? Maybe, but we could also argue that knowledge is much less valuable or required in today’s world, where infinite information is available to everyone everywhere within fractions of a second. Those concepts that a few were able to experience, practice, and develop a deep understanding of over a career are now available in instantaneous bite-sized morsels for any of us to digest after a few thumb strokes on our iPhone.
“The use of fluorescent-tagged polymers absolutely provides additional information in applications and systems where the technology is employed.” 9
the ANALYST Volume 29 Number 1
What Are the Do’s and Don’ts Related to the Proper Use of Fluorescent-Tagged Polymers?
Maybe the ability to access, process, and use information is the new power in today’s information revolution. Maybe the power of knowledge and information are not mutually exclusive. These are certainly debatable concepts outside the scope of this article. In any case, it is hard to argue that information, or rather the use of information, has not taken a critical role in today’s world. This brings us back to the question of what this has to do with water treatment and tagged polymers. The author believes this is an important discussion that relates to the primary point of this article—the do’s and don’ts of the use of this technology. The use of fluorescent-tagged polymers absolutely provides additional information in applications and systems where the technology is employed. It may allow us to understand when there are system upsets, increases in polymer demand, contaminants that cause an increase in polymer consumption, interferences, and/or simply be a secondary way to trace treatment dosage. This is all information. Frankly, this is all information that might not have been accessible to most water treatment companies until now. Yet, like knowledge, misuse of information can be quite dangerous. Fluorescent-tagged polymer technology is not a substitute for the knowledge, experience, skills, or understanding that is required for good water treatment practices and field service. Fluorescent-tagged polymers are not the last piece of the puzzle that allows all water treatment to be conducted from the happy confines of our mobile devices. In the end, these polymers are a tool that can provide a substantial amount of additional information to the water treater. For this information to be useful, it must be combined with other information, such as water chemistry and mass balances, system operational information, formula dose rate, changes in water quality, cycles of concentration, biocide addition, and so on. You get the picture. So, while we may be able to argue the information has gained a tremendous amount of power in our current world, the author would argue that this information must be combined with knowledge for it to be useful in our water treatment applications. Personally, we would take a knowledgeable water treater with no access to tags or tracers over someone without such knowledge, or at a minimum, curiosity, which had all the technology and 10
continued
information that comes with it. Water treatment is still a service business. It is likely that ever-increasing technology simply puts an exclamation on that reality.
Two Important Viewpoints
Do utilize fluorescent-tagged polymers as an additional source of information to assist the water treater. Don’t consider this to be holy grail technology that decreases the need for service, knowledge, experience, or skills.
A Question to Consider So, I use PTSA. Why should I use fluorescent-tagged polymers? PTSA (1,3,6,8-pyrene tetrasulfonic acid tetrasodium salt) (see Figure 1) has been used successfully for many years to trace formulation concentrations in cooling and process water applications. Most typically and simplistically, PTSA can be added to a formulation at 0.1% on a dry basis such that a measurement of 100 ppb is equivalent to an overall formulation dosage of 100 ppm. The benefit of PTSA is that it is generally agnostic or unaffected by system events such as precipitation of mineral scales. This is demonstrated later in this article. For the water treater, the use of PTSA provides a means to track formulation dosage relative to measured PTSA in the analyzed water without having to be concerned with interferences or events disrupting measurement. There are a few exceptions, such as the presence of cationic biocides or coagulants/flocculants, high continuous residual halogenation, background fluorescence in the treated water, or excessive color or turbidity. However, for most applications, PTSA is a very useful and reliable proxy to determine overall formulation dosage.
“The benefit of PTSA is that it is generally agnostic or unaffected by system events such as precipitation of mineral scales.” the ANALYST Volume 29 Number 1
What Are the Do’s and Don’ts Related to the Proper Use of Fluorescent-Tagged Polymers?
continued
value to applying this technology is to have at least two fluorescent materials that excite and emit at distinctly different wavelengths. More preferably, one of the materials should be inert (let’s say agnostic to events like PTSA) and the other should be covalently bound to an active ingredient. It is logical to covalently attach the fluorescent molecule to polymers. The reason for this is their relative size. In simplistic terms, the primary polymers employed for scale control in water treatment applications range in molecular weight from about 500 Daltons (or atomic mass unit) for polymaleic acids to 20,000 Daltons for some acrylic acid copolymers.
Figure 1: PTSA (1,3,6,8-pyrene tetrasulfonic acid tetrasodium salt).
Fluorescent-tagged polymers, on the other hand, generally are not great proxies for overall formulation dosage measurement in most applications. The reason for this is that the tendency of the polymer is to adsorb onto solids in the recirculating water, thereby removing some portion of the polymer from solution and lessening the measurable quantity in the water. One might argue that you could feed the polymer until this demand for adsorption is exceeded and then measure “free” polymer from there on. This idea of chasing “free” polymer is troublesome in that by doing so, the water treater is overfeeding other chemicals in the formulation versus an intended dosage as well as only accounting for the solubility control functionality of the polymer. To this last point, measured polymer versus total functional polymer are two very different things. For instance, a water treater may feed 10 parts per million (ppm) of active polymer to a system, measure 6 ppm active in a water containing high total suspended solids (TSS) but still observe the dispersing functionality of the polymer via high turbidity readings. The concept of using a co-polymerizable PTSA derivative and eliminating the inert PTSA tracer was patented in 1999. However, this concept seems to be commercially abandoned by the inventing company for more effective napthalamide-based technology that can be used in conjunction with PTSA (3). It is important to recognize that both the use of inert fluorescent materials and covalently bound fluorescent moieties onto polymers is not a recent technology. In fact, the concept has been used commercially for around 30 years. It is also important to note that early in the development of the art, it was recognized that the real 11
A typical fluorescent monomer of the type discussed in this article can range from 250 to 350 atomic mass units (amu). In the case of a polymer that is 20,000 Daltons with one fluorescent moiety of 300 amu covalently bound, it would occupy 1.5% of the total polymer on a weight basis, which is likely low enough to not impede the base polymer efficacy. These calculations are for illustrative purposes. In practice, the fluorescent monomer is typically incorporated at lower levels such that it can be measured properly with available fluorometers. Further, we can consider that our typical tools in cooling water are phosphates/polyphosphates; phosphonates; azoles; transition metals such as molybdenum, zinc, and tin; and polymers. Phosphates, polyphosphates, and metals are directly measurable by simple techniques. Phosphonates, while “measurable,” require cumbersome field methods that would make them a great candidate for tagging. The issue comes back to size. HEDP (1-hydroxyethylidene-1, 1-diphosphonic acid) has a molecular weight of 206 amu while PBTC (2-phosphonobutane-1,2,4-tricarboxylic acid) has a molecular weight of 270 amu. It does not make sense to add a tag that is bigger than the base molecule. Similarly, tolyltriazole has a molecular weight of 155 amu. This leaves us with polymers as the best choice for tagging with these types of fluorescent compounds. The best practice using the current technology is that we have PTSA as an inert fluorescent tracer and covalently bound fluorescent-tagged polymers that can be measured independently. The overwhelming types of fluorescent monomer utilized are those derived from napthalamides. Figure 2 illustrates the core structure of the napthalamide monomer but not the entire molecule to protect trade secrets.
the ANALYST Volume 29 Number 1
What Are the Do’s and Don’ts Related to the Proper Use of Fluorescent-Tagged Polymers?
Now that we have two technologies that can be measured independently and without interference, we can develop a plan for why and how to use each. This will be the basis of how to effectively employ the technology (information) as a tool (benefit) to the water treater.
Figure 2: Napthalamide core structure.
Commercial probes and handhelds are now readily available to measure both the PTSA and tagged polymer where excitation and emission wavelengths are distinct such that both materials can be measured independently without one interfering with the other. Figure 3 shows the measurement of polymer at increasing concentrations with and without PTSA present. Figure 4 shows PTSA measurement with polymer concentrations of up to 50 ppm. In both cases, there is no observed interference between the two compounds or their measurement with commercially available equipment. Figure 3: Polymer with and without PTSA. 50 45
Tagged Polymer (pom)
40
30 25 20 15 10
The water treater observes that both PTSA and tagged polymer are reading high versus the designed control range, which indicates formulation over treatment.
5 0
5
10
15
20
25
30
35
40
45
50
Polymer Dosage (ppm) Tagged Polymer Reading w/o PTSA
Tagged Polymer Reading w/ PTSA
The water treater observes that both PTSA and tagged polymer are reading low versus the designed control range, which suggests formulation under treatment.
Figure 4: PTSA with polymer to 50 ppm active. 50
100
45
90
40
80
35
70
30
60
25
50
20
40
15
30
10
20
5
10
0
0
0
5
10
15
20
25
30
35
40
45
50
PTSA (ppb)
Readings With PTSA
Tagged Polymer (pom)
It seems likely that a lot of companies will tend to overcomplicate the use of the technology and subsequent information it yields. From the water treater’s point of view, the combination of use of the PTSA and tagged polymer can be simplified in Figure 5. In this illustration, we look at a typical treatment scenario where measured PTSA is listed on the x-axis along a spectrum of low-to-high versus the intended concentration. Similarly, the tagged polymer concentration is listed on the y-axis along a spectrum of low-to-high versus the intended concentration. The green circle illustrates an intended control rage for the two materials. It is important to remember that PTSA is an inert tracer that is agnostic to scaling events, and tagged polymer is an active ingredient that is readily adsorbed and diminished from measurement when an upset event occurs. Using this simplistic example, we can then conclude that there are five basic scenarios that will provide information to the water treater: The water treater observes both PTSA and tagged polymer within the designed control range, which indicates formulation is being fed properly and no significant events or changes are occurring.
35
0
continued
Polymer Dosage (ppm) Tagged Polymer
PTSA
12
The water treater observes normal-to-high readings for tagged polymer and low readings for PTSA, which shows there is an interference (i.e., cationic biocide) with the PTSA. The water treater observes normal-to-high readings for PTSA and low readings for tagged polymer, which implies there has been an event or upset that is consumptive of the tagged polymer. the ANALYST Volume 29 Number 1
Introducing BCP® 6010 – ‘Ready to Use’ Continuous Cleaning Chemistry
Celebrating its 25th year of innovation, AMSA, Inc. introduces
BCP 6010 ®
BCP® 6010 is Specifically Designed to: • • • •
Maintain a clean cooling water system with a continuous dosing product Readily integrates into an existing treatment program Use with continuous oxidizing biocide programs for improved biofouling control Enhance yellow metal corrosion inhibition
BCP® 6010 effectively maintains heat transfer surfaces & piping cleanliness
BCP® 6010 Minimizes: • Biofilm buildup • MIC (microbially influenced corrosion) & under-deposit corrosion • Development of hosting sites for Legionella • Accumulation of debris in cooling towers
Maximizes: • Biocide efficiency • Heat Transfer • Inhibitor chemical performance
Fouled heat exchangers
AMSA, Inc.® 4714 S. Garfield Rd. ® Auburn, Michigan 48611 Tel: (989) 662-0377 Fax: (989) 662-6461 sales@amsainc.com www.amsainc.com
Call us to learn how to use BCP® 6010.
What Are the Do’s and Don’ts Related to the Proper Use of Fluorescent-Tagged Polymers?
continued
“There is no one size fits all for dosage of polymers, phosphonates, phosphates, metals, or azoles. However, there are typical or normal ranges.”
Figure 5: Simplified decision-making model for treatment decisions.
The second way to approach the question is based on the limits of the equipment and commercial polymer chemistry. Commercial probes and handhelds are generally designed to measure between 0.0 to 20.0 active polymer at designed levels of fluorescent monomer incorporated at 0.25 mole % (4). As a quick note, 0.25 mole % means that if we have a polymer with 100 repeating units, only 0.25 of those repeating units (monomers) are the fluorescent monomer. This leads to concepts of discussion for another article, but it is important to understand the basic idea. Again, we can measure within instrument design 0.0 to 20.0 ppm active tagged polymer. Our findings (Table A and Figure 6) show very accurate measurements and repeatability from 3.0 ppm to 10 ppm active, whereas less accuracy is observed at 1 ppm active. We did not test for up to 20 ppm active in this study but have observed good results up to 20 ppm active in pilot testing.
Thoughts on PTSA and Tagged Polymer Usage
Here are two perspectives to consider when using PTSA and tagged polymers: Do use PTSA and tagged polymers measured at separate wavelengths in order to observe meaningful deltas that can assist in problem solving.
Table A: Tagged Polymer Measurement versus Concentration
Don’t overcomplicate.
Tagged Polymer Concentration (ppm)
How Much Tagged Polymer Do I Add?
Replicate
There are at least four ways to approach this question. The first and foremost is based on system water chemistry and operating conditions versus the expected dosage of polymer needed to function for its intended purpose. In this case, the water treater should rely on his or her own experience and/or consultation with the polymer supplier. There is no one size fits all for dosage of polymers, phosphonates, phosphates, metals, or azoles. However, there are typical or normal ranges. For polymers, this tends to be 5 to 10 ppm as active in cooling recirculating waters. In some applications, it can be slightly lower and in others, the dosage can be slightly to significantly higher.
14
1.0
3.0
5.0
10.0
1
1.7
3.3
5.0
10.2
2
1.6
3.3
5.0
10.3
3
1.6
3.1
5.0
10.2
4
1.6
3.2
5.2
10.1
5
1.6
3.0
4.9
10.1
6
1.0
3.0
5.2
10.2
7
1.1
3.0
5.3
10.1
8
1.0
3.0
5.2
10.2
Average
1.400
3.113
5.100
10.175
Variance
0.094
0.018
0.020
0.005
Standard deviation
0.307
0.136
0.141
0.071
the ANALYST Volume 29 Number 1
SUPPLIER OF THE YEAR
Private Label Blending Coast to Coast QualiChem offers nationwide blending for private label
No Direct Sales
products, supplied from our plants located in Salem, Virginia and Verdi, Nevada. We are now better positioned to provide
Precision Manufacturing
our customers with industry-recognized benefits and services coast to coast.
Formulatory Expertise
Just one more way we are demonstrating how…
Custom GHS-Compliant Labels and SDSs
The Blender Matters 800.296.9102 | www.qualichem.com AN ISO 9001:2015 COMPANY
Application Support
What Are the Do’s and Don’ts Related to the Proper Use of Fluorescent-Tagged Polymers?
Figure 6: Linearity of tagged polymer measurement versus concentration.
continued
The most important thing to remember is that you, as the water treater, have a tremendous trailing history of data with your formulations. You understand what and when formulations work and fail. Tagged polymers do not perform much differently from the ones you have used for decades; they are simply now more easily measurable (more information available). The point here is that it is important to start with tagged polymer dosages that are commensurate with application levels you have observed to be successful. Then, always use the polymers in conjunction with PTSA such that decision-informing deltas can be observed. From there, as you gather data (information), it can be used to optimize, explain observed events, and reveal or even predict failure points.
Treatment Monitoring
The next way to consider dosage is to feed until a steady state (stable concentration) of tagged polymer is observed. The idea here would be that this method would help determine in situ polymer demand in an application. This approach should be carefully considered. Most importantly, if this approach is employed where the tagged polymer is a part of an overall formulation, then adjusting dosage of polymer also leads to adjustment of dosage for all components in the formulation. In this case, deficits and excesses for all components will be observed during the process of titrating for the tagged polymer sweet spot. As examples, the water treater may use this method to determine minimum formulation dosage required for deposit control (formulation treatment costs optimization), threshold amounts to overcome contamination (cationic carryover, iron, turbidity/TSS), or demand in a cleaning application (dosage point of diminishing returns).
Points to consider:
Do use tagged polymers at concentrations established to be effective and within detection limits. Don’t use tagged polymers in the absence of PTSA or another inert tracer. Decision-informing deltas are important.
Demonstrative Pilot Testing
Pilot testing can be a valuable tool in the evaluation of water treatment additives. Figure 7 shows two identical pilot test systems used to evaluate tagged polymers. Data for each experiment was gathered using these best-in-class custom designed pilot systems. Both units share 200-liter (L) cation and a 200-L anion feed tanks that are used to feed synthetic water in to 31-L basins, configured with an overflow valve to maintain constant volume. Attached to each basin are two pumps. One pump circulates water from the unit through a heat exchanger that allows for temperature regulation of the circulating water. The other pump directs water through the unit for recirculation. Each system contains heat transfer surfaces that are composed of three 12-inch long 500-watt cartridge heaters. Each cartridge heater contains a thermocouple that is placed inside hollow stainless-steel tubes. The stainless-steel hollow tubes containing the cartridge heaters are housed in custom made 1-inch diameter glass tubes. Each individual rod is controlled by a power controller with custom program developed by a third-party developer, which provides
In each case, care should be taken, and monitoring of other chemical and physical indicators should be considered. Finally, one might use a tagged polymer much the way PTSA is used currently to trace dosage. This is generally not recommended since the tagged polymer is an active additive and the measurement of residual levels is subject to many contaminants and events that can cause a demand and diminish measured amounts.
16
the ANALYST Volume 29 Number 1
What Are the Do’s and Don’ts Related to the Proper Use of Fluorescent-Tagged Polymers?
continued
decreases and precipitation of calcium phosphate (decrease in stabilization observed via delta phosphate measurement) as well as the ability of the polymer to maintain functionality as a dispersant.
precise control of the power produced by each heater cartridge. The units each contain a typical water treatment control system, allowing for continual data logging of the conditions for the unit (pH, conductivity, PTSA/ tagged polymer, and temperature). Further data such as water chemistry, turbidity, and PTSA/tagged polymer is also measured via lab analysis.
In this evaluation, 10 ppm of active tagged polymer (AA/SA/FT) was added to water containing 200 ppm calcium (as calcium, 500 ppm as calcium carbonate) and 10 ppm orthophosphate. The system operated at pH 8.8 to 9.0 for the duration of the test, where bulk water temperature was maintained at 99 °F with an estimated skin temperature of at least 129 °F. The experiment was conducted over 10 days, where on day 9 an additional 5 ppm of orthophosphate was added to induce precipitation. Table B summarizes these conditions.
For the purposes of this article, we will focus on the basic functionality of the tagged polymer as an upset indicator. This is done using the pilot systems, where forced precipitation of calcium phosphate and, separately calcium carbonate, is initiated in the presence of the tagged polymer. In both cases, the tagged polymer is a copolymer of acrylic acid, 2-acrylamido-2methyl propane, and fluorescent tag (AA/SA/FT).
Table B: Calcium Phosphate Evaluation Conditions
Effect of Calcium Phosphate Precipitation
The evaluation of the interaction of in-situ calcium phosphate precipitation and tagged polymer is likely the best representation of how the technology functions. The reason for this is that we can observe not only tagged polymer levels but also readily see the correlation to delta phosphate and turbidity. In this case, by examining total phosphate and turbidity, we can observe polymer
Condition
Range
pH
8.8 to 9.0 at failure point
Temperature
99 °F
Estimated skin temperature
129 °F
Calcium
200 ppm (as Ca2+)
Baseline orthophosphate
10 ppm PO4
Orthophosphate spike to induce precipitation
5 ppm PO4
Treatment
10 ppm tagged polymer (as active)
Figure 7: Pilot cooling water test rigs.
17
the ANALYST Volume 29 Number 1
What Are the Do’s and Don’ts Related to the Proper Use of Fluorescent-Tagged Polymers?
continued
Figure 8 demonstrates effective control within operating parameters of conductivity, bulk water pH, measured bulk water temperature, and estimated skin temperature over the duration of the test. Figure 8: Pilot system operating conditions.
In Figure 9, we start to look at interesting data. The solid yellow line shows total phosphate (unfiltered), while the dotted yellow line shows filtered phosphate (PO4) (0.45 micron) and the brown line shows turbidity. We can observe from the data that the tagged polymer is properly stabilizing the initial 10 ppm of PO4 for the first 6.8 days of the test. This conclusion is drawn since there is no significant delta (difference between total unfiltered and filtered PO4) measured. Between day 6.8 and 8.0, we begin to observe a delta PO4 of about 2 ppm, which is somewhat normal. Companies tend to like to see deltas of less than 2 ppm in stabilized phosphate programs. Some companies prefer to see <1 ppm deltas for phosphate. In this case, and importantly, the polymer is still maintaining functionality. While it is stabilizing (controlling solubility) about 8 ppm PO4, the total PO4 (soluble + dispersed) continues to be at intended levels of about 10 ppm. It is also important to observe the bulk water turbidity levels increase through this duration.
A
continuing to function strongly to disperse solids. Finally, with the data shown in Figure 9 and PTSA values shown in Figure 10, it is highly important to recognize that the water treater has the basic information needed to assess system operating conditions. Stated differently, the data for PTSA shows that formulation dosages are correct and consistent at 100 parts per billion (ppb), and the delta phosphate shows that there has been a precipitation event (loss of PO4 solubility) and shows the tagged polymer is dispersing the total phosphate effectively. Similarly, the turbidity increases indicate both an event that introduced suspended solids into the system as well as efficacy of the polymeric dispersant. What is the point here? Well, kind of an odd one from a small company that has invested a significant amount into the development of tagged polymers and trying to promote (sell) them. The honest point here is that the tagged-polymer technology is nice to have, provides significant information (as will be observed in Figure 10), and are great tools but are not necessary for the water treater to do his or her job. Further, the author would make the strong comment that tagged polymers should always be used in conjunction with water chemistry data and mass balance data to make judgments regarding assessment and treatment changes.
B
At day 9.8, an additional 5 ppm of PO4 was added to the system to induce further precipitation. At this point, we can see the stabilized phosphate (filtered) drop to about 2 ppm, while total phosphate and turbidity increase. While a significant precipitation event was induced and observed, it is important to note that the rise in total phosphate and turbidity show that the tagged polymer is
“While a significant precipitation event was induced and observed, it is important to note that the rise in total phosphate and turbidity show that the tagged polymer is continuing to function strongly to disperse solids.” 18
the ANALYST Volume 29 Number 1
Featured Product SEKO AKL Pump
• PVDF Liquid End with 1 piece molded PTFE diaphragm offers superior chemical compatibility. • Installation flexibility with wall and surface mount brackets included. • Liquid End, controls and wiring on the same end of the pump simplifies operation. • 100:1 Turndown • On/Off Switch
INC
9001 Hanslik Ct. Naperville, IL 60564 | Tel: 630-355-3330 | info@quantrol.net | www.quantrol.com
What Are the Do’s and Don’ts Related to the Proper Use of Fluorescent-Tagged Polymers?
continued
Figure 9: Delta phosphate and turbidity data.
Figure 10: PTSA versus tagged polymer measurements.
Now for the fun part. Figure 10 shows PTSA (green line, ppb, secondary y-axis) and tagged polymer (red line, ppm, primary y-axis) over the duration of the pilot experiment. We can go back to an earlier “don’t” and not overcomplicate this one. The data show that PTSA presents consistent readings of about 100 ppb throughout the duration of the experiment. Alternatively, we can clearly observe that the tagged polymer decreases dramatically to coincide with the precipitation of calcium phosphate. The bottom line here is that PTSA is agnostic to the precipitation of calcium phosphate, and the tagged polymer is responsive to the precipitation. More importantly, the delta between PTSA and the tagged polymer is a strong indicator of the event.
of water chemistry measurements along with tagged polymer provides a strong case that some sort of event occurred. When combined with the total phosphate data and PTSA measurements, a clear picture emerges that allows the water treater to conclude the following:
Lastly, Figure 11 brings the performance data together by showing how the tagged-polymer readings track filtered phosphate and turbidity. This combination
The polymer continues to function as a dispersant based on total PO4 and turbidity measurements.
20
Intended formulation dosage is correct based on 100 ppb measurements. A consumptive event for polymer has occurred based on delta PTSA-tagged polymer. Precipitation of calcium phosphate has occurred based on delta PO4 measurements.
the ANALYST Volume 29 Number 1
What Are the Do’s and Don’ts Related to the Proper Use of Fluorescent-Tagged Polymers?
continued
Figure 11: Tagged polymer versus filtered phosphate and turbidity.
Effect of Calcium Carbonate Under High Calcite Saturation Conditions
Using the pilot cooling system, an experiment was conducted to determine the mutual effects of tagged polymer and PTSA during an upset condition for calcium carbonate. In this evaluation, a synthetic water was cycled to a failure point over about 128 hours where calcium carbonate precipitation was observed. Table C shows the measured and calculated conditions at the failure point. The system was treated with 10 ppm tagged polymer + 5 ppm PBTC (both as active). At failure, the operating conditions included a pH of ~ 8.9, bulk water temperature of 90 °F, and an estimated skin temperature of 139 °F. Calcium concentration was measured at 193 ppm as Ca 2+ (482 ppm as CaCO3), and total alkalinity was titrated to be 548.5 ppm as CaCO3. Using computer modeling software, a calculated Langelier Saturation Index (LSI) of 2.94 and calcite saturation index of 242.6X were estimated. Table C: Pilot Calcium Carbonate Operating Conditions at Failure Point Condition
Range
pH
8.8–9.0
Temperature
90 °F
Estimated skin temperature
139 °F
Calcium
193 ppm (as Ca2+)
Total alkalinity
548.5 (as CaCO2)
Calculated LSI/calcite saturation
2.94/242.6X
Treatment
10 ppm Tagged Polymer + 5 ppm PBTC (both as active)
21
Figure 12 shows the data for tagged-polymer readings, calcium (as Ca 2+), and total alkalinity (as CaCO3). The observations here are like that of the calcium phosphate precipitation study in that we can see a decrease of tagged polymer as calcium carbonate precipitation is measured. However, one primary difference can be observed where the concentration of tagged polymer begins to decrease prior to water chemistry measurements. Potentially, the explanation for this is that the tagged polymer is a more sensitive indicator of calcium carbonate, where adsorption onto the nucleating calcium carbonate crystals is showing early polymer consumption/demand. We can certainly observe similar phenomenon in lab induction time experiments when more sensitive measurements, such as quartz crystal microbalances, are compared with water chemistry changes and turbidity increases. In these experiments, changes in the quartz crystal vibration frequency can be observed well before water chemistry changes or turbidity measurements. More work is being conducted to determine if the tagged polymer is a means to observe early onset of calcium carbonate precipitation and will be reported in future publications. In any case, we can certainly see the loss of measured polymer from 10 ppm to about 4 ppm (as active) as precipitation of calcium carbonate occurred. Figure 13 shows that PTSA is again agnostic to the precipitation as well as an increase in turbidity, which is a good sign of the tagged polymer maintaining its dispersion properties during the precipitation event.
the ANALYST Volume 29 Number 1
What Are the Do’s and Don’ts Related to the Proper Use of Fluorescent-Tagged Polymers?
continued
Figure 12: Tagged polymer versus calcium and alkalinity.
Figure 13: PTSA, tagged polymer, and turbidity.
Closing Thoughts
Summary
In closing, here are the two last guidelines:
We started this article with a look at the power of knowledge versus information. Historically, knowledge in our industry has created great power and advantage. While it is possible that society may be shifting this balance in favor of readily available information, it will be critically important to couple the information gained from tagged polymers with experience and knowledge to provide skilled use of the technology. Tagged-polymer data in combination with PTSA, water chemistry, mass balances, and experience will make this a powerful tool for the water treater.
Do (must follow) utilize fluorescent-tagged polymer data in combination with water chemistry, mass balances, and experience to make informed diagnosis and treatment decisions. Don’t forget the basics.
22
the ANALYST Volume 29 Number 1
What Are the Do’s and Don’ts Related to the Proper Use of Fluorescent-Tagged Polymers?
References
1. Bartlett, J. (1919). Familiar Quotations, 10th ed., p. 168, Little, Brown and Co., Boston, Massachusetts. The entry for this quotation is available online at www.bartleby.com. 2. Jefferson to Ticknor (Nov. 25, 1817). In PTJ:RS, 12:204, transcription available at Jefferson Quotes & Family Letters, accessible at https://www. monticello.org/site/research-and-collections/knowledge-power-quotation.
3. Moriarty, B.E.; Wei, M.; Hoots, J.E.; Workman, D.P.; Rasimas, J.P. (Nov. 6, 2001). “Fluorescent Monomers and Polymers Containing same for Use in Industrial Water Systems,” U.S. Patent No. 6,312,644 B1, United States Patent Office, Washington, D.C.
4. Pyxis (n.d.). “ST-588 Dual-Channel Inline Probe for Fluorescent Polymer and PTSA,” Pyxis Lab, Lafayette, Colorado, accessible at https:// pyxis-lab.com/product/st-588-tagged-polymer-ptsa-inline-sensor/.
continued
Michael L. Standish is founder of Radical Polymers, LLC, a business designed to specifically develop and provide technologies to the independent water treatment community. He has 35 years of experience in water treatment additive design, development, and evaluation. Prior to forming Radical Polymers, Mr. Standish served as senior business manager for International Specialty Products and Global Business Manager for National Starch's Alco Chemical business. He has served on the board of directors of AWT and holds a B.S. in chemistry and an MBA from the University of Tennessee at Chattanooga. Mr. Standish can be contacted at mike. standish@radicalpolymers.com. This paper was presented at AWT’s 2021 Annual Convention & Exposition, which was conducted September 22–25, 2021, in Providence, Rhode Island.
SANIKILL and SaniWare Treatment and control The patented SANIKILL technology now combined with SaniWare water quality monitoring panels! Expand your OPPORTUNITIES! Visit www.sanipur.com - sales@sanipur.com - 484-351-8702
23
the ANALYST Volume 29 Number 1
Part 2: What Are the Internal Treatment Programs Used Within Steam Generators? Edward Beardwood, BC&T Inc. (Editor’s note: This article is the second in a series. Part 1: “What Are Important Chemical and Pretreatment Programs for Industrial, Commercial, and Institutional Steam Generators?” appeared in the Fall 2021 Analyst.)
24
the ANALYST Volume 29 Number 1
Introduction
6. Residual Phosphate + Polymer; precipitating, crystal modification, and dispersing program.
Part 1 of this article series examined high-, medium-, and low-pressure boilers and differences in the waterquality requirements between each type of boiler. The first article examined steam purity and steam generation system corrosion control.
7.
Topics addressed in Part 1 included:
8. Chelant; solubilizing/stoichiometric chelant program.
Steam purity
9.
External pretreatment Steam condensate systems Feedwater/economizer systems In this article, we examine internal chemical treatment programs that are available. Some programs we will look at include all-volatile treatments, oxygenated treatment, caustic treatment, phosphates, polymers, chelants, and carbonate + polymers. There are a number of internal chemical treatment programs available for use in the control of corrosion and deposition within steam-generating equipment. A common aspect of all these programs is the need for pH, alkalinity, silica, iron, and hardness control in the boiling waters. These programs can be described as follows: 1. All Volatile Treatment Reducing (AVT – R). 2. All Volatile Treatment Oxidizing (AVT – O). 3. Oxygenated Treatment (OT). 4. Caustic Treatment (CT).
Coordinated Phosphate Treatment (CoPT).
b. Equilibrium Phosphate Treatment (EPT; modification of CoPT). c.
Chelant + Polymer; solubilizing/chelant, crystal modification, and dispersing program.
10. Chelant + Polymer + Phosphate; solubilizing/ sub-stoichiometric chelant , crystal modification, sequestration, threshold inhibition, and dispersing and precipitating program, Engineered Competition. 11. Carbonate + Polymer; precipitating, crystal modification, and dispersing program. The first five programs were designed for high-pressure steam generators (greater than 900 psig) that have high purity makeup water in use. These units are susceptible to acid or alkaline internal corrosion (see Table A in Part 1). These programs are also applicable to medium and lower pressure steam generators that utilize high-purity water. For example, lower-pressure boilers are frequently operated with feedwater that is suitable for use in higher-pressure boilers. In such cases, the boiler water chemistry targets should be based on the pressure range that is most consistent with the feedwater chemistry. For example, if a boiler operated at 150 pounds per square inch gauge (psig) uses feedwater of suitable quality (specific conductance ≤ 1 microsiemens per centimeter (µS/cm) for use in a 1,001 to 1,500-psig boiler, then the boiler water targets and chemical treatment program should be based on the higher-pressure guidelines. This practice is necessary to ensure proper blowdown and to avoid extremely high concentrations of trace
5. Phosphate Treatment (PT) subdivided into: a.
All-Polymer; lots of polymer, crystal modification, sequestration (weak chelation), threshold inhibition, and dispersing program.
Congruent Phosphate Treatment (CPT; modification of CoPT). 25
“These programs are also applicable to medium and lower pressure steam generators that utilize high-purity water.” the ANALYST Volume 29 Number 1
Part 2: What Are the Internal Treatment Programs Used Within Steam Generators?
contaminants and impurities leading to the formation of deposits within the boiler. Synthetic high performance polymeric dispersants (HPPD) can be added to enhance deposit control under upset conditions with the PT programs for 900 to 1,200 psig range and lowering the cycles to 25 to 50. Care must be exercised from 1,200 to 1,500 psig applications (consult the supplier for thermal degradation data). High-pressure waste heat boilers (1,000 to 1,800 psig) with superheated steam and condensing turbines such as transfer line heat exchangers (TLE’s) as found in methanol, ammonia, and ethylene plants have variable designs and heat flux. While AVT programs are not well suited for industrial applications, they do find a fit here with these units if they suffer from poor circulation. Typically, a VOS passivator and monoethanolamine (MEA) amine blended with another high distribution ratioed neutralizing amine are used. Should there be low heat flux or good circulation, then CPT or EPT are applied at 1 to 2.5 milligrams per liter (mg/L) phosphate at the high-end pressure and 3 to 5 mg/L at the low-end pressure, hydroxide alkalinity to not exceed 1 mg/L as sodium hydroxide (NaOH) and a boiler-specific conductivity of less than 50 µS/cm (1). The remaining six programs are for low- and medium-pressure steam generators that are susceptible to hardness and metallics deposition and feedwater impurity upsets (see Table A in Part 1). They may utilize one of the three categories of low-purity makeup waters (see Table C in Part 1). From the standpoint of deposition control, these systems will have to contend with hardness of varying amounts in the boiler feedwater. This is typically handled by forced precipitation, dispersion and blowdown, as well as limiting the feedwater cycles of concentration in the boiler water (2). These steam generators will use phosphates, anionic low-molecular weight polymers, hydroxide alkalinity and often sequestration and chelating agents to control internal deposition. The phosphate is chosen because of its very low solubility associated with hardness. Chelant, chelant + polymer, and all-polymer programs are not well suited to handle high feedwater impurity loading (use cost issue) or highly variable loadings (operational control and testing issues).
Internal Boiler Corrosion
The higher purity waters are noted in Table C. Key types E through G, when used as the makeup source as “High Purity” for 1,000 to 1,500 psig operations and “ultrapure
continued
water” for 1,500 psig and greater operations, are susceptible to internal corrosion brought on by boiler water chemical balance alone. Therefore, corrosion control may need to be addressed, depending upon the makeup water purity, steam operating pressure, and the presence of porous deposits within the steam generator. It is well known that high-purity waters operating above 900 psig have a tendency to be acidic (i.e., ratio of anions > cations) or alkaline (i.e., ratio of cations > anions) and can concentrate below porous deposits (i.e., wick boiling). Based upon the corrosion half-cell reactions, both acidic and caustic attack will result in hydrogen production. This increases the potential for hydrogen damage of the heat transfer surfaces, leading to tube failures. At lower pressures, similar failures have been incurred when upgrading the makeup water pretreatment from softened to demineralized (3). Under these conditions, the American Society of Mechanical Engineers (ASME) recommends coordinated or congruent phosphate with or without a trace of hydroxide alkalinity up to 600 psig. Above 600 psig, no free caustic to be present. That is, the program limits are designed to be consistent with operating in the 1,000 to 1,500 psig range. The use of AVT should be cautioned, because in industrial applications water quality upsets can occur with the pretreatment or process in-leakage into the condensate. Sodium balancing of the chlorides (i.e., 54 micrograms per liter [µg/L] sodium as Na per 1 µS/cm of cation conductivity) may also be required at higher boiler water concentrations (4). AVT programs require very high purity water and are not as forgiving as phosphate programs are during upsets. A partial list of events that have been associated with pH upsets and subsequent internal corrosion of steam generators are as follows: Ion leakage from ion exchange (IX) equipment due to an over run. Poor regenerant dosing, late introduction, short contact time or lower regenerant strength leading to ion leakage. Failure of the regeneration cycle leading to regenerant to enter into the feedwater system or attemperation water supply.
26
the ANALYST Volume 29 Number 1
Part 2: What Are the Internal Treatment Programs Used Within Steam Generators?
Ion leakage or sodium dumps from condensate polishers.
continued
“Phosphate concentrations have a better buffering capacity to absorb the water-quality swings than organic amines.”
Process in-leakage of organic or inorganic materials into the condensate. Condenser cooling water in-leakage into the condensate, increasing the boiler water loading of sodium, calcium. magnesium, chloride, sulfate, and silica.
(TSP) and 0 to 1.0 mg/L NaOH, while at 2,500 psig the phosphate was maintained at 0.2 to 1.5 mg/L as PO4 and the sodium hydroxide range remained the same. The phosphate given as a range and the user was to run a boiler water phosphate equilibrium test on each individual boiler to determine the upper concentration limit in which resulted in hideout. A control set point of 80 to 90% of hideout concentration would then be used.
Over cycling the feedwater, leading to higher boiler water conductivities in which the anion-cation balance effects the existing boiler water chemistry buffering capacity. These upsets and chemistry balance can only be handled by blowdown and/or the use of a buffering alkali. The source of solid or inorganic alkali, is phosphate, and the organic source is typically monoethanolamine. Phosphate concentrations have a better buffering capacity to absorb the water-quality swings than organic amines. PTs are used where high-pressure steam generation systems are prone to upsets. These internal treatment programs have been used for more than 80 years and comprise about 50% of all the applications.
The specifications for the various internal corrosion control chemical water treatment program regimes are illustrated in Table A (6). Oxygenated treatments and AVT-type programs are typically avoided due to the high degree of variability in the purity of the condensate and water streams found in the steam-generating systems and the labor associated with their maintenance in industrial applications. The steam purity guidelines for these programs that are associated with condensing turbines with reheat (without reheat double the limit values) can be found in Table B (6). When wanting to check water quality standards for a specific boiler, first contact the equipment manufacturer for specific steam purity guidelines.
As noted in Reference 5: “PT has evolved over the years from ‘Coordinated Phosphate Treatment’ (CoPT; Na:PO4 of 2.3 to 2.8 :1), which was introduced in 1942. It was then modified to ‘Congruent Phosphate Treatment’ (CPT; Na:PO4 of 2.2 to 2.6 :1) to address issues thought to be caustic gouging. However, this then led to phosphate ‘hideout’ and acid phosphate corrosion. Equilibrium Phosphate Treatment (EPT; Na:PO4 of 3:1 plus up to 1 part per million [ppm] of NaOH as NaOH) was developed by Jan Stodola of Ontario Hydro in the 1980s” (5).
The selection process for these programs is illustrated in Figure 1 (7). Remember, phosphate residuals and the upper limit are based upon the avoidance of hideout. This requires that each site and each steam generator have an equilibrium phosphate test performed to establish the upper limit. As a rule of thumb, start with phosphate residuals of ≤ 12 mg/L as PO4 for operating pressures ≥ 1,000 psig. At phosphate residuals of 4 mg/L as PO4 and less, a calculated corrected pH value must be performed to remove the contributions from ammonia or organic amines in order to establish the actual sodium-to-phosphate molar ratio (8, 9). Table C may assist in a starting range operational phosphate residual, to then be verified by equilibrium phosphate testing.
This was then followed by the Electric Power Research Institute’s (EPRI) introduction of the phosphate continuum (PC), using Stodola’s approach and varying the phosphate concentration of decreasing with increasing operating pressure. The EPRI PC approach for 1,500 psig was to maintain 0.2 to 3.6 mg/L as PO4 from trisodium phosphate 27
the ANALYST Volume 29 Number 1
Part 2: What Are the Internal Treatment Programs Used Within Steam Generators?
continued
Table A: Specifications for Various High-Pressure Treatment Regimes Dissolved Oxygen (µg/L)
ORP (mV)
Treatment Regime
pH2
Cation Conductivity (µS/cm)
Oxygenated treatment (1) - Once through - Drum boiler
8–8.5 9–9.5
< 0.15 < 0.15
30–150 30–50
+100 +150 +100
All-volatile treatment (1) -Oxygenated -Reducing
9.2–9.6 9.2–9.6
<0.2 <0.2
<10 <5(2)
0 to +50 -300 to -350
Caustic treatment
9.2–9.6
<0.2
<5(2)
-300 to -350
0.4 to 2.4 mg/L NaOH, typically 1 to 1.5 mg/L NaOH. minimum NaOH = 2.5 x Cl mg/L
Equilibrium phosphate
9.2–9.6
<0.2
<5(2)
-300 to -350
Na:PO4 = 3:1 to 3:1 + 1 mg/L NaOH (3.44:1), 0.2 to 2.4 mg/L PO4, pH 9.3 to 9.7 in the boiler water.
Phosphate treatment (PT)
9.2–9.6
<0.3
<5(2)
-300 to -350
> Na:PO4 = 2.8 to 3:1 to 3:1 + 1 mg/L Na OH. 3 to 10 mg/L PO4, pH 9.2 to 10 in the boiler water.
Comments Boiler water pH will be about 9.0
Boiler water pH level will be about 9.0
Congruent phosphate (CPT)
> Na:PO4 = 2.6–2.8 (2.2–2.8):1, 3-15 mg/L PO4, pH 9.2–9.7 in the boiler water.
Coordinated phosphate (CoPT)
> Na:PO4 = 2.3–2.8:1, 10-20 mg/L PO4, pH 9.2– 10 in the boiler water.
Notes: 1. Must have full-flow condensate polishing. 2. Values are for all ferrous metallurgy. For mixed metallurgy, the pH range is 8.8 – 9.3 (9.0 – 9.3) under reducing conditions; -300 to -350 mV ORP. 3. Ammonia will be present if used or organic amines, hydrazine substitutes in use. It may vary from 0.1, 0.3, 0.5, 1.0, 2.0, 3.0 mg/L, depending on CO2 presence or degree of thermal degradation. 4. All treatment regimes for drum boilers are designed to provide a boiler water pH of 9-10 @25ºC.
Table B: Steam Purity Guidelines for Condensing Turbines With Reheat (at Various High-Pressure Treatment Regimes) Treatment Regime
Cation Conductivity (µS/cm)
Sodium (µg/L as Na)
Silica (µg/L as SiO2)
Chloride (µg/L as CI)
Sulfate (µg/L as SO4)
Once through
≤ 0.15
≤2
≤ 10
≤2
≤2
All volatile
≤ 0.2
≤2
≤ 10
≤2
≤2
Oxygenated treatment
≤ 0.15
≤2
≤ 10
≤2
≤2
Caustic treatment
≤ 0.15
≤2
≤ 10
≤2
≤2
Equilibrium phosphate low
≤ 0.15
≤2
≤ 10
≤2
≤2
Phosphate treatment (PT) (coordinated, congruent) high
≤ 0.3
≤5
≤ 10
≤2
≤2
Table C: Typical Phosphate Residual Control Ranges Operating Pressure (psia)
PO4 Range (mg/L)
Makeup Water Quality
2,401–2,850
02.–1.5 + 1 mg/L NaOH (evaluate)
Demineralized (ultra-high purity)
1,801–2,400
0.2–3.6 + 1 mg/L NaOH
Demineralized (ultra-high purity)
1,201–1,800
3.5–5.0
Demineralized
901–1,200
5.0–7.0
Demineralized
601–900
7.0–10.0
Softened (+Dealkalized)
401–600
10.0–15.0
Softened (+Dealkalized)
28
the ANALYST Volume 29 Number 1
Part 2: What Are the Internal Treatment Programs Used Within Steam Generators?
continued
Figure 1: High-purity, high-pressure internal chemical treatment selection.
Internal Boiler Deposition
Regardless of the purity of the makeup water in use, industrial-commercial/institutional steam-generating systems will suffer from feedwater quality upsets. The upsets are typically due to contaminant ingression from the condensate returned, the pretreated makeup water, and / or corrosion products from an area in the steam condensate system that is cyclically operated. Whether low or high-purity makeup water are in use, the upset will require increased blowdown and chemical feed. The former removes conditioned impurities as well as lowering the feedwater cycles of concentration in the boiler. The later necessitates an increase in chemical feed to hold the targeted residuals as they are being consumed by the contamination and not cycling up to the target value because of blowdown dilution. The upper limit of allowable feedwater cycles of concentration in the ASME guidelines is 100 (1% blowdown) for industrial boilers.
29
These high cycles of concentration are most applicable for boilers with high-purity feedwater. When operating near the feedwater contaminant targets, much lower cycles of concentration are recommended for proper control. For example, if operating near the feedwater hardness and iron targets (<0.5 mg/L as CaCO3 and ≤0.10 mg/L as Fe, respectively) for a ≤ 300 psig boiler, cycles of concentration of 10 to 20 (5 to 10% blowdown) would be more appropriate, which would limit maximum boiler water hardness and iron levels during a contamination event to < 5 to 10 mg/L as CaCO3 and ≤ 1 to 2 mg/L as Fe of iron, respectively. The deposit-control additives, such as dispersants, chelants, phosphates, and alkali will need topping up during these periods and will require either chemical feed pump adjustments in stroke and frequency or a larger capacity pump. The amount of scale formation can be minimized by the following mechanisms under alkaline conditions:
the ANALYST Volume 29 Number 1
Part 2: What Are the Internal Treatment Programs Used Within Steam Generators?
continued
Table D: Typical Precipitated Impurities in Boiler Water Compound
Formula
mg/L Combining Ratios Ca
Mg
PO4
OH
SiO2
Hydroxyapatite
3 Ca3 (PO4)2•Ca (OH)2
1
-
1.58
0.85
-
Tricalcium Phosphate
Ca3 (PO4)2
1
-
1.58
-
-
Munsonite
Mg3 (PO4)2∙Mg (OH)2
-
1
2.61
1.4
-
Brucite
Mg (OH)2
-
1
-
1.4
-
Serpentine
2MgSiO3∙Mg(OH)2∙H2O
-
1
-
1.4
3.13
Note: 1 mg/L OH as OH = 2.35 mg/L as NaOH = 2.94 mg/L as CaCO 3
Although it is not seen in the boiler water wet analysis, it can be determined by mass and ion balance calculations as reduced recoveries.
Chelation or sequestration. Crystal modification. Threshold inhibition. Dispersion. Precipitation.
Of the various programs available for these medium- and low-pressure boilers, Programs 6 through to 10 are still in use. Program 11, the carbonate cycle, which generates carbon dioxide and acidic condensate, has been replaced by the phosphate precipitation cycle. Discussions associated with the application and control of these programs will be provided, as well as a summary table containing data and combining rates to ensure performance is achieved during normal and upset operations. In the interest of producing precipitates that are less adherent, tricalcium phosphate, magnesium phosphate, magnesium, and calcium silicates are avoided by the presence and co-precipitation of excess hydroxyl ions maintained in the boiler water. This procedure results in precipitates that are less adherent, more hydrated (fluid; hydrogen bonding), and higher in anionicity for improved dispersion and thermophoresis and enhancement of reactive silica solubility. Phosphate is chosen because of the low solubility associated with hardness salts. Table D provides the hydroxyl consumption of the precipitation reactions. When operating the boiler, have enough excess hydroxide alkalinity to satisfy the solubility of silica (i.e., 2.5 to 3.0 times hydroxide to silica) to that present in the boiler water. Maintaining the minimum range of excess hydroxide alkalinity for the type of internal chemical treatment in use (see Table E) helps to also satisfy the demand from the other impurities, as noted in Table D.
With a solubility trend of increasing silica content in waters by the conversion of silica to silicates in boiling water at and above pH 10.0, these reactive silicate species can form adherent, porous complex metal silicate deposits. These co-deposit with metal oxide deposits, retard heat transfer, and enhance the potential for wick boiling and underdeposit corrosion (UDC). The deposits are formed as calcium, magnesium, iron, and aluminum-based silicates and must be avoided. This is achieved by ensuring that hydroxyapatite (3Ca3(PO4)2Ca(OH)2) precipitates are formed from calcium, hydroxide, and phosphate, and serpentine (2MgSiO3Mg(OH)2H2O) is formed from the presence of brucite (Mg(OH)2). Both these precipitates are highly hydrated, and the double diffuse layer (DDL) has a high degree of negative outer charge. These characteristics aid in dispersion, non-adhesion, non-stick colloidal precipitates that also respond well to thermophoresis (i.e., hot surface charges are negative as is the colloid surface charge; hence, repulsion versus adhesion). To avoid the production of metalbased silicates, magnesium and pH levels may be raised, increasing the concentration of brucite, which drags out the silicate by adsorption to form serpentine, reducing the production of the other metal (i.e., Ca, Mg, Fe, Al) silicates. Where the potential exists for the deposition of complex silicates, water treatment providers operate the boiler water hydroxide alkalinity at 150 to 160 mg/L as CaCO3 minimum. This corresponds to a pH of about 11.5, which optimizes the production of magnesium hydroxide precipitates.
30
the ANALYST Volume 29 Number 1
Part 2: What Are the Internal Treatment Programs Used Within Steam Generators?
continued
the operating excess phosphate range to 5 to 20 mg/L or 7 to 15 mg/L avoids such conditions and results in cleaner heat transfer surfaces as well as faster implementation of corrective actions to the hardness upset.
Metal-based compounds such as iron as iron hydroxide, iron oxyhydroxide (basic iron oxide), hematite, and magnetite in the presence of hydroxide alkalinity are conditioned to hydrate fully. Further to this, the formation of gamma iron oxides (i.e., face-centered cubic structure [fcc]) enhances dispersion, which is enhanced by hydroxyl and phosphate ions (10, 11).
Utilizing higher purity water for makeup at lower operating pressures (i.e., < 900 psig) can have the potential for alkaline corrosion if porous deposits are present within the steam generator. To reduce this potential, the free hydroxide alkalinity concentration should be reduced or eliminated. Table E provides alkalinity requirements for the various internal chemical treatment regimes.
Operating precipitating programs with high phosphate residuals for lower pressures can be problematic, as this results in higher hydroxide requirements and the potential to not detect low-level hardness ingress. Lowering
Table E: Alkalinity Requirements for Industrial Boilers as a Function of Treatment Program1
Internal Treatment Description
Operating Pressure (psig)
Makeup Water Purity
Treatment Dosage in Boiler Water (active mg/L)
Minimum Excess (Free Hydroxide Alkalinity2, mg/L as CaCO3)
Coordinated Phosphate
900–2,000
Ultrapure
1–10 PO4 or the level needed to avoid hideout
NONE
Congruent Phosphate Molar Ratio of 2.85:1
100–900
High3
7–15
NONE
Coordinated Phosphate Molar Ratio 2.2 to 3.0
100–900
High3
7–15
NONE
Residual Phosphate7,8
100–900
Low4 / High3
7–15
7–15
Residual Phosphate + Polymer7,8,9,10
100–900
Low4/High3
7–15 + 3 to 10 active polymer
5–25
All Polymer
3
100–600
Low /High
5–25 active polymer
5–25
Chelant Only 10
100–900
Low4/High3
3–15 chelant
40–60
Chelant Polymer 9,10,11
100–900
Low4/High3
2–15 chelant + 2–15 polymer
25–50
Chelant Phosphate7,8,11
100–900
Low4/High3
2–12 chelant + 1–10 PO4
12.5–50
Chelant Polymer Phosphate7,8,9,10,11
100–900
Low4/High3
2–5 chelant + 2.5–15 active polymer + 5–15 PO4
40–60
Carbonate Polymer 9,10
5–150
Low4
Excess Carbonate Alkalinity > 35 (i.e., [CO3] = 2 P alkalinity) + 5–25 active polymer
60–120
8,9
4
3
Notes: Maximum iron and hardness values in the boiler water are recommended for use under upset conditions only. Generally, half the maximum concentration is allowed under normal operating conditions. Chemical dosage ratios (part per part) shown in these table notes are weight ratios, not mole ratios. The practical active polymer use range is 2 to 100 mg/L, where 10 to 50 mg/L is commonly used, depending on the contaminant concentration present. 1. Internal treatment success requires that the feedwater (FW) be deaerated and maintained at a minimum pH of 9.0, and 25 to 100 ppb residual reducing agent be present at the economizer outlet. 2. Optimized brucite formation at 160 mg/L as CaCO3 hydroxide alkalinity. 3. Calculation for high-purity dosage is based upon 50 to 100 ppb iron as Fe in the FW at 50 cycles within the boiler. 4. Calculation for low-purity dosage is based on 50 to 250 ppb hardness as CaCO3 in the FW at 30 cycles within the boiler. 5. OT (oxygenated treatment) and AVT(O) are not recommended for industrial boiler systems. 6. Ammonia use for AVT is not recommended, and AVT applications are cautioned. 7. Active polymer to phosphate application weight ratios are 0.5 to 1 part to 1 part; 0.5 to 1:1. 8. Hydroxide to phosphate weight ratios range from, 1:1 to 5:1 to 10:1 to 30:1 for pressure ranges from 900 psig down to less than 300 psig. 9. Typical polymer weight ratio amount to be used is 2 to 4 parts polymer per part of [Ca+Mg+Fe]; Molecular Weight range of 5,00020,000. 10. Typical hydroxide to active polymer application weight ratios are similar to hydroxide to phosphate ratios ranges. 11. Chelant actives are that amount fed for the impurities. The calculated or measured excess fed or maintained should not exceed 2 to 2.5 mg/L in the boiler water. Thermal breakdown losses may occur and there may be an increased risk of corrosion from excess chelant.
31
the ANALYST Volume 29 Number 1
Part 2: What Are the Internal Treatment Programs Used Within Steam Generators?
continued
“In the interest of producing precipitates that are less adherent, tricalcium phosphate, magnesium phosphate, magnesium, and calcium silicates are avoided by the presence and co-precipitation of excess hydroxyl ions maintained in the boiler water.” Summary
The discussion in Parts 1 and 2 of this article series has provided an overview of the various corrosion and deposit-control programs that are available for steam-generating systems. Applications of these chemistries have been defined, and nonchemical induced corrosion failures have been noted. Guidelines for boiler “M” or total alkalinity and specific conductivity or TDS = 0.65 specific conductance values are based on steam purity. Practical targets above or below tabulated values should be individually established by careful steam-purity measurements. Silica solubility is dependent on pH, temperature, and the levels of trace cations. In some cases, much higher silica levels may be possible in the boiler water. Higher silica levels are considered satisfactory, provided they are supported by simulation software or experience and validated by field testing for theoretical silica recoveries.
Acknowledgements
References
1. ASME (2021). “Consensus on Operating Practices for the Control of Feedwater and Boiler Water Chemistry in Industrial and Institutional Boilers,” American Society of Mechanical Engineers, © 2021, ISBN No. 0-7918-1204-9, publication pending.
2. Beardwood, E.S. (November 2019). “Determination of the Time to Clean Industrial Boilers Based Upon Upset Feedwater Conditions,” Paper No. 19-30, International Water Conference, Orlando, Florida, Engineers’ Society of Western Pennsylvania, Pittsburgh, Pennsylvania. 3. Cunningham, R.J.; Spurrell, C.H. (March 2007). “Proper Alkalinity Control – A Key Factor in Long-Term Successful Operation of a High-Pressure Refinery Waste Heat Boiler,” Paper No. 07454, Corrosion 2007, Nashville, Tennessee, NACE International (now AMPP, www. ampp.org), Houston, Texas.
4. Bartholomew, R.D., “Sodium Balancing for Drum Boilers on All Volatile Treatment.” Power Plant Chemistry 11(9), pp. 533-539, 2009. 5. Turner, R.C. (November 2019). “Analytical Tools to Manage Phosphate and Caustic Treatment,” Paper No. 19-32, International Water Conference, Orlando, Florida, Engineers’ Society of Western Pennsylvania.
6. Dooley, B.; Shields, K. (2004). “Cycle Chemistry for Conventional Fossil Plants and Combined Cycle/HRSGs,” Power Plant Chemistry Journal 6(3), ©Power Plant Chemistry GmbH.
7. Robinson, J.O. (March 2001). “Chemical Treatment of Gas Turbine Heat Recovery Steam Generators,” Paper No. 03492, Corrosion 2001, Houston, Texas, NACE International (now AMPP, www.ampp.org), Houston, Texas. 8. Bartholomew, R.D. (November 2019). “Correct for Ammonia/Amine Effect on pH to Avoid Corrosion with Phosphate Treatment,” Paper No. 19-26, International Water Conference, Orlando, Florida, Engineers’ Society of Western Pennsylvania, Pittsburgh, Pennsylvania. 9. Bartholomew, R.D. (November 2020). “Prepared Discussion of Calculating the Impact of Amine Contribution to the Na:PO4 Molar Ratio Calculation,” Paper No. 20-12D, International Water Conference, virtual sessions, Engineers’ Society of Western Pennsylvania, Pittsburgh, Pennsylvania.
The author would like to acknowledge the late John (Jack) A. Kelly of Water Treatment R&D Consulting Inc. for his input and work with regard to various internal treatment programs available for steam generators (Table E). Mr. Kelly passed away on July 20, 2018.
10. Beardwood, E.S. ( July 14–16, 2015). “MEKO – A Controlled Oxygen Passivation Treatment,” 11th International Conference on Cycle Chemistry in Fossil and Combined-Cycle Plants with Heat Recovery Steam Generators, St. Louis, Missouri, Electric Power Research Institute, Palo Alto, California. 11. Beardwood, E. S.; Charkhutian, K. B. (Dec. 28, 2010). “Metal Oxides Dispersant Composition,” U.S. Patent No. 7,857,989 B2.
32
the ANALYST Volume 29 Number 1
Part 2: What Are the Internal Treatment Programs Used Within Steam Generators?
Edward S. (Ted) Beardwood is the founder of BC&T Inc. (Beardwood Consulting & Technologies Inc.) and has more than 45 years of experience in water treatment. Before starting BC&T, his career included technical and sales positions with major specialty chemical companies, including serving as the senior global applications consultant for Solenis LLC, technical director for the Canadian operations of the Ashland Water Technologies Division, and sales representative and area sales manager for the Dearborn Division of WR Grace (now Betz/GE/Suez). His experience in the industrial water conditioning industry has ranged from full service, sales, sales
continued
management, new construction and commissioning of thermal systems, laboratory management, regulatory compliance, product management, R&D, and consulting. Mr. Beardwood is a past chair of Water Technologies and the Research and Technology Committee for Water and Steam in Thermal Systems for the American Society of Mechanical Engineers (ASME), as well as a former working member of PTC – 31 Performance Test Code for High Purity Water Systems and past chair of NACE International Research Committee STG 11 on Water (now Association for Materials Protection and Performance, SC 18 Committee). Mr. Beardwood holds 14 patents. He may be contacted at ebeardwood@bctinc.org.
Wastewater Treatment: DAF Innovation US Patents #8431022 & #9962631
The T²-Max® DAF Thickener handles high mixed solids flows without sacrificing separation performance.
The HD²XLRator® DAF design encompasses the full array of newly advanced technological innovations. The Nx²JEM® DAF utilizes key hydraulic flow and laminar engineering principals to achieve high volume separation. Contact PEWE at: 360-798-9268 www.pewe-usa.com
33
the ANALYST Volume 29 Number 1
What Microbial Control Strategies Are Followed by AWT Members in Cooling Water Treatment? Ken Soeder, CWT, Jamestown Technologies Division; John Caloritis, CWT, The Metro Group, Inc.; and Garret Garcia, Masters Company, Inc.; and Members of the AWT Cooling Water Technical Subcommittee
34
the ANALYST Volume 29 Number 1
For many decades, a wide variety of water treatment professionals, including product vendors, government regulators, industry consultants, trade associations, and academic scholars, have provided the cooling water marketplace with information on the proper selection and application of microbiocides in open recirculating water systems. These recommendations were usually based on well-investigated studies, and, for the most part, have been very useful to the water treatment vendors who are tasked with implementing successful microbiological control programs in their customers’ cooling water systems. However, water treatment vendors are often operating under a different set of criteria than their academic and commercial colleagues and need to take other operating factors into consideration when designing their programs. These include factors such as treatment economics, ease of product application, time constraints, safety concerns, and customer acceptance. Historically, any differences in product microbiocide selection and application strategies between the academic and practical sections of our marketplace have often led to conundrums for the water treatment industry. The purpose of this study was to directly survey AWT member companies to learn just what types of products,
equipment, and procedures are currently being used to properly control microbiological issues in their customers’ open cooling water systems. Conducted over the course of two years, the information gathered from the two separate surveys has provided valuable insights on the daily concerns and choices made by our fellow AWT members when implementing their own microbiological control programs. In this article, the authors review all data generated from the surveys and then highlight areas and trends that provided the most insight and benefit to our industry. It should also be noted that these surveys achieved two of the highest response rates ever by AWT studies, so we have a broad database that provides confidence in the observations and conclusions.
Survey Part One—Results
Survey Part One was distributed to the AWT membership via the online Survey Monkey application. The survey that was released in May 2018 had a total of 18 questions in a multiple-choice format. Tables A and B provide summary evaluations of the answers to the presented questions. A complete review of the raw data collected from Part One of the Microbiological Control Strategies Survey can be found on the AWT website (www.awt.org).
Table A: Survey Part One – Questions 1 Through 9 Questions
Responses
Q1: What technologies does your company use to control microbiological growth in open cooling water systems?
The response to this question was an overwhelming confirmation that more than 90% of responders use EPA-registered microbiocides as their primary strategy, followed closely at 74% by another large group who use microbiological/organic dispersants. We are reminded that the dispersants are not necessarily replacements for biocides but are often used simultaneously to augment a treatment program.
Q2: With EPA registered products, does your firm use the manufacturers’ labels or does your company subregister its own products?
From this question, we learned that more than 50% of respondents do in fact use a manufacturer’s microbiocide products/labels exclusively. It was also surprising to learn that 35% of respondents use both manufacturer’s labels, along with their own sub-registered trade name, for a particular biocide chemistry.
Q3: What percentage of your customers’ locations have ASHRAE-188 or Legionella Water Management Plans established by you?
In 2018, survey respondents reported that Legionella Water Management Plans were still gaining prominence in the water treatment community. In the survey, 73% of respondents reported that 0 to 25% of their clients had formal water management plans in place. The operating assumption is that this trend will continue to grow as more states begin to legislate Legionella requirements, but also as the market continues to shift into taking proactive steps for prevention.
Q4: What percentage of your accounts require you to have a state-issued pesticide applicator’s license to administer cooling tower microbiocides?
The assortment of responses here demonstrates that Pesticide Applicator certification is not a popular requirement in states across the United States. More than 60% of respondents indicated that there was no formal certification requirement, while another 20% only have a requirement in some customer locations. This is assumed to be from the companies who operate in more than one U.S. state.
Q5: What percentage of your cooling systems utilize oxidizing microbiocides?
Again, the response to this question overwhelmingly confirms that halogen chemistries are present in more than 75% of member customer accounts. This is based on consolidation around best practices for general microbial control, but also suggests that Legionella control is a significant part of our industry’s concerns.
35
the ANALYST Volume 29 Number 1
What Microbial Control Strategies Are Followed by AWT Members in Cooling Water Treatment?
continued
Table A: Survey Part One – Questions 1 Through 9 (continued) Questions
Responses
Q6: If employed, which types of oxidizing microbiocides are most commonly used in your open cooling water systems? (Check all that apply):
Survey results confirm that bromine chemistry is the dominant approach to cooling water microbiological control, followed by sodium hypochlorite and stabilized chlorine. While far less prominent, other chemical and nonchemical strategies are also utilized in meaningful ways.
Q7: What is the preferred method for feeding oxidizing microbiocides to your systems?
The answers here were not surprising, with most of the respondents (42%) feeding product with a system controller based on a timer, and another large group (22%) using controllers operated with oxygen reduction potential (ORP) feedback.
Q8: If shock fed, how many times per week is the oxidizing microbiocide typically added?
The consensus is clear here, with most of the respondents (44%) shock feeding an oxidizing microbiocide 1 to 3 times per week. We suspect that this decision is also greatly influenced by program economics, especially in larger systems.
Q9: What percentage of your systems also use non-oxidizing microbiocides?
Adhering to commonly recommended water treatment protocols, most respondents (54%) are also using a non-oxidizing microbiocide as part of their overall microbiological control program.
Table B: Survey Part One – Questions 10 through 18 Q10: If employed, which types of non-oxidizing microbiocides are most commonly used in your open cooling water systems (check all that apply)?
Since we allowed respondents to check several choices to this question, we have a lot of answers—235 in total. Leading the way are isothiazolinone-based products at 26%. This was then followed by DBNPA-based products at 19%, glutaraldehyde-based products at 18%, and quat or polyquat-based products at 17%. Other microbiocides did not seem to have that much of a following.
Q11: What is the preferred method for feeding non-oxidizing microbiocides to your systems?
As expected, this question had the most universal answer, with most respondents (89%) using a system controller with a timer to feed non-oxidizing microbicides to the system. This makes sense from both performance and economic perspectives.
Q12: If shock fed, how many times per week is the non-oxidizing microbiocide typically added?
More than 75% of the respondents stated they are applying non-oxidizing microbiocides on a 1 to 3 times per week application basis. Only about 11% of the respondents apply non-oxidizing microbiocides 4 to 6 times per week. A small minority, less than 5%, are applying non-oxidizing microbiocides daily.
Q13: Do you perform specific test procedures to measure residual levels for non-oxidizing microbiocides in your systems?
Only 22% of survey respondents stated they routinely test for non-oxidizing microbiocide residuals. Less than 20% responded that they test “on occasion,” and 42% of respondents replied they test “not typically.” Almost 20% of respondents stated they “never” test for nonoxidizing microbiocides.
Q14: Do you primarily use liquid or solid microbiocides (both oxidizing and non-oxidizing products)?
Survey results show most vendors (58%) utilize liquid microbiocides, while 41% of respondents state they use a combination of liquid and solid microbiocide products.
Q15: Are your cooling water treatment programs targeting a specific microorganism or foulant class? (Check all that apply)
In the survey, 96% of respondents replied that they are indeed selectively applying microbiocides to target specific microorganisms. Slime forming, Legionella, and algae were each above 80% of the target organisms.
Q16: With your EPA registered microbiocides, do you also use organic dispersant or penetrating agents in your cooling water treatment programs?
A substantial amount, 42% of survey respondents, stated they use dispersant/penetrating agents in their cooling water treatment programs on an “always/usual” basis. A minority (38%) responded that they apply dispersant/penetrants “sometimes.” A smaller minority (19%) responded that they “rarely or never” use supplemental dispersant/penetrating agents.
Q17: Which of the following mechanical strategies does your company also actively support to minimize microbiological contamination in your cooling water systems? (Check all that apply)
The variety of responses clearly shows that most survey respondents are also utilizing mechanical strategies to help control microbial contamination. Sand, media, or bag filtration (74%); cooling tower deck covers (64%); and cooling tower basin scrubbers (42%) were the most cited mechanical strategies followed.
Q18: Does your company also offer or recommend routine cooling tower mechanical cleanings to your customers?
Survey responses showed that some end-users do their own cleanings (23%), while slightly over a third (34%) of respondents state they provide tower cleaning services. A large segment of respondents (43%) only recommended those services to their customers.
Survey Part One Observations
1. Despite strong support from AWT over the past 10 years, adoption of the ASHRAE-188 Legionella Water Management Plan by member companies has been slow. The assumption is that this trend will continue to improve as more states legislate Legionella requirements and member companies shift into more proactive and preventative business positions.
Looking closely at the results from the Part One Survey, several observations that are important to our industry can be observed and are outlined here:
36
the ANALYST Volume 29 Number 1
What Microbial Control Strategies Are Followed by AWT Members in Cooling Water Treatment?
2. Member companies have clearly stated that Pesticide Applicator Certification is not a popular requirement and is not pursued in states where the certificate is not required. 3. Not surprisingly, oxidizing products are the primary approach used to control microbiological growth in cooling water systems. Surprisingly, with a higher use cost, bromine chemistry is the preferred technology for this application.
continued
5. Most water treatment vendors do not offer tower cleaning services for their customers. With more evaluation, this segment of the business might represent a new revenue source for member companies.
Survey Part Two—Results
After reviewing the results from the Survey Part One, it was decided to develop a second and more inquisitive survey. The purpose of our Survey Part Two was designed to obtain more detailed responses to microbiological use operation of the AWT membership by utilizing a text response to our new set of questions. The Part Two Survey was again distributed to the AWT membership via the Survey Monkey application in March 2019 and had eight new questions. Table C is a summary evaluation of responses compiled by the authors. A complete review of the raw data collected from the Part Two Survey can be found on the AWT website.
4. The introduction of advanced digital system controllers is playing an important and positive role in the feed of microbiocides to cooling water systems. As this equipment improves further, we can expect to see even more advancements in system control, a reduction in microbiocide usage, and a lowering of manpower requirements.
Table C: Survey Part Two – Questions 1 and 2 Q1: In our initial survey, it was shown that most of our customers were not operating cooling water treatment programs under an ASHRAE-188 or similar Legionella WMPs. What do you think are some of the main reasons or concerns for customers not implementing a WMP as part of their overall cooling water treatment program? Response Category
Quantity
Percent of Total
Not mandated by regulations
12
25.0
Not sufficiently motivated
11
22.9
Cost prohibitive
10
20.8
Uninformed clients
6
12.5
Not worried about risk
3
6.3
Too complicated or burdensome
3
6.3
Liability to WTSC
2
4.2
Not enough staff
1
2.0
Totals:
48
100
Q2: In the initial survey, we learned that many states do not require water treatment member companies to maintain a Pesticide Applicators Permit to administer microbiocides to a cooling water system. What are your thoughts on water treatment member companies being required to maintain a Pesticide Applicators Permit to feed microbiocides to cooling water systems? Response Category
Quantity
Percent of Total
Yes, good idea
23
48.0
No, not needed
14
29.0
Not applicable
4
8.3
Ambivalent, do not care
3
6.3
I am not familiar with this
2
4.2
Laws are confusing (tower biocides overlooked)
2
4.2
Totals:
48
100
37
the ANALYST Volume 29 Number 1
What Microbial Control Strategies Are Followed by AWT Members in Cooling Water Treatment?
continued
Table D shows responses from Questions 3, 4, and 5. Table D: Survey Part Two – Questions 3, 4, and 5 Q3: With microbiocide applications, many member companies are now using a combination of liquid and solid products in their cooling water treatment programs. What combination of individual liquid and solid products have worked best for your company in cooling water treatment? Response Category
Quantity
Percent of Total
Combination (equal liquids and solids)
22
46.8
Liquids only
14
29.8
Primarily liquids
9
19.2
Primarily solids
1
2.1
Other: chlorine dioxide (Cl02)
1
2.1
Solids only
0
0
Totals:
47
100
Q4: How are rising state product registration and application fees impacting the selection and use of sub-registered microbiocides at your company? Response Category
Quantity
Percent of Total
No effect or business impact
16
34.0
Selling manufacturer’s labeled products
14
29.7
Selective or partial product line sub-registration
9
19.1
Adds more burden or extra cost
6
12.8
Trend limits my product selection
2
4.4
Totals:
47
100
Q5: Some member companies have indicated that they do not use oxidizing microbiocides as part of their overall cooling water microbiological control programs. If your company uses this strategy, what factors would prevent you from incorporating oxidizing microbiocides as part of your cooling water treatment control program? Response Category
Quantity
Percent of Total
Always use an oxidizing microbiocide
40
83.3
Feed/equipment issues
4
8.3
Customer/consultant preference
1
2.1
Difficult to control
1
2.1
Discharge requirement
1
2.1
Other (non-oxidizing microbiocide)
1
2.1
Totals:
48
100
38
the ANALYST Volume 29 Number 1
What Microbial Control Strategies Are Followed by AWT Members in Cooling Water Treatment?
continued
Table E provides a look at the answers for Questions 6 through 8. Table E: Survey Part 2 – Questions 6, 7 and 8 Q6: Recent data suggest that recirculating potable (or domestic) water systems in large buildings are important breeding grounds for Legionella bacteria. If offered, what technologies does your company use to provide Legionella control in your customers hot and cold recirculating potable water systems? Response Category
Quantity
Percent of Total
Company not involved in this marketplace
22
45.8
Chlorine/ClO2
11
23.0
Chloramine
6
12.5
Monitoring/review only
5
10.3
Copper/silver
2
4.2
Peroxide
1
2.1
UV disinfection
1
2.1
Totals:
48
100
Q7: What are your major concerns with EPA-registered microbiocides that are currently available to or marketplace? Response Category
Quantity
Percent of Total
No major concerns
23
49
Product cost
8
17
Lack of competition/overseas manufacturing
5
10
Complicated and costly sub-registration process
4
9
Product performance
4
9
Safety and handling
3
6
Totals:
47
100
Q8: Do you anticipate any new microbiocides being introduced to the marketplace soon? Response Category
Quantity
Percent of Total
No
35
75
Yes, traditional technologies
6
13
Yes, “green technologies”
2
4
Do not know
2
4
Hope so!
2
4
Totals:
47
100
Survey Part Two—Observations
The purpose of the Survey Part Two was to look deeper into some of the answers provided by member companies in the initial survey and to better understand the factors influencing their responses. Here are some general observations from the Survey Part Two answers: 1. Several strong and varied responses were given to support the low acceptance rate for the ASHRAE-188 Legionella Water Management Plan by member companies. Primary reasons included the lack of state and federal regulations mandating these programs, the 39
high setup and maintenance costs associated with the plans, and a lack of motivation by member companies. Hopefully, AWT will consider and act upon these concerns as the organization moves forward. 2. In terms of Legionella control in potable or domestic water systems, almost 50% of respondents stated that they are not involved in this aspect of the water treatment marketplace. Perhaps a future survey could investigate reasons for this hesitancy, as this may be an overlooked business opportunity for member companies. the ANALYST Volume 29 Number 1
What Microbial Control Strategies Are Followed by AWT Members in Cooling Water Treatment?
Overall Trends Identified
continued
4. An unexpected acceptance of some “niche” microbiological control approaches: During the past years, we have seen an increase in the use of unconventional microbiological control approaches in cooling water systems, including technologies such as chlorine dioxide, onsite generated halogens, and supporting biological dispersants. It will be interesting to see if these new technologies gain increased acceptance in our industry over the upcoming years.
THe data were evaluated by reviewing, categorizing, and quantifying each response. The evaluation allowed for identification of trends that were underway, with the following six being the most noteworthy. Future surveys will confirm whether these trends hold over the long term, or whether new ones will emerge for reporting back to members. 1. Regulations are taking hold: At the time the surveys were issued, regulations mandating product selection and program activities had already begun in both the state and city of New York. Since then, several states have laws being considered that are expected to be enacted. Those regulations should inevitably increase overall microbiocide demand and usage.
5. Use of liquid halogen chemistries leads solid products: Use of solid halogen donor biocides has been on a continuing decline. The ease of application and control for liquid halogen donors has become widely accepted. Also, users do not want to handle solid halogens or deal with dusting or similar handling issues. Furthermore, solid halogen donors have become more price sensitive of late, and global supplies have become very tight; that trend is very likely to continue.
2. Oxidizing agents continue to lead as primary microbiocides: It was not surprising that the oxidizing chemistries used by the cooling water treatment industry continue to lead as our primary microbiocides. However, many companies have adopted alternative or supportive chemical strategies to augment these oxidizing technologies. 3. Automation is increasingly used to dose microbiocides: During the past 10 or more years, great progress has been made by equipment vendors on the automation of controllers used to dose microbiocides to open cooling water systems. Now, digital system controllers can track a wide variety of cooling water parameters, such pH, conductivity, temperature, and ORP readings on a real-time basis, and present this information instantaneously to water treatment vendors and customers alike. Advanced systems also allow the data logging of vast amounts of information and allow vendors to make changes to water treatment parameters, including microbiocide feed rate and times, from remote access points such as personal computers and hand-held devices. If used properly, these digital controllers will enable service companies to have much better control of their customer’s cooling water systems and even result in a reduction in the actual amounts of microbiocides needed to obtain desired control results.
40
6. ASHRAE 188 acceptance was lower than expected: Without the force of local and regional legislation, there has been no continuing pressure for either end-users or water treatment service companies to more aggressively embrace the ASHRAE 188 standard. Outside the city and state of New York, there are no legal mandates in the United States for Legionella control utilizing the ASHRAE 188 Standard at this time. Compliance with the standard, although not prohibitive, is costly in both dollars and time, which has translated into less than expected adoption.
Overall Conclusions
As any seasoned water treatment professional knows, maintaining proper microbiological control in a recirculating cooling water system is critical to the overall success of the program. Improper microbiological control can lead to a myriad of other operational problems, including increased corrosion rates, accelerated deposition, excessive utility costs, shorter equipment life, and even health and safety concerns. With this “Microbiological Control Strategies” project, AWT’s Cooling Water Subcommittee was able to successfully survey the association’s membership to learn the ANALYST Volume 29 Number 1
What Microbial Control Strategies Are Followed by AWT Members in Cooling Water Treatment?
what types of microbiological control products and strategies they use in their own situations and companies. By gaining a better understanding of the practices used by our colleagues, the survey will enable member companies to more closely evaluate their own programs to see if any changes and improvements can be made to ensure the success of their own operations. Although we are confident that very good, valid, and broad data was generated by this study, it must be noted that a project of this type needs to be re-evaluated on a regular basis to ensure that current and useful data is always provided to the AWT membership. The Microbiocide Survey completed in 2019 had the highest response rate and was the most comprehensive survey conducted by AWT to date. We suggest that an updated survey and paper be done in three-tofive-year intervals to update the information. Using a Microbiocide Survey as a living document would provide AWT membership with timely and ongoing information for a very important part of our water treatment marketplace. Kenneth Soeder, CWT, recently retired as the senior technical advisor for Azure Water Services. He previously was a founding and a principal partner in Azure Water Services and president of the company’s Jamestown Technologies Division. During Mr. Soeder’s 38-year involvement in the industrial and commercial water treatment industry, he has published more than 12 technical papers on corrosion, deposit, and microbiological control in various water-handling systems, and has also been granted four U.S. patents for new product developments. He graduated from the State University of New York (SUNY) Oneonta with a B.S. in biology and chemistry and has also received an M.S. in water resource management from the SUNY College of Environmental Science and Forestry at Syracuse. Mr. Soeder is available at soeder@comcast.net.
41
continued
John Caloritis, CWT, holds a B.S. in chemistry and is the technical director of The Metro Group Inc. He has spent 37 years in water treatment in multiple roles, all with one firm. Mr. Caloritis has been active within AWT as both a member and chair of the Cooling Water Subcommittee and a member of the Legionella Task Force, and was recently elected to serve on AWTs Board of Directors. He can be reached at jcaloritis@ metrogroupinc.com. Garret (Gary) Garcia became involved in water treatment as a young high school student, continuing through college working with Masters Co. Inc. (MCI), which he and his family later purchased. Some of the many facets of Mr. Garcia’s experience include laboratory testing, pilot formulations, field applications, method development, production blending, and operations. Over the years, he has served on several AWT committees, including Cooling Water and Special Projects as well as the Supplier Task Group. Mr. Garcia continues to serve as MCI’s technical director as well as at the firm’s sister division, LiquiLogic, LLC. He may be reached at gary@ masterscoinc.com.
the ANALYST Volume 29 Number 1
An Overview of Cooling Towers, Legionellosis, and Water Management Programs Christopher J. Nagle, EVAPCO, Inc.
42
the ANALYST Volume 29 Number 1
Introduction
The American Society of Heating, Refrigerating and Air-Conditioning Engineers (ASHRAE) adopted Standard 188-2015 titled “Legionellosis: Risk Management for Building Water Systems” in 2015. The stated purpose was “to establish minimum legionellosis risk management requirements for building water systems” (1). The standard was subsequently updated in 2018. Regulations aimed at controlling Legionella bacteria in water systems had been enacted as early as the 1990s (2) and the early 2000s (3). More recently, several jurisdictions have proposed or adopted regulations (4, 5) referencing sections of ASHRAE Standard 188 without inclusion of all potable and non-potable building water systems, which are also included in the standard. Some of these regulations imposed rigid, prescriptive requirements on the program team, including control limits, monitoring, testing, and/or corrective actions. These more narrowly focused regulations have historically failed to produce measurable reductions in the occurrence of legionellosis. Data from two such jurisdictions will be presented as a preface to a broader discussion on water management programs, including cooling towers.
systems are responsible for an even larger number of cases of Legionellosis.” This highlights the need for the “whole building” approach laid out in Standard 188, which can be broadened to include the municipal water supply to form a comprehensive water management program. This more comprehensive approach to developing a site’s water management program is needed to minimize the risk of Legionella bacteria amplification associated with all water-use end points and reduce the occurrence of legionellosis.
Background
Many AWT members routinely provide water treatment expertise and solutions to end-use customers across a wide range of applications. Since its founding in 1985, AWT has worked to support members through education, training, and technical resources. Readers who have not done so already are encouraged to review Legionella 2019: A Position Statement and Guidance Document (6), which is available at www.awt.org.
Water management programs need to have a broader view encompassing all the building’s water systems rather than focusing solely on cooling towers as “the source” of Legionella. As part of the program team, water treatment professionals are relied upon to offer technically sound recommendations regarding treatment solutions, control limits, control measures, and validation steps for the evaporative cooling equipment at their customers’ facilities. These recommendations should be based on a thorough understanding of the different types of evaporative cooling equipment and how the design and age of this equipment can impact the water management program. A review of different equipment will be presented to highlight similarities and differences for the water treatment professional to consider while developing site-specific treatment programs, control limits, and validation steps. AWT’s Legionella 2019 (6) notes, “While cooling towers and evaporative condensers are also a potential source related to Legionnaires’ disease, and long thought to be the major source of Legionella-causing disease, current data suggest that domestic (potable) water plumbing 43
The ASHRAE website, www.ashrae.org, includes a Legionella Resources tab, which water treatment professionals should also review. This website notes, “ANSI/ ASHRAE Standard 188-2018, Legionellosis: Risk Management for Building Water Systems, establishes minimum legionellosis risk management requirements for building water systems” (1). The standard provides water treatment professionals with a framework to use when developing a water management program with their customer. Several regulations focused on legionellosis risk prevention or disease reduction have not included the entire building water system approach detailed in Standard 188-2018. Note, legionellosis is a term that refers to both Legionnaires’ disease and Pontiac Fever, both of which are caused by Legionella bacteria.
“Many AWT members routinely provide water treatment expertise and solutions to end-use customers across a wide range of applications.” the ANALYST Volume 29 Number 1
An Overview of Cooling Towers, Legionellosis, and Water Management Programs
Overview of Regulatory Efforts
continued
the regulations in 2005, reported cases of Legionnaires’ disease in France ranged from a low of 1,170 cases in 2011 to a high of 1,630 cases in 2017 with a 13-year average of 1,362 cases. Since 2005, the average has increased slightly to 2.095 per 100,000 people. France provides more than a decade’s worth of data, which does not support the belief that regulation focused solely on evaporative cooling systems positively impacts the goal of Legionellosis Risk Prevention.
In this section, we will examine two areas where regulations to control Legionella have been implemented.
France France was one of the first countries to implement regulations intended to reduce the incidence of Legionnaires’ disease by focusing on evaporative cooling equipment as a possible source of infection. France experienced an outbreak of Legionnaires’ disease in the Pas-de-Calais District between November 2003 and January 2004. Following that outbreak, France’s Ministry of Ecology and Sustainable Development issued new regulations (3) on December 13, 2004, which focused solely on evaporative cooling equipment. Title II of the 2004 regulation begins with the goal of Legionellosis Risk Prevention. A partial list of regulation requirements includes drift eliminators with a drift rate certified to at least 0.01% of water circulation rate (Article 4), monthly sampling for the analysis of Legionella during periods of operation (Article 8), and shutdown and disinfection for any Legionella test result above 100,000 colony forming units per liter (CFU/L) (100 CFU per milliliter [CFU/mL]) (Article 9). The regulations also include prescriptive Legionella testing schedules coupled with low maximum control limit requirements for all evaporative cooling systems operating in France beginning at the end of 2004. The French regulations provide many years of data to study the efficacy of narrowly focused, evaporative-cooling-only regulations with regard to the stated goal of Legionellosis Risk Prevention. Figure 1 shows a history of Legionnaires’ disease in France from 2002 through 2017. Figure 1 shows the incidence of reported cases of Legionnaires’ disease in France per 100,000 people. The 15-year average of 1.949 is calculated from the beginning of the outbreak year 2003 and runs through the most recent data available from 2017. Beginning with
Figure 1: 15-year average of Legionnaires’ Disease in France (2002 through 2017). The blue line shows the number of cases per 100,000 each year. Source: Data from European CDC Legionnaires’ Disease Surveillance Report (2017).
New York City In 2015, New York City experienced multiple outbreaks of Legionnaires’ disease. One of the city’s outbreaks occurred in the South Bronx during July and August. The New York City Department of Health and Mental Hygiene focused on cooling towers as the suspected source of the outbreak. On August 6, 2015, NYC Health Commissioner Dr. Mary Bassett issued an order requiring all owners of cooling towers within New York City to inspect and disinfect their evaporative cooling equipment within 14 days (7). On August 11, 2015, Commissioner Bassett promoted new regulations to members of the city council. During her testimony (8), the commissioner stated, “New York City’s drinking water supply is safe and unaffected by the Legionella.” Her testimony also noted that “the Administration strongly supports the registration of
“France was one of the first countries to implement regulations intended to reduce the incidence of Legionnaires’ disease by focusing on evaporative cooling equipment as a possible source of infection.” 44
the ANALYST Volume 29 Number 1
An Overview of Cooling Towers, Legionellosis, and Water Management Programs
cooling towers and reaching inspection and testing for microbes in order to help prevent and investigate future outbreaks of Legionnaires’ disease.” Commissioner Bassett concluded her prepared remarks by stating, “Legionella exists in the environment, and we will continue to see sporadic cases of Legionnaires’ disease in New York City, but we believe that this important legislation will go a long way towards reducing the number and severity of these outbreaks.” The hastily prepared Local Law 77 (4) was passed on August 13, 2015, and was signed by the mayor on August 18. This law requires owners of cooling towers to register them with the Department of Buildings. The law also referenced the new Administrative Code 17-194.1, which contained mandated requirements for owners of evaporatively cooled equipment, including cleanings, corrective actions, disinfections, inspections, Legionella bacteria testing, and a water management program based primarily on only Section 7.2 of ASHRAE 188. Additional requirements and details were in effect by November 2015. Figure 2: Cases of Legionnaires’ disease over a 10-year period in New York City. Source: Data from U.S. CDC Wonder Table Nationally Notifiable Infectious Diseases and Conditions.
continued
“There is no ‘one-size-fits-all’ cooling tower.” plans on evaporative cooling equipment alone does not reduce the incidence of legionellosis. AWT members are not likely to be surprised that regulations seeking to register evaporative cooling equipment, mandate specific treatment programs, prescribe Legionella-specific testing, or propose low-CFU/ mL corrective action levels have historically failed to reduce the incidence of legionellosis. Legionella 2019 supports the need for an ASHRAE 188-based analysis of building water systems when it notes (6), “While cooling towers and evaporative condensers are also a potential source related to Legionnaires’ disease, and long thought to be the major source of Legionella-causing disease, current data suggest that domestic (potable) water plumbing systems are responsible for an even larger number of cases of legionellosis.”
Cooling Towers as One Part of a Water Management Program
Many customers will want their water treatment supplier to participate on the program team to help assess the risk associated with all building water systems when developing a site-specific water management plan. Buildings or facilities that use evaporative cooling towers would assess the risk and incorporate these systems as a component of the broader site-specific management program. What information would a water treatment professional need to assess the risk and corresponding control limits for their customer’s cooling tower?
Figure 2 shows the cases of Legionnaires’ disease reported over the past 10 years in New York City, with an average of 328.5 reported cases per year. New York City regulations for registration and maintenance of cooling towers were enacted in 2015 “to minimize potential contamination by Legionella bacteria to prevent outbreaks of Legionnaires’ disease” (9). In the four years since this cooling-tower-focused regulation was put in place, the annual average of reported cases of Legionnaires’ disease in New York City has increased to 442. Data from both France and New York City strongly suggest that focusing regulations or water management 45
The answer to that question should begin with an understanding that “industry standards” or “simplistic required response tables” should not be equally applied to all cooling towers. The reason appears to be missed in many cited works, commercially motivated brochures, and well-intentioned regulations. There is no “one-sizefits-all” cooling tower. In fact, some of the systems cited in reference works are not cooling towers at all. As an example, an oft-cited work titled “Assessing the Environmental Health Relevance of Cooling Towers – A Systematic Review of Legionellosis Outbreaks” includes data from a 2005 the ANALYST Volume 29 Number 1
“The water safety and management plan should include procedures and monitoring to ensure that hot water systems are circulating and fulfill the balancing requirements set forth in ASHRAE Standard 188 Section 8.” 46
the ANALYST Volume 29 Number 1
An Overview of Cooling Towers, Legionellosis, and Water Management Programs
continued
the tested tower were larger than 60-micron (µm), which is more than 1,000 times larger than the 5-µm size cited by AWT and others as respirable. A 2008 International Water Conference (IWC) paper (13) contextualizes this concept, stating, “Most of the volume of drift as it leaves the tower is in droplet sizes too large to be deeply inhaled. The bacteria contained in those droplets can cause disease only if the droplets evaporate to a respirable size before falling to the ground.”
outbreak in Norway with a reported Legionella pneumophila culture of only 2 X 10³ CFU/L (10). However, the abstract (11) for this referenced paper notes “Those living up to 1 kilometer (km) from a particular air scrubber had the highest risk ratio, and only for this source did the risk ratio decrease as the radius widened.” The authors noted that the air scrubber had high air discharge velocity, high organic content, high temperature (40 °C/104 °F), and a large amount of drift. The combined operating characteristics of the studied air scrubber are materially different than a cooling tower.
Drift
Evaporative cooling equipment rejects heat from a building or process via evaporation of pure water (H 2O). Under certain atmospheric conditions, the supersaturated discharge air exiting the tower may form a visible plume. Some documents have incorrectly suggested that plumes from cooling towers pose a risk for transmission of Legionella bacteria. Drift is separate and distinct from plume. Drift refers to the very small percentage of recirculating cooling water that exits the evaporative cooling equipment with the exhaust air discharge. Hennon and Wheeler (12) provide a useful description in their Cooling Technology Institute (CTI) paper on tower emissions: “Baffles, called drift eliminators, are placed between the nozzles and the fans to minimize (through inertial impaction) the amount of entrained water droplets that leave the cooling tower and are discharged into the atmosphere. The escaping droplets are called drift. An important distinction between drift and the normally visible condensing plume is that the drift contains the same chemicals and solids present in the circulating water, whereas the condensation is pure water vapor.” Drift is one of the key factors that must be understood by anyone seeking to assess risk or define risk management for evaporative cooling equipment as one component of a broader building water systems approach. There are two components of drift that should be of interest to the water treatment professional: drift rate and drift size. The previously referenced CTI paper (12) presents a droplet size distribution analysis from a full-scale cooling tower test in Figure 2 of that paper. Data from Figure 2 shows that more than 86% of the drift droplets exiting 48
The drift rate may be even more important than drift particle size when evaluating potential risk or defining corrective action levels. Recall that the 2004 vintage regulations for cooling towers in France required drift eliminators with a drift rate certified to at least 0.01% of water circulation rate. Although not identical, the French regulations are close to an evaporative condenser attributed to a 1988 outbreak that was modeled by Bugler et al. in the IWC paper. The 1988 vintage condenser was estimated to have a 0.02% drift rate and reported spray water Legionella test result of 9,000 CFU/ mL. Table 1 (13) in the IWC paper suggests that a person near the 1988 evaporative condenser attributed as the source of the outbreak might be able to inhale one (1) Legionella bacteria in as little as three (3) seconds. Since that era, substantial improvements have been achieved in reducing drift rates from evaporative cooling equipment. Current crossflow equipment designs typically achieve drift rates of 0.005% of water recirculation rate, while current counterflow equipment designs can be rated as low as 0.001% drift. This order of magnitude reduction in the amount of drift escaping the cooling tower significantly reduces the potential risk of disease compared to older equipment. Table 1 (13)3 suggests that a person near a modern counterflow cooling system containing 100 CFU/mL Legionella bacteria in the tower water probably needs to spend at least 52 to 106 minutes near the evaporative cooling system to have a similar chance of inhaling one (1) Legionella bacteria. Both drift rate and drift size impact the risk of legionellosis from an evaporative cooling system. Bugler et al. (13) note, “Only a very small percentage (on the order of 1%) of the drift as it leaves the cooling tower is of respirable size, and hence able to cause infection.” Because the majority of drift would need to evaporate the ANALYST Volume 29 Number 1
An Overview of Cooling Towers, Legionellosis, and Water Management Programs
continued
collected after final closure of the CTs and as far as ~300 m from the basin demonstrated Lp-1 Lens in aerosolized, respirable (≤5 µm) water droplets.”
to become respirable, the authors state that “a person breathing undiluted exhaust air from a well-maintained cooling tower with what might be considered a moderate concentration (100 CFU/mL) of Legionella would need to be in the exhaust much longer (possibly 99 times longer) than the time indicated in Table 1 before he statistically would inhale a single Legionella bacterium deeply into his lungs.”
Revisiting the Outbreak in France
Older, less-efficient drift eliminators might have contributed to the outbreak in France, as suggested in the title of the oft-cited work titled “A Community-Wide Outbreak of Legionnaires’ Disease Linked to Industrial Cooling Towers—How Far Can Contaminated Aerosols Spread?” In the article, Nguyen et al. (14) report, “In Plant A, the epidemic strain was found in the cooling towers (CTs), in wastewater and sludge from the basin, and in the air in the vicinity of the basin (19 isolates in total). The level of contamination was high (1061010 CFU/L) in Plant A as well as in Plant B. Plant B supplied biological sludge for Plant A waste basin and was located ~40 km away, in another district.” Most water treatment professionals would view the reported counts of 1,000 CFU/mL to 10,000,000 CFU/mL Legionella sero group 1 in either a wastewater aeration basin or cooling tower as a system that likely warrants corrective actions. Interestingly, this article (14) notes, “After the present outbreak, the national authorities issued new regulations concerning the installation and maintenance of CTs.” The title of this article and the regulatory response attribute the outbreak to the cooling towers as the root cause. Those who take the time to read the article by Nguyen et al. (14), however, might reasonably conclude that the cooling towers were not the root cause but rather were victims of their neighborhood. The authors explain, “The contaminated waste-basin sludge was traced back to its origin—an industrial site in another district—but no LD cases were detected there.” Plant B’s waste-basin sludge was supplied to Plant A where the wastewater processing basins included aeration systems “located ~300 meters (m) from the CTs.” Nguyen et al. noted, “a considerable amount of Legionella bacteria in the wastewater basin of the plant might have become airborne in aerosol produced by surface ventilators, since air samples
Works typically cited in the mythical quest for “one-size-fits-all” action levels or dispersion distances from potential point sources seldom, if ever, include detailed information regarding the evaporative cooling unit type, age, drift eliminator type and condition, fan size, or fan cubic feet per minute (cfm), which would be needed to correlate microbiological test results to risk. All other things being equal, a 50 CFU/mL test result in a cooling tower with a 0.02% drift rate represents a higher risk than a cooling tower with a 0.001% drift rate and a 500 CFU/mL test result. Those who proclaim that a test result of 50 CFU/mL in each example tower above indicates the same risk or requires the same corrective action may lack a basic understanding of how evaporative cooling equipment operates.
Water Treatment to Manage Risk
A water treatment professional equipped with an understanding of drift rates and drift size should prioritize review and documentation of the site’s evaporative cooling equipment early in the water management program process before developing treatment programs, testing frequency, control limits, or corrective actions. Records should include manufacturer, type (i.e., cooler, condenser, or tower), model number, serial number, and date of manufacture. This information can help identify customers operating older systems for whom upgrading to modern high-efficiency drift eliminators is likely to provide the greatest return on investment with regard to reducing risk. Adding annual or semiannual equipment inspections to the water management program could help to ensure that mechanical systems and drift eliminators remain in good working order. The management plan should differentiate between open cooling towers and closed-circuit cooling systems, or evaporative condensers designed with integral spray water pumps. Water professionals who understand the type and age of evaporative cooling equipment used at their site will recognize that more frequent testing, lower positivity in test results, or lower test result action levels are not likely to reduce risk. Rather, they should focus on developing a site-specific treatment program with associated feed and control equipment designed to consistently
49
the ANALYST Volume 29 Number 1
An Overview of Cooling Towers, Legionellosis, and Water Management Programs
deliver good treatment results for the evaporative cooling equipment used at their customer’s facility. Closed-circuit coolers and evaporative condensers with integral pumps differ from open cooling towers or systems connected to a remote sump in ways that may impact treatment program selection. Coolers and condensers include closed-loop coils where most of the heat exchange occurs. When equipped with integral spray water pumps, these systems tend to have very low water volumes with very high water turnover rates. It is not uncommon for these systems to circulate 100% of the basin water volume in one minute or less of spray pump operation. Accordingly, low retention times make biocide selection and feed frequency important considerations for the water treatment professional. AWT’s non-oxidizer Biomatrix spreadsheet is a useful tool for selecting biocides with fast or moderate kill times for coolers or condensers with integral pumps. The volume of biocide added is typically much less than the amount fed to a cooling tower, but the frequency of timed addition may need to be higher to account for the faster turnover of system water volume. Biocides with a tendency to foam may create additional challenges in these small water volume, high turnover rate systems. Figure 3: Closed-circuit cooler.
Figure 3 shows an inside view of a closed-circuit cooler. The selection and installation of chemical feed and control equipment for coolers or condensers operating with integral spray water pumps may also differ compared to larger open cooling towers or systems operating on 50
continued
remote sumps. To begin, the water treatment professional should recognize that units with integral spray water pumps typically operate at low water pressures (≤5 pounds per square inch [psi]), which may require a small supplemental in-line booster pump if conductivity manifolds, or chemical injection points are piped at a distance from the unit. Units operating in colder climates may warrant additional thought regarding freeze protection for both side-stream piping and chemical storage associated with the selected treatment program. Closed-circuit coolers and evaporative condensers operating with integral pumps typically eliminate the potential for dead-leg areas. This fact, in combination with more frequent wet-dry cycling, makes these systems less prone to sessile bacteria growth than more complex piping systems that are connected to open cooling towers. The tendency for increased wet-dry cycling should not be underestimated when selecting and programming conductivity controllers. Thought should be given to matching programmed chemical feed times with parts of the day when the unit’s spray water pump is likely to be in operation. It may be wise to schedule timed chemical additions in the heat of the day to avoid no-flow conditions that may cause a timed feed to be missed completely. Some may suggest that materials of construction do not directly fit into the water management program. There are, however, a few things worth considering when developing a water treatment program for an evaporative cooling system, which includes a heat exchange coil. The most prevalent material of construction for these coils is hot dip galvanizing on carbon steel. A site-specific passivation plan will help minimize white rust on new galvanized coils, thereby extending equipment life and reducing localized areas of corrosion that may foster bacterial growth. Some systems may include copper coils and stainless-steel coils, which recently are becoming a more common option. For stainless-steel applications, the proactive water treatment professional will want to understand the designed coil inlet temperature to establish and track maximum cycled chloride concentrations in the spray water to minimize the chances of pitting and stress corrosion cracking. Cooling towers do not include the heat exchange coil found in coolers or condensers. Rather, recirculating the ANALYST Volume 29 Number 1
An Overview of Cooling Towers, Legionellosis, and Water Management Programs
continued
The use of supplemental dispersants should be considered carefully during development of the water management program. Dispersant selection, feed rate, and retention time may create a negative impact on the performance of the drift eliminators. It was noted earlier that modern drift eliminators generally do not allow water droplets of respirable size to exit the tower with air exhaust. Dispersants or surfactants, which work by reducing the surface tension of the cooling tower water, have the potential to decrease water droplet size and/or increase the amount of drift exiting the tower.
water is cooled as it falls through a fill pack and evaporates as it comes in contact with air moving either in a crossflow or counter-flow direction. Figure 4: Sideview of a crossflow cooling tower.
Ganzitti and Rincones’ (15) recent paper (“Impact of Water Surface Tension on Drift Eliminators”) presented at the 2020 Cooling Technology Institute should be considered a “must read” for any water treatment professional who routinely supplies supplemental dispersants for evaporative cooling systems other than offline cleanings. Ganzitti and Rincones note, “Most of the cases with abnormal drift levels are due to incorrect installation or use of the drift eliminators panels.” This supports the suggestion that annual or semiannual inspections of the drift eliminators should be included in the water management program. Their technical paper also notes, “Surfactants can have a significant impact on the drift rate, depending on their concentration and their ability to migrate to new interface air/liquid (fast or slow response surfactant).” This suggests that the selection, application, feed strategy, and feed control of any supplemental dispersant should be documented in the water management program, based on a thorough understanding of both system water volume and retention time.
Crossflow cooling towers (Figure 4) move air through the fill pack perpendicular to the direction of water flow. Drift eliminators are integrated into the fill block, and current models are rated as low as 0.005% of the recirculation rate. The crossflow design may allow areas on the water distribution pan or cold-water basin to be exposed to sunlight. In that case, algae may become a treatment concern for some crossflow towers. Figure 5: Sideview of a counter-flow cooling tower.
Counter-flow cooling towers (Figure 5) move air up through the fill counter to the direction of the falling recirculating water and include drift eliminators located above the spray header. Current counter-flow models can achieve drift rates as low as 0.001% of the recirculation rate. Most counter-flow designs do not allow sunlight to contact the cooling water, thus making algae less of a treatment concern. 51
Contrary to some prescriptive regulations, treatment programs for heating ventilation air conditioning (HVAC) cooling towers have not always included the use of an oxidizing biocide. Early members of AWT will recall a time when many middle-market accounts were routinely treated using a dual non-oxidizing biocide approach. Whether driven by the once-popular Wisconsin Protocol, competitive selling based on price, or well-intended regulations, the “necessity” of halogen or oxidizer chemistries appears to have been ingrained in a generation of water treaters almost without question. Some reflection regarding the need for and application of oxidizing biocides might be appropriate in an era when even experienced water treatment professionals do not the ANALYST Volume 29 Number 1
An Overview of Cooling Towers, Legionellosis, and Water Management Programs
continued
of high-efficiency drift eliminators, it was generally accepted that the occurrence of outbreaks associated with evaporative cooling systems was low and that implicated systems were associated with very high Legionella concentrations or the lack of an automated water treatment program.
think twice about manually adding undiluted granular halogen to a stainless-steel tower basin as part of a “routine” service. Developing the water treatment regime and water management program will require a clear understanding of both the quality and consistency of makeup water supplied to the evaporative cooling system. The possibility of sporadic increased bacterial loading from the makeup water, a process contamination, or other nearby industrial processes should be considered and addressed in the water management program process.
In Reference 6, AWT notes, “L. Pneumophila stands alone today as the single species responsible for more than 90% of legionellosis cases. More than 80% of these cases are attributed to only one serogroup—L. pneumophilia serogroup 1—one of more than 15 identified L. pneumophila serogroups.” The logical conclusion is that control limits for serogroup 1 should be lower than serogroups 2–14 based on risk of legionellosis. Conversely, serogroups 2–14 could have higher control limits compared to serogroup 1 without increasing risk. Environmental Safety Technologies (17) demonstrates a way to incorporate this concept into a water management program in its Legionella Report Interpretations and Recommendations document.
An industrial cooling tower using non-potable makeup water or cooling a process that contributes organic contaminants is likely to require a different water treatment program than an HVAC tower using municipal makeup water to air condition a building. There is no “one-size-fits-all” definition of a cooling tower, so there should not be a “one-size-fits-all” treatment program, whether in terms of selected biocide(s), feed rate or feed schedule, control limits, monitoring, validation, or corrective actions. As described in ASHRAE 188-2018, the program team has the responsibility for “developing, implementing, and maintaining the Program” as it relates to evaporative cooling and the other building water systems.
Control Limits, Testing, and Validation
The water treatment professional requires a clear understanding of their customer’s mechanical system to be able to select an appropriate treatment program that includes installation and operation of automated feed and control equipment. From this point in the water management program development, attention will likely turn to control limits, control measures, and validation. A decade before Pas-de-Calais, Shelton et al. (16) reported outbreaks associated with mean CFU/mL >1,500 while noting, “Colony counts from the two outbreak-associated facilities were significantly higher than colony counts from other facilities.” Even before the advent
The use of Legionella-specific testing as a validation step may be appropriate. Some references and regulations have suggested that a very low CFU/mL one-size-fits-all control limit is required to minimize the risk of legionellosis. These recommendations may be well-intentioned but are likely based on a limited understanding of the accuracy, precision, repeatability, and sensitivity of the test results available from current culture-based testing. Regarding a microbiological culture for Legionella, Swalla et al. (18) note, “Such methods are complicated by the use of multiple parallel testing approaches, optional treatment steps, and a requirement for significant analyst expertise and judgement. Furthermore, the accuracy of these methods may be affected by a variety of factors that increase measurement uncertainty, such as interference from non-Legionella organisms, subjective interpretation of test results, and differential performance of media and reagents.”
“Developing the water treatment regime and water management program will require a clear understanding of both the quality and consistency of makeup water supplied to the evaporative cooling system.” 52
the ANALYST Volume 29 Number 1
An Overview of Cooling Towers, Legionellosis, and Water Management Programs
continued
titled “Water Quality in Distribution Systems” notes, “Even after treatment, including disinfection, neither drinking water nor the distribution system are free of microbes. Every drinking water distribution system contains free floating (planktonic) microorganisms and surface-associated (such as biofilm and those attached to particles) microorganisms, which are important with respect to active biomass.” This document goes on to state, “Microorganisms present in biofilms can reach customers through changes in water quality or flow patterns. These changes result in sloughing or erosion of the biofilm from pipe surfaces and introduction of microorganisms into the potable water that moves through the distribution system pipes.”
A reread of a 2013 Analyst Technical Supplement article (19) titled “Validation of Hazard Control in Building Water Systems” could benefit the water treatment professional’s understanding of “the analytical problems associated with Legionella testing of building water systems.” In that article, McCoy et al. illuminate some of the scientific challenges associated with establishing aggressive control measures based on low CFU/ mL action levels. The possibility of false negative, false positive, and “amplified-positive” test results detailed in the article should help to challenge the assumption that a result of 20 CFU/mL, 50 CFU/mL, or even 80 CFU/mL represents a statistically different indication of either microbiological activity in or risk from a modern evaporative cooling system. An understanding of the advances made in drift eliminator efficiency would suggest that any of those results indicate a very low risk of legionellosis. ASHRAE 188-2018 allows the water treatment professional, as part of the program team, to develop a range of control limits that can be mapped to increasing levels of intervention as risk increases based on higher serogroup specific test results. Limiting the focus to cooling towers alone, however, has a demonstrated history of failing to reduce the incidence of legionellosis. The water management program should include all of the building’s water-use end points that present an opportunity for Legionella amplification and transmission.
Moving Beyond a Singular Focus on Cooling Towers
The water treatment professional is often uniquely positioned to help the owner evaluate potable and non-potable building water systems beyond the evaporative cooling system. During this phase of the risk management plan development, it can be helpful to recognize that the most common way for Legionella bacteria to enter the various building water systems is through the municipal water supplied to the building. The concept of Legionella bacteria entering the building water system along with the potable water is not a new one. The American Water Works Associations M68 (20)
53
Water service disruptions are noted in ASHRAE 188-2018, yet not all water management plans include notification requests to help identify when these upset conditions occur “upstream” of the building. Requesting notifications from the water utility can help the program team identify planned or unplanned events that could temporarily increase the variety or level of planktonic microorganisms entering the building water systems. Routine testing and tracking of the incoming water’s disinfectant residual may also assist the program team in identifying changes in the quality of water supplied to the various building water systems. The historical focus on “cooling towers first” or, worse, “cooling towers only,” will need to evolve for the framework laid out by ASHRAE 188 to be effective in reducing the incidence of legionellosis. The data presented in this article suggest that a continued myopic focus on evaporative cooling equipment alone will not reduce the incidence of disease regardless of how often it is trotted out or proclaimed as necessary. The time has come for water treatment professionals to help educate their customers on the need to broaden the water management evaluation to address risks from the source water supplied to the building through all building water-use end points. ASHRAE 188 provides the framework for the additional surveillance of all potable and non-potable water sources required to reduce Legionella proliferation so cases of legionellosis can be reduced.
the ANALYST Volume 29 Number 1
An Overview of Cooling Towers, Legionellosis, and Water Management Programs
References
continued
1. ASHRAE (2018). ASHRAE Standard 188: “Legionellosis: Risk Management for Building Water Systems.” American Society of Heating, Refrigerating and Air-Conditioning Engineers, Atlanta, Georgia.
15. Ganzitti, V.; Rincones, J. (February 2020). “Impact of Water Surface Tension on Drift Eliminators,” Paper No. TP20-19, Cooling Technology Institute.
3. The Minister of Ecology and Sustainable Development (in Paris, France) (December 13, 2004). Arrêté du 13 décembre 2004 relatif aux installations de refroidissement par dispersion d’eau dans un flux d’air soumises à autorisation au titre de la rubrique n 2921. (Order of 13 December 2004 on cooling installations by dispersion of water in an air flow subject to authorization under heading No. 2921.), accessible at http://www.admi.net/jo/20041231/DEVP0430480A.html. (Translated with www.DeepL.com).
17. Environmental Safety Technologies (n.d.) “Legionella Report Interpretations and Recommendations,” Rev 1.0., Louisville, Kentucky, accessible at www.estechlab.com.
2. HSE (1991). “Legionnaires’ Disease. The Control of Legionella Bacteria in Water Systems,” Approved Code of Practice and Guidance, United Kingdom Health and Safety Executive.
16. Shelton, B.; Flanders, W.; Morris, G. (1994). “Legionnaires’ Disease Outbreaks and Cooling Towers with Amplified Legionella Concentrations,” Current Microbiology, 28, pp. 359-63.
18. Swalla, B.; Knight, T.; Newport, V.; et al. (Spring 2019). “What Are Strategies for Reducing Uncertainty in Legionella Analysis?” Spring Analyst 26(2), pp. 37–51.
4. City of New York Local Law 77 (Aug. 18, 2015). “A Local Law to amend the administrative code of the city of New York, in relation to regulation of cooling towers,” accessible at https://www1.nyc.gov/assets/buildings/ pdf/ll77of2015.pdf.
5. City of Vancouver (November 2018). By-Law 12512, “A By-law to amend the Building By-law No. 12511 Regarding New Requirements for Certain Water Systems and Energy Efficiency,” accessible at https://council. vancouver.ca/ctyclerk/cclerk/20181205/documents/cfsc2.pdf. 6. AWT (2019). “Legionella 2019: A Position Statement and Guidance Document,” Association of Water Technologies, Rockville, MD.
7. New York City Department of Health and Mental Hygiene (Aug. 6, 2015). “Order of the Commissioner.”
8. City of New York (Aug. 11, 2015). “Transcript of the Minutes of the Committee on Housing and Buildings,” City Council City of New York.
9. City of New York (Dec. 3, 2015). “Notice of Adoption of Chapter 8 (Cooling Towers) of Title 24 of the Rules of the City of New York,“ New York Department of Health and Public Hygiene, New York, New York, details available at https://www1.nyc.gov/assets/doh/downloads/pdf/ notice/2016/noa-chapter8-title24.pdf. 10. Walser, S.; Gerstner, D.; Brenner, B.; et al. (2014). “Assessing the Environmental Health Relevance of Cooling Towers— A Systematic Review of Legionellosis Outbreaks,” International Journal of Hygiene and Environmental Health, 217, pp.145-54.
11. Nygard, K.; Werner-Johansen, O.; Ronsen, S.; et al. (2008). “An Outbreak of Legionnaires’ Disease Caused by Long-Distance Spread from an Industrial Air Scrubber in Sarpsborg, Norway,” Clinical Infectious Disease 46(1), pp.:61-9. 12. Hennon, K.; Wheeler, D. (February 2003). “Cooling Tower Emissions Quantification Using the Cooling Technology Institute Test Code ATC-140,” Cooling Technology Institute, Paper No. TP03-08. 13. Bulger, T.; Lane, J.; Miller, R.; et al. (October 2008) “Cooling Towers, Drift, and Legionellosis,” Paper No. IWC 08-21, International Water Conference, San Antonio, Texas.
19. McCoy, W.; Leonidas, L. (Summer 2013). “Validation of Hazard Control in Building Water Systems,” Summer Analyst Technical Supplement, pp. 15–21.
20. Smith, Kira S.; Slabaugh, R. (2017). M68 Water Quality in Distribution Systems, AWWA manual (M68), ISBN 9781625762269, American Water Works Association, Denver, Colorado.
Like his father and grandfather, Christopher Nagle began his water treatment career with Betz Laboratories. He started in the Entec division and earned several roles of increasing field responsibility through the BetzDearborn and GE Water years. During his 13 years with these companies, he gained extensive sales, service, and sales management experience by serving both heavy and middle market customers. Mr. Nagle moved to EVAPCO in 2007 as the director of sales and marketing for its newly formed water systems business. In 2010, he launched EVAPCO’s Water Treatment Partner program, which helped develop strong business relationships with many AWT companies. The following year, he took on an expanded role as vice president of Water Systems and began working with customers across the Americas, China, and Europe. He may be contacted at chris.nagle@evapco.com. This article is based on a presentation given at the 2020 AWT Interactive Annual Conference, which was conducted September 29–October 2, 2020.
14. Nguyen, T.M.; Ilef, D.; Jarraud, S.; et al. ( January 2006). “A Community-Wide Outbreak of Legionnaires’ Disease Linked to Industrial Cooling Towers—How Far Can Contaminated Aerosols Spread?” Journal of Infectious Diseases 193(1), pp. 102–11.
54
the ANALYST Volume 29 Number 1
C A N A D A
2022 Annual Convention & Exposition September 21–24, 2022 | Vancouver Convention Centre
SAVE THE DATE!
Scan the QR-code or go to https://bit.ly/3wEVuft to learn how to prepare to travel to Canada.
What to Look for When Analyzing RO and Demineralizer Makeup Ed Sylvester and Brad Buecker, ChemTreat, Inc.
56
the ANALYST Volume 29 Number 1
Reverse osmosis (RO) has become popular for primary makeup water demineralization at steam-generating power plants and other industrial facilities. Often, and especially for high-pressure units, RO is followed by ion exchange (IX) polishing. A one-time or “snapshot” water analysis is insufficient when designing and specifying RO and demineralizer systems. Snapshot analyses only offer partial data regarding the many impurities that can cause fouling and scaling, which in turn lead to poor performance and increased RO and demineralizer cleanings, regenerations, and perhaps even membrane or resin replacements. Problematic impurities or agents include the following:
Surface waters and treated surface waters—a major focus of this article—include rivers, lakes, and reservoirs. Groundwater supplied from wells is another source. Groundwater, especially from deep aquifers or that has percolated through thick sand formations, is often virtually free of suspended particles, microorganisms, and organic compounds prevalent in surface supplies. However, the dissolved solids content of groundwater, including hardness ions, may be quite high. Grey water, or reclaim water (i.e., treated municipal wastewater), is becoming more common for industrial plant makeup, especially in areas where fresh water is scarce. Reclaim water often introduces impurities that are otherwise present in low concentrations in fresh water.
Surface Water Overview
Suspended solids and fine particles that escape a clarifier and downstream conventional filtration and pre-filters. Chemicals such as oxidizing biocides. Coagulation and flocculation chemistry upstream of the RO or demineralizer. Microbiological organisms, large organic molecules. This article discusses the importance of detecting and quantifying potentially harmful constituents in makeup waters, how they can affect RO and demineralizer operation and performance, and mitigation methods.
Makeup Water Sources
Surface water chemistry often fluctuates significantly from both near-term and seasonal events. Heavy rainfall can dramatically increase suspended solids and colloid concentrations. Rivers are most prone to these changes, but lakes and reservoirs are also susceptible. In many areas of the country, rain will wash agricultural products and large organic molecules from decomposed vegetation into surface supplies. Seasonal changes and precipitation, or lack thereof, can influence the mineral content and subsequent potential for scale formation in makeup treatment systems. The following sections outline important makeup water constituents that require accurate analyses for subsequent reliable RO and IX system design.
Suspended Solids, Turbidity, and Silt Density Index Particulate accumulation in RO membranes is a leading cause of poor performance. Total suspended solids (TSS) measurements provide valuable data regarding potential fouling of RO membranes and IX resins. However, TSS analyses require a rather lengthy filtering and drying process, so turbidity often serves as a surrogate. Online, continuous turbidity measurement is a mature technology. Particulate fouling in RO membranes typically
The makeup source (surface, ground, or reclaim water) is very important, as atmospheric, geologic, and sometimes manmade factors greatly influence the type and number of impurities in any supply. If the source has already undergone some conditioning (e.g., municipal water treatment), additional influences may be present. Numerous impurities can impact the material integrity, performance, and cleaning frequency in RO and demineralizer systems. For example, many RO manufacturers claim a standard quarterly cleaning frequency. However, without proper pretreatment based on accurate analyses, the frequency may be much higher, perhaps monthly or even more often. This is not only frustrating for plant personnel but increases operating and chemical cleaning costs and may shorten equipment life.
“Particulate accumulation in RO membranes is a leading cause of poor performance.” 57
the ANALYST Volume 29 Number 1
What to Look for When Analyzing RO and Demineralizer Makeup
continued
occurs in the first stage and increases the pressure drop across the membranes. This, in turn, decreases productivity and permeate purity. The specific test to evaluate particulate fouling potential is silt density index (SDI). An SDI of less than 5 and a turbidity of less than 1 nephelometric turbidity unit (NTU) constitute a minimum recommendation, but an SDI of 3 or less is optimal. Testing for SDI is relatively straightforward. A flowing sample of RO feedwater, downstream of the cartridge filters, is filtered through a 0.45-micron (µm) filter at 30 pounds per square inch gauge (psig) pressure. Measurement is taken of the time for 500 milliliters (mL) of water to pass through the filter at the beginning of the test (ti) and again after 15 minutes (tf ). The SDI is calculated as shown in Equation 1. SDI15 = (1-(ti /tf ))/T x 100
Eq. 1
Consider the following example, taken from an operating RO unit. ti = 34 seconds tf = 66 seconds T = 15 minutes SDI15 = 3.2
Figure 1. Basic schematic of a common high-purity makeup water system.
Feed Micro- or Ultra-filter
Reverse Osmosis Unit
Effluent to Process IX Polisher or Electrodeionization Unit
For some older plants, or those served by municipally treated water, primary pretreatment may involve clarification and downstream multimedia filtration. As outlined in a later section, some common chemicals used for coagulation and flocculation in clarifiers can cause severe RO membrane fouling, particularly if overfeed occurs. Clarifiers, most notably, older style, low-rise rate models, often require time to adjust to changes in water temperature or flow rate. These variables may induce particulate and treatment chemical carryover. RO manufacturers and reputable water treatment companies offer RO monitoring programs that continuously collect RO operating data and then normalize the data to account for temperature changes and other factors that can artificially influence performance calculations. Particulate and microbiological fouling and scale formation are revealed by increased membrane pressure differential and decline in permeate purity.
SDI test kits are readily available, and it is highly recommended that SDI tests are run regularly to monitor inlet RO conditions. In IX units not protected by upstream RO systems, high solids loading can lead to increased pressure drop, resulting in channeling and short run times.
Dissolved Solids and Conductivity Dissolved solids analyses, typically measured as total dissolved solids (TDS), are a very important measurement for RO units and demineralizers. For RO systems, TDS impacts the osmotic pressure of the feedwater, which in turn influences permeate production. For IX units not pretreated by RO, high TDS will reduce capacity and increase regeneration frequency.
Minimizing suspended solids and particulate ingress to makeup treatment equipment is a top priority. RO units are nearly always equipped with cartridge filters, and sometimes even bag filters, to remove fine particles of 10 µm or less in diameter. However, pretreatment with micro- or ultrafiltration for particulate removal is becoming increasingly popular at many plants. Even basic microfiltration can reduce inlet turbidity to well below 0.1 NTU. Figure 1 is a schematic of a simple deionization water treatment system.
Like TSS measurements, direct TDS analyses involve a rather lengthy drying procedure. Thus, specific conductivity is a typical surrogate for quick evaluation of dissolved solids concentration. A common rule of thumb suggests that TDS for fresh or potable water can be reasonably estimated by multiplying the conductivity value by 0.67 microsiemens per centimeter (µS/cm). This is just a general guideline, and tests should be conducted at every plant to determine a more accurate correlation for the specific water supply. 58
the ANALYST Volume 29 Number 1
What to Look for When Analyzing RO and Demineralizer Makeup
continued
Beyond basic TDS, periodic analyses for common and some trace cations (calcium, magnesium, sodium, barium, strontium, aluminum) and anions (bicarbonate alkalinity, chloride, sulfate, fluoride, phosphate) are necessary to properly evaluate scaling potential in RO and IX units, and to select appropriate chemical treatment programs. Scaling is a common problem in the RO second stage, where the feedwater has become concentrated from upstream permeate extraction. Potential deposits include calcium carbonate; magnesium and aluminum silicates; silica; calcium, barium, and strontium sulfates; and metal phosphates. Additional discussion of some of these precipitates appears in later sections of this article.
Microorganisms Microorganisms, primarily bacteria in makeup systems, can cause severe fouling in RO membranes. Figure 2 shows RO membranes with biofouling on the ends.
Figure 3: Some of the most common bacteria species that grow within sessile colonies.
If fouling has occurred, you can typically find microbial slime in the cartridge filters ahead of the RO system; if the organisms have settled there, the bacteria are probably in the RO membranes as well. For these reasons, a common recommendation is to maintain a biocide residual in the makeup piping through the cartridge filters and then inject a reducing agent. The next section discusses this idea further. It is good engineering practice to periodically test for bacteria in the feedwater and RO reject. With proper treatment, organism counts should be ≤ 100 colony forming units (CFUs)/mL in the feedwater and 1,000 CFUs/mL in the RO reject.
Figure 2: Serious microbiological fouling, visible at the inlet end of an RO membrane. Photo by Brad Buecker.
If reclaim water serves as the makeup, frequent microbiological testing is recommended, perhaps semi-weekly. Reclaim waters not only contain many microorganisms, but elevated concentrations of the nutrients shown in Figure 3 above as well. Table A offers a comparison of the chemistry between four freshwater supplies and four reclaim waters.
Microbial tests of bulk water are more common for cooling systems, but an understanding of what can happen in makeup systems is important. The microbes in bulk water are primarily aerobic and utilize oxygen for metabolic processes. However, without treatment, the organisms can settle into colonies that produce a protective slime layer. Within these sessile colonies, many other organisms, including facultative and anaerobic bacteria, may flourish. Some of the most common are shown in Figure 3. 59
“If fouling has occurred, you can typically find microbial slime in the cartridge filters ahead of the RO system.” the ANALYST Volume 29 Number 1
What to Look for When Analyzing RO and Demineralizer Makeup
continued
Table A: A Comparison of Reclaim Water Chemistry With Fresh Water Oak Ridge, TN
Lansing, MI
Grey Water, McAllen, TX
Grey Water, Forney, TX
Grey Water, Sonora, MX
Grey Water, Pittsburg, CA
Analyte
Minteral, VA
Carterville, GA
pH
7
7.1
7.6
7.8
7.4
6.9
7.7
7.9
Conductivity
70
98
302
729
2,400
1,162
1,643
1,792
M-Alkalinity
28
34
106
299
118
97
417
256
Ca Hardness
9
24
102
231
393
183
91
117
Mg Hardness
10
13
46
125
191
35
52
99
Iron
0.1
0.3
0
0.4
0.1
0.1
0.1
0.1
Sodium
3
3
5
13
291
156
296
230
Potassium
2
2
1
2
26
21
14
15
Chloride
4
4
12
16
443
174
214
293
Sulfate
6
5
22
66
412
176
203
218
Silica
11
7
6
14
23
18
29
19
Nitrate
0
0
1
1
75
69
0
1.5
Ammonia
0
0
0
0
2
0
27
38
Ortho PO4
0
0.4
0
0
10
12
5.9
0.7
Note: The elevated levels of many constituents, including nitrate, ammonia, and orthophosphate. Organic concentrations are also typically elevated. sanitization) properly, microbes may enter the RO feed and cause downstream problems.
One very important note: the biocide feed system should always be properly maintained and operated, especially when using reclaim water. Once microbes have settled and formed sessile colonies, the slime and accumulated silt can be very difficult to remove.
Oxidizing Biocides As the previous section outlined, microbiological fouling of makeup treatment systems, particularly RO membranes, can be very problematic. Oxidizing biocide treatment is normal for makeup (and, of course, cooling) systems, with chlorine (usually introduced as liquid bleach) being the most popular choice. Chlorine is a powerful oxidant that can damage RO membranes and IX resins, but maintaining a chlorine residual up to the RO inlet is common for inhibiting microbial growth. Thereafter, the concentration must be lowered below 0.1 parts per million (ppm) to protect RO membranes. The two primary methods for chlorine removal are activated carbon (AC) filtration and reducing agent treatment. Once-common AC filtration has come under scrutiny because chlorine removal occurs at the top of the bed, and those microbes that survive the biocide can revive and proliferate in the lower portion of the bed. If the carbon beds are not replaced or regenerated (steam
Reducing-agent injection has become very common, with liquid sodium bisulfite (SBS) as a popular choice. SBS reacts quickly with chlorine. In proper concentrations, SBS can serve as a nonoxidizing inhibitor of biological growth, particularly aerobic bacteria (1). The recommended injection point is just after the cartridge filters to maintain a biocide residual up to the RO membranes. Online chlorine analyses are one method to monitor the pre- and post-removal streams for chlorine content, and mature, reliable instruments are available. An alternative, or supplement, to chlorine monitoring is oxidation-reduction potential (ORP). It measures the full oxidizing or reducing potential of a water supply and can provide beneficial readings. Some plants combine chlorine and ORP instrumentation for extra security. Additional RO biofouling protection is possible with periodic (perhaps a few hours per week) nonoxidizing biocide feed. The injection point can be placed just ahead of the RO cartridge filters. Such treatments can be very effective, but careful consideration of the product is
60
the ANALYST Volume 29 Number 1
What to Look for When Analyzing RO and Demineralizer Makeup
continued
necessary. Also, because the RO reject at many plants discharges to an outside body of water, even testing of a product, let alone permanent application, must be approved by the plant’s regulatory agency.
Total Organic Carbon (TOC) Naturally occurring organics in raw water include large humic and tannin molecules, commonly at concentrations of 0.5 to 20 mg/L. If the TOC concentration exceeds 3 mg/L, further pretreatment options should be considered for RO feed. Similar concentrations can foul anion exchange resins and limit capacity, as well as increase regeneration frequency and length. Furthermore, organic carbon serves as food for some microbes, and high TOC can enhance microbiological activity. Accordingly, multiple TOC analyses that account for short-term and seasonal changes should be performed prior to makeup system design to ascertain if treatment is needed. Pretreatment can include clarification, ultrafiltration, or AC filtration. As noted, AC filtration dechlorinates the stream, which can promote microbial growth within the bed and downstream.
Metal Foulants Iron, manganese, and aluminum occur naturally in many raw water supplies, with iron and manganese being the most prevalent. Groundwaters typically have the highest concentrations. Iron and aluminum compounds are common clarifier coagulants, and carryover of either element, particularly aluminum, may foul RO membranes. It should be noted that carryover of some clarifier polymeric flocculants may also foul membranes. Both iron and manganese in the presence of an oxidizer, such as chlorine, can catalyze membrane oxidation. Thus, tests for these elements are necessary during the design phase of a project. The generally accepted upper limit for iron and manganese in RO makeup is 0.05 ppm, which is also a good guideline for IX resins. A standard treatment method for streams with elevated iron and/or manganese content is greensand filtration; however, careful control of permanganate injection is important, as regenerant overfeed can be detrimental to downstream equipment. Aluminum can precipitate with silica to generate adherent aluminum silicate deposits on RO membranes. Such deposits may form, even when silica concentrations are well below the normal saturation limit. 61
Phosphorus and Ammonia The following discussion particularly applies to reclaim water makeup sources. While lab reports for these supplies typically list phosphorus (P) as the element, phosphorus never exists in its elemental form in nature. Orthophosphate (PO4) is the typical compound in natural and reclaim waters, where a multiplication factor of 3.07 converts P to PO4. Analytical techniques for phosphate, notably UV-VIS spectrophotometry, are very straightforward. Besides being a primary biological nutrient, phosphate forms precipitates with many metal ions, including calcium, magnesium, aluminum, and iron. Calcium phosphate (Ca3(PO4)2) is the most common, and the most troublesome. For RO units with freshwater makeup, phosphate and other scale-forming mineral concentrations may be low enough to be controlled by antiscalant feed. But for alternative supplies, such as reclaim water, pretreatment may be critical to minimize phosphate deposition. Most phosphate will precipitate in clarifiers, particularly those that use iron or aluminum coagulants. Technologies such as membrane bioreactors (MBR) and moving-bed bioreactors (MBBR) are increasingly popular choices for reducing phosphate, ammonia, and organic carbon concentrations in reclaim water supplied to the plant. If desired, these systems can be enhanced to also remove nitrites and nitrates, further reducing the potential for downstream microbiological activity. Ammonia is, of course, a prominent constituent in reclaim water streams. However, in many potable supplies, some ammonia is present as a result of chloramine feed for microbiological control in service water piping. Ammonia is another primary nutrient for microorganisms; thus, testing any supply for ammonia is recommended for proper system design and subsequent operation. At the pH levels common in most makeup supplies, ammonia appears in the ionic form as NH4+ and will be rejected by the RO and ion exchange. (The cation will remove the ionic form of ammonia.) Figure 4 shows ammonia speciation as impacted by pH.
the ANALYST Volume 29 Number 1
What to Look for When Analyzing RO and Demineralizer Makeup
continued
Figure 4: Ammonia speciation as a function of pH. Source: See Reference 2.
Figure 5: Alkalinity/pH relationship in natural waters.
In systems where some ammonia may reach the RO, a small amount of ammonia may also pass into the permeate.
Carbon Dioxide (CO2) As previously noted, calcium carbonate (CaCO3), is a common deposit in water treatment systems. Scale forms when calcium ions react with bicarbonate ions (HCO3-). The reaction is triggered by temperature (scale formation 62
in home hot water systems is a classic example) and concentrating effects, the latter of which naturally occurs in RO systems as the feed becomes more concentrated during passage through the unit (Equation 2). Ca 2+ + 2HCO3- → CaCO3↓ + CO2 + H 2O
Eq. 2
In most waters, the predominant alkalinity species ion is HCO3-, as is illustrated in Figure 5. the ANALYST Volume 29 Number 1
What to Look for When Analyzing RO and Demineralizer Makeup
continued
Obviously, testing for calcium and alkalinity concentrations is a key aspect for selecting RO antiscalant chemistry. But, as the diagram indicates, at the pH of many water supplies, some free carbon dioxide may exist, represented on the diagram as carbonic acid (H 2CO3). RO membranes do not remove CO2, which will pass into the permeate, lowering the pH and potentially presenting downstream corrosion issues. Any CO2 present will place an ionic loading on downstream ion exchange equipment especially mixed beds, which are commonly used to polish RO permeate. For that reason, most two-pass RO systems include trace caustic (NaOH) injection into the first-pass permeate discharge to the second pass. Any free CO2 is converted to bicarbonate/ carbonate alkalinity for removal in the second pass. The formula to determine the CO2 concentration in a water supply is shown in Equation 3. [CO2] = Total Alkalinity (ppm as CaCO3) 10 pH – 6.3
Eq. 3
Hydrogen Sulfide Hydrogen sulfide gas, which has the familiar rotten egg odor, is often found in groundwater. The compound can be very corrosive, and in even seemingly low concentrations are extremely poisonous. With air contact, hydrogen sulfide will revert to elemental sulfur, but if groundwater makeup is pumped directly to an RO, it will enter both the permeate and reject streams. The gas can be removed in a degasifier or stripping tower, with pH adjustment to enhance removal. The graph in Figure 6 shows the volatility of hydrogen sulfide as a function of the pH level. Figure 6: H2S volatility as a function of pH.
“Obviously, testing for calcium and alkalinity concentrations is a key aspect for selecting RO antiscalant chemistry.” Bleach or other oxidizing biocides will convert hydrogen sulfide to sulfates, elemental sulfur, or metal sulfides. Onsite testing is necessary to accurately determine hydrogen sulfide concentrations, and test kits are available. A simple “sniff test” is possible to initially reveal the presence of H 2S by adding a few drops of hydrochloric or sulfuric acid to a sample and agitating the sample bottle. The rotten egg odor will be quickly evident.
RO Normalization Programs Makeup water temperature is an important factor to consider when evaluating membrane and demineralization performance. In RO systems, the feedwater stream is inversely proportional to the viscosity of the water temperature. As a general rule, for every 1 º C increase in water temperature, the flux increases by approximately 3%. For IX, a 10 °C increase in water temperature increases the IX system kinetics two-fold. Obviously, temperature significantly impacts RO operation, where temperature changes can mask membrane fouling, scaling, or other problems. For any plant with a RO unit, it is highly recommended to have a normalization software program and trained personnel who can analyze the data. A rule-of-thumb guideline recommends membrane cleaning after a 10% loss in normalized permeate production. Operation beyond this limit risks permanent membrane damage.
Conclusion
Loss of makeup water production has the potential to affect the plant’s production schedule. Accurate knowledge of the constituents in makeup water supplies is vital for the design and operation of high-purity water production at industrial and power facilities. In some cases, continuous online analyses are necessary to protect systems from sudden upsets that could cause major damage. At other times, periodic grab samples may be sufficient.
63
the ANALYST Volume 29 Number 1
What to Look for When Analyzing RO and Demineralizer Makeup
continued
Of course, each system is different and has unique treatment needs, and due diligence is necessary for determining the feasibility for using these methods. Always consult your equipment manuals and guides and contact a water treatment professional before making changes to your systems and treatment processes.
References
1. Hydranautics ( June 2016). Hydranautics Technical Service Bulletin, TSB 110.13, p. 5, Hydranautics, Oceanside, California.
2. Emerson, K.; Russo, R.C.; Lund, R.E.; Thurston, R.V. (1975). “Aqueous Ammonia Equilibrium Calculations: Effect of pH and Temperature,” Journal of the Biological Board of Canada (succeeded by Canadian Journal of Fisheries and Aquatic Sciences in 1980).
Ed Sylvester is the director of filtration, ion exchange, and membrane technologies at ChemTreat. He has more than 41 years of experience in water treatment, including product development, troubleshooting, corporate training, and conference presentations. Mr. Sylvester may be contacted at edwards@ chemtreat.com.
Brad Buecker is senior technical publicist with ChemTreat. He has more than 40 years of experience in or affiliated with the power industry, with nearly two decades of it in steam generation chemistry, water treatment, air quality control, and results engineering positions at City Water, Light & Power (Spring field, Illinois) and Kansas City Power & Light Company’s (now Evergy) La Cygne, Kansas, station. Also included in this experience is 11 years at two engineering firms. Mr. Buecker has authored many articles and three books on power plant water/steam chemistry and air pollution control topics. He has a B.S. in chemistry from Iowa State University. He is a member of the ACS, AIChE, AMPP (formerly NACE), ASME, AIST, and CTI (corporately). Mr. Buecker can be reached at bradley.buecker@ chemtreat.com.
de co o 5 off om T1 pr AW 15% e Us 21eive c re to
PREMIXED PREMEASURED PRECISE Visual and Instrumental Test Kits available for Low Range Dissolved Oxygen (ppb), Ammonia, Bromine, Carbohydrazide, Chlorine, Conductivity, DEHA,
Filming Amine, Hardness, Hydrazine, Iron, Molybdate, Nitrite, pH, Phosphate, Sulfide, and more
We’re proud of our 50-year track record of providing water
n
Superior quality
analysis test kits to the Water Treatment Industry. Count on
n
Rapid results
us for #SimplicityInWaterAnalysis as well as our...
n
Friendly, personal service
n
Low cost per test
n
Speedy order processing
n
World-class technical support
*Discount doesn’t apply to instruments and ULR CHEMets® products.
800.356.3072 | www.chemetrics.com
64
the ANALYST Volume 29 Number 1
Membership Benefits
Online Safety Training Courses AWT partners with The Marcom Group, Ltd. to provide online safety training courses. The program allows you to train, test, and track the safety training of you and/or your employees. There are hundreds of courses to choose from, and the system offers you easy reporting tools to monitor training progress. Some of the courses include: Confined Space Entry
AWT members might be particularly interested in the Working Safely With Industrial and Commercial Water Treatment Chemicals course. This course presents fundamental information for employees on how to work safely with industrial and commercial water treatment chemicals. Upon completing the course, employees should: Be able to identify potentially hazardous water treatment products.
Dealing With Hazardous Spills Distracted Driving
Be able to recognize signs of over exposure and know safe work practices that can help them to avoid it.
DOT HAZMAT General Awareness
Know how to treat an exposure to hazardous chemicals and how to handle and clean up spills.
DOT HAZMAT Safety Training DOT HAZMAT Security Awareness
Sign up today at https://www.awt.org/education/ safety-training/.
GHS Container Labeling GHS Safety Data Sheets Lock-Out/Tag-Out Personal Protective Equipment
65
the ANALYST Volume 29 Number 1
Industry Notes AWT Call for Volunteers!
AWT recently established the Produced Water Task Force and is looking for volunteers to join the group. Produced water is a term used in the oil industry to describe water that is produced as a byproduct during the extraction of oil and natural gas. Individuals working in this field are using the same technology that AWT members use in their day-to-day work. This task force will develop material to support education in this area, including developing articles, treatment tips, regulatory guidelines, webinars, and more.
H2O The ASTM inclusion further demonstrates that water treaters can rely on Legiolert results to make more informed decisions on Legionella risk for their customers. For more information, visit idexx.com/ legiolertdifference.
H2SO4
ResinTech Starts Production of NonSolvent Resins
If you are interested in participating, please contact the task force chair, Scott Bryan, CWT, Cortec Corporation, at sbryan@cortecvci.com.
Ion exchange manufacturer, ResinTech, Inc. has begun commercial production of its flagship line of non-solvent cation resin. The company recently received the Water Quality Association’s (WQA) Gold Seal certification for the water softening media.
IDEXX’s Legiolert Test Published as ASTM Standard
On December 22, 2021, ASTM International published ASTM D8429-21: Standard Test Method for Legionella pneumophila in Water Samples Using Legiolert. The standard was developed by Subcommittee D19.24 on Water Microbiology and passed by Committee D19 on Water. The inclusion of Legiolert as an ASTM standard is an additional testament to the product’s quality and reliability.
Historically, the bulk of the ion exchange resins manufactured outside of the United States were made using solvents like ethylene dichloride (DCE), a suspected carcinogen. The absence of the chemical from ResinTech's process helps reduce the public’s exposure to the chemical.
ASTM International is an international standards organization that develops and publishes standards applicable to a wide variety of industries. There are over 12,500 global ASTM standards, developed and reviewed by over 30,000 technical experts from 140 participating countries. This is the second global standard inclusion for Legiolert after being included in the book of methods for Legionella testing in UK. It has also been independently evaluated and granted NF validation by the prestigious Association française de normalisation (AFNOR), and extensively compared to traditional methods for quantifying Legionella. There are currently 11 peer-reviewed method comparisons evaluating Legiolert, all of which have found the method to be as or more sensitive than traditional Legionella detection methods.
66
"The people here recognize how the work we do impacts consumers around the world," said Joe Mandara, ResinTech's plant manager. "With nearly a million cubic feet of softening resin sold yearly in the US, making billions of gallons of softened water, ResinTech’s solventfree manufacturing approach assures that water made from our resins will be free of harmful solvents. I could not be more proud of our production team." ResinTech process engineer Ben Appland (left) and plant manager Joe Mandara (right) in front of the sulfonation vessel processing ResinTech's first batch of non-solvent cation resin.
the ANALYST Volume 29 Number 1
Industry Notes continued
Glass-lined sulfonation tanks at a ResinTech factory in Camden, NJ.
ResinTech's new campus has created over 400 jobs, more than one-third of which have been filled by residents in the local Camden community. The resin factory, the first new chemical plant of its kind to be built in the United States in over three decades, is capable of manufacturing up to half a million cubic feet of the signature black cation every year in a variety of mesh sizes and crosslink ranges. The company is already considering an expansion to add even more production capacity. ResinTech President Larry Gottlieb explained the significance of the milestone: "This is the culmination of more than five years of planning and development. We built this plant with three goals in mind—to bring our business units together for greater efficiency, to create jobs here in the U.S., and to make the highest quality products in the most environmentally friendly way possible. It's a great feeling to be able to confidently say we've done all three and we're ready to scale production." For more information visit www.resintech.com.
The VpCI®-649 Series encompasses a range of unique concentrated liquid formulations that protect ferrous and non-ferrous metals from corrosive solutions such as hydrotest water. They are also designed to provide longterm protection in fresh water and glycol closed-loop systems. VpCI®-649 combines contact and vapor phase corrosion inhibitors—along with antiscalants for hard water stability—in a formulation that does not contain nitrites, phosphates, or chromates. This helps solve the problem of disposal, particularly for large quantities of water. For those facing tightening molybdate restrictions, the VpCI®- 649 Series includes molybdate-free versions with a PTSA tracer for easy detection. Many more options exist and can be tailored to specific application parameters thanks to the flexibility of the VpCI®-649 Series. For more information, ask your water treatment service provider or contact Cortec®: https:// www.cortecwatertreatment.com/contact-us/.
VpCI®-649 Series: Solving Corrosion Problems for Hydrotesting and Water Treatment Applications Worldwide!
Hydrostatic testing simultaneously solves a problem and creates one. So does a closed-loop or cooling water system layup. In the first case, the introduction of high-pressure water to a pipe, valve, or tank confirms no leaks exist, but it elevates the risk of corrosion. In the second case, while closed loop or cooling water system shutdown is sometimes needed for seasonal periods of inactivity, it leaves equipment vulnerable to corrosion if proper precautions are not taken. Fortunately, these tasks can successfully be carried out with the ease and effectiveness of VpCI®-649 Series corrosion inhibitors from Cortec® Corporation. 67
the ANALYST Volume 29 Number 1
EAST March 30–April 02, 2022 • Cleveland Marriott Downtown at Key Tower • Cleveland, Ohio
Categories
RO/Ultrafiltration Sales Fundamentals and Applications Water Treatment Wastewater Treatment
To learn more, scan the QR-code or go to www.awt.org/technical-training-2022.
Save on everyday business needs. AWT understands and supports your personal and professional needs. That is why we have leveraged the buying power of our members to deliver business solutions and services that can help control costs and improve your bottom line.
Featured Products and Services
Save up to 30% off base rates with Pay Now, plus get other great offers. Use Discount Code: D423508.
Save up to 35% off base rates with Pay Now, plus get other sweet deals. Use Discount Code: D836610.
Heartland® offers solutions to help you run your business better. Including innovative payment and point of sale solutions to payroll and HR solutions.
Save up to 70% on audio and web conferencing services.
Save up to 75% off the officedepot.com regular prices on our Best Value List of preferred products. Member get free next-business-day shipping on qualifying orders of $50 or more.
Enhanced discounts to include saving 50% on Domestic Next Day and 30% on Ground Commercial and Residential shipping. Savings start at at least 75% on LTL (less-than-truckload) shipments. Plus, receive transactional insurance for your small package shipments.
For more information, visit: www.1800members.com/awt or call 1-800-MEMBERS (800-636-2377), M-F, 8am-5pm, ET.
Discovering AWT
Staff Note: We are excited to introduce a new section in the Analyst, “Discovering AWT.” This column will feature short profiles highlighting AWT member companies. We plan to feature three companies in each issue, with the goal of highlighting as many members as possible. All companies will respond to the same questions, and answers will be brief and avoid commercial overtones. The purpose is to get to know more about your fellow member companies. We are starting this section by featuring AWT Supplier of the Year Award winners. From there, the editorial team will reach out companies to solicit their profiles. If you are interested in being profiled, please contact our technical editor, Mike Henley at (303) 324-9507 or mdhenleywater@gmail.com.
ZIBEX, Inc.
P.O. Box 3009 Duluth, GA 30096 Phone: (770) 417-1426 Fax: (770) 417-1429 ZIBEXINC@cs.com
Company History ZIBEX was incorporated in 1999 as a specialty additives supplier to companies that blend and sell to end-users for water treatment, geothermal, and petrochemical applications. The initial focus in the industrial water treatment (IWT) market was supplying specialty chemicals to control scale and corrosion in cooling and process water systems. This was later expanded to include biocides to control microbiological activity in a range of IWT applications and related markets. Current Business Currently, ZIBEX provides polymers, phosphonates, corrosion inhibitors, reverse osmosis antiscalants, biocides, and dual-containment tanks to blenders and water service companies serving a range of water treatment markets, including industrial, mining, pulp and paper, and municipal applications. ZIBEX represents material suppliers Lubrizol Carbosperse™ K-700 polymers, Albemarle Corp., Wincom, Inc., Aquapharm Pvt., Innovative Water (Sigura Water), and Peabody Engineering. ZIBEX not only provides additives and equipment to the IWT market, the firm also routinely conducts laboratory and field studies to investigate the applications of the products we support. This information is documented in technical papers presented at AWT, NACE, and other conferences. Some of these papers have been published by AWT in The Analyst. 70
Geographic Areas Served ZIBEX provides nationwide distribution to East Coast, West Coast, and Midwest shipping points. AWT Membership Company founder John Zibrida has been a member since 1987. ZIBEX has been an AWT member since 1999. AWT Awards ZIBEX was awarded the inaugural Supplier of the Year award in 2005 by AWT, and in 2019, Mr. Zibrida received the Ray Baum Memorial Award. In addition to AWT, Mr. Zibrida currently serves on the board of directors of the Cooling Technology Institute. Top Executives Mr. Zibrida, President; Gayle Gutierrez, Operations; Ron Bazar, Sales Manager; and Patrick Sullivan, Sales/ Technical Manager.
the ANALYST Volume 29 Number 1
Discovering AWT continued
Masters Company, Inc. 890 Lively Boulevard Wood Dale, IL 60169 Phone: (630) 238-9292 www.masterscoinc.com
Company History Masters Company, Inc. (MCI) was founded in 1961 as the Czemske Chemical Co. Czemske Chemical originally specialized in serving the laboratory supply distribution marketplace with laboratory reagents and solvents. One of the founders later became an executive in an international water treatment service company and the company, then known as MCI, expanded into providing test kits and reagents. As its business evolved, MCI became an almost one-stop shopping place with private label blending, specialty distribution, and other allied water treatment industry products and services.
Business Units MCI’s LiquiLogic, LLC division provides highly concentrated treatment products that are pre-mixed and ready to use in specialty dispensing systems. LiquiLogic’s highly concentrated products include biocides and ultra-concentrated treatments for boilers and steamlines, cooling towers, and closed-loop systems.
Current Business Today, MCI’s involvement in the water treatment field includes a wide and diverse offering of test kits, reagents, toll blending, specialty treatment products, specialty distribution, laboratory services, custom formulations, RO treatments/cleaners, and product line consultations. The specialty distribution products range from raw materials, polymerics, and corrosion inhibitors to specialty containers and an assortment of testing equipment and allied items. MCI also manufactures a variety of other analytical/quality control test reagents, food-sanitation test kits, specialty testing, and treatment products. More than several innovative industry-leading specialty test methods or specialty application products have been developed by MCI during the company’s history. We specialize in providing customer service combined with a focus on innovation and product development. Markets served by MCI include commercial and industrial water treatment, food safety, fuel oil applications, and education/scientific.
71
Current Business Locations MCI’s 28 associates currently provide all goods and services from the Wood Dale, Illinois, location. The company serves all parts of the United States and North America. We also export to a variety of European and Asian countries. AWT Membership MCI joined AWT in its early infancy and has been a proud member and advocate since the first day we joined the organization. At the 2014 AWT annual conference, MCI was named the Supplier of the Year. Top Executives Janet Garcia, Vice President; Teresa Williams, Business Manager; Maria Castellanos, Business Manager; and Garret S. Garcia, Technical Director.
the ANALYST Volume 29 Number 1
Discovering AWT continued
Taylor Technologies, Inc. 31 Loveton Circle Sparks, MD 21152 Phone: (410) 472-4340 www.taylortechnologies.com
Company History Taylor Technologies was founded in 1930 as W.A. Taylor & Company by Dr. William Taylor. Industrial water testing was the company's focus at this time, with a goal to make the world's best products for water analysis. Throughout the years, and under the leadership of various owners, the company would enter the pool/spa market and eventually become a leading manufacturer of water testing equipment worldwide.
Current Business Locations Taylor’s manufacturing plant is located in Sparks, Maryland. This plant not only blends, bottles, and packs products but also houses a plastics shop that produces the majority of our bottles, caps, comparators, cases, and sample tubes. We are insulated from much of the supply chain challenges many companies face. Our business is mainly in North America, but our total reach is worldwide.
Current Business Ownership recently changed from Stephen Heard to Fluidra, a Barcelona, Spain, based multinational company, which bought Taylor in November 2021. Taylor maintains its focus on water quality testing products for industrial, commercial, and residential applications. The company makes instruments, test stations, test kits, test strips, reagents, and accessories. Its instruments use digital and colorimetric technologies. Examples of water quality parameters measured by Taylor products include pH, alkalinity, hardness, chlorine, organophosphate, metals, and filming amines. Applications for the company’s products include boiler and cooling water, laundries, water conditioning, water service professionals, health officials, and residential.
AWT Membership Taylor Technologies has been a member of AWT from its earliest beginnings—at least 30 years. Our employees have continuously served as AWT volunteers and have participated at the AWT annual conventions since their inception. Today, our employees continue to serve on and devote time to AWT committees.
72
AWT Awards In 2013, Taylor was named the Supplier of the Year, and in 2018, Chris Golden, the firm’s director of sales, received the Ray Baum Award. Top Executives Stephen Heard, Senior Vice President/General Manager; Michael Walsch, Vice President of Administration and Chief Financial Officer; and Wade Beebe, Vice President of Sales and Marketing.
the ANALYST Volume 29 Number 1
CWT Spotlight
Michael Castro, MPH, CWT Special Pathogens Laboratory Chandler, Arizona
How did you prepare for the test? I typically prepare for things methodologically, but others may call it obsessive preparation. It might sound odd, but honestly, the first thing I did was to sign up and set a date for the exam. Several of my peers convinced me to not procrastinate or over-prepare when I hinted that I was interested in taking the exam. For those like me who might waste time late at night studying too much, I recommend setting a date two to three months out.
that AWT has online. In hindsight, I don’t think I needed the training videos, but there was great value in reviewing the slide decks from these presentations. I took the slides and marked them up, highlighting concepts I needed to review or key areas I believed would be on the exam.
Second, I needed to evaluate my current level of competency after a gap of eight years where I was not actively consulting or performing water treatment service. Some water chemistry fundamentals and calculations I will never, ever forget in my life, but there were others where I definitely needed a refresher (like the liquid:vapor ratios of amines). Upon selecting a date, I received a practice exam and answered the questions based on my gut instinct. I got a score in the 80% range. The next day I took the practice exam again and scored worse— around a 68%. I was overthinking my answers. I set my preparation schedule from this assessment.
Why do you feel this credential was important to have? I have always felt compelled to provide the most knowledge I can to the company I’m working for and the customers I’m serving. Earlier in my career, and upon the recommendation of Eugene Livar (chief, Bureau of Epidemiology & Disease Control of the Arizona DOH), I received a master’s degree in public health (MPH). I took Eugene’s advice to differentiate myself as a product manager in the world of environmental water safety. And, after my two young children are a little older, I plan to pursue a Ph.D. in microbiology. (My wife and I want to be fully present and supportive during the wonder years!) In the meantime, I'm taking advantage of the resources around me, which included getting my CWT.
Every night I set aside about an hour to take two to four short practice exams from the AWT Online Training Platform. Any questions I didn’t know, I would read the associated literature to confirm what I was missing. Once I completed the tests, I realized I wasn’t far off from passing the exam. This was the confidence boost I needed to go into the exam. A week before the exam, I timed myself every night by taking the 75-question practice exam to do a little muscle-memory exercise. I was trying to see if I could do the math questions faster and faster to save time for things I didn’t know on the actual exam.
For me, this pragmatic approach worked. My hope is that it may help others, too.
When I started working at Special Pathogens Laboratory (SPL, now a Pace® Analytical Services Laboratory), I was encouraged by other water treatment professionals to get my CWT. I agreed, thinking it would help me better connect with my customers (and that it was a good acronym to have on my resume in case things at SPL didn’t work out). In going through the CWT process, I learned something about myself. As clichéd as it may sound, the real motivation in my pursuit of knowledge has always been to efficiently solve customer problems. For me, the first step
The last thing I did was multi-task taking notes and listening to a few select sections of the training videos
continued on page 75 73
the ANALYST Volume 29 Number 1
Making a Splash
Brian Katarski AquaPhoenix Scientific, Inc. Hanover, Pennsylvania
What prompted you to start volunteering with AWT? The main reason I started volunteering with AWT is because I want to promote this industry and attract more folks to learn about industrial water treatment. I grew up knowing only farming and teaching as professions. I wish someone had come to our classroom or afterschool program and told me about water treatment! Knowing that there are so many great career opportunities in this field would have made me think about this industry when deciding what to study in college and where to apply after graduating from school. The other reason is a little selfish; I wanted to surround myself with people in the industry who were doing more than just their 9 to 5 job. When you surround yourself with people who are more aggressive, smarter, have more experience, etc., it forces you to be better. What has been the most rewarding thing about volunteering? In my first few years, we focused on a STEM initiative to teach young people about this incredible industry. As part of that initiative, we represented AWT at a Science and Engineering Festival in Washington, D.C., that was attended by 500,000+ students, teachers, and parents. Seeing the little kids’ eyes get huge when we added a clear liquid to water and it turned pink and then added another clear liquid and the water went back to clear made every hour of volunteering worth it.
Why would you encourage others to become a volunteer? Everyone should volunteer in AWT. It is so cliché— but true—that the more you give, the more you get in return. Being a part of the committees and leadership group at AWT may require giving up a bit of your time, but what you get back in friendships and knowledge is tenfold what you put in. Tell us about a current project you or your committee is working on? I am just taking over the Young Professionals Group and building on the great work that my predecessors did to get it off the ground. It sounds crazy, but our first project is to figure out how to get our members out of the Young Professionals Group faster. Our goal is to really engage the younger, newer folks in AWT, show them all the various ways to contribute, and farm them out to a new committee as quickly as we can. The other concurrent project is to double down on the efforts to recruit new talent into our industry. The membership of AWT is our ultimate customer, so showing members value is our main goal. If we can help solve that prevalent issue of “we just can’t find good people,” then we are bringing value to our “customers.” How can someone reading this interview help you in your current committee? Please send some young or new people in your company or our industry to join our committee. Don’t ever think that since you are young or inexperienced in the industry, you cannot contribute. There are plenty of opportunities to be involved no matter your skill set. Give AWT a couple of hours per month and you will get back years of industry resources/knowledge in return.
How has volunteering improved your professional career? You cannot put a value on the personal relationships and trust you build with others in the industry by volunteering with AWT. You volunteer right next to customers, vendors, and competitors alike. Getting to know someone outside the normal business relationship is how you build long term friendships.
74
the ANALYST Volume 29 Number 1
Making a Splash continued
Any final comments? Everyone who is reading this has an opportunity to promote industrial water treatment to folks outside of the industry. I would challenge all of you to educate someone new on what it is you do each day, week, month, or year. Pull out your test kit for an afterschool
program. Join a chemistry teacher in their classroom. Visit the HVAC or plumbing teachers at your local tech school. When you service a college or university stop by the career center and see how you can help. We are all responsible to bring on the next generation of water treatment professionals!
CWT Spotlight continued
to uncovering and solving real problems is in building trusted relationships. Having a CWT has allowed me to quickly build credibility, establish commonality, and gain referral business. Connecting quickly and having meaningful conversations allows me to expedite relationship building and discover gaps in service. All of this might sound fuzzy, but I do believe that my MPH provided me with orders of magnitude more credibility in the industry, and I’m finding the same with my CWT. Although I believe that I deserved a stamp of credibility even without my CWT or MPH, the fact is, those letters and my demonstrated commitment to an industry really helped me differentiate myself. As a result, more doors have been opened to me.
evidence-based environmental consulting laboratories in the world to an elite, customer-focused laboratory… all during the COVID-19 pandemic. During my first month with the company, we interviewed over 50 business owners, VPs, consultants, water treaters, and others to understand what we were doing well—and where we were falling short. We took a beating.
As a salesperson, it’s also critical to have and show empathy in order to build trust with customers. Even though it’s been years since I worked as an infection preventionist during my MPH practicum or sat on the floor of a boiler room running wet chemistry tests, that’s where my passion still lies. I’ve lived in my customer’s shoes and want to help make the lives of water treatment professionals easier. To do that, I do need to call on my broad experiences.
Our company embarked on this transition during uncertain market conditions—not only from the pandemic but as commoditization and supply chain challenges threatened many companies’ profitability. At SPL, we attribute our customer-centered service approach to finishing this year processing a record number of samples and as one of our most profitable years yet. Our success didn’t go unnoticed, and now our facilities and multi-disciplinary team are part of the Pace® laboratory network. I’m excited to continue to build upon new strategic partnerships and bring our products and services to many more consulting firms and water treatment providers across the entire United States. Now, as part of a greater network of laboratories, our offerings and accessibility to our clients are even greater!
What has been your greatest professional accomplishment? My greatest professional accomplishment is being part of the transformation of Special Pathogens Laboratory into a high-performing sales organization. In under two years, the company went from being one of the best
75
I’m most proud that SPL is now fueled by Voice of Customer feedback and open to adjusting its service offerings to meet the wants and needs of the customer. This pivot wasn’t easy to accomplish and required sales department representation at the executive table to lead the charge.
the ANALYST Volume 29 Number 1
Tales From the Waterside
Discovering the Root Causes of a Refinery Boiler Failure Bob Cunningham, International Water Consulting, Inc.
I started my own water treatment company in the early 1980s as a one man show. Early on, I was calling on a major oil refinery in Southern California, where I had already earned the cooling water business. The refinery had a severe problem with corrosion and tube failures in a high-pressure, once-through, process-on-the-tube-side waste heat boiler with a superheater. The boiler was fired by the waste heat produced in a hydrogen plant associated with the refinery steam methane reformer process.
The boiler feedwater consisted of primarily return condensate from the various waste heat boilers in the division, including this high-pressure unit. There were no condensate polishers installed. This return condensate was supplemented as needed with small amounts of plant demineralized water.
Table A provides operating data for the 875-pounds-persquare-inch gauge (psig) boiler at this plant. Table A: 875-psig SMR Boiler Operating Data Operational Parameters
Data
Operating pressure
875 psig
Steam flow
325,000 #/hr with no auxiliary firing 344,000 #/hr with auxiliary firing
Saturated steam temp.
530 °F
Superheated steam temp.
825 °F
Design feed water flow
341,000 lb/hr
Design blowdown flow
16,000 lb/hr
Design steam total solids
< 1 ppm at 125% of capacity
Design steam moisture
< 0.07% at 125% of capacity
Critical Generator
Details
Tube-side service
Process
Design
Ralph Parsons
Built
1969
Design pressure
965 psig
Design temperature
560 °F
Gas-side pressure
300 psig
Forced circulation ratio
3:1
Heat flux
266,000 BTU/hr/ft 2
This high-pressure boiler had been treated since start up in 1970 by the same large multinational water treatment company with good results until 1981, following a vendor personnel change a couple of years prior to the failures. The internal deposit and corrosion control treatment consisted of a single product containing an NTA (nitrilotriacetic acid) chelant, a dispersant polymer, caustic, and antifoam. This internal treatment was supplemented with the use of a blend of cyclohexylamine and morpholine for condensate pH control. Hydrazine was employed for feedwater oxygen scavenging. The amine was fed only to the low and intermediate pressure boilers, but not to the high-pressure boiler.
Tube Failures
Control of the program chemistry was provided by the vendor, who conducted wet chemical testing and recommended adjustment of the chemical feed pumps and adjustment of blowdown. During 1981, the generator suffered the failure of six high-heat flux tubes due to severe gouging. The generator tubes that were examined exhibited heavy fouling due to the accumulation of magnetite on the waterside. At that time, the failure was attributed by the incumbent vendor and refinery engineering personnel to be caused by “chelant attack, possibly accelerated by additional agents such as oxygen or caustic.” At that time, I was invited, along with the incumbent and two other vendors, to submit a proposal for 76
the ANALYST Volume 29 Number 1
Tales From the Waterside continued
treatment of this system. The division management and the refinery process engineers agreed with the incumbent vendor’s assessment of the cause of the failure, and they elected to stay with the existing vendor. Afterward, the generator was retubed. The incumbent chemical vendor recommended that the internal treatment program should be modified by eliminating chelants and substituting a recently introduced proprietary “all-polymer” program to provide better deposit control. Oxygen scavenger and neutralizing amine selection remained unchanged, and hydrate alkalinity control was not further specified. Refinery engineering personnel had short ferrules installed on the inlet end of the high heat flux tubes.
The division manager again invited the same four vendors, including the incumbent, to provide proposals. After completing my inspection, I submitted failed tube specimens from this failure and the previous failure for metallurgical evaluation. I had done extensive research in the literature after the first failure and had already arrived at my root cause analysis for the failures. I also had developed a rationale behind my recommendations. The data collected during the previous two years only strengthened my prior conclusions.
Different Treatment Approach
I proposed a significantly different treatment approach using EDTA chelant and a sulfonated polymer. Caustic, if needed, was to be fed as a separate product. I offered vastly improved sampling and testing of water samples from around the system in order to achieve much tighter control over feedwater and boiler chemistry. My proposal included the analytical data from the last two years as evidence that the incumbent service had severely slipped. At that time, we did not have the advantage of smart controllers.
During a subsequent meeting with the division manager and his assistant, I thanked them for considering my recommendations. I told them that I believed that the root cause assessment was faulty. I expected them to suffer continuing tube failures within a short period of time after startup. I told them that the program changes did not address the underlying causes of the attack. Over time, I continued to call routinely on the decision-makers, taking water samples for my own analyses and continually reviewing plant operating data. Despite the installation of the ferrules and the change in program from chelant/polymer/caustic to the all-polymer program supplemented with caustic, the boiler again experienced tube failures. These failures occurred within two years of the program switch, and the plant was down again for repairs in early 1983.
My research, coupled with the tube failure analyses, convinced me that the failures were occurring due to excessive caustic feed, resulting in caustic concentration under the deposits. A careful study of the deposit analyses and the failed tubes supported that conclusion. I strongly believed that, with excellent control, the plant could successfully employ a low-level EDTA chelant in conjunction with reduced hydroxide alkalinity and a superior iron-dispersing polymer to greatly delay tube failures despite the excessive heat flux. My control recommendations are shown in Table B.
Table B: 875-psig Waste Heat Boiler Control Recommendations Parameter
Demin m.u.
Condensate
Feed Water
Boiler Water
pH
>9.3
8.0–8.5
8.3–9.3
Record
Spec. conductivity
< 40 µmhos
≤ 20 µmhos
≤ 40 µmhos
≤ 2,000 µmhos
Hardness
< 0.05 mg/L
≤ 0.05 mg/L
≤ 0.05 mg/L
Total iron
≤ 0.02 mg/L
≤ 0.02 mg/L
Copper
≤ 0.015 mg/L
≤ 0.015 mg/L
Hydrazine
0.05–0.10 mg/L
Silica
Record
≤ 8.0 mg/L
Total alkalinity
≤> 200 mg/L
“OH” alkalinity
35–55 mg/L
“P” alkalinity
Record
EDTA
2–4 mg/L
77
the ANALYST Volume 29 Number 1
Tales From the Waterside continued
“The moral of the story is that if you dig deep enough, you can come up with a workable solution to most problems.” Final Thoughts
The division manager went out on a limb and gave me a shot. I initiated once-a-shift operator sampling and testing of all water streams. This was combined with once-a-day complete sampling and analysis by me. I set up a small testing facility in the division and outfitted the lab, which included a Hach DR 3000 spectrophotometer and several titration setups. The refinery IT department set up two parallel databases, one for my results and the other for operator results. These were used to verify the operator test results. Periodically, duplicate samples were submitted to a local lab for additional verification.
We had a very successful 11-year run with that boiler and the production division. When the refinery corporation decided to adopt a “strategic partnership” relationship with only multinational suppliers, we lost that business. Despite our loss, the refinery required that the same treatment program be maintained in that boiler, regardless of the vendor, until the entire unit was replaced in 2011, with no more tube failures!
The previous supplier had the key to the failures all along but did not recognize the value of the service previously provided by their former personnel. They also failed to recognize the significance of research work performed and published by their own staff many years before. That researcher had performed an industrywide study of high-pressure steam plants across the United States (1). Figure 1, which comes from Reference 2, shows conclusions of the study.
The moral of the story is that if you dig deep enough, you can come up with a workable solution to most problems. You need to appreciate the engineering data associated with the equipment/operation and understand your available chemistry. You need to carefully determine the necessary service and control program. If you are sure of your conclusions to a reasonable degree of engineering certainty, don’t be afraid to be a bit audacious!
References
1. Jacklin, C. (1961). “Waterside Failures in High-Pressure Boilers: A Field Survey,” ASME Paper No. 61-WA-271, Contributed by The Joint Research Committee on Boiler Feedwater Studies, Association of Mechanical Engineers, New York, New York. 2. Cunningham, R.J.; Spurrell, C.H. (March 2007). “Proper Alkalinity Control – A Key Factor in Long-Term Successful Operation of a High-Pressure Refinery Waste Heat Boiler,” Corrosion 2007, Paper 07454, Nashville, Tennessee.
Figure 1. Throttle pressure versus boiler water hydroxide alkalinity. See Reference 2.
Bob Cunningham is the president of International Water Consultants, Inc. He is a native of Western Pennsylvania and has been working in various fields of water treatment since 1964, when he joined Calgon Corp. after earning a degree in chemistry from the University of Pittsburgh. Mr. Cunningham has worked extensively worldwide with all types of boiler, cooling, and wastewater treatment systems across all major industries employing these technologies. He provides litigation support on a variety of issues, including corrosion, deposition, and microbial damage, as well as the control of waterborne pathogens, such as Legionella. He and his wife, Linda, live in Grass Valley, California. Mr. Cunningham can be contacted at rjc5225@gmail.com.
That work is still being considered by the ASME subcommittee (Joint Research Committee on Boiler Feedwater Studies) as part of an effort to update the alkalinity control recommendations and include hydrate alkalinity for high-pressure units. 78
the ANALYST Volume 29 Number 1
Life Beyond Water
How Can a Trust Facilitate Estate Planning? Elizabeth A. Anderson, Esq., The Law Network, P.C.
As we discussed in the Fall 2021 Analyst, everyone needs an estate plan. An estate plan helps us ensure that your assets will be managed not only at your death, but during your lifetime as well. While a will is the most common type of estate planning tool, it is not fool proof. Having a will does not necessarily mean that you will be able to avoid probate. This is why so many people are now turning to trusts for their estate planning needs. One of the best features of a trust is that a trust avoids probate. With a trust, your successor trustee has the authority to follow the rules you set forth in your trust document and to distribute the inheritance based on your designated wishes. No probate. No court.
that. What if you want to leave money to a charity? We have a trust for that. What if your child or loved one is receiving government assistance due to a disability? We have a trust for that. What if you are worried your beneficiaries will waste away their inheritance? Yep, we even have a trust for that! There are so many different types of trusts. With this in mind, let’s review the basics of some of the most popular trusts.
Revocable Trust
As a result, trusts are becoming more and more common. Just for fun, when you are bored, go to your local property assessor’s website. Look at some of the houses in your neighborhood. You might be surprised to see that many are owned by a trust. This does not necessarily mean all your neighbors are super wealthy. Instead, it means your neighbors are proactive and have set up their estate plans in a way to avoid probate. While we normally use trusts for probate avoidance, there are a variety of trusts we can use, depending on your personal goals and your financial situation. What if you have estate tax concerns? We have a trust for
Revocable trusts are sometimes referred to as living trusts. These are trusts that allow you to maintain control of your assets while you are living. As such, you can easily update and modify these trusts, which can offer you a lot of flexibility. These types of trusts are also easy to use during your lifetime because they are considered “grantor” trusts for income tax purposes. This simply means these trusts use your personal tax identification number (i.e., your social security number) during your lifetime. As a result, you will not need to file taxes any differently than you always have. You will not need to file a separate tax return for your revocable trust while you are alive. These trusts also outline who will be your successor trustee so we know who can legally step in and manage these assets if you were to become incapacitated or pass away. Plus, these trusts are not subject to probate. As a result, your beneficiaries can easily inherit without having to go through a court process.
“While we normally use trusts for probate avoidance, there are a variety of trusts we can use, depending on your personal goals and your financial situation.”
These types of trusts do not provide asset protection during your lifetime though, so if that is a personal goal, we will need to look to other types of trusts.
79
the ANALYST Volume 29 Number 1
Life Beyond Water continued
Irrevocable Trusts
One way to create asset protection is to use a type of irrevocable trust. There are a few different types of irrevocable trusts. Each type of irrevocable trust has its own set of rules but, generally, if you transfer assets into an irrevocable trust, you cannot be the beneficiary of that trust. In theory, when you place assets in an irrevocable trust, you gave the asset away. Your family members, or the beneficiaries stated in the trust, are the only the individuals who can use those funds during your lifetime. There are some types of irrevocable trusts that allow you to maintain control but, generally, since the assets are no longer yours, you would need the beneficiary’s consent to make changes to the trust. Since that can be a little awkward, most attorneys, myself included, write these types of trusts so that a professional, called a trust advisor or trust protector, can make modifications to the trust if needed.
Grantor Retained Annuity Trusts (GRATs) A GRAT can be a powerful planning tool when we have an asset that is expected to appreciate significantly in value. When you place these assets into a GRAT, you give up control over the asset, but you are able to receive regular annuity payments during your lifetime. The balance of the trust would then be passed onto your heirs free of any gift or estate tax. Spousal Lifetime Access Trusts (SLATs) This type of trust is an irrevocable trust where one spouse makes a gift into a trust for the benefit of their spouse while moving assets away from their combined estate. This may offer couples a way to take advantage of the high federal lifetime estate tax exemption ($11.7 million per spouse) before it is set to expire in 2025, or before new tax laws are enacted. Irrevocable Life Insurance Trusts (ILITs) An ILIT is created to own a life insurance policy. You designate the trust as the owner and the beneficiary of your life insurance policy so that, when you pass away, the policy proceeds are distributed to the trust. The main advantage of this type of trust is that it removes your life insurance death benefit from your taxable estate and leaves a protected inheritance for your spouse and/ or other heirs. These funds can then be used to help pay estate costs and provide your heirs a guaranteed tax-free inheritance.
I know the idea of giving up ownership and control can sound scary, but these types of trusts are a great tool for asset protection. Once assets have been placed into this type of trust, they are typically considered protected from creditors and bankruptcy after being in the trust for two years, depending on state law. After five years of being in the trust, those assets are also considered protected from Medicaid Long Term Care. This can be incredibly helpful if we have a spouse who has extensive long-term care needs, or we just want to ensure that the children receive an inheritance.
Charitable Trusts There are a few different approaches to leaving assets to charitable or nonprofit organizations. Some families want to retain and use their assets during their lifetime and then leave a charitable donation to an organization at their death. Other families elect to leave a large lump sum, but some like the idea of spreading out the donations over a period of years.
Additionally, an irrevocable trust allows you to remove assets from your estate so that those assets will not be subject to estate tax. This can be very appealing if you have a large estate and need to minimize the risk of an estate tax. Some of these irrevocable trusts include Grantor Retained Annuity Trusts (GRATs), Spousal Lifetime Access Trusts (SLATs), Irrevocable Life Insurance Trusts (ILITs), and Charitable Trusts.
When we spread out the donations over a period of set years, we are creating a “charitable lead trust.” This trust will make charitable donation payments for a set period of time. Once that time expires, the balance of the trust will be paid out to named beneficiaries. While there are no tax advantages during the lifetime of the creator of the trust, their beneficiaries would be able to capture a tax deduction for the estate.
“There are a few different approaches to leaving assets to charitable or nonprofit organizations.” 80
the ANALYST Volume 29 Number 1
Life Beyond Water continued
This is when we use a type of trust called a special needs trust (SNT), which is also known as a supplemental needs trust. There are two different types of SNTs: a first-party SNT and a third-party SNT.
Other families wish to make a donation during their lifetime so that they receive a charitable tax deduction in the same year of the donation. This can be particularly helpful when a family has an estate tax issue or owns highly appreciated assets. In these types of instances, we may want to use a charitable remainder trust. A charitable remainder trust may be set up in a few ways but, generally, this trust allows the creator of the trust to receive income from the trust assets for a set period of time. Any remaining assets or income will be distributed to the designated charity.
First-Party SNT First-party SNTs are used when a disabled individual places their own personal funds into the SNT. This is often seen when an individual becomes disabled due to an injury prior to the age of 65. This individual may have received a lump sum of money in a lawsuit or settlement, and their assistance programs, such as Medicaid and SSI, are jeopardized because they are now considered over resourced.
Other Types of Trusts
Many families do not have an estate tax issue and will not need to use the types of irrevocable trusts described above. Instead, they may want to use trusts for other types of planning. For instance, trusts can be a wonderful tool for blended families. If a married couple has children from previous relationships, we can draft a trust to ensure that the surviving spouse is taken care of. When the second spouse dies, the remaining assets can be distributed to the children of the spouse who created the trust. Trusts are also incredibly helpful for families with minor children. The trust can control and manage the inheritance until the children are an appropriate age to directly receive distributions.
Placing these funds into a first-party SNT allows the individual to maintain their benefits since the trust will now own these additional funds. These trust funds can be used to supplement needs (i.e., the trust can pay for expenses not covered by assistance programs). However, at the death of the individual, any remaining trust assets may be recovered by Medicaid. In theory, Medicaid is the primary beneficiary of this trust. Any costs paid out by Medicaid during the individual’s lifetime will be paid back to Medicaid from the trust. If there are any remaining trust funds, those assets can then go to family members, but only after Medicaid has been reimbursed.
Every family has unique concerns, but there are a few instances in which a trust can be particularly helpful:
Third-Party SNT Third-party SNTs are different because these trusts have been funded by a family member or other third party for the benefit of the disabled beneficiary. This is a phenomenal tool to use when we want to leave an inheritance to a loved one who has special needs but is receiving government assistance. This trust can hold the inheritance so that the funds can be used for the individual’s additional wants and needs without compromising their assistance eligibility. Plus, Medicaid is not entitled to the balance of this trust. Once the individual has passed away, any remaining funds will go to the successor beneficiaries designated in the trust document. The government has no claim to the assets in this type of trust.
Special Needs Trusts When a family has a loved one who has special needs, there are additional legal considerations. Many individuals who are intellectually or developmentally disabled are recipients of various government benefits. They may qualify for supplemental security income (SSI), and many are recipients of Medicaid waiver programs. Many of these government benefit programs have very strict financial qualification requirements. As such, we want to be very careful when an individual with special needs inherits. We want to ensure that they inherit in a way that does not compromise their eligibility for government benefit programs.
“If you have a will, make sure it is legally sound and that you have the necessary tools to avoid probate.” 81
the ANALYST Volume 29 Number 1
Life Beyond Water continued
“Placing these funds into a first-party SNT allows the individual to maintain their benefits since the trust will now own these additional funds.” Disclaimer
Spendthrift Trusts Even if our children do not have special needs, we may still be concerned with them having full access to their inheritance. If we have concerns about a beneficiary potentially misusing their inheritance, we can use a spendthrift trust. This can be particularly helpful if a beneficiary has a history of drug or alcohol abuse or mental health issues.
The content of this article is based on the author’s personal experiences and professional training. It is not intended to be legal advice. Readers with questions should seek the advice of a licensed attorney to address their specific situation.
Spendthrift trusts are also amazing tools if we just want to be particularly protective over the inheritance. Spendthrift trusts allow us to asset protect the inheritance on behalf of the beneficiary. This means that these inherited assets are protected from divorce, predators and creditors, and bankruptcy. Bad things can happen to good people. By utilizing a spendthrift trust, we can provide peace of mind that these inherited funds will be protected for the beneficiary’s lifetime.
Final Thoughts
While a will is a key element in estate planning, please don’t forget to consider your trust options. A trust can be drafted to not only ensure that your loved ones will inherit without a probate proceeding but also provide asset protection for you and your heirs. A properly drafted trust can provide you with protection from long-term care costs during your lifetime. Depending on your goals, a trust can provide protection from estate tax. A trust can be created to make charitable gifts and provide a stream of income during your lifetime. When considering your options, it is best to contact your local estate planning attorney. A well-crafted estate plan can provide tremendous peace of mind for both you and your loved ones.
82
Elizabeth A. Anderson, Esq., is an attorney specializing in estate planning, business planning, special needs planning, and elder law. She is a partner of The Law Network, P.C., a trusts, estates, and business planning law firm in Metro Denver. Ms. Anderson started her legal career working for the New York State Appellate Court. While there, she represented individuals with mental illness, intellectual and developmental disabilities, and the elderly in a variety of court proceedings, including guardianships and conservatorships. When she is not working or volunteering, she enjoys time with her husband and their two young sons. Her family loves adventure, and you will often find them hiking, skiing, or traveling. Ms. Anderson may be contacted at elizabeth@ coloradoestateplanners.com. ©2022, Elizabeth A. Anderson, The Law Network, P.C.
“Life Beyond Water” is a new column for the Analyst that addresses issues that AWT members face in addition to their important work in the water treatment business. If you have an idea for an article, please feel free to send your suggestion to mdhenleywater@gmail.com. We welcome your input.
the ANALYST Volume 29 Number 1
T.U.T.O.R.
Technical Updates, Tips, or Reviews
What Are the 10 Commandments for Effective TSS Treatment? Stuart Ward, Process Engineered Water Equipment
The water treatment professional, whether they are operators, vendor representatives, or managers are often tasked with the removal of total suspended solids (TSS) from a waste stream. This removal may be necessary to meet regulatory permit requirements or simply cost avoidance. Universally, the goal is to remove as many solids as possible at the lowest cost.
Figure 1: Liquid/solid separation equipment.
The following rules may be used in a wide variety of industrial wastewater applications. I admit to a bias toward dissolved air flotation (DAF) over a traditional clarifier for solids removal. Why? Because a DAF is easier and quicker to troubleshoot, and it is often the nature of solids that they can be made to readily float. To a degree, these rules may be applied to the municipal field; however, my focus is industrial wastewater, as that is where the interesting work is! Industrial wastewater comes in many forms from the simple to the complex. By boiling TSS down to these rules, hopefully I will help you achieve better treatment results. These basic principles were learned through many years of personal experience, first as a “water-treater,” selling coagulants and flocculants, and then later as a wastewater systems solution engineer. During my stint of selling treatment chemicals, I often found that wastewater treatment systems were either missing critical pieces of equipment or the equipment was not up to the job at hand. The latter may have been due to poor quality, outdated equipment, or simply equipment being misapplied. And unfortunately, sometimes it was operator neglect or even incompetence. A key point about these rules is that they are cumulative. That is, the rules stack efficiency in layers, and each layer brings with it increased opportunity for cleaner water. Figure 1 shows liquid/solid separation treatment equipment.
83
1. Prescreen the Water
The first order of business is removing large solids or foreign matter from the wastewater. A screen removes solids mechanically, helps reduce the need for chemistry, and protects all of the downstream equipment from plugging or damage. Plugged and damaged valves, pipes or DAFs do not remove TSS efficiently. Wastewater screens come in a number of designs, such as bar or in-channel and side-hill, as well as externally and internally fed. Some incorporate shaker mechanisms or selfcleaning spray bars. It is important to select the correct screen for your particular application by consulting with vendors and manufacturers. Figure 2 shows an externally fed screen in a wastewater treatment system.
the ANALYST Volume 29 Number 1
T.U.T.O.R. continued
mean more chemistry, but there is a limit, as too much chemistry will have the opposite effect so you can’t just overfeed it. Have an EQ tank that effectively blends the variable TSS loads, and the operator can better dial in the chemistry on that particular average TSS level. EQ is the cheapest piece of equipment that may be purchased to reduce your overall wastewater treatment costs.
Figure 2: Externally fed screen.
3. Properly Control the Water pH
2. Provide Adequate Flow and Load Equalization
There are two major reasons for adequately controlling the flow and load coming out of a plant. We need to control the flow so that all downstream equipment can be sized such that it consistently operates within an optimal range. To achieve such operation, an equalization tank (EQ ) or basin must be used. The first reason is that this tank will balance a varying plant discharge rate. The tank should be sized at a proportion to the daily plant flow. The wider the flow rate variation, the larger the percentage of the daily flow the tank should be. As a general rule of thumb, I like to start with 25%. If there are wide swings, such as a high flow during nightly cleanup, the percentage might creep to 50%. Keep in mind that EQ sizing depends on other factors that should be taken into account, including available space, odor concerns, containment requirements, and budget. The second reason adequate EQ should be used is that industrial flows often vary in TSS loading. Some rinse waters during a production day are relatively clean, while others are heavily laden with solids. These must be blended in order for the application of chemistry to yield the best results possible. The downstream treatment chemistry is designed to be fed at a consistent rate given a flow and TSS loading level. The purpose of the chemistry is to aid formation of floc, which is a large semi-solid particle. DAF treatment can efficiently remove floc through aeration and floating it to the surface for removal by skimming. More solids 84
Wastewater must be pH controlled to meet regulatory requirements within given parameters. pH control is also key so that the coagulant and flocculent chemistry may operate effectively. There isn’t space here to go into all of the chemical nuances of pH and the available wastewater treatment chemistry. Suffice it to say, TSS-related removal chemistry has a pH operating “window” where it is most efficient. Stray outside the window and you will waste either or both coagulant and polymer.
4. Purchase a Plate Pack Stainless Steel DAF
Traditional open-style DAF systems still have their place. They function the same as a modern plate-pack DAF by separating the solids from the water by providing an area for doing so dependent on the water surface area. They work great as a thickener, but also occupy a lot of physical space, which is precisely where the modern DAF comes into its own. The modern plate-pack DAF separation area is provided through the use of stacked inclined surfaces (often corrugated for strength). This achieves several things at once. It allows for the selection of either counter-flow or crossflow hydraulics. It also improves laminar flow, aiding particle separation. A modern DAF allows for increased separation area in a confined space, and it dramatically reduces the separation loading rate, giving the DAF a wider flow and load tolerance. Basically, you get more bang for your buck. As for material, a carbon steel DAF is cheap to build and of limited durability. A plastic DAF has some corrosion advantage but adds bulk due to limited material strength and durability. The plastic walls are built thick and fat to compensate for this weakness. A stainless-steel DAF will handle 99% of industrial applications and has the added benefit of being alterable by plant maintenance staff (e.g., attaching brackets and railings). The material is relatively light, has superior strength for its weight, and, as mentioned, can be welded, attached to, and polished the ANALYST Volume 29 Number 1
T.U.T.O.R. continued
6. Use a Self-Draining/Cleaning DAF
at will. Stainless steel also doesn’t stain like plastic, thus keeping a like-new appearance for many years. Figure 3 shows a plate-pack system.
There are two types of DAF with respect to draining— flat bottom and not. A flat-bottom DAF is less expensive to manufacture and install. It is also much harder to remove solids from and clean if not all of the solids happen to float. Often a sloped bottom or cone bottom DAF is the solution to settling solids. There are several primary designs. Old school designs use bottom scrapers, which are prone to derailing and wear.
Figure 3: Plate-pack system.
A better design is the use of a pump to suck the solids out. The pump is also readily accessed for maintenance purposes as it is located outside the vessel. Some DAF system designs lend themselves to easier cleaning than others. A case in point is the water extraction system. Some DAFs use a simple perforated pipe for extracting water, which then also collects and clogs with solids. Manufacturers of these systems put cleanout plates on their equipment so that the operator can regularly open and clean them. A more inventive manufacturer uses a self-cleaning design, saving operators hours of needless work. Figure 5 shows ParaLam weirs.
5. Use Regenerative Turbine 20–30 Micron Aeration
Regenerative turbine aeration uses a minimal amount of electrical energy to dissolve air into water. This process creates 20 to 30-micron (µm) bubbles that are the workhorse of an effective DAF system. In brief, the regenerative turbine dissolves gases, in this case atmospheric air (80% nitrogen, 20% oxygen), into solution at a given temperature and pressure. For most DAF applications, this can be achieved at 80-pounds-per-square-inch (psi) discharge pressure given wastewater under 95 °F. Figure 4 shows an example of a pump used to create the microbubbles.
Figure 5: ParaLam weirs.
Figure 4: Aeration pump that produces 20–30-µm bubbles.
7. Use Performance-Tested Liquid Chemistry
First, start with a reputable chemical vendor and a knowledgeable representative, as they will save you money in the long run. Sure, powder chemical products have their place on a large-scale system where they have the pricing edge. However, for industrial wastewater treatment, the added time and expense of manning a powder treatment system is anachronistic. From fisheyes to batch inconsistency, the justification for powder coagulants or polymer is old-school thinking. Putting in a liquid system allows for full automation of the process at a low cost, eliminates wetting issues, and opens up a wide range of treatment 85
the ANALYST Volume 29 Number 1
T.U.T.O.R. continued
chemistry options. It is much easier to switch to a new product when a drum/tote runs out than to work off a truckload of slowly deteriorating powder.
8. Use a Flow Proportional Make-down System
Some wastewater systems are designed to run at a single set flow rate. That makes injecting chemistry pretty easy. However, most industrial facilities generate wastewater at alarmingly dissimilar rates from day to day, hour to hour, and even minute to minute. A good measure of this variability can be controlled through equalization (see Commandment 2). With an EQ tank, we can discharge to a DAF at a steadier rate and inject accordingly. There often still remains a flow cycle, and this can be adjusted by using a flow proportional chemical make-down and dosing system. It is not a complex job to install a flow meter and send the 4–20 milliamp (mA) output signal to a chemical pump system. The chemical will be dosed more consistently than by manual operation. Such a system will pay for itself through tighter chemical usage. Figure 6 shows a dosing system.
1. Inject the coagulant as far upstream as possible to maximize contact time. A preferred location is right where the wastewater comes out of the EQ tank and ahead of any transfer pump. This also maximizes shear. Given this, a contact tank will not be necessary. 2. The polymer should be injected in a pipe flocculator, which is also known as a plug flow reactor to some. Typically, a sample port should be available ahead of the polymer injection point so that the operator can check their coagulant dose for effectiveness at creating a pin-floc. Additionally, a sample port after the polymer injection will allow the operator to check the combined effectiveness of the chemical application prior to entering the DAF. Through this approach, tweaks can then be made on the “fly” without having to wait and see the water result coming out of the back end of the DAF. This helps one avoid screwing up a DAF full of water! Figure 7 shows a pipe flocculator. Figure 7: Pipe flocculator.
Figure 6: PolyAccu dose system.
9. Properly Locate Chemical Injection Points
Whoever the preferred chemical vendor may be, they should be able to study the wastewater and make recommendations as to optimal application given a particular system setup. Sometimes the preferred location is not available. A good place to start if you are using a typical two-step coagulant/flocculent treatment scheme is as follows:
86
10. Thou Shalt Not Undersize the System
One of the most often committed “sins” in system design or purchase is to undersize the equipment. Let’s face it, companies have limited budgets and see wastewater treatment as an expense. They are tempted to economize, particularly when business is slow. This happens with pumps, piping, valves, screens, tanks, dewatering equipment, chemical feed, and most often, DAF units. These systems are then pushed beyond their intended design the ANALYST Volume 29 Number 1
T.U.T.O.R. continued
Closing Thoughts
capacity for flow and/or load. The end result is mediocre quality TSS removal, which is not the goal sought in the first place. The plant grows, production changes, output variables change, or discharge rules become tighter from regulatory agencies.
The saying is “cleanliness is next to Godliness” and this applies to wastewater treatment systems as well. A dirty DAF will yield dirty water, period. And a dirty system will receive less maintenance attention because nobody wants to work on it. Finally, a dirty system is an indicator the operation is sloppily run and that is no way to get the most TSS removed from the water at the lowest possible cost.
Key considerations are average versus maximum flow plus its duration, any planned expansion, the available space, EQ capacity, and discharge limits or goals. A starting point for DAF sizing is 50% to 75% of daily gallons per minute (gpm) flow. The final size can then be adjusted by taking the other factors into account. Remember you will not get better results because inherent equipment system limits can only be marginally improved upon later. And as a reformed chemical salesman, I can assure you there are things even the magic of chemistry can’t fix. Figure 8 shows an example of a DAF system.
Stuart Ward is the general manager of Process Engineered Water Equipment. He began his career in the chemical industry in 1980 as a production mixer before becoming a plant manager, operations manager, and later a sales manager. He earned his B.S. in industrial management in 1987 and later received an MBA from the University of Oregon in 1993. He can be contacted at ward@pewe-usa.com. Do you have an idea for a T.U.T.O.R. article? We are interested in topics that touch on different aspects of water treatment and would welcome your input. If you have an article idea, please contact Mike Henley at mdhenleywater@ gmail.com or (303) 324-9507.
Figure 8: DAF system.
87
the ANALYST Volume 29 Number 1
Business Notes
3 Common Fallacies About Creativity Pronita Mehrotra, MindAntix; Anu Arora, Potential Leadership; Sandeep Krishnamurthy, Purple Lightning Ventures.
Leaders often cite creativity and innovation as critical components of business success. But many businesses fail to create and encourage environments where creativity can flourish. Managers make a trio of common mistakes that prohibit new ideas and suppress suggestions that don’t align with their own. A 2017 PwC survey of 1,379 CEOs determined that “innovation” was the top priority for most businesses. The same survey revealed 77% of CEOs struggle to find employees with creativity and innovation skills. Last year, a LinkedIn analysis ranked “creativity” as the most in-demand soft skill.
is complex. In such situations, resisting the temptation to find a solution quickly (and often less creatively), and instead urging the team to keep searching for more ideas can lead to more innovative and far-reaching solutions. To avoid premature closure, teams should arrive at an “almost final” decision and then intentionally delay action in favor of additional incubation time. During this time, everyone should commit to thinking about the problem and sharing their ideas. If the team can’t find a better approach during the incubation period, they should proceed with their original solution.
The Intelligence Illusion
Why do organizations have so much trouble enabling employee creativity? The answer lies in subtle and deeply ingrained behaviors that prevent companies from fostering a creative culture. We identify three misconceptions that managers must overcome to effectively build creative cultures.
Creative thinking is more cognitively demanding than logical thinking. It engages more parts of the brain across the left and right hemispheres and places higher demands on working memory. In practical terms, this means that analyzing an idea is easier than synthesizing a new one from multiple sources.
The Productivity Illusion
No matter the size of your company, you have likely come across a persona like the fictional employee we’ll refer to hereafter as “Dave.” Dave is a well-liked leader. He is known for quick thinking and decisiveness, and most people regard him as someone who gets things done. He listens carefully to the issues his team addresses. He weighs in and helps them resolve the challenges. Given Dave’s ability to address issues and help teams make progress, most people would consider him to be a great leader. Not so fast (and we mean that literally). Trying to resolve things too quickly, especially for complex problems, is detrimental to innovation because you fall prey to premature closure. Some of the best solutions don’t come in the initial meeting or two but after a longer incubation period. While mantras like “move fast and break things” can help push people toward action, they can backfire when the underlying problem 88
In an ideal scenario, organizations would pay people in proportion to their cognitive work. In practice, however, we tend to reward “critics” more than “synthesizers” because critics sound more intelligent. In a study on book reviews, Teresa Amabile found that people who wrote negative book reviews were perceived by others to be less likable but more intelligent, competent, and expert compared to those who wrote positive book reviews. Pfeffer and Sutton call this the “smart-talk trap,” where people engage in negative criticism and complexities to appear more competent and are subsequently rewarded by the organization. The intelligence illusion might seem mild, but it has pernicious consequences for an organization. When Steve Jobs took over Pixar, it had been struggling to produce a blockbuster despite being home to some of the smartest people. After noticing that excessive criticism was shooting down creative ideas, he instituted a the ANALYST Volume 29 Number 1
Business Notes continued
create new ideas. If done remotely, leaders should find other ways to bring the team together to bond and build trust with one another.
policy of “plussing,” where one could only offer a criticism if it included a potential solution. That simple strategy pushed people from being criticizers to creators, changed team dynamics completely, and led to a string of successes, starting with the development of the movie "Toy Story."
Business leaders agree that creativity and innovation contribute fundamentally to competitive advantage. Companies with an innovation-focused culture are three times more profitable. Leaders who seek to initiate a new creativity practice must consciously avoid the three illusions. This work requires supporting clear and consistent political commitment, inclusive leadership style, thoughtful organizational structure, and an explicitly earmarked budget. Creativity programs are an urgent imperative. In a conceptual economy, these programs are the path to growth and an engaged workforce.
Leaders can improve group creativity by paying close attention to how ideas are discussed in diverse group settings. They should encourage team members to build on each other’s ideas instead of pushing individual ideas. They should approach ideas with an open mind to acknowledge useful aspects and improve weaknesses using plussing or the similar “yes, but, and” approach.
The Brainstorming Illusion
When you ask people to describe an ideal brainstorming session, the most common elements you hear are: people getting together, an energetic and exciting mood, and lots of ideas flying across the room. Simply put, most teams associate successful ideation with group work. Surprisingly, that’s not true.
Dr. Pronita Mehrotra is the founder of MindAntix. Anu Arora is an executive coach and founder of Infinite Potential Leadership. Sandeep Krishnamurthy is the dean of the School of Business at the University of Washington’s Bothell campus and founder of Purple Lightning Ventures. © 2021 Harvard Business School Publishing Corp.
Group brainstorming feels more productive, not because of the number of ideas that are produced but because of social effects. The social connection we experience with each other during brainstorming makes us happier, and we confuse that with productivity. In practice, nominal brainstorming (where individual team members think independently before sharing their ideas) consistently outperforms traditional group brainstorming, especially for diverse teams. A Yale study found that the number of ideas produced by individuals and then aggregated (nominal group) was twice that of ideas generated by the group working together. Ideation can be limited in group settings because of production blocking (when people don’t get a chance to interject their idea), evaluation apprehension (a fear of being judged negatively), lack of psychological safety (entrenched power structures), and social loafing (hiding in the group and not contributing a fair share). To promote more creative ideas, leaders should utilize simple tools to capture individual ideas before they are opened to the whole group. Group discussions should be conducted asynchronously, where team members look at each other’s ideas and use them to refine and 89
the ANALYST Volume 29 Number 1
Advertising Index 13 AMSA, Inc.
15 QualiChem, Inc.
64 CHEMetrics, Inc.
19 Quantrol, Inc.
2
Environmental Safety Technologies, Inc.
23 Sanipur US LLC
5
IDEXX
90 Scranton Associates Inc.
46 Myron L. Company
92 Special Pathogens Laboratory
33 Process Engineered Water Equipment
91 Walchem, IWAKI America Inc.
7
Pulsafeeder, Inc.
90
the ANALYST Volume 29 Number 1
Curious? walchem.com/curious
END THE LEGIONELLA
PARTY I N YO U R PI PE S Special Pathogens Laboratory gives you the Legionella expertise required to protect your clients’ water systems through total Legionella control—testing, water management, education, and certification training to become a professional Legionella Water Safety and Management Specialist.
Get the Legionella resources, tools and support you need from laboratory services to ASSE certification in one place: • Legionella and waterborne pathogens testing • Outbreak response • Legionella consulting services • LegiDoc water management plans • ASSE 12080 certification training
AWT Members Special Offer $200 discount on the next ASSE 12080 certification training. Use discount code: AWT-Discount 20% discount Puzzled by Legionella guidebook. Use discount code: AWT-Discount Learn more
specialpathogenslab.com/asse-12080-certification
• Guidebook: Puzzled by Legionella: A Guide to Understanding Detection, Prevention, and Water Management
THE LEGIONELLA EXPERTS ®
SpecialPathogensLab.com info@specialpathogenslab.com | 877-775-7284