the Analyst The Voice of the Water Treatment Industry
Volume 26 Number 3
1300 Piccard Drive, Suite LL 14 • Rockville, MD 20850
Summer 2019
Ion Exchange Part 3: Tips for Loading and Unloading IX Resins Ways to Extend Performance of Phosphonates in Simulated Cooling Waters Key Steam and Condensate System Factors That Can Affect HRSG Operation Can a Scale-Resistant, Membrane-Based Solution to Treat FGD Wastewater Meet EPA Guidelines?
Volume 26 Number 3 Summer 2019
Published by
A COMPLETE SOLUTION
Designed to complete your water treatment system.
MicroVision EX makes life simpler for water treaters. Our advanced controller is easier to install, program and operate because of proven MicroVision software that utilizes an intuitive user interface. Accurate measurement is achieved by our toroidal probe, which is factory-calibrated and maintenance-free. And PULSAlink cloud-based communication delivers convenience at your fingertips with military grade, industry leading security. MicroVision EX controllers help maintain process control, reduce costs and limit downtime, freeing up more time for water treaters to serve their customers.
DON’T BOTHER WITH AN INCOMPLETE CONTROLLER. INSTALL THE MICROVISION EX FROM PULSAFEEDER.
Install Wizard.
Customization and Ultra-Secure.
Using the Install Wizard on all MicroVision EX controllers makes configuring installation, quick, easy, error proof, and customizable. Installs in less than five minutes.
Nameable relays, water meters, inputs, reports and customized color graphing. Ultra secure with the highest, industry leading AES256 encryption & TLS 1.2 protocol.
Improve ROI on Chemical Contracts.
PULSAlink Communications.
Corrosion Sensor.
High Pressure Applications.
MODBUS BMS Integration.
Right Out Of The Box.
Flow Meters with excellent precision and versatility, integrated with PULSAtron & MicroVision EX controller. Calculate and remotely track exact chemical dosed in the system minimizing loss and/ or overfeed.
Online corrosion monitoring to help water treaters track water quality and chemical treatment programs. Choice of 2 metal tips: Mild steel and Copper.
MicroVision Ex controllers equipped with an Ethernet interface can connect to a SCADA system via Modbus TCP communication protocol.
Web and iOS/Android App provides access to live reports, settings and notifications anytime,anywhere. Water meter plots include bleed, makeup and chemical totalization.
Models designed to withstand pressures up to 300 psi, where the cooling tower is on the top of a high rise building and the controller is in the equipment room many floors below/basement.
Making it simple to get everything you need in one location. The MicroVision EX can be ordered with Modem Millie installed on a choice of panels.
To learn more, contact your Pulsafeeder sales rep at pulsatron.com today!
ers. am are ate h is link our
rol, for
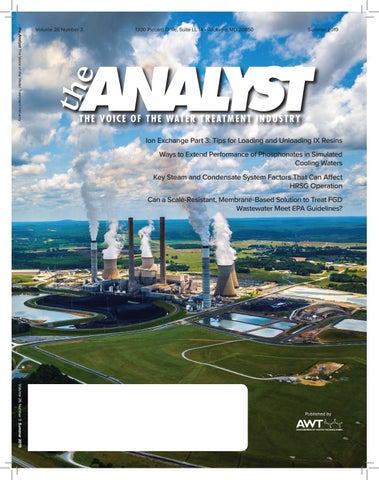
Cover A power station in the southeastern region of the United States. Courtesy of Tomorrow Water (BKT)/Jonathan Chen. Summer 2019
Volume 26
Number 3
10 Ion Exchange Part 3: Tips for Loading and Unloading IX Resins
Peter Meyers, ResinTech, Inc.
This article is Part 3 of a series on various aspects of how ion exchange (IX) resins are used. This part covers loading and unloading of resins, including how much to load and how to unload. IX resins shrink and swell, depending on their ionic form and on the ionic strength the solution they contact. Resins also swell or shrink in solutions other than water. In vessels that are completely full of resin, such as packed beds, the swelling must be taken into account; otherwise, it is all too likely the resin will crush itself as it tries to swell but can’t.
18 Ways to Extend Performance of Phosphonates in Simulated Cooling Waters Zahid Amjad, Ph.D., Walsh University
In many industrial systems, including cooling, boiler, desalination, geothermal, and oil and gas, among others, scale formation presents significant operational challenges. Problems are prominent when it deposits on equipment surfaces and causes various operational challenges, such as reduced heat transfer and premature equipment replacement. Inorganic scales commonly encountered in industrial systems include carbonates, sulfates, and phosphates of alkaline earth metals. One of the main difficulties in anticipating scale formation is that various factors, including water composition, pH, temperature, hydrodynamics of the flow, dissolved and suspended impurities, heat exchanger metallurgy, surface roughness, and the presence of gas bubbles, influence scale formation in the bulk solution and on equipment surfaces.
32 Key Steam and Condensate System Factors That Can Affect HRSG Operation
Charles Kuhfeldt, CauseWay Water Consulting and Services
Many production plants, such as chemical plants and oil refineries, and other facilities utilize steam for power transmission and heating. Most of these facilities also use steam generation as an energy transfer and conservation technique. These steam systems can be complicated, particularly after operating through decades of operation and growth. The history of industrial steam use includes the development of steam generators operating at increasingly higher pressures. One of the essential technology advancements for the operation of boilers at increased pressures is the development of equipment and techniques that make large amounts of high-purity boiler feedwater. A common estimate of the operating life expectancy of a power boiler in an industrial plant is 40 years. With careful maintenance and repair, boilers can exceed that operating life span. There are some boilers, not commonplace, approaching 60 years and older that are still operating in industrial plants. The existing installed boilers designed for lower operating pressures when they were built still work at lower pressures than the large-scale, modern, combined-cycle, high-pressure heat recovery steam generators (HRSGs).
48 Can a Scale-Resistant, Membrane-Based Solution to Treat FGD Wastewater Meet EPA Guidelines?
4
Calendar of Events
5
President’s Message
5
Letter to the Editor
6
Message From the President-Elect
8
In Memoria
67 Industry Notes 80 Association News 82 Membership Benefits 83 Making a Splash 85 T.U.T.O.R. 91 CWT Spotlight 92 Ask the Experts 94 Capital Eyes 96 Financial Matters 98 Business Notes 102 Advertising Index
Jon Liberzon, Jonathan Chen, and Tzu Lung Lin, Tomorrow Water (BKT), and Arnab Hanra, Jaeho Ho, Ph.D., and Chunwoo Lee, SafBon Water Technology
To prevent sulfur emissions, power plants employ various technologies to remove SOx from flue gases in a process called flue gas desulfurization (FGD). This is most commonly achieved using wet scrubbers, wherein stack gases are passed through a liquid slurry of acidified calcium carbonate. This slurry captures gaseous sulfur as liquid calcium sulfate (gypsum), which is precipitated in downstream hydrocyclones. Following the precipitation of solids, calcium carbonate (CaCO3) is added once again, and the slurry is recycled through the scrubber. As it contacts flue gases, the slurry dissolves not only SOx but also a range of other compounds, including salts, metals, nitrates, chlorides, and various constituents of the combusted coal. The product of this accumulation process is a concentrated liquid that must be purged from the scrubber to avoid corrosion and maintain scrubbing performance.
3
the Analyst Volume 26 Number 3
1300 Piccard Drive, Suite LL 14 Rockville, MD 20850 (301) 740-1421 • (301) 990-9771 (fax) www.awt.org
2019 AWT Board of Directors President
David Wagenfuhr
Calendar of Events
Association Events 2019 Annual Convention & Exposition
Secretary
September 11–14, 2019 Palm Springs Convention Center and Renaissance Hotel Palm Springs, California
Treasurer
2020 Annual Convention & Exposition
President-Elect
Thomas Branvold, CWT Michael Bourgeois, CWT
September 30–October 3, 2020 Louisville Convention Center and Omni Hotel Louisville, Kentucky
Matt Jensen, CWT
Immediate Past President
Marc Vermeulen, CWT
Directors
Steven Hallier, CWT Stephanie Keck, CWT Andy Kruck, CWT Bonnee Randall
2021 Annual Convention & Exposition
Ex-Officio Supplier Representative
Garrett S. Garcia
Past Presidents
Jack Altschuler John Baum, CWT R. Trace Blackmore, CWT, LEED AP D.C. “Chuck” Brandvold, CWT Brent W. Chettle, CWT Dennis Clayton Bernadette Combs, CWT, LEED AP Matt Copthorne, CWT James R. Datesh John E. Davies, CWT Jay Farmerie, CWT Gary Glenna Charles D. Hamrick Jr., CWT Joseph M. Hannigan Jr., CWT
Mark R. Juhl Brian Jutzi, CWT Bruce T. Ketrick Jr., CWT Bruce T. Ketrick Sr., CWT Ron Knestaut Robert D. Lee, CWT Mark T. Lewis, CWT Steven MacCarthy, CWT Anthony J. McNamara, CWT James Mulloy Alfred Nickels Scott W. Olson, CWT William E. Pearson II, CWT William C. Smith Marc Vermeulen, CWT Casey Walton, B.Ch.E, CWT Larry A. Webb
Staff
Executive Director
Heidi J. Zimmerman, CAE
Deputy Executive Director
Sara L. Wood, MBA, CAE
Senior Member Services Manager
Angela Pike
Vice President, Meetings
Grace L. Jan, CMP, CAE
Meetings Manager
Morgan Prior
Exhibits and Sponsorship Manager
Barbara Bienkowski, CMP
Exhibits and Sponsorship Associate Manager
Brandon Lawrence
Sr. Marketing Director
Julie Hill
Production Manager
Jennifer Olivares
Website Manager
Jeyin Lee
Technical Writer/Copy Editor Lynne Agoston
Accountant
Dawn Rosenfeld
The Analyst Staff
Publisher, Heidi J. Zimmerman, CAE Managing Editor, Lynne Agoston Production Manager, Jennifer Olivares Technical Editor
September 22–25, 2021 Providence Convention Center and Omni Hotel Providence, Rhode Island
2022 Annual Convention & Exposition September 21–24, 2022 Vancouver Convention Centre Vancouver, Canada
2023 Annual Convention & Exposition
October 4–7, 2023 Grand Rapids Convention Center and Amway Grand Hotel Grand Rapids, Michigan
Also, please note that the following AWT committees meet on a monthly basis. All times shown are Eastern Time. To become active in one of these committees, please contact us at (301) 740-1421. Second Tuesday of each month, 11:00 am – Legislative/Regulatory Committee Second Tuesday of each month, 2:30 pm – Convention Committee Second Wednesday of each month, 11:00 am – Business Resources Committee Second Friday of each month, 10:00 am – Special Projects Subcommittee Second Friday of each month, 11:00 am – Cooling Subcommittee Second Friday of each month, 2:00 pm – Pretreatment Subcommittee Third Monday of each month, 9:00 am – Certification Committee Third Monday of each month, 3:30 pm – Young Professionals Task Force Third Tuesday of each month, 3:00 pm – Education Committee Third Friday of each month, 9:00 am – Boiler Subcommittee Third Friday of each month, 10:00 am – Technical Committee Quarterly (call for meeting dates), 11:00 am – Wastewater Subcommittee
Other Industry Events
ACS, Fall National Meeting & Expo, August 25–29, 2019, San Diego, California WEFTEC, Annual Technical Exhibition and Conference, September 21–25, 2019, Chicago, Illinois RETA, Annual Convention, October 8–11, 2019, Las Vegas, Nevada USGBC, GreenBuild, November 20–22, Atlanta, Georgia IWC, Annual Conference, November 10–14, 2019, Orlando, Florida
Michael Henley (303) 324-9507 mdhenleywater@gmail.com
Advertising Sales
Heather Prichard advertising@awt.org The Analyst is published quarterly as the official publication of the Association of Water Technologies. Copyright 2019 by the Association of Water Technologies. Materials may not be reproduced without written permission. Contents of the articles are the sole opinions of the author and do not necessarily express the policies and opinions of the publisher, editor or AWT. Authors are responsible for ensuring that the articles are properly released for classification and proprietary information. All advertising will be subject to publisher’s approval, and advertisers will agree to indemnify and relieve publisher of loss or claims resulting from advertising contents. Editorial material in the Analyst may be reproduced in whole or part with prior written permission. Request permission by writing to: Editor, the Analyst, 1300 Piccard Drive, Suite LL 14, Rockville, MD 20850, USA. Annual subscription rate is $100 per year in the U.S. (4 issues). Please add $25 for Canada and Mexico. International subscriptions are $200 in U.S. funds.
4
the Analyst Volume 26 Number 3
President’s Message
By David Wagenfuhr
recommending these changes, which would better define the Water Treatment Supplier member category, provide a vote for our supplier members, and achieve a general cleanup of the bylaws. The bylaws vote will be done in three parts, with a separate vote on each of these items. Be sure to attend this meeting to have your voice heard.
Are you using the AWT Exchange every day? I read it daily and continue to learn from all of the great water treatment professionals in our industry. Our online community makes it easy to share knowledge and provide instant answers in real time. I’m struck by how lucky we are to live in a time when we can share so easily and readily with one another.
We also have a great program planned with multiple panel sessions that will allow us to hear from more voices and have a better dialogue. The exhibit hall will showcase more exhibitors than ever before. And this year, you’ll have the opportunity to walk away with equipment or services you’re in need of, all while supporting our charity partner, Pure Water For the World (PWW), through our silent auction. Our exhibitors have really come through, with an overwhelming number of them donating goods and services.
At the same time, though, as the norms of our society continue to shift—as social media, telecommuting, and our digital worlds continue to expand, it strikes me how important in-person interaction is. During conferences and events, I always find those impromptu meetings in the hallway to be some of the most valuable interactions. I’m able to find solutions to problems and gain insights that might not have happened otherwise. The conversations are more robust when we’re face to face.
I also can’t wait to honor the winners of the Ray Baum Memorial Water Treater of the Year, the Supplier of the Year, and the Founders Award. These awards are a great honor, and it’s such a privilege to be able to present them to our exceptional award winners.
That’s why I’m looking forward to the AWT Annual Convention & Exposition in Palm Springs, California, in September. It’s a great time to learn, talk with peers in the industry, and get revitalized and refreshed about what we do every day.
At the conclusion of the convention, I end my term as AWT’s president. I’ve learned a lot during this time and have found it incredibly rewarding to serve AWT. This is an exciting time in AWT’s history as well as to be part of this great organization!
For our water treatment company members, you would have received a copy of the proposed bylaws that will be voted on during the Annual Membership Meeting. With the help of our bylaws task force, the board is
As always, I welcome your feedback and can be reached at president@awt.org.
Letter to the Editor I enjoy The Analyst because it keeps me current on what is happening in the water industry. One thing I wanted to point out was a statement in the article by Helmig, Ambler, and Ogonek (“Part 1: Understanding Cycles of Concentration and Cooling Water Quality”) in the Spring 2019 issue, which stated: “A typical cooling tower will recirculate and go through multiple cycles of the same water, known as a cycle of concentration (COC).” This is a common misconception regarding COC. This is not the correct way to explain COC to end users and especially new water treaters. The times the water recirculates or cycles through the system is not what a “cycle of concentration” is. Continued on page 6
5
the Analyst Volume 26 Number 3
Message From the President-Elect
By Tom Brandvold, CWT
going to Pure Water for the World (PWW). Not only can you walk away a successful bidder, but you will help AWT donate a record amount of money to PWW.
I am looking forward to the 2019 AWT Annual Convention & Exposition in Palm Springs, California. The Palm Springs Convention Center will become the hub of our water treatment world from September 11–14. You won’t want to miss the outstanding educational sessions, extraordinary technical presentations, and amazing exhibit hall.
At the conclusion of the Annual Convention, I will assume the role of AWT president. AWT has some great programs and services in the works for the coming year, and I look forward to developing them alongside our committed volunteers. One of the things we are working on for 2020 and beyond that could be a game changer is an online convention tailored to meet the needs of our companies’ administrative and support personnel. While the Business Resources Committee is still vetting the details of this initiative, the vision is to offer an interactive platform where HR, manufacturing, shipping/receiving, accounting, and operations personnel would meet virtually with subject matter experts in their fields without having to travel to a convention site. Once a reality, these virtual conventions will provide a connection for our administrative personnel in the same way AWT connects our customer-facing team members.
Our theme for the 2019 convention is “The Magic of Water,” and we welcome Ryan Oakes as our keynote speaker and awards dinner entertainer. Ryan is one of corporate America’s most sought-after performers and will use his unique brand of illusion as he speaks about the importance of having a "wow" factor and leaving an impression with customers and prospects. Although Ryan has appeared at the White House, I’m certain he has never been to an event quite like ours. Through his humor, entertainment, and a little illusion, Ryan will show us how we can bring magic to our businesses. We’ve added a new event to this year’s program. I encourage you to participate in our silent auction. Thanks to the generous donations from many of our exhibitors, we will have a plethora of equipment, products, and services that you can bid on, with all proceeds
As I step into my new role, I welcome your input on the future direction of AWT. I can be reached at carmac@ premierwater.com. Thank you for supporting AWT, and I look forward to serving you!
Letter to the Editor continued
One other thing that is confusing in the article is that induced draft crossflow towers are shown, as well as an induced draft tower schematic. It mentions forced draft being the most common in the industry, which we would disagree with. Induced draft is by far the most common. Sincerely, Brett Alexander, Marketing Applications Engineer, Evapco Authors’ Response: We have no argument, as this is a better definition of COC and consistent with U.S. Department of Energy and ASME definitions. We appreciate the difference between induced draft and crossflow; however, if we substitute the term “mechanical draft,” the discrepancy is resolved. Looking more closely at the description of “ induced versus forced-draft” towers, and thinking back on our personal experiences, I tend to agree that induced draft (fan at top pulling air through) are more common. These observations are based on our work at industrial manufacturing sites (small to medium scale facilities). Sincerely, Ed Helmig (also representing Susan Ambler and Peter Ogonek)
6
the Analyst Volume 26 Number 3
Annual Convention & Exposition September 11-14, 2019 Palm Springs Convention Center and Renaissance Palm Springs Hotel
Palm Springs, California
Sign up now at http://www.awt.org/annualconvention19
Four Reasons You Should Attend More sessions than ever before—You'll walk away with even more tools and skills that can have an immediate effect on the future direction of your business—and impact your bottom line. More networking—More attendees means more networking opportunities. The convention is a perfect time to meet leading experts in the field and build long-term relationships. New award—This year's Annual Reception and Awards Dinner will feature a new award and celebrate the achievements of those in the industry. Bigger exposition hall—With more exhibitors than ever before, you will learn about the latest advances in the industry and see demonstrations of products and technologies that are changing the field of water treatment.
7
the Analyst Volume 26 Number 3
In Memoria
Bennett P. Boffardi, Ph.D., FNACE
“Dennis was the visionary that started the original Technical Training Course in Chicago over two decades ago. It is because of Dennis that AWT has the Technical Training Course today.”
On June 10, 2019, Dr. Bennett P. Boffardi, FNACE, passed away with his family by his side. Ben served as technical editor of the Analyst for over 20 years. In 2001, Ben was awarded the AWT Ray Baum Memorial Water Technologist of the Year award.
“Some people look for credit for their accomplishments; Dennis looked to make others better, never being concerned about receiving personal credit. His legacy is that he was the Dutch Uncle of AWT, always helping, always encouraging, and always there for you when you needed a hand or someone to talk to.”
Dr. Boffardi was a graduate of St. John's University, with a master’s degree from the Polytechnic Institute of Brooklyn and a doctorate of physical chemistry from St. John's University.
Denny was predeceased by his wife of 51 years, Cleone; his parents, Alfred and Grace Clayton; and his brother, Keith. He is survived by his two daughters, Denise Cleone Clayton Delahanty (John) and Colleen Dana Anderson (Scott); his brother, Larry (Mary); four grandchildren, Connor and Shannon Delahanty and Nick and Alex Hannah (and their father, Don Hannah); his partner in his final years, the amazing Vonnie Olson; and many loving nieces and nephews.
He had a highly recognized career in the water treatment industry spanning over 40 years, held 17 U.S. patents pertaining to water treatment, and was a fellow in NACE International and past chair of the NACE Pittsburgh Section. Dr. Boffardi retired from Calgon Corporation, founding and acting as president of Boffardi & Associates, Inc., contributing locally and internationally to water treatment advancements.
Bill Smith
William Charles "Bill" Smith, 75, husband of Priscilla Allen Smith, died Tuesday, January 1, 2019. Born in Greensboro, North Carolina, Bill was the son of the late Franklin Astor and Vallie Talley Smith. He received a bachelor's degree from Campbell University and was an immediate past president of Campbell University Alumni Association. He was the owner of Chemgard, Inc. and was a past president of the Association of Water Technologies. Bill was a member of Aldersgate United Methodist Church and the Sons of the American Revolution, Col. Robert Anderson Chapter.
He is survived by his beloved wife of 56 years, Patricia; his son, Steven Boffardi and partner Heather Davis; his brothers, Patsy and wife Terri Boffardi, Louis J., and the late Francine Boffardi; as well as many loving nieces and nephews. He will truly be missed.
Dennis Clayton
Dennis “Denny” Clayton was born on September 23, 1936, and passed away on Tuesday, July 2, 2019. Denny was a past president and great contributor to AWT. As stated by some AWT members:
In addition to his loving wife of 54 years, he is survived by two daughters, Stephanie Gauthier (Bobby) and Abigail Moreno (George); and four grandchildren, Robert and Millie Gauthier and Jocelyn and Baltazar Moreno.
“AWT and most of us would not be who we are today without Dennis. He was a mentor, a friend, and above all the man that pushed us to be more than we ever dreamed we could be.”
8
the Analyst Volume 26 Number 3
In Memoria continued
David H. Paul
Paul Puckorius
David H. Paul, founder, president, and CEO of David H. Paul, Inc., passed away on June 27, 2019, at the age of 69. The entire David H. Paul, Inc. family is shocked and saddened by his passing.
Paul R. Puckorius, 88, a wellknown and respected water treatment expert, passed away on March 29, 2019. Paul attended North Central College in Naperville, Illinois, where he earned a bachelor’s degree in chemistry and mathematics, and completed graduate work at Northwestern University in Chicago.
David founded David H. Paul, Inc. in 1988. The advanced water treatment training, consulting, and technical services firm is located in Farmington, New Mexico. David had over 42 years of experience in advanced water treatment, held a master’s degree in microbiology from New Mexico State University, and published hundreds of technical articles and papers on advanced water treatment.
Paul began his career with Nalco Chemical Co. and then moved to Zimmite Corp. before launching Puckorius & Associates in 1976. Puckorius & Associates provided consulting services worldwide and offered training courses.
David is credited with training over 18,000 water treatment professionals and consulting at hundreds of high‐ tech water treatment plants worldwide. The numerous products and services created under his leadership will continue to be a quality benchmark for the industry.
Paul had more than 50 years of experience in cooling water, boiler water, and reuse water technologies. Over the years, he developed extensive knowledge and expertise related to Legionnaires’ disease. He authored more than 150 technical papers covering all phases of water problems and practical water treatment. He presented his work at a number of technical conferences, including the Cooling Technology Institute, International Water Conference, ULTRAPURE WATER, NACE, WATERTECH, and the Association of Water Technologies. Some of his papers were published in several water treatment journals, including The Analyst, CTI Journal, Industrial Water Treatment, Process Cooling, Ultrapure Water Journal, Water Conditioning & Purification, and World Water: Water Reuse & Desalination.
As part of David H. Paul, Inc.’s succession plan, Dr. Linda Paul takes over as president and CEO effective immediately. David is survived by his adoring wife, Alaska adventure partner, and best friend, Dr. Linda M. Paul; his daughters, Allison and Reagan; and his granddaughter, Mia Wheeler and grandson, Everett David Paul. David is also survived by his two sisters, Dr. Ruth Newton (and her partner Dr. Jill Weckey) and Lois Ruggles (and her husband Barry Ruggles).
Paul served as a member and past president on the Reuse Water Committee of the Cooling Technology Institute; was a member and served on the Executive Committee of the International Water Conference; was a member and past chairman of several committees, including recycle/reuse water at NACE; and was a member of AWWA and the WateReuse Association. Paul is survived by his twin brother, Ted Puckorius (Lana), of Avon Park, Florida, and children Susan Elsberry of Superior, Colorado; David Puckorius of Westminster, Colorado; and Cynthia Knight (Andrew) of Parker, Colorado. He also leaves four grandchildren: Hailey, Katelyn, Anna, and Garrett.
9
the Analyst Volume 26 Number 3
Ion Exchange Part 3: Tips for Loading and Unloading IX Resins Peter Meyers, ResinTech Inc.
Note: This article is Part 3 of a series on various aspects of how ion exchange (IX) resins are used. Not the actual applications mind you, but the physical aspects of touching resins, feeling them, and caring for them. This part covers loading and unloading of resins, including how much to load and how to unload.
How Much Resin to Load?
IX resins shrink and swell, depending on their ionic form and the ionic strength of the solution they contact. Resins also swell or shrink in solutions other than water. In vessels that are completely full of resin, such as packed beds, the swelling must be taken into account; otherwise, it is all too likely the resin will crush itself as it tries to swell but can’t. It is beyond the scope of this discussion to list every resin and every ionic form from every resin manufacturer. However, Table 1, which shows relative volume changes for various resins, can be used as a guideline. Table 1: Relative volume changes for different resins.
Relative size Sodium Hydrogen Calcium Potassium
Gel WAC 1.9 1.0 1.3 1.6
Macro WAC 1.6 1.0 1.2 1.4
6% gel SAC 1.0 1.1 .93 .95
8% gel SAC 1.0 1.08 .94 .97
10% gel SAC 1.0 1.07 .95 .98
Macro SAC 1.0 1.05 .96 .98
Chloride Hydroxide Sulfate Nitrate
Type 1 Gel SBA 1.0 1.25 1.03 .95
Type 1 Macro SBA 1.0 1.25 1.02 .96
Type II SBA 1.0 1.1 1.01 .98
Acrylic SBA 1.0 1.2 1.02 .95
Macro WBA 1.25 1.0 1.30 1.2
Acrylic WBA 1.2 1.0 1.25 1.2
Notes: WAC = weakly acidic cation SAC = strongly acidic cation SBA = strongly basic anion WBA = weakly basic anion
Please note that in Table 1, the shaded cells represent the customary reference form for various resins. Swelling is based on 100% of the stated ionic form. For resins that are partly in one form and partly in another, use the ratio of the ionic form(s) times the swelling. For other types of resins not listed here, consult a resin manufacturer’s product data sheets for swelling characteristics.
11
Freeboard Requirements Freeboard is defined as the empty space above the resin. Freeboard allows the water flow to spread out before it reaches the resin and helps prevent turbulence that can cause resin fluidization and consequent physical damage due to erosion. Freeboard also provides rising space to the resin can fluidize during backwash, allowing suspended solids trapped in the resin to be purged. Figures 1 through 4 show illustrations of freeboard and other spaces in various types of IX vessels. As noted in this section, the amount of allowed freeboard space will depend on the type of IX resin being loaded in the vessel.
the Analyst Volume 26 Number 3
Ion Exchange Part 3: Tips for Loading and Unloading IX Resins continued
Figure 1: Example of freeboard space in a co-flow IX vessel.
Figure 2: Example of freeboard space in a split-flow IX vessel.
12
the Analyst Volume 26 Number 3
Ion Exchange Part 3: Tips for Loading and Unloading IX Resins continued
Figure 3: Example of freeboard space in a counter-current IX vessel (air block or water block).
Figure 4: Example of freeboard space in a packed-bed IX vessel.
13
the Analyst Volume 26 Number 3
Ion Exchange Part 3: Tips for Loading and Unloading IX Resins continued
Here are some general guidelines on freeboard in IX systems: 1. For vessels where regeneration is not performed in the vessel, allow for a minimum of 3 to 6 inches freeboard, based on the most swollen form. 2. For co-flow regenerated vessels that do not have chemical distributors: a. Strongly acidic cation (SAC)-type cation resins— two-thirds full. b. Weakly acidic cation (WAC) type cation resin and all anion resins— half full. 3. For co-flow regenerated vessels that have separate chemical distributors: a. Cation resins 6 inches or more below the acid distributor. b. Anion resins 9 inches or more below the caustic distributor. 4. For countercurrent regenerated vessels with blocking flow and chemical collectors: resin 6 to 9 inches above the chemical collector. 5. For split-flow vessels with chemical collectors: follow resin manufactures advice (most splits are one-half top/bottom but some are one-third). 6. For packed beds: a. Cation units 1 to 3 inches freeboard in the most swollen form. b. Anion units 3 to 6 inches freeboard in the most swollen form.
Loading Packed Beds Freeboard in packed beds is critical. Too much freeboard allows resin movement and results in excessive fines forming because of erosion, especially in up-flow service packed beds. Too little freeboard and the resin swells, filling the open space and crushes itself. One way to overcome this is to load the swollen form of resin (hydrogen form for SAC resins and hydroxide form for strongly basic anion [SBA] resins). In these cases, the resin can be loaded until the packed bed is essentially full. When exhausted (shrunken) forms of resin are loaded into packed beds, it is suggested to deliberately underfill; run a regeneration (or two) then remeasure the bed height, and add or remove resin if necessary. 14
Loading Floating Inert Resin The floating inert resins used in packed beds are usually granular and because their density is less than water, they are especially difficult to load. This can be further complicated if the location of the resin inlet is not at the highest possible point on the vessel. Use a high ratio of water to inert media and keep the water level low. Be patient. Loading Layered Beds Layered beds have two different types of resin in them that are expected to stay separate during use. In most cases, layered beds use either two types of anion resin (weak and strong) or two types of cation resin (again weak and strong). There is very little density difference and even when the bead size is carefully controlled so that the weak resin is smaller than the strong resin; it is still difficult to keep the two types from mixing. Load the strong resin first. Backwash to remove fines and level the bed. Add 12 inches or more of water on top of the strong resin as a cushion. Add the weak resin slowly to minimize turbulence.
Loading Mixed Beds Loading mixed beds is similar to loading layered beds, except it is not quite as important to prevent mixing and is crucially important to rinse the cation resin before adding the anion resin. In these cases, load the cation resin first. If it is supplied in the salt form (usually sodium), the resin should be regenerated before adding the anion resin. After loading the cation resin, rinse it thoroughly until any trace of colored water is gone. This is very important because that color throw is well known to poison anion resin. The cation resin level (in the hydrogen form) should be above the interface collector. Drain the tank, open it up and remove any resin above the interface collector (by vacuum or scoop). This procedure removes any cation fines and ensures the resin interface is correctly positioned with respect to the interface collector. Mark the cation level on the outside of the tank next to the viewport. Add the anion resin. If the anion resin is supplied in the hydroxide form it may be loaded to approximately 6 inches below the caustic distributor, or for smaller tanks where caustic is introduced from the top of the vessel, so that the mixed-bed tank is approximately half-full. For anion resin supplied in the chloride form, load the Analyst Volume 26 Number 3
Ion Exchange Part 3: Tips for Loading and Unloading IX Resins continued
proportionally less (see percent-swelling table presented earlier in this discussion). Regenerate the anion resin. It is OK to regenerate the cation resin again, but if not it is necessary to keep the acid dilution water flowing upward through the cation resin to prevent the caustic from sinking down and potentially exhausting the cation resin with sodium. It is best not to mix the resin until after both resins have been regenerated. New mixed-bed resins tend to clump and this can make it difficult to separate them, especially when they are in their regenerated (hydrogen and hydroxide) forms.
Loading Resins for Use With Non-Water Liquids There are several added precautions for resins used with liquids other than water. It is essential to rinse out any organic leachables, especially if the liquid is juice or wine or sugar. For these applications, the resin should be “reverse cycled” before use. Reverse cycling would be acid, followed by caustic, followed by acid for cation resins, caustic, followed by acid, followed by caustic for anion resins. The acid/base cycling purges the resin of leachables that might otherwise add unwanted color or taste to the product. The water used for loading and regenerating should be drained out before the non-water solution is introduced. This prevents excessive dilution of the product. It should be understood that since resins are approximately 50% water by weight and shrink in most non-water solutions that some water will be squeezed out of the resin and some dilution of the initial bed volume of product is inevitable.
before removal, the interstitial water can have low or high pH (typically around pH 3 for H form cation resin and pH 11 for OH form anion resin). In cases where the resin has been used to remove some hazardous contaminant, there may be restrictions on discharge because of the presence of that contaminant in the unloading water. In these cases, containment or other means of controlling, limiting, and treating wastewater discharges should be provided.
Dewatering Dewatering of sacks is generally fairly easy, as most sacks will drip drain. Drums, totes, and tanks require a dewatering device. A simple and reasonably simple dewatering device can be made from a shop vac and sock.* The sock is tied or taped to a pipe that is attached to the suction hose. The sock end of the pipe is pushed down to the bottom of the resin. Excess water is then sucked out. Totes and tanks can be set up with a dewatering strainer in advance to simplify the process and minimize contact with hazardous resin. *Note: The term “sock” is meant to describe a suitable cloth cylinder, closed off at one end and securely fastened to the pipe at the other such that there are no gaps or spaces larger than 0.5 millimeter (mm). Yes, a cotton dress sock may be a convenient option. Just make sure they are reasonably new and without holes.
Unloading a tank can be as simple as opening up a resin outlet valve to as complicated as building a scaffold and temporary containment with the hazmat team overseeing every step of the process. Since circumstances dictate requirements, it is not possible to cover every eventuality. However, aside from the hoses and possibly other hardware needed to remove the resin, there are a few common things that need to be considered.
Unloading Strategies There are a variety of ways to get resin out of a tank. Smaller tanks can be physically lifted up and turned upside down. A hose can then be inserted into the tank to help flush out the resin. Companies that frequently unload small tanks generally make themselves a tank tipper or modify a drum tipper. If the tank is sufficiently elevated and there is a resin outlet connection located low on the tank, the resin can be drained by gravity. Pressure vessels with resin outlet connections can be drained under pressure. Tanks with only top entry can be vacuumed or siphoned. In addition, in extreme cases, resin can be manually unloaded by scoop and bucket methods, although this method is hard work.
Wastewater Discharge During the unloading process, excess water must be drained from the resin. In most cases, water can drain to the floor or building sump. If the resin was used in the hydrogen or hydroxide form and was not exhausted
Pressurized Flow By far the easiest way to get resin out of a pressure vessel is if there is a resin outlet connection that is (hopefully) located at the low spot on the tank. Simply connect a hose to the outlet, apply water (and or air) pressure to the
Unloading Resin
15
the Analyst Volume 26 Number 3
Ion Exchange Part 3: Tips for Loading and Unloading IX Resins continued
tank, and all (or at least most) of the resin will transfer out through the hose. The usual rules regarding resin transfer apply. It is generally easier to transfer resin with an air assist and a slow backwash flow. Hint: If there is a resin outlet connection but no valve (blind flange or plug), completely drain the vessel to solidify the resin. With the vessel drained, the connection can be opened without risk that the resin will pour out. Attach a modified fitting, valve, and hose connection. The tank must be completely drained though.
Gravity Flow Unloading by gravity flow is similar to unloading under pressure; there is only the difference in elevation between the liquid height in the tank and the height of the container used to receive the resin to work with. This means the bottom of the vessel has to be higher than the top of the container the resin is being unloaded into. A 3–4 foot elevation difference from the resin outlet to the top of the container receiving the resin is about the minimum needed to make a go of it. In general, it takes more time and water to unload a vessel by gravity flow than by pressurized flow. Tank Tipping Tank tipping is similar to drum tipping and is a fast, convenient way to unload smaller tanks. Simply turn the tank so the top points downward into the unloading container, open the top, and stick a hose (or pipe) in the tank to flush out the resin. Tipping tanks manually can be rather problematic. Consider that if a 9-inch diameter tank full of resin and water weighs approximately 110 pounds, considerably more weight than one person should be lifting by themselves. For occasional unloading, tanks can be laid down on their side and lifted with a forklift. For routine unloading, it is best to make a tank tipper. Eductor Syphons The same eductor syphon setup that can be used to load resin can also be used to unload resin. Eductors are simple to set up and use. However, they do require substantial water pressure (60+ pounds per square inch gauge [psig] is recommended) and cannot suck higher than about 10 feet nor discharge higher than about 15 feet above their suction point. They also use quite a lot of water compared to other methods. Permanent eductor setups often collect the spent motive water and reuse it (this requires repumping). 16
Vacuums and Vacuum Trucks Resin can be vacuumed out of a vessel by means of a vacuum truck or permanent vacuum set up. Shop vacs are generally not strong enough for this purpose. Vacuum trucks can be a convenient and fast way to unload resin. However, this method is not recommended if the resin is going to be put back into the tank at a later date, unless the vacuum truck is carefully cleaned out prior to use. Unloading Pumps The same types of pumps used to load resin can also be used to unload resin. The air diaphragm type is possibly best suited, although submersible pumps with recessed impeller can be lowered down into a tank and used to remove resin. Unloading Concerns Damage to internal distribution systems. When unloading a tank by inserting a pump, suction pipe, or hose, it is important to be aware of and careful with the internal distribution systems. Larger tanks often have chemical distributors or collectors that partially or fully block access to the resin below. It is all too easy to damage these internals when inserting or removing pipes, hoses, or pumps from a vessel. In some cases it is necessary to partially disassemble internal distribution systems to allow access. For older systems, especially those with plastic internals, there is significant risk of breakage, as older plastic distribution systems become increasingly brittle with age. Getting all the resin out of a tank can be a difficult process, especially if the underdrain is up above the bottom of the tank and the resin outlet (if present) is well above the bottom of the resin bed. Vessels that have manways on the lower side shell make final cleanout reasonably easy. Open the manway and suck the last traces of resin out into a shop vac. For vessels that do not have a lower manway, a vacuum or air diaphragm pump connected to a long suction pipe can be used (with the understanding to be careful not to damage the internals). If all else fails, it may be necessary to enter the tank for final clean out. Due care regarding confined spaces should be taken before entering a tank as this can be a major safety risk. Is it necessary to take the extra time to remove the last traces of resin? Hmmm. If the resin being removed is still in reasonably good condition, probably not. But if the resin is chemically damaged or physically fouled, the Analyst Volume 26 Number 3
Ion Exchange Part 3: Tips for Loading and Unloading IX Resins continued
leaving more than traces of the old resin behind can lead to contamination of the new resin and issues with poor performance. For ultrapure water systems, there should be no question, for best results get in there and remove every single resin bead.
PREMIXED PREMEASURED PRECISE
Support Beds and Subfills Subfills and support beds are usually gravel or anthracite and are more difficult to remove than resin. Eductors and pumps are generally not suitable for removing support beds. Vacuums work. Unfortunately, for large tanks, manual unloading of support beds and subfills is sometimes the only pragmatic way. Is it necessary to replace the support bed every time the resin is replaced? If the support bed is reasonably clean and free of mud or other suspended solids it may not be necessary to remove it.
Closure
This discussion about loading and unloading IX resins is Part 3 of an article series describing the physical aspects of how resins are used. Other parts include storage, moving resins from place to place, disposal, and step-by-step procedure outlines. Peter Meyers is the technical director for ResinTech Inc., an ion exchange resin manufacturer. Mr. Meyers has more than 45 years of experience covering a wide range of ion exchange applications, from demineralizers, polishers, and softeners to industrial process design and operation. Mr. Meyers is co-inventor along with Mike Gottlieb for a hybrid ion exchanger used to remove arsenic from potable water. He can be reached at pmeyers@ resintech.com.
Keep testing simple with the premier choice in water analysis. Tests available for: Dissolved Oxygen, COD, Ammonia, Phosphate and more. 9 Accuracy and repeatability 9 Easy training of operator personnel 9 Rapid test results 9 Economical 9 Visual and instrumental formats
This article is based on a paper presented by the author at the 2018 AWT Annual Conference, which was conducted Sept. 26–29, 2018, in Orlando, Florida.
www.chemetrics.com | 800.356.3072 17
the Analyst Volume 26 Number 3
Ways to Extend Performance of Phosphonates in Simulated Cooling Waters Zahid Amjad, Ph.D., Walsh University
In many industrial systems, including cooling, boiler, desalination, geothermal, and oil and gas, among others, scale formation presents significant operational challenges. Problems are prominent when it deposits on equipment surfaces and causes various operational challenges, such as reduced heat transfer and premature equipment replacement (1). Inorganic scales commonly encountered in industrial systems include carbonates, sulfates, and phosphates of alkaline earth metals. One of the main difficulties in anticipating scale formation is that various factors, including water composition, pH, temperature, hydrodynamics of the flow, dissolved and suspended impurities, heat exchanger metallurgy, surface roughness, and the presence of gas bubbles, influence scale formation in the bulk solution and on equipment surfaces. Phosphorous-containing compounds such as polyphosphates and phosphonates are widely used in a variety of industrial applications, such as water treatment, electroplating, pulp-and-paper slurries, scale removal, crude oil production, and pigment dispersion. Phosphonates differ structurally from polyphosphates in that they have a P-C bond rather than a P-O bond. The structural differences account for their superior stability under stressed operating conditions (i.e., high alkaline pH, high temperature). Phosphonates and polyphosphates prevent scale formation at “substoichiometric� dosages by adsorbing onto crystal growth sites of microcrystallites, thereby interfering with crystal growth and altering the crystal growth morphology. In addition, both phosphonates and polyphosphates have been shown to exhibit metal chelation and dispersancy activities. Phosphonates are also effective in controling mild steel corrosion. As corrosion inhibitors, phosphonates may generally be described as cathodic inhibitors. They function by reacting with calcium and polyvalent metal ions, particularly those of the corrosion products. The phosphonate-cation products form a protective nonconductive layer on the metal surfaces. This barrier separates the metal from the bulk water and prevents diffusion of oxygen to the metal surface, thereby preventing corrosion. A drawback of certain phosphonates, such as 1-hydroxyethylidene-1,1-diphosphonic acid (HEDP) and aminotris (methylene phosphonic acid) (AMP), as 19
well as other amino phosphonates, is their sensitivity to oxidizing biocides, such as chlorine or bromine-based biocides necessary to control microbiological growth (2). Orthophosphate (PO4)3-, one of the degradation products, can cause calcium phosphate scaling in high hardness process waters (3). Ashcraft (4) investigated the effects of temperature, pH, calcium hardness, and phosphonate concentration in the presence of soluble iron, and the loss of phosphonate due to adsorption onto Fe(III) sludge on the performance of AMP, HEDP, and 2-phosphonobutane 1,2,4-tricarboxylic acid (PBTC). Results showed PBTC to be superior to HEDP and AMP under conditions of high temperature or high pH, presumably because of the greater solubility of the Ca-PBTC salt. Smyk, et al. (5) and Amjad (6) reported the influence of various polymers on the precipitation of calcium phosphonate. Results of these studies reveal that acrylic and maleic acid-based co- and terpolymers perform better than homopolymers of acrylic acid and maleic acid. Recently, Amjad and Zuhl (7) reported that performance of phosphonates such as AMP, HEDP, and PBTC as calcium carbonate (CaCO3) inhibitors could be improved by incorporating high-performance deposit control polymer in the formulation. It was also shown that both polymer and phosphonate exhibit marked influence on the crystal morphology of CaCO3. The control of mineral scales, suspended matter, and corrosion in water treatment by various additives has been well researched. However, the interactions of treatment additives with hardness ions has been overlooked. the Analyst Volume 26 Number 3
Ways to Extend Performance of Phosphonates in Simulated Cooling Waters
One of the major concerns of the water technologists is the compatibility or tolerance limit of the anionic scale inhibitors with metal ions. The tolerance or compatibility is defined as the amount of the inhibitor (I) that can be added to the water system without significant precipitation of metal-inhibitor (M-I) salt. If the compatibility is poor and the dosage of the formulation used is higher, than the recommended level, not only does M-I precipitation occur, but also the overall scale formation becomes faster and could lead to many troubles (e.g., early shutdown, wasted time, reduced production, and low profitability). Recently, the use of bio-, hybrid, and synthetic polymers in industrial water systems as scale control agents and dispersants has increased significantly because of their superior thermal stability and excellent overall performance in controlling various mineral scales and dispersing particulate matter (8-10). In this article, we present results on the evaluation of a variety of polymers (i.e., synthetic, bio-, and hybrid) that can potentially be used in extending the tolerance of various phosphonates with metal ions for industrial water treatment.
continued
a combination electrode was used to adjust the solution pH. To avoid erroneous pH readings because of possible adsorption of scale inhibitor on electrode surface, the pH electrode was calibrated before each experiment with standard buffers.
Metal Ion Compatibility With Scale Inhibitor Testing Protocol Metal ion (i.e., Ca, Mg, Ba, and Sr, among others— referred to as M) compatibility or tolerance with scale inhibitors (polymeric or non-polymeric, hereafter known as I) was measured by monitoring turbidity. The test setup used a constant water bath, double-walled glass cell, and colorimeter for transmittance measurements.
Experiments
The M-I compatibility experiments were performed in a glass bottle (125 milliliters [mL] capacity) placed in a double-walled glass cell maintained at the required temperature. The test solutions were prepared by adding a known volume of stock solution of ‘I’ to a known volume of water in the glass bottle. After allowing the ‘I’ solution to equilibrate at the required temperature for at least 30 minutes, the pH was adjusted to the required value using dilute hydrochloric acid (HCl) and/or sodium hydroxide (NaOH).
Materials The chemicals used to prepare the solutions were Fisher Scientific ACS-certified grade. Stock solutions of known concentrations of calcium chloride, magnesium chloride, hydrochloric acid, sodium hydroxide, and various polymeric and non-polymeric scale inhibitors were prepared in double-deionized distilled water and used to prepare the test solutions. Phosphonates used in the present study were obtained from Solutia, USA. The polyamino polyether methylene phosphonic acid (PAPEMP) sample was obtained from a Chinese supplier. All polymers tested were commercial materials, and their stock solutions were prepared on an active solids basis. A pH meter equipped with
After pH adjustment, a known volume of ‘M’ stock solution was added to ‘I’ solution. The test solution pH was quickly readjusted to the required value. The total volume of the final solution was kept constant (i.e., 100 mL). The bottles were capped and continuously stirred with bars. At known time intervals (typically 40 minutes) transmittance readings were taken using the fiber optic probe. Duplicate/triplicate experiments were run to check the reproducibility of the compatibility data. In order to avoid a faulty signal, extreme care was taken to eliminate air bubbles in the solution, especially in the vicinity of fiber probe. When the concentration of inhibitor in the experimental solution exceeded the solubility limit of M-I salt, the solution became turbid and
"Duplicate/triplicate experiments were run to check the reproducibility of the compatibility data."
20
the Analyst Volume 26 Number 3
Ways to Extend Performance of Phosphonates in Simulated Cooling Waters
was detected by a steep decrease in light transmittance. Data acquisition was continued, with the experimental solutions containing varying concentrations of inhibitors to precisely determine the inflection point.
Results and Discussion
While many phosphonates are known, structures of five of the most commonly used phosphonates in water treatment, tested in the present study, are illustrated in Figure 1. These phosphonates differ significantly in terms of both the type and number of functional groups and molecular weight. Table 1 lists the types of water chemistry used in the present study. Figure 1: Structures of phosphonates tested.
continued
Tolerance of Phosphonates With Divalent Metal Ions Calcium Ions Certain applications of organophosphonate scale inhibitors are based on their precipitation as insoluble species with ions such as calcium (Ca 2+), barium (Ba 2+), and strontium (Sr2+). In geothermal wells, for example, precipitation of scale inhibitors as alkaline earth metal salts is desirable. Large amounts of inhibitor are “squeezed” in the oilfield well and remain there for a specified amount of time, during which the inhibitor precipitates with alkaline earth metals found in high-salinity brine and eventually deposits onto a rock formation. Once the well is opened again for operation, the metal inhibitor salts slowly dissolve to provide adequate levels of scale inhibitor in solution. Controlled dissolution of these salts is essential, as fast dissolution will lead to chemical wastage and slower dissolution will result in inefficient scale control (2, 11). In cooling water applications (especially in open recirculating systems), adequate levels of inhibitor at all times is essential. In these systems, occasionally higher concentrations of Ca 2+, coupled with inhibitor
Table 1: Types of water chemistry used.
Parameter Ca Mg Na Cl Ba Sr pH Temperature
Type A Concentration (mg/L) 240 (as Ca)
426 (as Cl)
9.50 120 °F 75 °F, 120 °F, 140 °F (for temp. effect)
Type B Concentration (mg/L) 240, 120, 80 (as Ca)
Type C Concentration (mg/L) 240 (as Ca) 144 (as Mg)
426, 213, 142 (as Cl)
426 (as Cl)
9.50 120 °F
822 (as Ba) 528 (as Sr) 9.50 120 °F
21
the Analyst Volume 26 Number 3
Type D Concentration (mg/L) 240 (as Ca) 393; 982; 6,071; 7,866; 19,665 (as Na) 426; 1,640; 3,458; 6,495; 24,708; 61,131 (as Cl)
9.50 120 °F
Ways to Extend Performance of Phosphonates in Simulated Cooling Waters
overfeeding, may lead to precipitation as insoluble Ca-inhibitor precipitates. Deposition of metal-inhibitor on equipment surfaces is detrimental to the overall performance of the cooling water system.
continued
Figure 2: HPA tolerance to calcium ions using Type A water chemistry.
Tolerance of inhibitor (i.e., phosphonate, poly[acrylic acid], acrylic acid-based co-, terpolymers) is defined as the ability of these additives to remain soluble in the presence of metal ions (e.g., Ca, Mg, Ba) at a given water chemistry. Tolerance usually decreases with increasing pH due to increased deprotonation of inhibitors. Additionally, temperature also influences tolerance of inhibitor with metal ions. In general, the higher the water temperature, the lower the inhibitor tolerance to metal ions. It is noted that precipitation of metal-inhibitor salts (i.e., Ca-HEDP, Ca-PAA) can cause fouling of reverse osmosis (RO) membrane and heat exchanger surfaces. In addition, the inhibitor concentration decreases in the system (i.e., cooling water, desalination) to the extent that severe scaling can occur. It should also be recognized that metal-inhibitor scales usually have the same inverse solubility profiles commonly observed with other mineral scales, and they impede heat transfer and RO process.
Figure 3 presents Ca ion compatibility data for AMP and HEDP. It can be seen that AMP is more compatible than HEDP. It is worth noting that whereas AMP shows better Ca ion tolerance compared to HEDP, AMP is more susceptible to degradation by oxidizing agents. Moreover, on oxidation, AMP generates phosphate ions that may lead to additional fouling by calcium phosphate. It is interesting to note that AMP compared to HEDP has been reported to exhibit good-to-excellent inhibitory activity for gypsum precipitation (12).
"It should also be recognized that metal-
Figure 3: AMP and HEDP tolerance to calcium ions using Type A water chemistry.
inhibitor scales usually have the same inverse solubility profiles commonly observed with other mineral scales." Using the experimental protocol detailed above, a series of experiments was carried out to determine the tolerance limit of phosphonates. Figure 2 presents the typical “%transmittance,” (%T) versus phosphonate (i.e., HPA) concentration profile for duplicate experiments using Type A water chemistry. As illustrated in Figure 2, the inflection point was used to calculate the point of onset of turbidity (i.e., concentration of HPA required to cause precipitation). Based on the data presented, the tolerance limit of HPA is 39 ± 2 milligrams per liter (mg/L). The reproducibility was satisfactory (±7%), as may be seen from the coincidence of the curves for HPA.
22
To study the impact of carboxylic acid (-COOH) groups present in phosphonates, Ca ion tolerance experiments were conducted with Type A water chemistry and with varying dosages of HPA (containing hydroxyl, (OH); -COOH, -PO3H 2 groups) and PBTC (containing -COOH (3); -PO3H 2 groups). Results presented in Figure 4 show that incorporation of – COOH and/or increasing the chain length results in improved tolerance of HPA and PBTC with Ca ions. the Analyst Volume 26 Number 3
Need Materials
FAST?
We’ve been ready since 1921! › DEEPEST INVENTORY of a wide variety of products for boiler and cooling towers › EXTENSIVE CERTIFICATE OF ANALYSIS completed in-house and on every lot produced › QUICKEST SHIPMENT — usually same day order is placed › CUSTOMER SERVICE and support that you can trust › TOP BRAND QUALITY at a generic label price
See our expanded NorthQuest offering at www.NorthQuest.US or call 717.845.8648
Ways to Extend Performance of Phosphonates in Simulated Cooling Waters
continued
For example, Ca ion tolerance values obtained for HPA and PBTC are 39 and 72 mg/L, respectively, compared to 12 and 7 mg/L obtained for AMP and HEDP, respectively. It is evident from Figure 4 that PBTC is significantly more resistant to precipitation as Ca salt than either HEDP, AMP, or HPA.
For example, one would expect that as the number of phosphonate groups increases, the ease and speed of precipitation would increase. This is not true. A pentaphosphonate (i.e., bis(hexamethylene triaminepenta [methylenephosphonic acid]) essentially does not form any precipitates.
To study the impact of neutral moiety (i.e., propylene oxide-ethylene oxide) present in PAPEMP, several compatibility experiments were carried out using Type A water chemistry and varying dosages of PAPEMP. It can be seen in Figure 4 that PAPEMP, a non-ionic containing group, exhibits superior tolerance to Ca ions. Based on their Ca ion tolerance, these phosphonates can be ranked (in terms of decreasing order) as follows: PAPEMP > PBTC > HPA > AMP > HEDP.
As observed in the present study, the situation becomes more complicated when the additive has "mixed" groups (e.g., phosphonates and carboxylates present in HPA and PBTC). Based on the data presented, PBTC, compared to HEDP, AMP, and HPA, is the most Ca-tolerant phosphonate. Furthermore, incorporation of a neutral moiety (i.e., ether group as in PAPEMP) exhibits significant improvement in the Ca tolerance of PAPEMP. It is apparent from the present study as well as from the prior work that metal-phosphonate precipitation chemistry is very complex and that more work is needed to better understand the physicochemical processes involved in the metal-phosphonate precipitation reaction.
Figure 4: Plots of % transmittance as a function of phosphonate concentration using Type A water chemistry.
"One would expect that as the number of phosphonate groups increases, the ease and speed of precipitation would increase. "
The interactions of divalent metal ions with phosphonates under a variety of experimental conditions has been the subject of intensive research (13-16). Results of these studies show that precipitation of metal-phosphonate salts strongly depends on several factors, including pH, temperature, concentration of divalent metal ions, phosphonates, stoichiometry of divalent metal ions:phosphonate, and ionic strength. The general trend for metal phosphonate precipitation follows the charge on the cation (i.e., the higher the cationic charge, the faster and more efficient the precipitation). Also, at a higher pH, metal-phosphonate precipitation becomes faster. Additionally, there is no specific trend that relates the number of phosphonate groups with the speed of precipitation as observed in the present investigation. 24
Cooling water systems are increasingly operated under higher cycles of concentration (COC), causing greater driving forces for the precipitation of scale-forming salts, especially calcium carbonate and calcium phosphate. To understand the impact of higher concentration of Ca ions or increased COCs, several tolerance experiments were carried out using Type B water chemistry at three different Ca ion concentrations (i.e., 80, 120, 240 mg/L as Ca) and varying concentrations of HEDP. Results of these experiments, presented in Figure 5, clearly show that Ca ion concentration exhibits profound effect on the tolerance of HEDP. For example, in the presence of 240 and 120 mg/L of Ca (as Ca), HEDP tolerance values are 7 and 9 mg/L, respectively, compared to 12 mg/L obtained in the presence of 80 mg/L Ca (as Ca). It should be noted that similar Ca ions concentration dependence as observed for HEDP was also seen for other phosphonates (i.e., HPA, AMP, and PBTC) (17, 18).
the Analyst Volume 26 Number 3
QualiC
SUPPLIER OF THE YEAR
Bringing Quality Blending To The West Coast QualiChem is proud to announce the opening of our new precision blending facility in Verdi, Nevada. We are now better positioned to provide our customers with industryrecognized benefits and services coast to coast. Just one more way we are demonstrating how‌
The Blender Matters
No Direct Sales Precision Manufacturing Formulatory Expertise Application Support Custom GHS-Compliant Labels and SDSs
Please visit us at the AWT 2019 Annual Convention & Exposition – Booth #457. 800.296.9102 | www.qualichem.com AN ISO 9001:2015 COMPANY
QualiChem_AWT_8.5x11_05-19_v6b_FA.indd 1
6/12/19 10:59 AM
Ways to Extend Performance of Phosphonates in Simulated Cooling Waters
Figure 5: Effect of Ca ion concentrations (as Ca ions) on HEDP tolerance using Type B water chemistry.
Mg, Sr, and Ba Ion Tolerance to HEDP To study the tolerance of HEDP with various divalent metal ions, several experiments were conducted using Type C water chemistry. Results of these experiments are presented in Figure 6. It can be seen that tolerance of HEDP strongly depends on the type of metal ions. For example, under similar experimental conditions, Mg ions show higher tolerance to Mg-HEDP precipitation. For example, % transmittance values obtained in the presence of 20 mg/L HEDP for Ca, Sr, and Ba are 75, 64, and 61%, respectively, compared to 99% obtained for Mg ions (higher %T value indicates better tolerance of HEDP). Based on the data presented in Figure 6, divalent metal ions can be ranked in terms of decreasing tolerance as follows: Mg >> Ca >> Sr, Ba. It is worth noting that the metal-HEDP tolerance (or precipitation) trend as observed in the present study is consistent with solubility product values for Ca/Sr/Ba-SO4 salts (19). Figure 6: Tolerance of HEDP with Mg, Ca, Sr, and Ba ions (Type C water chemistry).
26
continued
Tantayakom, et al. (20) investigated the Ca-AMP precipitation in the presence of Mg ion. The results revealed that the amount of AMP precipitated decreased with addition of Mg ions in solution at all values of the solution pH. Furthermore, an increase in both the solution pH and the concentration of divalent metal ions in solution resulted in a change of the molar ratio of (Ca + Mg) to AMP in the precipitate. At a low-solution pH (pH 1.5), Mg ions had little effect on the composition of Ca-AMP precipitate. However, at higher values of solution pH (pH 4 to 7), the Ca to AMP molar ratio in the precipitate decreased with increasing concentration of the Mg ions. Thus, the influence of Mg ions on Ca-phosphonate precipitation is a complex phenomenon, and more work is needed to fully understand the formation of metal phosphonate salts, especially in recirculating cooling water systems. Solution Temperature Effect It is generally agreed that solubility of scale-forming salts is influenced by various factors (i.e., pH, temperature, and total dissolved salts, among others). Moreover, it is also well understood that solubility of calcium carbonate, calcium sulfate, and barium sulfate is inversely dependent on solution temperature. The solubility–temperature relationship suggests that the scaling tendency will be higher at the heat exchanger surface than in other parts of the re-circulating water system. To understand the influence of temperature on the tolerance of Ca ions with HEDP, AMP, HPA, and PBTC, a series of experiments was carried out using Type A water chemistry at different solution temperatures and as a function of phosphonate concentrations. Results, presented in Figure 7, clearly indicate that solution temperature has a pronounced effect on the tolerance of phosphonate with Ca ions. The observed temperature dependence on phosphonates compatibility with Ca ions may be attributed to increased ionization of phosphonate and carboxylate groups with increasing temperature. It is worth noting that PAPEMP under similar experimental conditions shows exceptional tolerance to calcium ions. The arrow in Figure 7 indicates that no turbidity was observed with >100 mg/L PAPEMP concentration.
the Analyst Volume 26 Number 3
Water is life – that’s why we care
Access to a World of Difference Offering products and solutions tailored to each customer’s individual needs.
Visit Brenntag in Palm Springs! AWT | Sept. 11-13 | Booth #247/249
Our technicians and sales experts utilize our global network to devise innovative solutions and procure the highest-quality products on the market. ■ Global footprint and sourcing capabilities ■ In-house network of technical professionals ■ Ability to bring knowledge to the marketplace To learn more about what we have to offer, visit brenntagwater.com or call (800) 890-0355. Acids and Alkalis, Activated Carbon, Bioaugmentation, Biocides and Disinfectants, Chlorine Dioxide, Coagulants, Corrosion Inhibitors, Defoamers, Filtration Media, Flocculants, Glycols, Heavy Metal Removal, Ion Exchange Resins, Odor Control, Other Specialties, Permanganate, and Scale Inhibitors.
Ways to Extend Performance of Phosphonates in Simulated Cooling Waters
Figure 7: Effect of solution temperature on tolerance of HEDP with Ca ions (Type A water chemistry).
Total Dissolved Solids Effect In addition to the effect of divalent metal ions and temperature, it is worthwhile to examine the influence of total dissolved solids (TDS) (expressed as sodium chloride, NaCl) on the tolerance of HEDP with Ca ions. Figure 8 presents % transmittance (%T) data collected in the presence of Ca ions (Type D water chemistry: 240 mg/L as Ca, 20 mg/L HEDP, pH 9.50, 120 °F). It can be seen that Ca-HEDP tolerance is not significantly affected by NaCl in the range 1,000 to 20,000 mg/L as NaCl. It should be noted that increasing the NaCl concentration by fourfold (i.e., from 5,000 to 20,000 mg/L) results in marginal increase (from 76% to 82%) in %T value, and a further increase in NaCl to 50,000 mg/L shows improvement in HEDP tolerance to Ca ions. The observed increase in Ca ion tolerance with increasing NaCl concentration suggests that Ca-HEDP salt is more soluble in high-TDS water. Figure 8: Effect of NaCl concentration on HEDP tolerance to Ca ions using Type D water chemistry.
continued
Extending Phosphonate-Ca Ion Tolerance With Additives For industrial water treatment, phosphonates have been shown to be broadly effective in controlling scale and mild steel corrosion. A loss of scale and corrosion control can occur if calcium phosphonate scale precipitates. Although phosphonates are generally considered tolerant to hardness ions, harsh conditions (e.g., high hardness, high alkaline pH, temperature) such as already discussed can cause phosphonates to precipitate as calcium salts or to co-precipitate with other salts and deposit on heat exchanger surfaces. Thus, for better scale and corrosion control it is important to prevent the precipitation of calcium phosphonates or extend the hardness tolerance limit of phosphonate by incorporating additives (polymeric and/or non-polymeric) into water treatment formulation. Non-Polymeric Additive Effect To understand the impact of additives in extending phosphonate tolerance to Ca ions, three types of additives were evaluated: 1. Non-polymeric, such as Mg ions and PAPEMP; 2. Synthetic polymers, such as homoand copolymers of acrylic acid, maleic acid; and 3. Bio- and hybrid polymers. Figure 9 presents %T versus additive concentration profiles for experiments carried out using Type A water chemistry with 15 mg/L HEDP and in the presence of varying concentrations of Mg ions and PAPEMP. It can be seen that %T value increases with increasing additive concentration, suggesting that Ca-HEDP tolerance can be extended with Mg ions and PAPEMP. Based on the data presented in Figure 9, >99%T value was achieved with 50 mg/L of PAPEMP compared to 180 mg/L for Mg ions. Figure 9: Effect of Mg ions and PAPEMP dosage on HEDP tolerance to Ca ions using Type A water chemistry.
28
the Analyst Volume 26 Number 3
Ways to Extend Performance of Phosphonates in Simulated Cooling Waters
Synthetic Polymers The influence of synthetic polymers in extending phosphonate tolerance has been reported. Zhang, et al. (21) investigated the influence of polymers of varying composition on Ca-HEDP precipitation. Results suggest that Ca-HEDP precipitation can be significantly delayed by adding terpolymers to the Ca-HEDP solution. Amjad and Zuhl (22) reported that performance of polymers as Ca-HEDP inhibitors are affected by low levels of cationic flocculants. The influence of polymers of varying composition was studied using Type A water chemistry containing 15 mg/L HEDP and varying concentrations of homo(PAA, polyacrylic acid), co- (PASA, acrylic acid:2acrylamido-2-methyl propane sulfonic acid), and terpolymer (PASS (acrylic acid:2-acrylamido-2-methylpropane sulfonic acid:sulfonated styrene). Figure 10 presents %T versus dosage profiles for homo-, co-, and terpolymers. There are two points worth noting in Figure 10: 1. The %T value increases with increasing co- and terpolymer concentration, suggesting varying degree of influence in extending HEDP tolerance to Ca ions; and 2. The %T value decreases with increasing homopolymer concentration, indicating incompatibility or precipitation of Ca-PAA salt. Based on the data presented to achieve >99% %T value, 15 mg/L of PASS is needed compared to 20 mg/L of PASA. It is interesting to note that a similar performance trend as observed in the present study has been reported for calcium phosphate system (23). Figure 10: Performance of homo-, co-, and terpolymers on HEDP tolerance to Ca ions (Type A water chemistry with 15 mg/L HEDP).
29
continued
Bio- and Hybrid Polymers As presented in Figures 3 and 4, all phosphates tested showed varying degrees of sensitivity or tolerance to calcium ions. In other words, these phosphonates form insoluble salt when reacted with calcium ions. To extend calcium ion tolerance with HEDP or inhibit the precipitation of Ca-HEDP salt, several experiments were carried out using Type A water containing 15 mg/L HEDP. The polymers tested include the biopolymers polyaspartic acid, PASP, polyitaconic acid, PIA, polyeposxysuccinic acid, PESA, ligonosulfonate, LS, and hybrid polymers (i.e., carboxymethyl inulin, CMI-15, and -25, where -15 and 25 indicate degree of carboxylation). Results of these experiments are presented in Figure 11. Figure 11 presents %T data collected in the presence of 15 and 25 mg/L for a variety of bio-, hybrid, and synthetic homopolymers (i.e., PAA, polymaleic acid, PMA, and copolymers of maleic acid:sulfonated styrene, MAS). Results presented in Figure 11 clearly show that homo-polymers (synthetic, bio-, and hybrid) are ineffective in extending HEDP tolerance to Ca ions. It is worth noting that all homopolymers show decreased %T values compared to a control (no polymer), indicating poor compatibility of polymers with Ca ions. However, under similar experimental conditions, co- (maleic acid:sulfonated styrene, MAS; acrylic acid:t-butylacrylamide, ATBA) and terpolymer PASS (Figure 10) show positive influence on HEDP tolerance to Ca ions. Figure 11: Effect of synthetic, bio-, and hybrid polymers on HEDP tolerance to Ca ions (Type A water chemistry with 15 mg/L HEDP).
the Analyst Volume 26 Number 3
Ways to Extend Performance of Phosphonates in Simulated Cooling Waters
continued
Figures 12 and 13 illustrate polymer structures. Figure 12 shows structures of bio- and hybrid polymers, while Figure 13 illustrates structures of synthetic polymers. Figure 12: Structures of bio- and hybrid polymers.
Figure 13: Synthetic polymer structures.
Summary This study has shown that: 1. Hardness ion tolerance of phosphonates strongly depends on the water chemistry (e.g., hardness ion concentration, temperature, total dissolved solids). 2. All phosphonates investigated (i.e., HPA, HEDP, AMP, PBTC, and PAPEMP) exhibit tolerance to hardness ions to a varying degree. Based on the Ca-phosphonate tolerance data, phosphonates can be ranked (in terms of decreasing order) as follows: PAPEMP >> PBTC > HPA > AMP > HEDP. 3. Phosphonate tolerance toward metal ions (i.e., Ca, Mg, Ba, and Sr) depends on metal ion concentration and the character of the metal ion. 30
4. The addition of non-polymeric additives (i.e., Mg ion, PAPEMP) to Ca-HEDP supersaturated solution exhibits positive influence on phosphonate tolerance to Ca ions. 5. Homopolymers (i.e., polyacrylic acid, polymaleic acid, polyaspartic acid, polyitaconic acid) and hybrid polymers (i.e., carboxylmethyl inulin) exhibit negative influence on phosphonate tolerance to Ca ions due to poor compatibility with Ca ions. 6. The addition of co-polymer and terpolymer to Ca-HEDP supersaturated solutions shows positive influence on phosphonate tolerance to Ca ions. Overall, the order of performance is: terpolymer > copolymer > homopolymer. the Analyst Volume 26 Number 3
Ways to Extend Performance of Phosphonates in Simulated Cooling Waters
Acknowledgement
The author would like to thank the Department of Chemistry, Walsh University, for providing the research facilities needed for this study.
References
1. Amjad, Z.; Demadis, K., eds. (2015). Mineral Scales and Deposits: Scientific and Technological Approaches, Elsevier. Amsterdam, the Netherlands.
2. Demadis, K.D.; Ketsetzi, A. (2007). “Degradation of Phosphonate-Based Scale Inhibitor Additives in the Presence of Oxidizing Biocides: “Collateral Damages” in Industrial Water Systems,” Separation Science and Technology, 42, pp. 1639–1649. 3. Perez, L.; Freese, D. (May 9–14, 1997). “Scale Prevention at High LSI, High Cycles, and High pH without the Need for Acid Feed,” CORROSION 1997, Paper No. 174, New Orleans, LA. 4. Ashcraft, R.H. (March 25–29, 1985). “Scale Inhibition Under Harsh Conditions by 2-Phosphonobutane 1,2,4-tricarboxylic acid,” CORROSION 1985, Paper No. 132, Boston, MA.
5. Smyk, E.E.; Hoots, J.; Fivizanni, K.F.; Fulks, K.E. (March 21–25, 1988) “The Design and Application of Polymers in Cooling Water Programs,” CORROSION 1988, Paper No. 14, St. Louis, MO.
6. Amjad, Z.; Zuhl, R.; Thomas-Wohlever, J. (2000). “Performance of Anionic Polymers as Precipitation Inhibitors for Calcium Phosphonates: The Influence of Cationic Polyelectrolytes,” Chapter 6 in Advances in Crystal Growth Inhibition Technologies, Amjad, Z., ed., Kluwer Academic Publishers, New York, NY.
7. Amjad, Z.; Zuhl, R.; Zibrida, J. (Nov. 3–4, 2004). “The Use of Polymers to Improve Control of Calcium Phosphonate and Calcium Carbonate in High Stressed Cooling Water Systems,” Association of Water Technologies Annual Convention, Nashville, TN. 8. Demadis, K.; Stathoulopoulou, A. ( January 2006). “Multifunctional, Environmentally Friendly Additives for Control of Inorganic Foulants in Industrial and Process Application,” Materials Performance 45(1), pp. 40–44. 9. Boels, L.; Witkamp, G. (2011). “Carboxymethyl Inulin Biopolymers: A Green Alternative for Phosphonate Calcium Carbonate Crystal Growth Inhibitors,” Crystal Growth Design, 11, pp. 4155–4165. 10. Bain, D.; Fan, G.; Fan, J.; Brugman, H.; Enoch, K. (April 7–12, 2002). ” Laboratory and Field Development of a Novel Environmentally Acceptable Scale and Corrosion Inhibitor,” CORROSION 2002, Paper No. 02230, Denver, CO.
11. Demadis, K.; Lykoudis,P. (2005). “Chemistry of Organophosphonate Scale Growth Inhibitors: 3. Physiochemical Aspects of 2-Phosphonobutane-1,2-4 Tricarboxylate (PBTC) and its Effect on CaCO3 Crystal Growth,” Bioinorganic Chemistry and Applications 3, pp. 135–149. 12. Yuan, M. (2010). “Latest Developments in Oilfield Scale Control,” Chapter 8 in The Science and Technology of Industrial Water Treatment, Amjad, Z., ed., CRC Press, Boca Raton, FL.
13. Browning, F.H.; Fogler, H.S. (1996). “Effect of Precipitation Conditions on the Formation of Calcium-HEDP Precipitates,” Langmuir 12, pp. 5231–5238.
14. Demadis, K.; Katarachia, S. (2004). “Metal-Phosphonate Chemistry: Synthesis, Crystal Structure of Calcium-Aminotris(Methylene Phosphonate) and Inhibition of CaCO3 Crystal Growth,” Phosphorus Sulfur, Silicon 179, pp. 627–648.
continued
18. Demadis, K.; Yang, B.; Young, P.R.; Kouznetsov, D.L.; Kelley, D.G. (2000). “Recent Development of New Cooling Water Chemical Treatment Programs for Scale and Microbial Control,” Chapter 16 in Advances in Crystal Growth Inhibition Technologies, Amjad, Z., ed., Plenum Press, New York, NY. 19. Skoog, D.A.; West, D.M. (1974). Analytical Chemistry: An Introduction, Holt Reinhart Winston, New York, NY.
20. Tantayakom, V.; Fogler, H.S.; de Moraes, F.F.; Bualuang, M.; Chavadwj, S.; Malakul, P. (2004). “Study of Ca-ATP Precipitation in the Presence of Magnesium Ions,” Langmuir 20, pp. 2220–2226. 21. Zhang, B.; Zhang, L.; Li, F.; Hu, W.; Hannam, P.M. (2010). “Testing the Formation of Ca-Phosphonate Precipitates and Evaluating the Anionic Polymers as Ca-Phosphonates and CaCO3 Scale Inhibitors in Simulated Cooling Water,” Corrosion Science 52, pp. 3883–3890.
22. Amjad, Z.; Zuhl, R.W.; Thomas-Wholever, J.A. “Performance of Anionic Polymers as Precipitation Inhibitors for Calcium Phosphonates: The Influence of Cationic Polyelectrolytes,” Chapter 6 in Advances in Crystal Growth Inhibition Technologies, Amjad, Z., ed., Plenum Press, New York, NY.
23. Amjad, Z. (1998). “Development of Calcium Phosphate Inhibiting Polymers for Cooling Water Application,” Chapter 16, Calcium Phosphates in Biological and Industrial Systems, Amjad, Z., ed., Kluwer Academic Publishers, Boston, MA.
Author Zahid Amjad, Ph.D., is a visiting professor in chemistry at Walsh University, N. Canton, Ohio. He has more than 35 years of experience in water soluble polymer research. Dr. Amjad has an M.Sc. degree from Punjab University and a doctorate from Glasgow University, and was a post-doctoral fellow at the State University of New York at Buffalo. A member of NACE for more than 35 years, Dr. Amjad is also a NACE fellow, received a NACE 2016 Technical Achievement Award, and received the Association of Water Technologies’ 2002 Ray Baum Memorial Water Technologist of the Year Award. He is also a member of the American Chemical Society, was inducted into the National Hall of Corporate Investors, and is listed in American Men and Women of Sciences and Who’s Who of American Inventors. He holds 30 U.S. patents, has published more than 150 papers and articles, and has edited nine books. The copyright for this technical paper is held by NACE International. The paper was presented at CORROSION 2018, which was conducted April 15–19, 2018, in Phoenix, Arizona. It is published with permission of NACE International. For further information, visit www.nace.org.
15. Valiakhmetova, A.; Sorbie, K.S.; Boak, L.S.; Show, S.S. (2016). “Solubility and Inhibition Efficiency of Phosphonate Scale Inhibitor-Calcium-Magnesium Complexes for Application in a Precipitation-Squeeze Treatment,” SPE Production and Operations, pp. 1–8. 16. Oddo, J.E.; Tomson, M.B. (1990). “The Solubility and Stoichiometry of Ca-Diethylenetriamine penta(methylene phosphonate) at 70°C in Brine Solutions at 4.7 and 5.0 pH,” Applied Geochemistry 5, pp. 527–532.
17. Masler, W.F.; Amjad, Z. (March 21–25, 1988). “Advances in the Control of Calcium Phosphonate with a Novel Polymeric Inhibitors,” CORROSION 1988, Paper No.11, St. Louis, MO.
31
the Analyst Volume 26 Number 3
Key Steam and Condensate System Factors That Can Affect HRSG Operation Charles Kuhfeldt, CauseWay Water Consulting and Services
32
the Analyst Volume 26 Number 3
Introduction
New HRSGs associated with industrial plants often include boiler feedwater production water plants. However, in many locations, not the entire boiler feedwater preparation and handling is upgraded at the same time that a power boiler is replaced or upgraded to an HRSG. Consequently, there is a mixture of feedwater purities and handling methods in some production plants.
The history of industrial steam use includes the development of steam generators operating at increasingly higher pressures. One of the essential technology advancements for the operation of boilers at increased pressures is the development of equipment and techniques that make large amounts of high-purity boiler feedwater.
When a new HRSG unit is installed as a replacement boiler or as an additional steam source for an industrial facility, there are several connections, or tie-ins, to be made between the HRSG(s) and the production facility. Some of these modifications include the high-pressure, and possibly the intermediate-pressure and low-pressure steam. If the new HRSG will have its own water purification plant, that plant also will be connected to a water supply. In many installations, there is return condensate to the HRSG feedwater system.
Many production plants, such as chemical plants and oil refineries and other facilities, utilize steam for power transmission and heating. Most of these facilities also use steam generation as an energy transfer and conservation technique. These steam systems can be complicated, particularly after operating through decades of operation and growth.
A common rule of thumb for estimating operating life expectancy of a power boiler in an industrial plant is 40 years. With careful maintenance and repair, boilers can exceed that operating life span. There are some boilers, not commonplace, approaching 60 years and older that are still operating in industrial plants. The existing installed boilers designed for lower operating pressures when they were built still work at lower pressures than the large-scale modern combined-cycle high-pressure heat recovery steam generators (HRSGs).
Applications The majority of manufacturing production processes do not need high-pressure steam; therefore, these boilers operate at lower pressures. At pressures less than 600 pounds per square inch gauge (psig), it is very common to find water purified by sodium zeolite softening, or in many cases, reverse osmosis. There are systems deliberately producing boiler feedwater that is not capable of being used in the higher pressure HRSGs now being installed. Many systems utilize demineralized water that is not finished with mixed-bed demineralization. This feedwater is also not suitable for high-pressure HRSGs. Combined-cycle power generation facilities use an HRSG unit to recover the thermal energy in the exhaust from the gas turbine to produce steam and generate electricity. This is a very efficient way to burn fuel, and it represents an extremely attractive replacement steam-generating approach for aging power boilers in industrial facilities.
33
This article uses six configuration cases to organize the discussion of these connections and the impacts on the reliability of feedwater purity. These cases start with the basic HRSG configuration and add increased complexity and potential risk to feedwater quality as we move through the cases.
Water Treatment Aspects Additional factors beyond the six configuration cases that affect the risk of contamination in the feedwater to the HRSG system are also discussed. These are the size of the operating plant, its maintenance capability, and the age of the operating plant. Integrating a high-pressure HRSG as part of a combined-cycle power-generating unit with production plant steam systems includes the necessity to eliminate or polish the water impurities that could come from the production plant sections. Prevention of water impurities from reaching the HRSG system normally uses condensate-polishing equipment at the condensate return point to the HRSG system. In addition to the polishing equipment, the condensate supplied to the HRSG system can be protected from the contamination originating in the production plant by the degree of physical, mechanical isolation from the contamination. The common methods of isolation are complete separation (no physical connection) or closed valves, or blinds. The operational flow the Analyst Volume 26 Number 3
Key Steam and Condensate System Factors That Can Affect HRSG Operation
balance also provides some protection by diverting the contamination to lower pressure feedwater systems or to waste. Condensate or feedwater polishing can solve many of the problems of contamination, but the polisher capability must match or exceed the potential contamination to be effective. The cases and factors discussed here will indicate that some facilities should be prepared to handle condensate of much lower quality than the normal design or expectation, or have the capacity to be able to operate if that condensate is not available (dumped due to contamination). The cases can also help to identify subsystems in the production plant that are the sources of the contamination and possibly should have local condensate dumping capability.
Plant Subsystems Plant Types Production plants such as petrochemical plants, oil refineries, and others exist in many configurations, sizes, and degrees of complexity. In most cases, these plants do not utilize mixed-bed, demineralized quality, high-purity water for steam systems. There are exceptions for specific high-pressure steam systems (e.g., ethylene, propylene, ammonia production). Existing plant steam systems often have complex steam distribution and condensate return piping networks. How the high-pressure HRSG is connected to the existing makeup water, feedwater, steam, and condensate systems determines much of the potential impact on the HRSG system from the existing production plant equipment. These factors can include existing steam producers (waste heat or unfired steam generators and fired process heaters or decontamination furnaces with waste heat steam production), and a variety of steam users.
34
continued
Production Requirements Versus Operating Limits A well-known method for discussing operation of production units is to use the terms production capability and production (amount). The feedwater purity specification is focused on production capability. From a specification point of view, we could say that the HRSG must operate according to the water chemistry specifications or else damage will result. Therefore, if the system cannot meet the water specifications, the HRSG must (should) stop operating. Using this logic, the production capability of the HRSG could be maintained. However, in operating production plants, there are demands for production that become factors in decisions regarding taking a unit out of operation. There is a management requirement to look at the tradeoff between production capability and production. The factors that drive the need for production in the production plant cause the decision process to take the production plant or the HRSG out of operation to become complex. Sometimes the systems are operated well beyond their specification limits. This article will examine the types of physical arrangements possible to connect a combined-cycle/HRSG unit with a production facility that may also have existing feedwater production, steam producers, and users. The connection types are ordered from the simplest to configurations that are more complicated. Some key pros and cons of each configuration are discussed.
Connection or Configuration Concerns The following six cases examine the connections of the HRSG Plant with the Production Plant to determine the sources and purity of the flows of steam and water between the two plants. The sources of the condensate in the production plant determine the potential contamination delivered to the HRSG plant. The cases start with no potential contamination and move stepwise to the highest potential interconnections between production plant systems and the HRSG.
the Analyst Volume 26 Number 3
Key Steam and Condensate System Factors That Can Affect HRSG Operation
Case 1 HRSG in a standalone plant. Here is the basic operating configuration for a HRSG/combined cycle plant. This is the simple loop system with or without a polisher, as shown in Figure 1. Figure 1: Case 1 flow diagram.
Meeting the feedwater chemistry standards is a key task for successful operation. Even plants that fit within Case 1 have problems meeting these standards from time to time.
continued
In Case 1, problems leading to violating feedwater purity or boiler water purity, face a relatively simple test: will the damage to the production capability be significant? Often there are factors opposing the call for a shutdown of the HRSG such as contractual obligations for power delivery, or the opportunity cost for the sale of the power. This leads to greater efforts to purify the water, which generally come at an additional cost. Therefore, a balance is made between the opportunity cost of not operating, the additional cost of water purification and the estimated cost of the damage to the HRSG. This balance of factors includes the flexibility of a power grid to accept or add power from other sources, to use production cycling, and to accept a shutdown of a generator relatively easily with a well defined, but unwelcome, cost of non-operation. All of these considerations take time but extending the operating period while the feedwater is out of specification also increases risk of damage from the contamination. Moving to the other cases, the calculation of lost production versus production capability becomes more complicated.
Case 2 Steam/makeup water export. In Case 2, the production plant exports steam and makeup water, but there are no condensate returns. Figure 2 is a simple block diagram. This production plant could have a complex steam system receiving the makeup water and steam from the HRSG system. Figure 2: Case 2 flow diagram that has no condensate returns.
This is the first step in the sequence of cases adding increased connection to the steam host/production plant. Plants like this exist and are very successful. A good example would be a production facility that replaces an old water plant and old boilers with a HRSG system. 35
the Analyst Volume 26 Number 3
Key Steam and Condensate System Factors That Can Affect HRSG Operation
This case completely isolates the HRSG operation from the effects of condensate contamination and steam contamination from the production plant. The production facility receiving the steam and makeup water from the HRSG may have other steam generators that utilize the condensate from the HRSG produced steam as feedwater to those steam generators. However, with no condensate return to the HRSG, there is no risk of contamination to the HRSG. Most production facilities operate with much lower percentage condensate return than combined cycle HRSG power plants and need a higher percentage of makeup. The additional makeup can be supplied from the HRSG plant. The HRSG plant in this case will have a larger demineralizer or RO, or other first purification step than the standalone unit in order to provide steam and, possibly, water to the production plant. These sites have the same requirements for the operation of the HRSG plant as for Case 1. However, with a larger water plant, there is an increase in labor, resin maintenance and cleaning procedures, and mechanical maintenance. The HRSG-supplied export steam requirement can be large, and the demineralized water demand for supply to the production facility is significant. One HRSG plant operating for more than 15 years using this configuration supplies an average of 1,100 gallons per minute (gpm) of demineralized water (not mixed bed) and 700,000 to 900,000 pounds per hour (pph) of extraction steam to an oil refinery. That steam is equivalent to approximately 1600 gpm of mixed bed demineralized quality water. None of this water and condensed steam returns to the HRSG plant. This “no condensate returns to the HRSG� case is very effective when the production plant/host site has high probability of steam or condensate contamination and may have internal steam production requirements, including waste heat boilers or incinerators, and possibly, additional lower-pressure power boilers. The power boilers may be supplemented by steam from the HRSG unit, and the HRSG unit may be available as a backup steam source.
36
continued
Another factor that can make this case successful is the low condensate return associated with some types of production plants. This loss of steam condensate in the process operating units and in the steam transmission systems is common in industrial systems. The condensate may simply not be piped to return, or it may be used as high-purity water in the production processes. While the water and energy losses are large, the planning, physical coordination, logistics, and costs of recovering these steam and condensate losses are significant. They remain as losses in many of the plants. As an example, oil refineries often operate with less than 50% condensate return to a collection point, so high amounts of makeup are required to replace that loss. The production plant condensate that is available through production plant condensate internal return is often used as feedwater to power boilers and waste heat boilers in the production plant. This is supplemented as needed from the HRSG water plant. The condensate losses create the need to replace that condensate with demineralized (not mixed-bed) water anyway in order to generate enough process steam in the production plant steam producers. Using the production plant condensate in the production plant boilers and not returning it to the HRSG plant, provides the benefit of full physical isolation to the HRSG plant. With no returned condensate from the production plant, there is no contamination risk introduced to the HRSG plant. Case 3 The HRSG plant only accepts condensate returns from exported steam. The production plant utilizes the HRSGproduced steam in some (or all of) its users and then returns only the condensate produced from the HRSG plant steam to the HRSG plant. This eliminates any added complications from any production plant makeup water impurities, or from any production plant steam generation in the production plant. In operation, this means steam went from the HRSG unit to some or all of he steam users in the production plant and then returned to the HRSG unit as condensate. There must be strict isolation from any production plant makeup water or steam made from that makeup water in Case 3.
the Analyst Volume 26 Number 3
Key Steam and Condensate System Factors That Can Affect HRSG Operation
continued
Figure 3: Case 3 flow diagram for an HRSG plant that only accepts condensate returns from exported steam.
In this case, the only contamination to return to the HRSG unit is limited to contamination in the condensed steam that had been in contact with process heat exchangers of some type. The most common types are shell-and-tube heat exchangers, or jacketed heating or reaction vessels. This type of equipment is capable of contaminating the condensate with the process-side material with corrosion products from the exchanger or vessel itself or with material that was left in the heat exchanger prior to starting the process. Production plants also find it necessary to cool condensate (before returning it to the HRSG) in some applications. This could be in a surface condenser after a turbine driver for the process, or in a condensate cooler to utilize some of the condensate in a low-pressure boiler system or for another pure water use (where condensate is the preferred pure water source). This entails using a water- or air-cooled heat exchanger, or even a process stream-condensate exchanger to remove heat from the condensate. These exchangers can also contribute liquid contamination or corrosion products or any residual impurities present in a heat exchanger. Configurations that include condensate return to the HRSG plant from production plants or production units (should) include an isolation or dump valve system to prevent contamination of the steam system. Condensate contamination in production facilities does occur and has caused significant problems in the past. The dump method of protecting the boiler from condensate contamination has been in use for a very long time and in many types of steam systems, even low-pressure systems. These configurations are well known and there are a lot of them in use. 38
Initially, these were manually operated. In many cases, there is online monitoring and automated dumping of the condensate. This has been a standard of plant designs since at least the 1960s. Condensate dumping is available almost universally in newer construction. These dump actions are often initiated based on conductivity. Other general measurements or measurements of specific known contaminants from the production plants, such as oil or hydrocarbons, can be used. Total organic carbon (TOC) is the most commonly used on-line measurement for these contaminants. The monitoring is also often based on “Cation Conductivity� or conductivity after cation exchange (CACE). Where there are known problems with specific contaminants, samples are often analyzed in a control laboratory. Condensate return from equipment in the production plant steam system introduces the potential sources of contamination that can affect the HRSG feedwater quality in the Case 3 operating configuration. Condensate polishing is needed, depending on the plant operations. Since this type of system uses condensate that is potentially contaminated, there frequently is condensate polishing specifically targeting the expected contaminants. This polishing can be at the production plant condensate return points, at the HRSG system return points, or both. The polisher(s) needs to be configured so they: 1. remove the most likely contaminants (organic and inorganic); 2. are capable of producing HRSG-required feedwater purity; and 3. have sufficient capacity to not restrict either the HRSG production or the facility’s production if one part of the polisher must be out of service for maintenance or regeneration.
the Analyst Volume 26 Number 3
Lovibond® Water Testing Tintometer® Group
Don’t Risk It - Test It! Ask about our innovative solutions for Legionella detection and prevention.
Want To Try Before You Buy? Bring this flyer to Booth 246 at the 2019 AWT Annual Convention to get a FREE BOX of TTC/TTC Dipslides!
www.lovibond.com
Need More Information? Contact us For Details: Phone: 941.756.6410
Email: sales@tintometer.us
Offer valid for U.S. Customers Only. Limit of One Per Company. Offer expires September 25, 2019.
Key Steam and Condensate System Factors That Can Affect HRSG Operation
continued
Case 4 HRSG plant that accepts condensate returns from the exported steam and makeup water. The HRSG plant-produced makeup water is supplied to the production plant for some or all of the boilers/steam producers in the production plant. If there is a production plant water plant, and any steam is made from that plant’s water, none of the condensate from that steam returns to the HRSG plant. Figure 4: Case 4 flow diagram of an HRSG plant that accepts returned condensate from exported steam and makeup water.
This type of facility has the same issues as the facility in Case 3 but adds the complications of steam production to the returned condensate. Steam purity problems from the production plant steam producers can contribute contaminant loading to the return condensate to the HRSG system. These steam producers include conventional fired power boilers, waste heat boilers, and any other steam producers. The events that can contribute contamination to the condensate or steam include the following: Leaks from the process.
Any other causes of steam contamination in the operating steam producer, such as operation above the design rate, operation at lower steam pressure than design, or others. In this case, because there is no makeup source other than the HRSG unit demineralizer plant, the common concerns about collection of excess carbon dioxide (CO2) in the system from softened makeup water is eliminated. (However, CO2 is a commonly found gas in chemical processing and can present a significant low pH or corrosion problem in the case of contamination.) Production units often have multiple pressure levels of steam usage and distribution piping. These systems can be very complex. Multiple pressure steam systems also can result in contamination because of the multiple header pressures when pressure control issues like pressure sags or spikes lead to steam quality/purity issues or gross carryover.
Overcycling and carryover. Steam producer water level control issues. Steam purity problems because of damaged or inadequate steam separation equipment. Cycling control of lower-pressure steam producers, commonly found in waste heat boiler roles, is often poor. This could create steam contamination concerns when carryover or level control problems arise (relatively common in some plants). 40
In this case, the condensate must be polished.
the Analyst Volume 26 Number 3
Key Steam and Condensate System Factors That Can Affect HRSG Operation
continued
Case 5 The HRSG plant accepts condensate return, including condensed steam made from other makeup sources. All of the concerns that are present in Case 4 apply to Case 5. Case 5 has an additional set of concerns. Case 5 adds boiler feedwater makeup from other makeup sources in the production plant. This is a potentially complex case, and effective condensate polishing for the condensate returning to the HRSG is not only highly recommended, it is a requirement. Figure 5: Case 5 flow diagram.
When additional sources of makeup that are not high-purity water are added into a feedwater distribution system, protection of the high-purity steam generators from contamination is necessary. Methods to protect the high-pressure or high-purity steam generators in the production plant include: Separate feedwater deaerators, distribution pumps, and supply lines. Isolation valves or isolation systems routing lower purity makeup sources into separate lower-pressure feedwater systems.
even potentially dangerous to the equipment. If there are existing valves or piping connections that could allow contamination into the high-purity systems, it is sensible to plan for that contamination to occur and to have a method to mitigate it. The reasons these potential crossovers between water purity levels exist include the following: Integration of the high-purity steam systems over time with an older plant using lower purity feedwater. Contingency planning that would include the ability to transfer water between systems.
Material balance (i.e., separation by normal mass flow rates—this can become a problem if the material balance changes because of operating rate changes, maintenance turn-arounds, and other occurrences). Other potential systems to achieve isolation and separation, such as dumping condensate. From the point of view of supplying adequate feedwater to HRSGs and other high-purity steam generators, several factors in this situation are undesirable and 41
Obstacles to installing isolation valves, such as longterm continuing operation of the systems. Other undetermined reasons. If the production plant high-purity feedwater system and the low-purity feedwater systems are isolated from each other through strong isolation controls, cross contamination may still occur. Isolating the feedwater alone is not enough to eliminate contamination of the high-purity system; the steam produced and the condensate gathered the Analyst Volume 26 Number 3
Key Steam and Condensate System Factors That Can Affect HRSG Operation
must also be isolated from crossing over from a low-purity source to the high-purity system, or polishing must be used. When there is potential for contamination of the high-pressure feedwater, the systems need to be mapped and analyzed. The goal is to determine what steam/ condensate source is delivering the contamination to the point where it can reach the high-purity steam producers. This can be done by dividing the complex into sections as much as possible and identifying which contamination case each section falls into. This helps to identify sections or individual pieces of equipment that introduce the impurities. Possibly these can then be isolated or polished at a point where the impurities originate. Some production complexes do not have solid isolation points (e.g., closed valves, blinded isolation points) protecting the HRSGs and sometimes other high-pressure systems. They have loops or headers to gather the condensate, and they depend on flow material balance to segregate the less pure condensate from the condensate acceptable to go to the HRSG. This type of weak isolation is not normally seen in a newer production complex. This type of difficulty results from older operating complexes where production sections, power boilers, and cogeneration plants have been added.
continued
Another problem that occurs in Case 5 is that the high-purity water plants and the high-purity steam generators may be widely separated: there can be separate powerhouses or separate water plants or steam generator sections in a large complex. These can be separated by very long distances that can make tracing the source of contamination difficult. Amine or ammonia distribution can be a problem. There are usually not many sample points available to troubleshoot these problems. Case 6 HRSG is placed where there are multiple connections between treatment systems. These production complexes use more than one high-purity steam producer and water treatment plant. Most of the difficult problems with low-purity boiler feedwater makeup that occur in Case 5 do not occur when more than one set of high-purity steam producers and water treatment plants exist. Most of the production complexes that operate with this mode have determined that they will use at least demineralized quality boiler feedwater complexwide and some opt for mixed-bed quality demineralized boiler feedwater throughout their feedwater distribution loop. This eliminates the problems with the impurities that are residual in RO or zeolite softened water. The problems resulting from operation in Cases 3 through 5 can still apply to plants that fit in Case 6. Among others, these include process contamination, leaks, corrosion product contamination, and steam carryover contamination.
Figure 6: Case 6 flow diagram.
42
the Analyst Volume 26 Number 3
Bio-Source is a specialty consulting, toll blender, repackager and distributor of EPA registered non-oxidizing and oxidizing biocides. We also distribute a wide range of raw materials commonly used to formulate boiler and cooling water products. All biocides can be resold under the manufacturer’s label or private labeled through a subregistration. All private labels will be printed and maintained current with EPA by Bio-Source.
BIOCIDES Bromicide Tablets ( BCDMH ) Bromicide Granules Sodium Bromide ( 40 % ) Stabilized Liquid Bromine Trichlor / NaBr Dichlor / NaBr DBNPA ( 20 % ) DBNPA ( 5 % ) DBNPA Tablets ( 40 % ) Glutaraldehyde ( 50, 45, 25, 15 % ) Glut / Quat Blends Isothiazolin ( 1.5 % ) Isothiazolin ( 1.5 % Cu Free ) Isothiazolin / Bronopol Blend Terbutylazine ( 4 % ) TTPC ( 5 % ) TTPC / WSCP ( 5 % ) WSCP ( 60 % ) THPS, Various Concentrations Hydrogen Peroxide / Silver Blends
RAW MATERIALS PMA & PAA Maleic acid Copolymers / Terpolymers PCA PCA / AMPS POCA AA / AMPS ATMP HEDP PBTC TTA ( 50 % ) The Copper Bullet ( TT / BZT / HTT ), 38 % Cyclohexylamine DEAE Morpholine DEHA Sodium Molybdate Dihydrate Sodium Molybdate Crystals Carbohydrazide Erythorbic acid SPECIALTY PRODUCT DTEA IITM Biodispersant
VOLUME DISCOUNT PRICING IN BOTH PAILS AND DRUMS MULTIPLE STOCKING LOCATIONS IN BUSINESS SINCE 1991 www.biosourceinc.com
Performance Biocides & Raw Materials
11335 Lewis Braselton N. Blvd | Suite B-140 | Braselton, GA 30517 Phone: 770 978-1443 Fax: 770 978-4165
Key Steam and Condensate System Factors That Can Affect HRSG Operation
continued
The new problem that occurs in Case 6 is a result of the variation in the makeup quality requirement or condensate quality requirement between a high-pressure HRSG and the high-pressure production boilers.
These problems are highly site-specific and have to be addressed on a site-by-site basis. All of the concerns about reliability and the capability of meeting feedwater specifications still apply.
Many of these production plant waste heat steam producers are waste heat steam generators that receive heat from hot exhaust gas from reaction vessels or reaction processes, but very little radiant heat. They usually do not require the same level of high-purity water that the higher-pressure HRSGs require, especially if the HRSGs are using duct firing. Chemical or petrochemical processes operating at steam pressure above 2,000 psig are rare. There are exceptions to this generalization.
Additional Factors
If there is a difference in water quality coming from the production facility demineralizer plant versus the HRSG demineralizer facility, some problems in sharing the water can result. Generally, these are well designed or upgraded to match and be interchangeable but operationally quality differences can occur.
The potential cross connections from high-purity to low-purity sources for steam, makeup water, or condensate grow.
One additional problem that is occurring increasingly in industrial plants using demineralized boiler feedwater has to do with waste heat boilers or waste heat steam generators. These generators are often not conventional boiler designs or HRSG designs. They are process-specific equipment designs. A common type are kettle boilers. Another type seen are vertical heat exchangers. There are others, and some do closely resemble two drum power boilers. The issue is residence time and circulation rate in these vessels when they change from operating at 10 to 20 cycles of concentration to 50 to 100 cycles concentration. The problem is that some of these designs do not have good thermal circulation in the water drums and can allow any suspended material (usually iron oxides, but possibly other solids, even process contaminants) to settle in low-flow areas. Also, because these are relatively numerous in a production facility, and low-pressure producers in many cases, they can suffer from lowered attention to operational control and maintenance. This leads to carryover and level control problems. Those problems can cause the accumulated solids to enter the steam system.
44
Production Facility Size There are potential negative effects as manufacturing facilities increase in size, particularly as complexes grow and evolve over decades. The number of opportunities for contamination of boiler feedwater increases.
In some cases, understanding of the steam ladder/ balance decreases because of the significant complexity. The task to identify and act to reduce problems caused by cross contamination is more difficult. The ability to mitigate problems can decrease because of the complex nature of problems. Processes can continue to operate with difficulties that impact feedwater quality for extended time periods because of the complexity of planning, scheduling, and implementing a maintenance period. Some facilities are running five to seven years (or longer) between full maintenance shutdowns. The problems compound and add to each other. There are potential positive effects from an increase in facility size, including more staff members with increased degrees of specialization. There is increased corporate engineering support available and, usually, more vendor and specialist consulting support is available.
Maintenance Capability In general, maintenance is focused and carried out on the highest priority maintenance requirements. Of course, preventive maintenance is a goal and is often well executed. However, maintenance on lower priority the Analyst Volume 26 Number 3
Key Steam and Condensate System Factors That Can Affect HRSG Operation
items often is not performed until a problem grows to the point that it demands attention. As an example, this can present a problem for the capability of condensate polishers to maintain their design performance specification. Having a very clear operating specification for the feedwater and boiler water quality and information available regarding the potential damage to the HRSG is a positive step to empower the choice to maintain a polisher’s operating capability.
Production Facility Age Setting aside new facility start-up difficulties, a logical expectation is older production plants have more problems, possibly through operation of older equipment designs, or at least because equipment does wear out. Many older designs are very strong and effective, which sometimes offsets the problems because of worn out equipment. As facilities age, some grow. Systems are added and this leads to the issues discussed earlier in this article.
Conclusions
Combined-cycle plants are very efficient versus conventional power boilers. Therefore, they represent a very attractive replacement option for aging power boilers in production plants. It is likely that more combined-cycle power plants will be utilized in manufacturing plants. How do we protect the HRSG when it is installed in a steam system that includes the levels of complication described above? Given the different cases of connection, as the HRSG becomes more integrated with the feedwater/condensate/steam system of the production facility—and depending upon the controls that are in place—the probability of contamination approaching the HRSG increases. The potential for contaminated feedwater or condensate to get to the HRSG can be reduced by strong physical isolation points, operational controls and water chemistry limits, and effective feedwater preparation and polisher operations. One answer to the entire problem often heard is simply to have good polishing; however, as the cases discussed illustrate, situations arise that can overload polishers. Sometimes polishers are not effective because design expectations were based on lower contaminant loading 46
continued
than actually occurs. Sometimes in system surveys, polishers are found to be bypassed, needing maintenance. That situation often has a root cause in a “heavy contamination” event that loaded them up, rendering the polisher ineffective. The polisher then needs cleaning, possibly mechanical maintenance, and very likely a reload of new polishing media. This need must compete with all the other maintenance needs through a priority and budgetary analysis. Effective condensate polishing is essential. The capability to dump contaminated condensate is essential. The capability to operate while dumping contaminated condensate is a need requiring forethought and planning. The degree of protection can also be improved by considering before the HRSG is installed how it will be connected to the system in relation to the sources of steam/condensate contamination. There are several key factors to consider for the improvement of HRSG protection. There is a clear need for understanding and implementing the standard for feedwater impurities versus operating pressure in HRSG units with consideration of the normal operations and any special capabilities of HRSGs, including cycling, duct firing, and any others. This understanding is essential in a production facility where boiler feedwater quality requirements for production plant boilers and other steam producers are lower than the HRSG’s requirements. Guidance about the standard for feedwater quality and implementing that standard as a protective limit is needed in the production plants. The effectiveness of planning will be increased by including answers to questions such as “what degree of damage will occur over what period of time by operating above the control limits?” And, “how far above those limits?” These are not easy questions to answer precisely. One answer is that operation should not occur above the limits; however, the question regarding the urgency of compliance with the limits continues to be relevant to decisions. This information would be valuable to the operations and utility manager who will need to make a case to dump the condensate or shut down the HRSG as needed. The importance of the steam/feedwater/condensate material balance in the event of condensate dumping must be considered. How does one make up the loss? Planning is needed. Planning to mitigate the effects of the Analyst Volume 26 Number 3
Key Steam and Condensate System Factors That Can Affect HRSG Operation
condensate contamination delivered to the HRSG plant can be facilitated by applying the cases explained in this article. Utilizing the cases described in this article enables creation of a plant survey that indicates what threats to feedwater purity exist, what the anticipated contaminants are, where they are located in the production plant, how they can be monitored for in the condensate, and how they are isolated, or not isolated, from the HRSG plant. These are good steps for determining what changes are needed to increase the protection of the HRSG system from condensate contamination. This will also help determine how much condensate would have to be dumped in different contamination events and how much replacement makeup water will be needed.
continued
Charles Kuhfeldt is an independent consultant through CauseWay Water Consulting and Services, LLC. His work is based on a 30+-year career as a water treatment industrial specialist, area manager, and regional and corporate consultant. Mr. Kuhfeldt’s experience centers around manufacturing plants and technical knowledge gained over the years. He is engaged in the Cooling Technology Institute as chair of the Water Treating Committee and has served at the International Water Conference as a cooling water treatment session chair. This paper was originally presented at the 2018 International Water Conference, which was conducted November 4–8, 2018, in Phoenix, Arizona. More information is available at www.eswp.com.
Water Treatment Just Got A Lot Easier The new LIQUITRON™ 7000 Series Multi-Parameter Controller is fully equipped and ready to control your boiler, cooling tower, pH, and ORP water treatment applications from a single unit. Enable LMI Connect™, cloud-based software to manage your process remotely from anywhere. Choosing the right controller has never been easier! Visit lmipumps.com or RelyOnLMI.com to find a stocking distributor near you.
47
the Analyst Volume 26 Number 3
Can a Scale-Resistant, MembraneBased Solution to Treat FGD Wastewater Meet EPA Guidelines? Jon Liberzon, Jonathan Chen, and Tzu Lung Lin, Tomorrow Water (BKT), and Arnab Hanra, Jaeho Ho, Ph.D., and Chunwoo Lee, SafBon Water Technology
48
the Analyst Volume 26 Number 3
Coal-fired power plants are required by the Clean Air Act to regulate the quantity of sulfur gases emitted by their facilities (1). Generally, sulfurous compounds (e.g., sulfur oxide [SOx]) are emitted in flue gases as byproducts of coal combustion. To prevent sulfur emissions, power plants employ various technologies to remove SOx from flue gases in a process called flue gas desulfurization (FGD). This is most commonly achieved using wet scrubbers, wherein stack gases are passed through a liquid slurry of acidified calcium carbonate. This slurry captures gaseous sulfur as liquid calcium sulfate (gypsum), which is precipitated in downstream hydrocyclones. Following the precipitation of solids, calcium carbonate (CaCO3) is added once again, and the slurry is recycled through the scrubber. As it contacts flue gases, the slurry dissolves not only SOx but also a range of other compounds, including salts, metals, nitrates, chlorides, and various constituents of the combusted coal (2). The product of this accumulation process is a concentrated liquid that must be purged from the scrubber to avoid corrosion and maintain scrubbing performance (3).
Background
According to the U.S. Environmental Protection Agency’s (EPA’s) Rule 40 CFR Part 423 (4), this purge stream must be treated prior to discharge to reduce concentrations of at least four key contaminants, including mercury, arsenic, nitrates, and selenium. The limits on these four constituents are described in the
EPA’s 2015 Effluent Limitation Guidelines (ELG) for FGD wastewater (5). The quantitative discharge limits on these compounds were based on the best available technologies (BATs) at the time of the original EPA study, which were determined to be either a combination of chemical precipitation and biological treatment or the use of evaporators. Evaporators can achieve a higher effluent quality and therefore were assigned tighter effluent limits, but this technology was traditionally too expensive for most plants to operate sustainably, and so the lesser BAT option was provided in the rule. Table 1 lists the effluent quality limits for the four 2015 ELG contaminants under each of the two treatment options designated by the EPA. Those contaminants are arsenic, mercury, selenium, and nitrogen oxide (NOx). Local discharge permits granted by state regulators under the National Pollutant Discharge Elimination System (NPDES) may also include additional effluent limits, notably total dissolved solids (TDS). Until recently, the total available treatment options were limited to evaporation, ion exchange, physical/chemical precipitation, and biological treatment. Evaporation equipment and operating costs are comparatively high; therefore, this option is only attractive for small, extremely concentrated streams. Physical/chemical treatment and ion exchange is effective for removing specific contaminants—notably mercury, arsenic, and boron— though these processes are not effective for removal of nitrates or TDS. Biological treatment is effective for removal of selenium and nitrate only (6).
Table 1: 2015 ELG discharge limits for FGD wastewater.*
BAT Chemical Precipitation + Biological Treatment Daily Max Arsenic 11 µg/L Mercury 788 ng/L Selenium 23 µg/L NOx 17.0 mg/L
30-Day Avg. 8 µg/L 356 ng/L 12 µg/L 4.4 mg/L
BADCT Evaporation Daily Max 4 µg/L 39 ng/L 5 µg/L
*Limits as established by the EPA for FGD wastewater.
49
the Analyst Volume 26 Number 3
30-Day Avg. 24 ng/L
Can a Scale-Resistant, Membrane-Based Solution to Treat FGD Wastewater Meet EPA Guidelines?
Membrane Treatment Membrane filtration provides a physical barrier that separates solids from wastewater in a nonspecific manner. This represents a major advantage over other selective treatment methods outlined above, but membrane systems have not traditionally been able to filter FGD wastewaters. The biggest shortcoming of membrane systems is their susceptibility to “plugging� or fouling. This is most commonly seen when treating wastewaters containing suspended solids.
continued
To address these problems, an anti-fouling membrane system A (AFMS) has been developed to offer a membrane filtration approach for treating FGD wastewater. This technology is illustrated in Figure 1. The left image in Figure 1 shows how the AFMS integrates crossflow membrane filtration with rotating blades positioned between each membrane to effectively prevent fouling. The righthand image shows how the AFMS system appears.
During filtration, the solids form a layer on the membrane, restricting the flow of clean water. Membrane filtration can also remove dissolved solids or salts from water, but when removing salts, a new challenge is faced. When filtrate leaves the system, the retained water becomes concentrated and often surpasses the saturation concentration of lower solubility salts, which results in mineral precipitation and scaling of the membrane surface. This blinds the membrane and makes filtration impossible.
In the AFMS system, the blades generate a sheer force on the surface of the membrane and prevent surface buildup of suspended solids. Using this technology, the AFMS can filter thicker liquids that are not filterable with traditional membrane systems. Through extensive testing, it was discovered that the same mechanism used to prevent solids buildup in the AFMS also prevents scaling in ionic separation applications. The blades effectively mix the feed solution, preventing the concentration of salts at the membrane surface that form the concentration polarization layer. This not only reduces the potential for scaling but also increases the efficiency of the membrane. Following this discovery, AFMS technology was tested in various ionic separation applications.
Figure 1: Exploded view of membrane module, showing vortex-generating blades (left image) and full-scale AFMS filtration unit with 100 membrane modules (right image).
50
the Analyst Volume 26 Number 3
Can a Scale-Resistant, Membrane-Based Solution to Treat FGD Wastewater Meet EPA Guidelines?
FGD Wastewater Challenges FGD wastewater is extremely difficult to treat due to its high salinity and high potential to form scale (4). Various utilities have expressed an interest in evaluating the ability of the AFMS system to remove heavy metals, nitrates, and dissolved solids from FGD wastewater while avoiding scaling, fouling, and other operational challenges of traditional membrane systems. The authors tested FGD effluent from several different coal-fired power plants at a range of scales, from benchtop tests to full-scale system modules. A number of membranes have been tested for time periods that ranged from several days to more than three months of piloting. The present article describes an onsite demonstration performed at one coal-fired power plant. The plant owners contacted the authors, requesting to evaluate the ability of the AFMS platform to process wastewater from their FGD purge pretreatment process for eventual reuse or discharge under 2015 ELG regulations (5). The goal of the AFMS unit was to remove large fractions of contaminants while protecting downstream reverse osmosis (RO) systems that could effectively meet discharge or reuse quality targets. To determine the feasibility of incorporating AFMS into complete treatment systems capable of meeting both 2015 ELG and TDS permit limitations, analytical results from onsite AFMS trials were used to simulate RO system performance on AFMS effluent. RO is a well-established technology supported by robust simulation software. RO system manufacturers consider simulation projections sufficiently accurate for sizing commercial projects. Therefore, this study assumes that simulation results are sufficiently accurate in predicting contaminant rejection and establishing operating parameters for preliminary reporting. These assumptions would need to be tested in subsequent piloting to verify RO results prior to full-scale installation.
Materials and Methods
To demonstrate the performance of the AFMS system on FGD purge wastewater, a 190-day trial was conducted on site at a large power plant in the southeastern United States. The plant burns eastern bituminous coal and uses FGD wet scrubbers to remove sulfur and other compounds from stack gases. Following precipitation of gypsum and separation using 51
continued
hydrocyclones, the plant passes FGD purge wastewater through a physical/chemical precipitation process to remove mercury. Despite this precipitation process, the plant is not able to meet 2015 ELG limits in its wastewater. For the purpose of this study, the effluent of this precipitation process was tested in the AFMS. A limited analysis of the AFMS feed is described in Table 2. Average pH of influent feed was 7.9. Table 2: Selective analysis of plant FGD wastewater.
Component TDS CaCO3 Arsenic Mercury Selenium NOx (aq)
Feed 25,500 mg/L 50 mg/L 10 µg/L 50 ng/L 200 µg/L 25 mg/L
Prior to arrival on site, membrane selection was performed by testing a 20-liter (L) sample volume of FGD wastewater in a bench-scale AFMS unit at the service company’sB offices in California. After testing several membranes, a commercially available, flat-sheet polyamide nanofiltration (NF) membrane was selected to maximize flux, rejection, and resilience while minimizing replacement costs. For onsite testing, this membrane was cut to size and installed on specialized membrane trays for loading onto the AFMS housing module. The AFMS unit selected for this study is a full-scale model that can be mounted with up to 100 membrane trays. Twenty trays were used in this study for a total surface area of 16.3 square meters (m 2), with trays stacked vertically to minimize system footprint. Because of FGD wastewater’s high chloride content, a stainless steel AFMS model was selected to prevent corrosion. The testing unit was installed on plant property in proximity to the FGD wet scrubber and physical/chemical precipitation systems. Plant-sourced wastewater was introduced immediately after pretreatment into a 3,800-L batch tank, where it was recycled through the AFMS over multiple filtration cycles to achieve clean water recovery rates of up to 80%. No chemical antiscalants or amendments were ever added to batch feed volumes, and influent pH was not altered. During filtration, AFMS permeate was collected the Analyst Volume 26 Number 3
Can a Scale-Resistant, Membrane-Based Solution to Treat FGD Wastewater Meet EPA Guidelines?
for sampling or discharged to drain while the rejected fraction was returned to the batch tank for recycling. Since the unit was operated in batch mode with fixed influent volumes for each batch, recovery rates could be set by monitoring permeate volumes and stopping the batch once the desired recovery had been reached. A programmable logic controller (PLC) was used to control transmembrane pressure by monitoring and adjusting the feed pumping rate while also maintaining a set backpressure on the permeate drain valve. The upper and lower limits of achievable membrane flux are generally dependent on feed and membrane characteristics, but instantaneous flux could be adjusted within the available bounds by adjusting transmembrane pressures. Whenever possible, the system attempted to maintain constant pressures and tolerated a gradual and
continued
unavoidable reduction in flux as the batch feed became concentrated. Permeate samples were collected for analysis, and excess volumes were sent to drain. A separate tank was used to hold flush water for rinsing the system between batches or for cleaning in place (CIP). Water flushes and CIP cycles were also performed automatically using PLC controls at established intervals. CIP cycles were initially performed every five batches as a precaution against membrane fouling, but as membrane performance was observed to remain steady, the number of batches between CIP cycles was gradually increased until CIPs were eliminated approximately halfway into the study. The final 96,000 gallons were treated with only hot water flushes between batches. The demonstration process flow is illustrated in Figure 2.
Figure 2: Process flow of FGD wastewater test.
Following testing with the selected “optimal� nanofiltration membrane, a second, tighter nanofiltration membrane with pores roughly half the size of the first membrane was also tested for a total of 70 batches (70,000 L). This membrane was tested to evaluate the ability of the AFMS system to meet stricter discharge targets through improved rejection. If tighter nanofiltration membranes were able to meet 2015 ELG targets alone, downstream RO polishing would become unnecessary. Performance comparisons between the looser optimal membrane and tighter membrane are presented in Table 3.
54
the Analyst Volume 26 Number 3
POWERFUL CONNECTIONS Unparalleled Versatility in Maintaining Your Water Treatment Options
Connect with the Walchem W900 Series controllers and enjoy unparalleled versatility in maintaining your water treatment operations. The W900 can be configured with easy programming on the large touchscreen or online using a standard browser. Plus, universal sensor inputs enable excellent flexibility to utilize many sensor types, including pH/ORP, conductivity, disinfection, fluorescence and flow meter input. • Powerful Control • Flexible Programming • Online Access • Easy Setup • Great Value
Now featuring
WiFi and BACnet! Visit us in Palm Springs at AWT Booth 231 to demo our exciting new controller features!
Get more power over your water treatment processes by connecting with your Walchem representative today.
walchem.com | (508) 429-1110 © Walchem, Iwaki America, Inc.
Can a Scale-Resistant, Membrane-Based Solution to Treat FGD Wastewater Meet EPA Guidelines?
continued
Table 3: Comparison of ion-specific removal performance and flux between two nanofiltration membranes.
Component Mercury Arsenic Lead Selenium Thallium TOC CaCO3 Sulfate Phosphorus Magnesium Manganese Nitrite + Nitrate Calcium Bromide Chloride Strontium Boron TDS Flux
Testing Method EPA 245.1 EPA 200.8 EPA 200.8 EPA 200.8 EPA 200.8 SM5310C/EPA 9060A SM23208 EPA 300.0 EPA 365.1 EPA 200.7 EPA 200.8 EPA 353.7 EPA 200.7 EPA 300.0 EPA 300.0 EPA 200.7 EPA 200.7 SM2540C Observed
Tight Membrane 97% 92% 90% 82% 70% 70% 68% 65% 63% 58% 58% 58% 55% 54% 52% 51% 33% 52% 26.7 LMH
Optimal Membrane 94% 80% 90% 61% 10% 67% 53% 66% 42% 36% 35% 35% 31% 33% 38% 34% 11% 34% 104 LMH
Concentrate and permeate grab samples were collected from one batch on each of 10 different days (roughly one week apart) during testing of the optimal membrane and nine days during testing of the tighter membrane. Samples were collected, processed, and shipped to a certified analytical laboratory by the power plant staff. Removal data were averaged over all samples for each membrane.
conservative RO projections. Since the RO system would be fed with permeate from the upstream AFMS (NF permeate), the RO feed was categorized as RO permeate in the projections. This increased the allowable operational envelope for the simulation. Nevertheless, due to the feed’s industrial origins, average permeate flux was conservatively restricted to <25.5 liters per square meter per hour (LMH).
To simulate the performance of RO systems in processing AFMS effluent, membrane projection softwareC was used to run RO filtration projections. Several configurations of RO were simulated, and a three-stage, single-pass RO was found most suitable for maximizing recovery, while meeting permeate water quality limits. The simulation was set at an ambient water temperature of 77 °F (25 °C) and average membrane age of 2 years. Feed pH was set to 7.5 and reduced to 4.3 by (in-simulation) addition of acid to minimize scaling potential. The maximum AFMS permeate concentration values were taken from empirical AFMS results and used to produce
Since membrane-manufacturer simulations limit salt oversaturation to well below the maximum salt concentration suggested by manufacturers of antiscalant treatments, additional projections were run using a projection softwareD that evaluates membrane scaling potential. It was hoped that this software would reflect the full capabilities of modern antiscalant treatments and allow the simulation to run at higher recoveries than the membrane optimization softwareC projection. In total, four separate RO projections were evaluated. Apart from recovery, all other input parameters were set equivalently across all four projections (summarized in Table 4).
56
the Analyst Volume 26 Number 3
Can a Scale-Resistant, Membrane-Based Solution to Treat FGD Wastewater Meet EPA Guidelines?
Table 4: RO simulation parameters used in study.
RO Operating Parameters Recovery (%) Average permeate flux (LMH) Maximum operating pressure (psig) Average element age (years) Salt passage increase (%/year) Flux decline (%/year) Feed water temperature (°C) RO system configuration
continued
Results
70–81 23.1 368 2 6 10 25 1 pass, 3 stage
Performance Projections Here are some projections based on these software programs: 1. Projection A: Membrane performance software using 70% recovery. 2. Projection Ai: Antiscalant software projection using 70% recovery (mirroring Projection A). 3. Projection Aii: Antiscalant software projection using 76% recovery (maximum recovery that did not output any hydraulic warnings). 4. Projection Aiii: Antiscalant software projection using the maximum possible 81% recovery (outputs hydraulic warnings for low concentrate flow, which can be easily resolved by recirculating the concentrate).
Over roughly 190 days, a total of 253 batches of 1,000 L each were processed through the AFMS system on site at the power plant. Of these, 184 batches were first processed using the “optimal” (looser) membrane and 69 batches were subsequently run on the tighter membrane. Recovery values were initially set at 60% and gradually increased until the maximum tested recovery value of 80%. As can be seen in Figure 3, most of the optimal membrane trial was conducted at 75% recovery. This value was chosen as an optimal recovery point that balanced flux, rejection, and the ability of the membranes to be easily cleaned between batches. Over the course of six months, no significant mechanical failures were encountered, and the physical integrity of the membranes was maintained, as evidenced by consistent trans-membrane pressures and relatively stable rejection values over the course of the study. Over the course of six months, total solids rejection did decline from roughly 50% to roughly 35% in the optimal membrane (Figure 4), likely due to the use of tap water for system flushes. Tap water contains significant levels of free chlorine, which oxidizes and degrades polyamide membranes. For this reason, tap water should be avoided when flushing polyamide membranes.
Figure 3: Established recovery values and subsequent membrane flux over the course of the study.
58
the Analyst Volume 26 Number 3
Can a Scale-Resistant, Membrane-Based Solution to Treat FGD Wastewater Meet EPA Guidelines?
continued
Figure 4: Flux and TDS rejection over the course of the study.
Membrane flux values varied widely over the course of the study, from 44 to 125 LMH on the optimal membrane to 20 to 47 LMH on the tighter membrane. A comparison of ion-specific removal performance and membrane flux between the two membranes is shown in Table 3. While the tighter membrane did achieve improvements in rejection from 3% to 23% (depending on the constituent), because of the significant (>70%) reduction in average flux demonstrated by this membrane, it was decided that the looser optimal membrane is more cost-effective for this application. The remainder of this article will focus on results obtained from the optimal (looser) membrane. Flux rates were generally high at the beginning of a batch and then declined over the course of each batch as the feed became concentrated in the batch tank. This occurs as increasing trans-membrane concentration
gradients create higher osmotic pressures, which must be overcome by the AFMS system in order to pass water through the membrane. At the conclusion of each batch, hot water flushes were sufficient to recover membrane flux and rejection levels in preparation for the next batch. Overall, day-to-day changes in influent concentration (salt content) and composition also affected flux, with flux dropping with increasing TDS overall. Figure 5 demonstrates the temporal variations in both membrane flux and influent conductivity, a proxy for concentration of dissolved influent salts. A linear regression of membrane flux and percent rejection demonstrates that almost half of all variation in rejection can be explained by changes in flux. In this study, higher flux (which also correlated to less concentrated influent) resulted in lower rejection as a percent of TDS (Figure 6).
Figure 5: Feed conductivity (an indication of feed concentration and membrane flux.
59
the Analyst Volume 26 Number 3
Can a Scale-Resistant, Membrane-Based Solution to Treat FGD Wastewater Meet EPA Guidelines?
continued
Figure 6: Linear regression comparing membrane flux with salt rejection as a percentage of TDS.
Using a commercially available nanofiltration membrane, the AFMS demonstrated average ELG constituent removal rates from 40% to 94%. Rejection rates were ion dependent and varied over the course of the study with variances in flux, clean water recovery rate and other factors. Average removal for each 2015 ELG constituent are shown in Figure 7. Empirical concentrations of ions in AFMS effluent were privileged by the utility and could only be reported on a relative basis in this paper. The number of data points available for each ion (N=10) were limited by the high cost of frequent sampling and laboratory analysis. Establishing high-resolution time-courses of rejection for each ion was prohibitively expensive; therefore, rejections of ELG constituents are assumed to vary proportionally to the ability of the AFMS membrane to reject dissolved solids in general. Figure 7: Average removal per constituent over the course of the study. Dashed lines represent the removal threshold necessary to meet the EPA 2015 ELG maximum one-day discharge target, and solid black lines represent the threshold for meeting the limit on 30-day average values.
60
the Analyst Volume 26 Number 3
Can a Scale-Resistant, Membrane-Based Solution to Treat FGD Wastewater Meet EPA Guidelines?
continued
Results from the membrane maker’s RO projection softwareC (A) showed a feedwater sulfate rejection of 99.04%. As discussed, sulfate rejection is used as a proxy for selenate rejection in this study. Given a selenium feedwater concentration of 292 parts per billion (ppb), permeate selenium was therefore projected at 2.79 ppb. At such low concentrations, it is important to have a large safety margin. Allowing for a safety factor of 1.8 (80% margin), a permeate selenium of 5.0 ppb could be guaranteed (<5 ppb EPA limit). Conversely, the antiscalant treatment manufacturer’s software programD projections predicted even higher sulfate rejections, meaning selenium permeate concentrations are predicted to be even lower. The RO maker’s softwareC (Projection A) predicted a nitrate (NO3-) permeate concentration of 17.8 parts per million (ppm). The EPA limit is 4.4 ppm NO3-N, or 19.5 ppm NO3-. The antiscalant treatment company’s softwareD projected for permeate nitrate levels that were similar. Since the feed pH was significantly lowered (to 4.3) to minimize scaling potential (in Projection A), a small dose of sodium hydroxide was added to the permeate to bring the pH up to neutral. Adding caustic to the permeate had minimal impact on permeate TDS, which remained below 600 ppm. Removal rates for a range of non-ELG-regulated ions are presented in Table 5. Table 5: Projected RO removal performance for various non-ELG components.
Parameter Calcium Magnesium Sodium Potassium Ammonia (NH4+) Barium Strontium Iron Manganese Copper Carbonate Bicarbonate Sulfate Chloride Fluoride Nitrate Phosphate Silica (SiO2) Boron Bromide TDS
Feed Concentration (mg/L) 2,440 684 72 42 1 0.53 8 1 5.6 0.5 0.18 30 740 5,820 8.5 97 0.17 28.5 249 81 10,308
Permeate Concentration (from Projection A) (mg/L) 82.5 23.1 11.1 7.9 0.189 0.018 0.27 0.034 0.189 0.017 0.505 0.032 7.07 220.4 0.632 17.8 0.002 0.49 167.8 3.96 544.2
% Removal (ref to feed) 96.6 96.6 84.6 81.2 81.1 96.6 96.6 96.6 96.6 96.6 NA 99.9 99.0 96.2 92.6 81.6 98.8 98.3 32.6 95.1 94.7
Although 70% recovery presets in Projection A resulted in warning outputs for oversaturation on calcium fluoride (CaF 2), Projections Ai, Aii, and Aiii suggest that antiscalant addition should be able to prevent scaling, even up to 81% recovery (Aiii). 61
the Analyst Volume 26 Number 3
Can a Scale-Resistant, Membrane-Based Solution to Treat FGD Wastewater Meet EPA Guidelines?
Discussion
The AFMS was able to effectively filter FGD wastewater in this study without significant scaling or fouling challenges, and without pH adjustment or the addition of chemical antiscalants. FGD effluent was successfully processed daily for more than six months, suggesting that the AFMS can manage the full gamut of variation in effluent quality that similar power plants produce. It is important to note that the AFMS in this case did benefit from some level of physical/chemical pretreatment of FGD effluent, and studies are currently underway processing FGD effluent without any pretreatment. Nevertheless, without the AFMS’s vortex generating blades, these results would likely not have been achievable using standard nanofiltration techniques. This assertion is supported by anecdotal accounts from operators who turned off blade rotation for short periods during the start of batches, which resulted in immediate reductions in membrane flux of roughly one third. AFMS filtration performance was generally consistent between batches given similar influent concentrations, but varied together with influent characteristics. Some decline in rejection performance over time can also likely be attributed to oxidative damage from free chlorine in tap water used for system flushing. This use of chlorinated flux water represents a clear case of operator error and should be avoided in future trials. Nevertheless, the ability of the AFMS to recover membrane flux with only water flushes between batches suggests that the membrane did not experience significant scaling despite processing feed concentrations of up to 54,000 ppm TDS and 1,200 ppm sulfates. In this study, the use of physical/chemical pretreatment obviated the rejection of mercury by the membrane, since mercury levels in AFMS influent already met the BAT 2015 ELG targets for both daily maximums and 30-day averages. Similarly, influent arsenic concentrations were already below the daily maximum 2015 ELG limit, though arsenic levels exceeded the 30-day average limits. AFMS treatment alone was able to reduce arsenic to below the 30-day average limit as well as reduce nitrate and nitrite below the daily maximum limit as listed in the 2015 ELGs. While AFMS treatment reduced nitrates and nitrate by an average of 40%, and selenium by an average of 63%, these reductions were not sufficient to meet the 30-day average limit on NO3/NO2 or either the daily or 62
continued
monthly limits on selenium. To meet these targets, using this membrane under these influent conditions, downstream polishing by RO membranes would be required. Treatment of raw FGD effluent using RO would be expensive, inefficient, and difficult due to significant scaling and fouling, which would reduce membrane flux (requiring a larger system), reduce membrane lifespan (increasing replacement costs), increase the use of CIP chemicals (increasing costs) and reduce clean-water recovery (increasing brine production). In this study, the AFMS was able to reduce scaling constituents such as sulfate, calcium, magnesium, cobalt carbonate (CoCO3), and bromide by 66%, 31%, 36%, 53%, and 33%, respectfully. These reductions in the scaling potential of FGD effluent protect RO membranes in downstream polishing, rendering the complete process more reliable and economical. In addition, AFMS removed 34% of TDS, with a 38% reduction in chlorides. These reductions would improve membrane flux and reduce cleaning frequencies of downstream RO, further improving the economics of treatment. Even for constituents that may require RO polishing to meet 2015 ELG limits, AFMS treatment does significantly reduce the concentration of these ions, allowing for downsizing of RO systems and a greater margin of safety to ensure that RO system effluents are never in violation of permits. Thus, AFMS and RO treatment are maximally effective and optimally priced when deployed together in series. Permeate from downstream RO in this study was projected to achieve a TDS level of roughly 600 ppm. This salt concentration is likely too high for reuse as boiler makeup in most boiler systems, but significant other reuse opportunities are available. Specifically, FGD scrubbers lose water, both to evaporation and to purged scrubber effluent. AFMS-RO permeate in this study would be sufficiently low in both TDS and ELG constituents to be reused as clean water makeup to FGD scrubbers without significant corrosion or fouling concerns, and without up-concentrating 2015 ELG constituents. The permeate could also be used for CIP or other reuse applications. In this study, the AFMS unit alone was able to consistently maintain 75% recovery of permeate from FGD wastewater, with maximum 80% recovery. Subsequent simulations suggest that a consistent recovery of 70–81% the Analyst Volume 26 Number 3
Deadly, but preventable. Add the reliable culture test for Legionella pneumophila to your customers’ water management plan to reduce the risk of Legionnaires’ disease.
You can reduce the risk. Learn more at idexx.com/lptesting.
© 2019 IDEXX Laboratories, Inc. All rights reserved. • 2184430-00 All ®/ TM marks are owned by IDEXX Laboratories, Inc. or its affiliates in the United States and/or other countries. The IDEXX Privacy Policy is available at idexx.com.
Can a Scale-Resistant, Membrane-Based Solution to Treat FGD Wastewater Meet EPA Guidelines?
is possible through downstream RO. Together, these two recoveries combine for a total treatment system clean water recovery of 52.5% to 64.8%. This means that the volume of FGD wastewater that must be treated in evaporators could potentially be reduced by >60% using AFMS and RO in series. As with any membrane system, the AFMS will produce a concentrated brine solution that must be disposed of. Current brine disposal methods for brines containing hazardous heavy metals typically include some form of evaporation. Readily available evaporation technologies typically carry a capital cost of roughly five times the AFMS and RO equipment cost for the same throughput. Therefore, an optimized combination of AFMS/RO and evaporation technologies would be the most economically attractive solution to manage waste brines. Because of the much higher price per gallon of evaporation technologies (both in Capex and Opex), any reduction in concentrate production by AFMS has a disproportionately high impact on the overall treatment system cost. Effectively, this means that maximizing AFMS recovery is the most meaningful method of reducing system costs. There are two primary methods for improving AFMS recovery. The first and most simple method is to increase the concentration factor of the FGD wastewater by increasing the number of recycling passes that the FGD wastewater makes between the membranes and batch tank. The tradeoff in this method is that beyond a certain point, each additional pass (and increase in concentration) will reduce the flux through the membrane, requiring a larger AFMS. In previous testing, the service companyB tested up to a recovery rate of only 80%. Additional pilot testing at higher concentration factors would be valuable for reducing overall system costs, so long as increased AFMS costs resulting from flux reduction are offset by lower brine evaporation costs. Improving recovery rates by 5–10% may prove highly beneficial, but cost studies cannot be made prior to empirical validation of flux. Additional long-term case studies focusing on recovery rates of more than 80% or 90% will need to be performed before the optimal system cost can be determined. The second method for achieving improved recovery rates is to reduce the scaling potential or concentration of the FGD wastewater. This involves reducing the quantity of certain dissolved ions in the FGD purge, specifically including chlorides, barium, calcium, and sulfate. 64
continued
Burning “cleaner” coal sources would reduce FGD treatment costs by reducing both the quantity of sulfur that must be scrubbed (and therefore the FGD purge volume), as well as increasing the achievable concentration factor by reducing chloride and other non-sulfurous TDS content in the FGD stream. Any significant reduction in bulk TDS would significantly improve the achievable concentration factor and therefore the recovery rate of the AFMS process.
Closing Thoughts
In considering cost-effective strategies for disposing of FGD scrubber effluent, an optimized configuration of AFMS, RO, and evaporation systems designed to produce recycled scrubber water and concentrated brine represents a new and competitive solution for steam-electric generation wastewater management. This combination of technologies is dramatically cheaper than evaporation alone and is one of only a few technologies that can achieve effluent qualities that can meet any NPDES permit restriction, as well as the EPA’s effluent limitation guidelines. Membrane filtration can remove total dissolved solids better than any biological, chemical, or physical treatment apart from evaporation, but it is difficult to implement without effective antiscaling systems in place. The AFMS’s ability to prevent scaling without the addition of antiscalant chemicals was demonstrated effectively in this study. AFMS also reduced the concentration of all 2015 ELG constituents, in some cases meeting targets, but was unable to guarantee selenium and nitrate adherence. Downstream of the AFMS, a three-stage, single-pass conventional spiral-wound RO system was simulated to ensure adherence to EPA’s effluent limits for FGD wastewater. RO simulations confirmed that all 2015 ELG limits (including for selenium and nitrate) could easily be met with the addition of downstream RO. These projections suggest that RO can recover 70–81% of RO influent (53–65% of FGD wastewater) as clean water, providing significant opportunities for reuse. Specifically, RO permeate is suggested for reuse in FGD scrubbers. Onsite pilots of RO systems are necessary for confirmation of maximum recovery values and final permeate water quality. Additional studies are currently underway to confirm the performance of RO systems placed downstream of protective AFMS units in achieving 2015 EPA ELG/NPDES targets at a reasonable operating cost. the Analyst Volume 26 Number 3
It’s our goal to offer you the best products and service in the water treatment industry backed by a no-hassle return policy. From testing supplies to feed equipment to software and technology solutions, we have the newest products and technology the industry has to offer! How can we help you?
CUSTOM TEST KITS
LEGIONELLA TESTING
FEED & CONTROL EQUIPMENT
TECHNOLOGY & DATA SOLUTIONS
Our boiler and cooling tower test kits can be customized with meters and equipment to fit your specific testing needs. Talk with our team to design your own custom kit today.
We offer all the top brands of dip slides, ATP swabs and legionella field tests for monitoring microbiological activity. Choose the best products for your application.
We stock a full line of controllers, pumps, sensors, tanks and accessories. Custom build your own panel online at www.h2tronics.com/ panelbuilder.
Modernize the way you collect, analyze, and access both wet test and controller data with eServiceReport, the industry leading data logging and analysis software.
Visit us a
19 t AWT 20
9 3 1 h t o Bo SUPPLIER OF THE YEAR RECIPIENT
Can a Scale-Resistant, Membrane-Based Solution to Treat FGD Wastewater Meet EPA Guidelines?
References
1. U.S. Congress (1990). Clean Air Act Amendments of 1990, Title IV— Acid Deposition Control.
2. U.S. Environmental Protection Agency (2003). “Air Pollution Control Fact Sheet. EPA-CICA Fact Sheet Flue Gas Desulfurization, 1–6, EPA, Washington, D.C.
3. U.S. Environmental Protection Agency (1995). Report EPA/452/B-02-001 SO2 and Acid Gas Controls, 60, retrieved from https://www3.epa.gov/ttn/ ecas/docs/cs5-2ch1.pdf, EPA, Washington, D.C. 4. U.S. Environmental Protection Agency (2015). “Technical Development Document for the Effluent Limitations Guidelines and Standards for the Steam Electric Power Generating Point Source Category”, (No. EPA-821-R-15-007), see Sections 6, 7 and 8, accessible at https://www. epa.gov/sites/production/files/2015-10/documents/steam-electrictdd_10-21-15.pdf, EPA, Washington, D.C. 5. U.S. Environmental Protection Agency (Sept. 30, 2015). “Incremental Costs and Pollutant Removals for Final Effluent Limitation Guidelines and Standards for the Steam Electric Power Generating Point Source Category”, DCN SE05831, EPA, Washington, D.C. 6. U.S. Environmental Protection Agency (2011). “Determination of Technology-Based Effluent Limits for the Flue Gas Desulfurization Wastewater at Merrimack Station in Bow, New Hampshire”, (No. NH0001465), EPA, Washington, D.C.
Endnotes A
B
C
D
The AFMS (anti-fouling membrane system) mentioned in the text is a treatment system developed by Tomorrow Water (BKT), Anaheim, CA. AFMS is trademarked and sold as “FMX.”
The testing referred to in the text was performed on site at a power plant using fresh influent pulled directly from the phys/chem process. The testing system used was a full-size, commercially available FMX unit loaded with 20 membranes. IMSDesign is the membrane projection software mentioned in the text. The software has been developed by Hydranautics. PROTON® is an antiscalant projection software offered by American Water Chemicals, which is based in Plant City, FL.
Jon Liberzon is vice president at Tomorrow Water (BKT), where he is focused on novel water treatment technologies, including anti-fouling membranes, municipal primary filtration, and ammonia removal. Previously, Mr. Liberzon worked on projects for AB InBev, the World Bank, DFAT, and IsraAid. From 2012–2017, he was director of water technologies at Algal Scientific, where he commercialized a novel biological process for organics and nitrogen recovery. He also served as technology development manager at Aquanos, a startup firm focused on photosynthetic aeration for municipal wastewater treatment. He holds a master’s degree in agricultural engineering from the Technion Institute and a bachelor’s degree from the University of Michigan. Jonathan Chen studied chemical engineering at San Jose State University. Before joining BKT, he was involved with process design and engineering for NASA's Project O.M.E.G.A. and conducted undergraduate research for atomic-layer deposition on magnesium alloys for corrosion inhibition at Boise State University. Incorporating his knowledge of engineering and electronics, Mr. Chen built and
66
continued
programmed a control system for BKT's in-house unit. In his free time, he likes to incorporate his engineering knowledge into all aspects of his life to provide efficient solutions for everyday problems. Tzu Lung Lin is specialized in applying membrane technology in high-solid, highviscosity, and high-density solid–liquid separations. He has more than 20 years of engineering and process experience with proprietary membrane filtration technologies. This background has enabled him to help clients with difficult separation applications. Arnab Hanra has 19 years of experience in detailed design of water and wastewater facilities and has worked in consulting and EPC environments. His technology focus is primarily on microfiltration/ultrafiltration and nanofiltration/reverse osmosis membranes, as well as a wide range of associated pre- and post-treatment technologies. Mr. Hanra has worked on diverse projects ranging from generation of high-purity water for industrial uses to zero-liquid-discharge design in treatment and reuse of RO concentrate for potable use. Chunwoo Lee has more than 15 years of professional experience in the water and wastewater treatment industry. As the director of engineering at SafBon Water Technology, he is responsible for the review and complete engineering execution of all engineered proposals and project engineering for seawater desalination and advanced water and wastewater treatment projects. Jaeho Ho, Ph.D., is an environmental engineer with 15 years of industrial experience in research and development and process engineering for water and wastewater treatment systems, including membrane (MF/UF/MBR) technologies, mining/FGD wastewater treatment, and water reuse/advanced oxidation process (AOP). His expertise is in process design and modeling of biological wastewater treatment systems, including activated sludge processes and membrane bioreactor (MBR). He also focusses on the innovative technologies to reduce and recover energy from wastewater, including anaerobic membrane bioreactor (AnMBR) and temperature-phased anaerobic digester (TPAD). This paper was originally presented at the International Water Conference, which was conducted November 4–8, 2018, in Phoenix, Arizona. More information is available at www.eswp.
the Analyst Volume 26 Number 3
Industry Notes
H2O French Creek Software Turns 30
French Creek Software, an AWT family business that shaped an industry, proudly celebrates 30 years of innovation for AWT member companies and the water treatment industry Its premier product, WaterCycle®, was test marketed at the AWT conference in 1989, which resulted in the establishment of French Creek Software. WaterCycle provided a PC and notebook-based tool that allowed AWT members to compete and surpass the technology provided by the Six Pack through their corporate headquarters- generated reports. The early adopters closed major refinery, chemical plant, and utility business in the Gulf Coast and California (e.g., ExxonBaytown, AMOCO Texas City, Shell Orange, Chevron El Segundo). An industry service score card for AWT member companies and the Six Pack would have looked like this in 1990: AWT: Innovative easy-to-interpret color-coded graphs simplified generation and interpretation of complex PChem evaluations of cooling systems, optimized dosages, and provided failure point guidelines. Reports were created on site.
The introduction of the calculation engine as a Windows® DLL or static UNIX library in the late 1990s spurred the incorporation of French Creek into custom applications and even controllers. One award-winning controller displays the French Creek copyright on startup and announces “Initializing French Creek.”
H2SO4
French Creek began partnering with polymer and phosphonate synthesizers early on to provide consistent dosage optimization and failure point models throughout the industry. Much of this application research has been summarized and disseminated in AWT presentations and papers and published in the Analyst. French Creek was honored to be named the 2011 AWT Supplier of the Year. Co-founder Rob Ferguson was named the 2017 Ray Baum Water Technologist of the year. French Creek’s service to AWT is epitomized by the company motto, “PChem for Fun and Profit.” Mickey Mouse visits the first French Creek booth at the AWT Annual Convention & Exposition (top), and co-founder Rob Ferguson at the AWT booth (bottom).
Six Pack: Similar data were presented in boring, difficult-to-interpret mainframe-generated tables. Failure points and minimum effective dosages were typically not reported. Reports were generated at corporate headquarters and sent to the reps. Even early AWT members were offered “branding” to include their logos, addresses, and specific products in the software. Innovation continued with expansion of the French Creek calculation engine to applications for oil field brines, reverse osmosis, municipal, and mining.
For more information, visit www.frenchcreeksoftware.com. 67
the Analyst Volume 26 Number 3
New Lower Cost, High-Efficiency Filtration Offering for HVAC Applications H2trOnics has partnered with Next Filtration Technologies to design a new filtration platform that helps deliver total project cost savings to you.
The new next™ Sand HZ Media Filtration from H2tronics offers a 5.0 micron nominal, lower cost solution for HVAC applications where pressure and/ or temperature are not a concern. The ultrahigh surface area, high porosity, surface microstructure, and abrasion resistance are perfect for filtration applications, and next™ Sand HZ media offers more filtration advantages over conventional sand, sand & anthracite, multimedia, and other filter media products. This media, combined with H2trOnics superior smart filter controls and designs, delivers a cost-effective system and helps save money on washes, maintenance, and energy. Request a quote or learn more online at www.h2tronics.com.
Panel Builder Improves Quote Options for Online Panel Customization
Panel Builder, the online water treatment panel configuration tool, is designed to streamline the equipment selection process so that reps can focus on growing their business instead of designing and assembling feed equipment. Our latest updates continue to add more features, such as: Admins can manage quotes created by other users in their organization Addition of a new Super User role with increased permissions Super users can create quotes on behalf of another rep Pricing options can be changed when editing or emailing a quote Panel Builder is a free online tool. Register today at www.h2tronics.com/panelbuilder.
68
ResinTech Promotes Michael Annocki
Ion exchange manufacturer ResinTech elevated Michael Annocki by promoting him to vice president. In his new position, Annocki is responsible for all procurement activities as well as day-to-day operations for ResinTech's production and distribution facilities around the world. The promotion comes at a time when ResinTech is making moves to expand ion exchange production domestically. Annocki joined ResinTech in July 2011 as a purchasing agent and became general manager in 2014. His 15 years of purchasing experience and strong track record for driving process improvement have helped ResinTech meet the rapidly growing demand for its products. "Michael has been instrumental in projecting our growth and implementing the structure needed to support it," said Jeffrey Gottlieb, CEO of ResinTech. "His role is a critical part of our overall business and strategy to take our company to the next level. His new title reflects our faith in his abilities." Before joining Resintech, Annocki held purchasing positions with furniture manufacturer Homeline Industries and distribution and logistics giant Bunzl, PLC.
ResinTech Breaks Ground on New Domestically Produced Cation Resin Plant
ResinTech Inc. recently broke ground on its new global headquarters in Camden, New Jersey. The $138.8 million development project includes 353,000 square feet of new construction on approximately 27 acres. The sprawling campus is walking distance from other global brands who have made a move to Camden, including American Water and Subaru of America.
the Analyst Volume 26 Number 3
ResinTech's new high-tech plant for manufacturing strong acid cation resin will be the largest facility of its kind on the East Coast and the first U.S. plant to produce ion exchange resins in over 30 years. The facility is sized to provide 550,000 cubic feet of production capacity with a planned expansion to meet the demands of the growing market. Two new solar-powered facilities designed by Ewing Cole Architects and constructed by Hunter Roberts are being built to LEED® Silver standards for energy efficiency and environmental design. The first building, which encompasses 163,000 square feet (with planned expansion to 180,000 square feet), is dedicated to the production of ion exchange resins and activated carbons used by water purification professionals around the world. This building will also be home to the company’s cartridges and lab water systems manufacturing and a state-of-the-art research and development facility featuring a world-class laboratory. A second 175,000-square-foot building is intended for enhanced packaging and production operations. The new headquarters will also be home to ResinTech's resin regeneration division—ACM Technologies; its filter cartridge and lab water system division—Aries FilterWorks; and its packaging partner—ActionPak, Inc. By consolidating operations presently based in Maryland, Pennsylvania, New Jersey, and California, the company expects to bring 265 jobs to Camden, New Jersey by the time it becomes operational in June 2020. The company anticipates as many as 400 employees at this new campus upon achieving peak capacity. “We are most excited to bring to Camden the first fully integrated polymer and sulfonation production plant built in North America in more than 30 years. This world class plant, when completed, will produce solventfree, environmentally friendly ion exchange resins for the purification of water for both North America and abroad," explained Jeffrey Gottlieb, CEO of ResinTech Inc. “The plant will utilize state of the art production technology, highly efficient manufacturing techniques, and low-cost solar energy, allowing us to compete globally and employ locally for the foreseeable future.”
69
Camden city mayor Frank Moran gives remarks during the at the groundbreaking for the new ResinTech HQ.
Frank Moran (center) laughs with ResinTech founders Lynn and Mike Gottlieb during the ResinTech groundbreaking.
Tintometer Inc. Names New Western Region Sales Manager of Process Instruments
Tintometer Inc. is pleased to announce that Kyle Keaffaber has been named Western Region sales manager of Process Instruments effective May 13, 2019.
Keaffaber has a civil engineering background with experience in stormwater management and sales engineering. He excels in collaborating with industry professionals to deliver a superior customer experience. Please join us in welcoming him to our team! For over 130 years, Lovibond Tintometer has been a leading manufacturer of water quality products. The company focuses on providing analytical solutions that are designed to simplify analysis and provide users with accurate results both in the lab and field and online. Keaffaber can be contacted at (317) 979-4606 or (800) 922-5242, or via email at kkeaffaber@tintometer.us.
the Analyst Volume 26 Number 3
Industry Notes continued
H2O Innovation: Piedmont Launches Its New Product Line of Disc and Screen Self-Cleaning Filters
H 2O Innovation Inc. (“H 2O Innovation” or the “Corporation”) is proud to announce its independent subsidiary, Piedmont, a global leader in corrosion-resistant equipment for desalination plants in the industrial and municipal markets, recently launched a new product line of disc and screen self-cleaning filters. Depending on the model and size of the project, the scope of supply could be anywhere from $6,500 to $1.5 million. This new product line complements Piedmont’s existing product offering in several ways. The FRP cartridge filter housings are used mostly in the traditional pretreatment of a reverse osmosis (RO) plant, and now with the addition of disc and screen filters to its portfolio, Piedmont is able to supply the self-cleaning filters used for the pretreatment upstream of the ultrafiltration (UF) membranes, both for UF and UF + RO membrane systems. These disc and screen self-cleaning filters are used mainly to remove suspended solids in the water; to prevent damaging equipment downstream, such as pumps and membranes; and to reduce the frequency of membrane cleanings. They are typically part of the pretreatment in a membrane system, and their use is much more common when the system includes UF membranes. The use of disc and screen self-cleaning filters in water treatment plants also provides a consistent filtration level to a specific micron rating that is typically higher than those provided by cartridge filters in RO systems. Most common applications are the pretreatment of UF systems and agriculture to treat water for irrigation purposes. For more information about the Piedmont’s complete line of disc and screen self-cleaning filters, visit www.piedmontpacific.com in the Products section. “Piedmont is really glad to expand its product offering by adding these high-quality disc and screen self-cleaning filters. Three years ago, we launched the new FRP filter housing product line, which helped double Piedmont’s revenues. Similarly, we are also expecting to increase our sales through this new product line. Since the desalination market is expanding fast, these filters are strategic for Piedmont and fitted to meet the existing filtration
70
demand for both types of reverse osmosis pre-treatment designs, something we could not do in the past. We are also leveraging our sales network by keeping the same global distribution structure we had in place and offering more products to better serve our clients. We already got our first orders, so we are very optimistic for the upcoming months,” said Ties Venema, managing director of Piedmont. Piedmont is a global leader in corrosion-resistant equipment for desalination plants and meets critical customer demand for a wide range of applications in the industrial and municipal markets. For more information, visit www.piedmontpacific.com. H 2O Innovation designs and provides state-of-the-art, custom-built, and integrated water treatment solutions based on membrane filtration technology for municipal, industrial, energy, and natural resources end-users. The Corporation’s activities rely on three pillars: 1) water and wastewater projects and services; 2) specialty products, including a complete line of specialty chemicals, consumables, and specialized products for the water treatment industry; and 3) operation and maintenance services for water and wastewater treatment systems. For more information, visit www.h2oinnovation.com.
New Total Residual Oxidant Analyzer Designed for Low-ppb Chlorine Concentration Measurements in Wastewater
Thermo Fisher Scientific has developed a new Total Residual Oxidant (TRO) analyzer to address the needs of the wastewater industry, which calls for a robust, dependable instrument capable of reliably measuring low ppb chlorine concentrations in effluent and treated wastewater in line with stringent regulatory requirements. The Orion 7070iX TRO Analyzer has been designed to offer high sensitivity for low-level chlorine measurements down to 1 ppb with 1 ppb resolution. With this unique capability, the system provides users with the confidence that chlorine concentrations in water discharged into natural water sources do not exceed the safety threshold or pose a threat to marine life. For optimal application flexibility, the new analyzer also enables full-range measurements up to 15 ppm.
the Analyst Volume 26 Number 3
Industry Notes continued
Compared to the conventional DPD (N,N-Diethyl1,4-Phenylenediamine Sulfate) colorimetric method, the iodometric electrode technology does not suffer from turbidity or color interferences, which can have a negative impact on result accuracy and precision. Further, the Orion 7070iX Analyzer is capable of operating autonomously for long periods of time with minimal instrument drift (<5% for >180 days without calibration), eliminating the need for routine maintenance. At the same time, the system’s self-cleaning capability prevents chemical and biological fouling of the measurement cell and sensor, minimizing down time and facilitating continuous testing. "The launch of the Orion 7070iX Analyzer is reflective of our mission to help our customers make the world healthier, cleaner and safer," said Amit Agarwal, vice president and general manager for water and laboratory products at Thermo Fisher Scientific. "The superior sensitivity of the instrument allows users to have full control over their chlorination and dechlorination processes, while its compatibility with different water matrices, including seawater, industrial water, and brackish ballast water, makes it the system of choice across a wide variety of applications." To maximize efficiency and productivity, the Orion 7070iX Analyzer can operate automatically on demand in intermittent on-off mode, based on sample flow: once the flow starts, the unit’s pumps turn on, and they shut down as soon as the flow stops. The Orion 7070iX Analyzer also provides real-time monitoring of TRO fluctuations, alerting users within just 120 seconds from the change, prompting timely corrective action. The Orion 7070iX TRO Analyzer is the most recent addition to a robust portfolio of process analyzers that measure water contaminants, including inorganic and disinfection byproducts. To learn more about our complete water analysis portfolio, visit thermofisher. com/wateranalysis.
Zinkan Enterprises Announces Its New Division, ChemREADY, a Water and Wastewater Solutions Group
Zinkan Enterprises, Inc., a premier Northeast Ohio specialty chemicals company, announced today the launch of ChemREADY, a new division with the sole focus of applying technology and expertise to solving water and wastewater challenges for municipal, mining, and industrial customers. Placing the water and wastewater treatment teams under a single entity allows the ChemREADY team to reimagine water and wastewater treatment chemical and equipment solutions, supplies, and services, originally developed within Zinkan. A dedicated unit also enables the Zinkan chemicals business to leverage its industry partners to better serve their clients by combining chemical and equipment expertise under one organizational structure. “Our Source-To-Discharge™ and Total Service Management™ treatment programs allow our customers to design, improve, and validate their own water treatment processes, thereby enhancing their own businesses by reducing water consumption and overall operational costs,” said Timothy Drake, Zinkan’s vice president of marketing and product development. “We’re excited about working with our customers to provide the highest level of clarity in an industry that otherwise presents customers with challenging decisions—how to properly treat water from the moment it enters a facility to the point of discharge.” In addition, ChemREADY partnerships allow clients to take full advantage of their chemical knowledge and engineered water and wastewater treatment solutions. “For more than 30 years, Zinkan Enterprises has grown and evolved within the specialty chemicals industry, giving us unique insight to the pain points faced by our chemical and equipment clients,” said Greg Ott, president of Zinkan Enterprises. “The new ChemREADY Division will be a fully dedicated and focused group of professionals providing the highest level of products and services for our customers in the water and wastewater treatment industries.”
For more information about the Thermo Scientific Orion 7070iX TRO Analyzer, please visit thermofisher.com/troanalyzer.
More information on ChemREADY is available at GetChemREADY.com.
71
the Analyst Volume 26 Number 3
Industry Notes continued
Panel Builder Improves Quote Options for Online Panel Customization
Panel Builder, the online water treatment panel configuration tool, is designed to streamline the equipment selection process so that reps can focus on growing their business instead of designing and assembling feed equipment. Our latest updates continue to add more features, such as: Admins can manage quotes created by other users in their organization. Addition of a new Super User role with increased permissions. Super users can create quotes on behalf of another rep. Pricing options can be changed when editing or emailing a quote.
One of the most common coagulation/flocculation chemicals is aluminum sulfate (“alum”) due to its availability and relatively low cost. In this “alum” treatment process, while the aluminum is combined with the contaminant and removed from the water, the sulfate is soluble and remains in the water. The levels of sulfate may not cause harm to humans; however, they have a proven effect on significant sulfide formation in sewer networks. Studies have also indicated that changing from aluminum sulfate to a solution such as GWT Zeoturb medium could dramatically reduce concrete corrosion by a factor of 35% after just 10–12 hours and over 60% in longer time duration. Using GWT ZeoTurb natural flocculant would add marginal increases to water costs, but there would be a significant overall cost savings for these municipalities and communities through the drastic reduction in maintenance costs of the sewage networks, which would more than justify the change.
Panel Builder is a free online tool. Register today at www.h2tronics.com/panelbuilder.
GWT ZeoTurb Natural Flocculant
In countries throughout the world—from industrialized nations like Australia and the United States to developing nations like Colombia, Ghana and the Philippines—the lifespan of concrete pipe networks is being reduced by levels upwards of 90%. Urban societies in particular are dependent on infrastructure support to function optimally and efficiently. Wastewater collection and water distribution networks are critical components of the modern cities of today. These systems protect public health as well as enable economic productivity of our communities and nations. It costs municipalities/townships and cities hundreds of millions of dollars to maintain, replace, and repair their wastewater collection networks. A similar amount is spent trying to mitigate this problem with costly chemicals in the sewer networks to mask these issues, with little success in many cases. Many municipal drinking water plants utilize coagulation and flocculation chemicals to remove turbidity in the drinking water purification process. In studies, it was revealed that over 50% of sulfate could be the result of the drinking water purification process. 72
These benefits are in addition to the positive impact on the use of GWT ZeoTurb for flocculation in the wastewater treatment processes, which would also reduce sludge dewatering and associated sludge disposal costs. For more information, visit www.genesiswatertech.com.
Global Growth Leads to New Branding and New Headquarters for Water Treatment Innovator APTech
APTech has introduced new branding to coincide with the opening of its new global headquarters, research, and manufacturing facility. Demand from water treatment partners and customers around the globe for a safer and more sustainable water treatment solution was the catalyst for the changes. The new branding showcases the solid chemistry water treatment form and highlights its safety, health, economic, and sustainability benefits. “As the global leader in solid chemistry technology and equipment for water treatment, we introduced a superior product to the marketplace and have been innovating ever since. Solids have experienced tremendous growth over the past decade, and industry leaders agree that the use of solids to treat water will only increase over the Analyst Volume 26 Number 3
Industry Notes continued
time. With such a safe and sustainable product, it was important to refresh and modernize our branding to reflect its benefits,” said James Heimert, APTech CEO. In 2019, APTech built and moved into new global headquarters located in West Chester, Ohio, just north of Cincinnati, Ohio. The new facility doubles APTech’s current footprint. The larger space increases production capacity and provides flexibility for both APTech-driven research and proprietary, partner-driven research. The company boasts a water treatment innovation pipeline on the solid chemistry side and the equipment side. Research efforts focus on strengthening remote monitoring, reducing waste by eliminating packaging, and improving product performance for specific challenges its partners face.
The new corporate offices and research and manufacturing center is set on 7 acres of property to allow for additional future growth for solid chemistry technologies and the equipment that dissolves and delivers the chemistry. For information about setting up your next team training or regional meeting at AP Tech’s new global headquarters, contact Megan at megan.marquardt@aptechsolids. com, (513) 761-8111 or visit www.aptechgroup.com.
QualiChem—Bringing Quality Blending to the West Coast
QualiChem is proud to announce the opening of our new precision blending facility in Verdi, Nevada, just outside of Reno. This will position us to provide our customers with industry recognized benefits and services coast to coast. Our new manufacturing plant will contain an array of blending kettles to allow us to handle batch sizes ranging from a single pail up to full tanker truck loads. This facility will be equipped with all lab equipment and personnel necessary to ensure we maintain the blending quality that QualiChem is known for.
Solid chemistry provides a safer and more sustainable water treatment solution than hazardous liquid chemicals. APTech’s solid chemical technologies provide the same benefits of liquid chemicals to prevent scale, minimize corrosion, and control microbiological activity. Solids also provide significant additional benefits over liquids due to their safe and sustainable solid form. APTech Managing Director Matt Horine states, “Water treatment programs using liquid chemicals risk potential hazardous spills and face higher overall costs due to the complex handling, storing, and disposing of liquid chemical pails and 55-gallon drums. Solids have opened a new chapter of innovation for the water treatment industry. The added capacity of our new space allows us to strengthen our position as the leading supplier of solids to the global water treatment market.”
73
With our East Coast facilities and our new Western location, QualiChem is now better positioned than any other private label blender to support the AWT market and water treatment service companies with the benefits we provide. In 1989, QualiChem was established with the core business focus to provide only private label water treatment products and technical support to regional water treaters in the southeast United States. Today, QualiChem formulates, manufactures, and ships products to private label water treatment partners across North America and overseas. We continue to refine our services to provide the necessary tools to our existing water treatment partners to assure they remain competitive in today's marketplace. Additionally, QualiChem still provides an avenue for the development of new businesses by experienced water treaters looking for new and expanded opportunities outside of traditional, large corporate environments.
the Analyst Volume 26 Number 3
Industry Notes continued
In 2016, QualiChem was recognized by the AWT membership as the Supplier of the Year for outstanding customer service, quality of product, and contributions to the industry. This new facility continues our investment in, and focus on, supporting the regional water treater. In addition to our No Direct Sales approach, we also provide Business Protection, Precision Manufacturing, and Expert Support, along with the Latest Technology. This is just one more way we are demonstrating how… The Blender Matters Contact Doug Frassa with QualiChem at (800) 296-9102 or dfrassa@qualichem.com for more details.
South Bronx Hospital Adopts New Antimicrobial Cooling Tower Technology to Stave Off Legionnaires’ Disease and Other Biological Health Threats Delta Cooling Towers has developed a unique antimicrobial cooling tower that greatly reduces Legionella and other strains of deadly pathogens that are common in cooling towers used in conjunction with large HVAC systems and industrial cooling facilities.
In cities across America, deadly outbreaks of Legionnaires’ disease have become an all too common occurrence. According to the CDC, each year over 6,000 people are severely sickened and dozens killed by deadly bacteria that proliferates in water systems like the cooling towers.
facility saw an opportunity after years of witnessing the neighboring community deal with one outbreak of Legionnaires’ disease after the next. While the hospital’s cooling towers played no role in those outbreaks, the chance to increase protection against possible future exposures of the disease-causing bacteria was an important consideration. Accordingly, the hospital’s engineering team prioritized the selection of an antimicrobial cooling tower option. Dually, the system would save energy—another bonus in alignment with the health system’s larger ongoing goals. “While some cooling tower manufacturers now market a tower with an antimicrobial fill (the medium over which the hot water is distributed as it is being cooled),” says Louis Iglhaut, associate executive director at NYC Health + Hospitals. “A vastly better option is to have a cooling tower featuring the fill, structural casing, and sump all composed of antimicrobial material.” This is highly significant because biofilm growth and microorganisms allow a place for bacteria to hide from chemical treatments and also provide nutrients for pathogen growth. Lincoln Hospital selected Delta’s Anti-Microbial TM Series model with 18 modular cooling towers that provide a combined total of 6,000 cooling tons.
Delta, which pioneered HDPE (high-density polyethylene) plastic cooling towers in the 1970s, has a line of towers constructed of antimicrobial resin, which is fully compounded into the cooling tower’s plastic. The antimicrobial resin contains additives that operate on a cellular level to continuously disrupt and prevent uncontrolled growth of microorganisms and biofilm within the cooling tower.
Another major benefit from the decision to adopt the new Delta cooling towers was the promise of substantial energy savings. “We worked with New York Power Authority to ensure that the new cooling towers would be as energy-efficient as possible,” Iglhaut says. “Our old towers used large, 30-horsepower fans on each unit, which required the use of a lot of electric power. The new modular units are equipped with smaller horsepower, 60-inch fans, so the energy consumption is far less,” he says. The Hospital also installed variable-frequency drives, which offered additional savings. “The total electric power energy savings calculated by our engineering firm was figured at about 40 percent, which is quite an accomplishment.”
Recently, a cooling tower supporting the HVAC system at a public hospital in New York City was nearing its expected end of life. Management of the South Bronx
For more information, contact Delta Cooling Towers, Inc.; (800) 289.3358; email: sales@deltacooling.com; or visit the website: www.deltacooling.com.
74
the Analyst Volume 26 Number 3
AD-198
See what happens when your distributor is more than just a distributor. With Univar Solutions, you have an ally equipped with the capability and knowledge to help you innovate and grow. We’re on the forefront of the latest innovations to safely optimize your water treatment processes. We have specialized expertise to solve your toughest challenges. We have an unmatched product portfolio and leading supply chain capabilities. We deliver the reliable service your business demands.
Come discover your water treatment solution. univarsolutions.com/water
Š 2019 Univar Inc. All rights reserved.
AD-1981-0719_Water_AWT July Ad_v2.indd 1
7/12/2019 11:01:37 AM
Industry Notes continued
In Memoriam—John Peterson
It is with great sadness that we report the loss of John A. Peterson, one of the founding partners and current president of Bond Water Technologies. John passed away on July 4, 2019.
John had a vision several decades ago to build a water treatment company based on his core values of professionalism, customer value, and delivering products and services beyond expectation and with fairness to all. He treated his customers and co-workers alike, with equal measures of respect, gratitude, and loyalty. From the earliest days, he carefully crafted each building step for Bond, from an eager startup company to a major force within the water treatment field and the AWT community. His vision and leadership continue today as Bond celebrates its 20th year in business among record advancement in sales, geographical expansion, and sustained employment growth initiatives. John will be missed by many, but his belief in customer service and core values will always be on display at Bond Water Technologies.
Tiarco Completes Transaction to Purchase H.B. Fuller’s Surfactants, Thickeners, and Dispersants Business
Tiarco, a specialty chemical manufacturer for latex, grease & lubricant, water treatment, and oil & gas applications, and a subsidiary of Textile Rubber & Chemical Co., Inc. (TRCC), a global chemical and technology company with manufacturing facilities throughout the world, is pleased to announce that it has completed the purchase of H.B. Fuller’s (NYSE: FUL) surfactants, thickeners, and dispersants business that is based in Dalton, Georgia, for $71 million, as of July 1, 2019. “Textile Rubber & Chemical Co. and the Tiarco team are excited to have H.B. Fuller’s Rheology and Surfactant group join our portfolio of businesses,” said Kevin Nolan, vice president and general manager of Tiarco. “Their products and new chemistries, combined with their outstanding operational and commercial teams, will greatly enhance our company’s ability to serve existing core markets while introducing us to additional application areas and toll and contract opportunities. We look forward to working with H.B. Fuller on a smooth transition and continuing to deliver performance-based solutions to our current and future customers,” he continued. The newly formed group will be known as Tiarco-RST (Rheology & Surfactant Technologies). H.B. Fuller's surfactants, thickeners, and dispersants business and its brands are well recognized, and the products include thickeners used in carpet, floor coatings, adhesive, and caulk formulations, as well as surfactants used in detergents, wetting agents, and foam boosters in beauty and healthcare products.
76
the Analyst Volume 26 Number 3
Prepared by:
Specially for:
Members
Practical tools to control your healthcare (and more)...in one easy membership! These 3 steps increase access to care, control out-of-pocket costs and save unnecessary claims for all employees – whether they’re on the medical plan or not!
1
POWER PACKAGE It all starts here! Most employers purchase this package for their benefits eligible (or all) employees.
Telehealth
Participants 5-99 100-499 500+ Voluntary*
Dental
Doctors Online
Upgrade to Premium +$1
Advocacy PLUS
Rx
f$ Pricing $12.00 $11.50 $11.00 $18.00
Vision
freshSAVINGS Rx, Dental, Vision & More All included at no extra cost
Chiropractic Hearing Aids
per family per month
Lab Tests MRI & CT Scans
2
Medical Equipment
ADD-ONS Employers choose any of these Add-Ons as employer-paid or voluntary via payroll deduction. No minimums.
Legal Savings $5.00
Caregiver Support $5.00
Pet Care Savings $8.00
LifeLock $8.49 Individual $23.36 Family
Family
Family
Diabetic Supplies
freshSAVINGS PACK
Family
3
AND ask about how employers can purchase these services as a stand-alone pack for non-benefited employees and may offer the Power Package & Add-Ons via payroll deduction.
All packages include our freshbenies Member Engagement System at no additional charge… · High-quality welcome packet · Easy-to-use app & portal
· Regular outreach campaigns via email, social & more · Best-in-class service via phone, online chat, or AI Assistant
1
POWER PACKAGE
freshSAVINGS PACK
Telehealth Up to 70% of medical issues can be solved by phone. Call anytime for $0, visit with a U.S. primary care doc & get a prescription written, if medically necessary.
Rx Savings Fewer medications are covered. Use our pricing tool to save an average 46% (10-85%) on most prescriptions by mail and at over 60,000 pharmacies nationwide.
PREMIUM**: Adds convenient and discreet access to the following experts at a fraction of the cost of typical in-person visits (some state exclusions apply): • Dermatologists $75 visit fee • Psychiatrists $200 first-time fee - $95 after • Therapists $85 visit fee
Dental Savings Save an average 20-40%†† on dental services. Use this network for cleanings, braces, fillings, root canals, bridges, crowns and more at thousands of dental care locations nationwide.
Doctors Online Get personal answers to medical questions within a few hours. Email 24 physician specialties: psychologists, pharmacists, dentists, dietitians (and more). Advocacy PLUS Get comprehensive support through the healthcare journey – find highly-rated, cost-effective doctors, compare costs for procedures, care and prescriptions, have medical bills reviewed and negotiated, and more.
f$
3
freshSAVINGS These 9 high-quality savings networks (on right) help employees and their families control healthcare whether they have insurance or not.
2
ADD-ONS Legal Savings Free and discounted legal care from experienced lawyers who help with traffic tickets, bankruptcy, divorce, spousal and child support, and much more. Caregiver Support Licensed coaches and a secure portal help busy families manage care of parents, grandparents, spouses, siblings, in-laws and children - newborn to adult. Pet Care Savings Receive 25% off in-house medical services at participating vets, a $20 new user credit to Rover.com, 25% off all purchases from PetCareRx.com and a 24/7 lost pet recovery service. LifeLock Look to the most recognized brand† in identity theft protection. LifeLock helps stop identity fraud and aids in recovery if it happens.
Vision Savings Save 10-60% on everything from vision exams, brand name eyewear and contacts to LASIK and more (whether insured or not) at 20,000 providers nationwide, including national chains and local retailers. Chiropractic Savings Save 30-50% on X-rays, diagnostic services and treatments at over 3,000 chiropractors nationwide. Hearing Aid Savings Get help finding the right hearing aid solution through personalized service and exceptional products for every budget. Includes free follow-up care, batteries, warranty and 60-day trial. Lab Test Savings Save 10-80% off the typical cost of routine lab work at over 1,500 participating locations nationwide - order online or by phone. MRI & CT Scan Savings Save 40-75% on usual charges for MRI and CT scans at thousands of credentialed radiology centers nationwide. Medical Equipment Savings Save 20-50% online or by phone - and an additional $5 on orders over $100 - on walking aids, wheelchairs, scooters, hospital beds, bathroom safety, orthopedic products and more. Diabetic Supply Savings Save 10-50% off diabetic testing supplies by mail options include individual supplies or an annual testing supply program with FREE shipping.
AWT Members: FreshBenies is a great way to enhance your benefit program! Join us at Booth #340 to learn more!
Minimum monthly invoice is $50. *Voluntary requires at least 8 participants. Step 3 freshSAVINGS Pack is only available when the Power Package is installed for other employees. **Behavioral Health and Dermatology consultations are not available 24/7/365. Behavioral Health consultations will be scheduled. Behavioral Health consultations are not available to minors. All Behavioral Health specialists may not be available in all states. For dermatology consultations, members must complete a Dermatology Intake Form and upload a minimum of three images through the secure message center before each initial consultation. Dermatology is not available in in DE, ID, or ND. †Based on a monthly online consumer survey (n=3,436) conducted for LifeLock by MSI International, Apr 2017 – Sept 2017. ††Actual costs and savings vary by provider, service and geographical area. Disclosures: This plan is NOT insurance. The plan is not insurance coverage and does not meet the minimum creditable coverage requirements under the Affordable Care Act or Massachusetts M.G.L. c. 111M and 956 CMR 5.00. It contains a 30 day cancellation period, provides discounts only at the offices of contracted health care providers, and each member is obligated to pay the discounted medical charges in full at the point of service. The range of discounts for medical or ancillary services provided under the plan will vary depending on the type of provider and medical or ancillary service received. Member shall receive a reimbursement of all periodic membership fees if membership is cancelled within the first 30 days after the effective date. Learn more at freshbenies. com. Discount Plan Organization: New Benefits, Ltd., Attn: Compliance Department, PO Box 803475, Dallas, TX 75380, 855-647-6762. Some state restrictions may apply :( B3000-ER-F-NF
AM 7/19
Association News
AWT Attends Annual WQA Conference in Las Vegas
This past April, Chuck Hamrick, CWT, represented AWT as the official Related Trade Organization (RTO) liaison at the Water Quality Association (WQA) Annual Conference in Las Vegas. WQA represents more than 2,500 member companies around the globe focusing in the residential, commercial, and industrial water treatment industry. As part of AWT’s advocacy strategy to build relationships with other water treatment organizations, the RTO liaisons attend other industry events and meetings, not only to raise the profile of AWT but also to learn information that can be shared with AWT members. Chuck reports that this year, WQA featured a session with AWT member Bill Pearson, CWT, titled “Legionella and the Regulatory Management Landscape for Building Water Systems since ASHRAE Standard 188.” This talk reviewed the significance of regulatory changes taking place around Legionella and building water safety since the publishing of the first U.S. Legionella Standard, ANSI/ASHRAE Standard 188-2015, in June 2015. Key events since this change have been: NYC/NYS quick enactment of new regulations and law following the South Bronx outbreak of Legionnaires’ disease in July/August 2015 CDC release of new data, a Toolkit for water management The June 2, 2017, CMS-directed memorandum to healthcare facilities to manage Legionella and other waterborne pathogens. The session continued to emphasize the importance of checking for Legionella, training clients about Legionella, and having a water management plan. AWT maintains a relationship with WQA to help ensure that both organizations remain informed about 80
changes in the water treatment business as well as to ensure that the best information is ultimately getting to water treatment clients. Additionally, thanks to the relationship with WQA, AWT has been able to improve its exhibit hall with new vendors and exhibitors. As its membership is starting to get more involved in the cooling, boiler, softener, and RO business, Chuck shares that it is more important than ever for AWT to maintain its relationship to WQA. He recommends that AWT members look into joining the WQA as members since they have a lot of good information on pretreatment systems, and the typical AWT member could build relationships with WQA members on the use of large softeners, RO units, DI units, and other pretreatment systems that AWT members use every day. For more on WQA, visit its website at www.wqa.org.
AWT Releases Legionella 2019: A Position Statement and Guidance Document
Much has changed since AWT drafted and published Legionella 2003: An Update and Statement by AWT. Surveillance data by the Centers for Disease Control and Prevention (CDC) for the United States shows an increase of more than 550% in the annual incidence of Legionnaires' disease cases reported from 2000–2017. With continuing high-profile disease outbreaks; the release of ASHRAE Standard 188-2015; and the issuance of laws by state, city, and local regulatory authorities, as well as directives and regulations by other authorities having jurisdiction, such as the Centers for Medicare and Medicaid Services (CMS), there is a responsibility and there are requirements for managing Legionella as a waterborne pathogen in associated building water systems. Many facilities are now required to have policies in place, implement appropriate risk management, and develop water management plans to control Legionella in their water systems to prevent disease. All these factors have greatly influenced the way the Analyst Volume 26 Number 3
facility owners and managers operate their buildings and building water systems, and how water treatment professionals design, implement, monitor, and document their water treatment and water management programs. Legionella 2019: A Position Statement and Guidance Document is a revision of the 2003 AWT document. It provides current Legionella and related legionellosis information in a broad and useful format that can be easily utilized by water treatment professionals and their clients as a reference and guidance document to manage the risk of Legionnaires' disease from water systems under their care or supervision. It is a comprehensive update of collective information and data available from numerous research, investigative, and authoritative sources on Legionella
81
and legionellosis. These include the CDC, OSHA (Occupational Safety and Health Administration), WHO (World Health Organization), EPA (Environmental Protection Agency), and various state public health agencies as well as associated technical trade organizations and recognized Legionella experts and commercial entities. Due to the multidisciplined technical and medical nature of the subject, this document is directed at summarizing and presenting up-to-date Legionella information in a useful format to the water treatment professional and end-user as well as to the public and private sectors. Extensive references are cited to provide more detailed and in-depth information on legionellosis and related topics to benefit those with more specific interest and application or decision-making needs.
the Analyst Volume 26 Number 3
Membership Benefits
Don’t forget to take advantage of all the discount programs AWT offers. These savings can really add up. Some of the discount programs are listed below.
Avis/Budget Car Rental Discounts
AWT has partnered with the Avis Budget Group, a leading global provider of vehicle rental and car sharing services. Avis/Budget operates 10,000 locations in approximately 175 countries and offers AWT members up to 25% off base rates as well as coupons and special offers. Sign up today at https://www.avis.com/en/association/D423508.
UPS Shipping and Business Services Discounts
AWT and UPS took the guesswork out and put the easy in. Members now have access to new and improved flat rate pricing with savings of 45% on Domestic Next Day/Deferred, 25% on Ground Commercial/Residential, and up to 50% on additional services. In addition, members can take advantage of UPS Smart Pickup® service for free.
Open a new account, or if you are already taking advantage of our UPS savings program, re-enroll and apply the new discounts to your existing account by visiting www.savewithups.com/awt, or call 1-800-MEMBERS (1-800-636-2377), M–F 8 am–5 pm ET.
82
OfficeMax Partner Advantage℠ Program
AWT members will enjoy substantial savings of 31% to 88% off the manufacturers' list price on frequently purchased items and receive reduced pricing on more than 12,000 in-stock products and 3,700 environmentally preferable products and services. Members will also receive discounts on certain ImPress® print and document services. Members with fewer than 40 employees, visit https://business.officedepot.com/, and have your AWT OfficeMax Partner Advantage Program (Username: 0729341w and Password: t5BKbNc3) available to start saving now! Members with 40 or more employees call 1 (800) 636-2377 to request more information on setting up your account.
TSYS Merchant Services Discount Program
With more than 30 years of industry experience, TSYS Merchant Solutions offers AWT members a payment acceptance program tailored to your business needs. With a full portfolio of payment-acceptance solutions that include credit, debit, prepaid, mobile, chip, digital wallet, and B2B, we help our customers conveniently conduct safe and secure electronic transactions with trust and confidence. Contact TSYS today for a free cost-saving analysis and learn how you can receive a free chip card terminal. Learn more at www.tsysmerchantsolutions.com/awt.
the Analyst Volume 26 Number 3
Making a Splash
Trace Blackmore, CWT, LEED AP Blackmore Enterprises, Inc. President
As a water treater, we are usually isolated from other water treaters. Our job is very customer intensive, leaving little time to find peers that can help us grow in our industry. Even company teammates have this issue: there just isn’t time to easily find and utilize peers. When I started my company in 2004, I sought out business owners and asked them what I needed to do to start my company based on their experiences. Many told me about insurance, employee relations, Secretary of State filings, and the like. All of this was great information that I put to use; however, the information I received from water treatment company owners had a common theme. In addition to the aforementioned items, they all said I needed to give back to my industry. By giving, you will receive more back than you can ever imagine. The advice they gave me was to join the Association of Water Technologies. At that time, I could not understand how giving something away could create a conduit for receiving more. As water treaters, we are taught to distrust other water treaters. Now, people are telling me to not only join them but share with them. That’s crazy! Or so I thought. Too many of the water treatment owners gave me this advice, so I couldn’t discount it. So, the first check I ever wrote from Blackmore Enterprises, Inc. was to the Georgia Corporation Commission, but the second was to the Association of Water Technologies. Initially, like many of AWT’s members, I did very little with my membership. I also wondered if my money was well spent; after all, I was getting nothing out of it. I told one of the business owners who had advised me to join
83
that I wasn’t going to renew for 2005. My reason was due to the lack of benefit I was getting for my money. He looked at me like I was daft. Then he leaned in and asked me how I could find something I never went looking for. He went on to say that I had to make the first step, which was the hardest one to make. Then, I needed to keep making steps. He told me that others would see that and that is when the magic would happen. I later learned that there was no magic, only people! People who gave their time and intellectual property to help others they knew would help them by helping the industry. The fact is, when others see you contributing, they want to help you be successful so that you can continue contributing. AWT was a place that I used to become a better water treater, but I did it by giving and not by taking. I started serving AWT in 2006 as the marketing and communications chairperson. I held this position for five years. I served on the board of directors from 2008 to 2012, returning to serve from 2015 to 2016. I also had the honor of being the president of AWT in 2011. Volunteering for AWT allowed me to explore a passion of mine that I never knew I had: teaching water treaters to become better water treaters. This newfound passion was discovered when I served on the Education Committee starting in 2009. The primary product of the Education Committee is AWT’s Technical Training Seminars. These seminars take place twice a year, and it is something I look forward every year. Why? I get to give by teaching, but I also get something in return by learning and interacting with all the attendees. It was due to how much I enjoyed the AWT training events that I started a podcast called Scaling UP! H2O in 2017. When I started the show, I wanted to continue what I do
the Analyst Volume 26 Number 3
Making a Splash continued
at the AWT Technical Trainings throughout the year. I had no idea that Scaling UP! H2O would gain 10,000+ listeners in over 60 countries. The best part is that I have heard from listeners that have received their Certified Water Technologist designations due to motivation the show gave them. Listeners tell me they reach out to their competition to speak with someone who can understand the issues of their day. I have even heard from people who were set to leave the industry until they discovered a new way of looking at things because of the podcast, and they decided to stay. Producing Scaling UP! H2O has become one of my favorite things to do because of feedback like this. Volunteering for AWT ended up giving me something I never knew to look for. I didn’t know I enjoyed teaching water treatment, and I sure didn’t have a goal to start a podcast. Gathering with your peers is always a good thing, and so is learning more about your industry and doing what you can to make it better. The events that led me here took place over a period of 14 years. My journey may be 14 years in, but it still started at the same place as yours, that first step.
84
the Analyst Volume 26 Number 3
T.U.T.O.R.
Technical Updates, Tips, or Reviews
How to Speak RO By Wes Byrne, Purewatercloud LLC
Like many industries, the reverse osmosis (RO) business has its own lingo used by insiders to discuss system components and variables involved in the design, operation, and maintenance of RO systems. Understanding this language is useful when attempting to learn or communicate RO-related concepts.
Figure 1: Cut-away of an RO membrane illustrating its water streams using a single envelope. Source: Courtesy of Purewatercloud LLC.
Important RO Terms
A good example is the word “membrane,” which has come to mean the spiral-wound membrane element now commonly installed within these RO systems, although originally the term was applied specifically to the water-permeable, polymer film that separates out the purified water from contaminated water. The sheets coated in this polymer are folded and glued into envelopes around a perforated tube that collects the permeated water. There may be a number of these envelopes in a “membrane”, depending on its diameter. This size then correlates with its production. The purified water is called the “permeate,” although in purification applications it is also commonly called the “product.” The inlet water is often referred to as the “feed,” which passes over the polymer surface while only a small percentage permeates, at least as based on the production of a single “membrane.” This percentage of the feed that becomes “product” is called the “recovery.” The salts and other contaminants are left behind and become more concentrated as pure water permeates. The stream that exits the opposite end of the “membrane” is thus called the “concentrate,” or often the “reject” or “brine.”
85
One or more “membranes” are installed end to end inside pressure retaining “vessels,” also called “housings,” the membrane number designated by units of “M.” The vessels are plumbed together in an “array” or “banking” in a way that will maintain moderately high flow velocities through the membranes, called “crossflow,” which assists the membrane’s performance. To achieve a higher “recovery” of the feedwater, it is common to design an “array” with several vessel “banks,” or “stages,” whereby the “reject” of the first stage is plumbed to feed a second stage of vessels, and then possibly to a third stage and maybe onto a fourth stage. To achieve even lower salt concentrations, some RO systems will send the product from one array of vessels, called the first “pass,” to a second “pass” of membrane vessels to remove even more of the remaining ions, so it is called a two-pass RO.
the Analyst Volume 26 Number 3
T.U.T.O.R. continued
Figure 2: Example of a two-pass RO system. Source: Courtesy of Purewatercloud LLC
How concentrated the water becomes before exiting the RO is mostly determined by the RO “recovery.” The “reject” flow rate is adjusted by a “reject” valve or orifice restriction located on the reject stream before it exits, often to an atmospheric drain. An air break should be present to prevent the reject line from potentially siphoning incompatible water from a common waste line. The “product” water flow rate is mostly related to the pressure on the membrane, although water temperature and the dissolved salt concentration can also affect it. Most RO units are intended by their manufacturer to have a set product flow rate as well as a set reject flow rate that is based on achieving a target “recovery.” If the water temperature substantially changes, it may be necessary to make system adjustments. Some systems will automatically modulate the pump motor’s rotational speed using a variable speed/frequency drive (VSD/VFD) as necessary to maintain the design product flow rate. Others may require human intervention to adjust the flow rates. If the water temperature declines, the product flow rate will decline unless the pressure of the “feed” is increased with the pump motor’s VSD/VFD, or by further opening a valve located on the outlet of the pump. This increase in pressure will also cause the pressure to increase at the “reject” end of the RO and will result in an increase in the reject flow rate, and so may require that a reject valve be further closed to restore its design flow rate.
Water Contaminants The vast majority of the contaminants present in the feedwater consist of salts. These salts are dissolved, which means that they have been separated by water molecules into charged ions. Their concentration is usually 86
determined using an instrument that measures the effect of the ions on the electrical conductance of the water, called the “conductivity,” which is mostly proportional to the ion concentration. The instrument may report the conductivity results using units of microsiemens/cm (µs/ cm) or the equivalent micromhos/cm (µmho/cm), or it may mathematically convert the conductivity reading into parts per million (ppm) total dissolved solids (TDS). The accurate measurement of TDS is the weight of the salts that are left after evaporating off the water. However, when performed by a field instrument, conductivity is actually what is being measured and converted to a TDS value, as based on a factor that may or may not be appropriate for the water sample and its particular makeup of ions. As water passes through the RO and the concentration of dissolved ions increases, they should be prevented from recombining into salts while still within the RO or else they may coat polymer surfaces or plug the flow channels of membranes located in the last stage of the RO. When these salts re-form, it is called “scaling,” and the “scale” must be removed, usually by circulating an acidic cleaning solution in an offline operation called a “cleaning,” which is performed with a clean-in-place (CIP) system. Scaling is a preventable issue if the following are correctly set up in the RO system: The “recovery” ratio of RO product to reject flow rates is appropriate for the feedwater. The water pH does not increase beyond design, the pH being a measure of the water acidity.
the Analyst Volume 26 Number 3
T.U.T.O.R. continued
The correct concentration of a chemical scale inhibitor, called an “antiscalant” or “polymer,” is being injected into the feed as previously determined by the manufacturer. An upstream softener is not allowed to exhaust. The RO has a way to flush out the high concentration of ions prior to shutting down.
Pretreatment Preventing scaling with the injection of an acid or antiscalant, or by softening the water, is one aspect of what is considered the RO “pretreatment” system. In boiler feed applications, the RO “pretreatment” is part of the boiler “pretreatment,” which includes the RO. Another RO pretreatment role would be “dechlorination,” as required to protect the “membranes” from damage of its polymer from the chlorine in the city water. This usually involves the injection of sodium bisulfite (SBS), or it might involve activated carbon filtration, called “carbon” or “charcoal” filters. A final pretreatment role is reducing the number of particles in the feedwater that might otherwise cause RO “fouling.” The term, “fouling,” is applied specifically to the loss of “membrane” performance that is caused by suspended solids. Suspended solids are particles that are held up in water by collisions with water molecules. They block the passage of light, and so make the water appear “turbid.” Their size is about three orders of magnitude larger (i.e., 1000X) than the water ions. The largest of the suspended particles may be caught in the spacing material between the membrane’s envelopes, which will restrict the flow of feedwater through the membrane. This will cause the pressure to further decline as the water passes through all of the stages, resulting in a decline in the reject pressure, measured just upstream of the reject valve/restriction. Many of the newer RO “membrane” models now use a thicker 34-mil (0.034 inch) spacing material that is less prone to becoming blocked by these larger particles. The smaller suspended particles in the feedwater will become more concentrated near the polymer surface of the membrane envelopes and may then stick together and to the polymer. This will cause the product flow 87
rate to decline unless the feed pressure is increased to compensate for this “fouling.” These two types of fouling by suspended solids in the water source will result in the need to perform a chemical “cleaning” to restore the original RO performance. It might be noted that no filter used in the RO “pretreatment” will remove suspended particles as well as the RO itself, which removes virtually all of them as long as there are no mechanical leaks in the system, such as damaged O-rings. Multimedia filters, often called “sand” filters, are a relatively inexpensive way to remove the vast majority of the larger particles from the feedwater. When sized for a low flow rate, they may remove enough that the remaining small particles, known as “fines” or charged “colloids,” are able to keep moving along the membrane’s polymer surface and will simply exit in the RO reject stream. Some water sources may contain such a high concentration of “fines” that a membrane filtration system might be justified, such as a microfiltration (MF) or ultrafiltration (UF) system. Table A summarizes pretreatment steps used to optimize operation of an RO system. Table A: RO pretreatment steps.
Pretreatment Dechlorination Scale prevention
Fouling control
Common Options Activated carbon filters SBS injection Acid injection Antiscalant injection Softening Coagulation/clarification Sand filters Microfiltration/ultrafiltration Biocides
Biofouling Bacteria and particles created by the bacteria may make up a substantial part of the suspended solids in the feedwater. However, because those particles contain a high percentage of water, their concentration is often underrepresented in common measurements like turbidity, total suspended solids (TSS – the dried weight of solids filtered out of the water), and particle counts (aka, particle size analysis). A common onsite test in the RO industry is the silt density index (SDI). It usually offers better sensitivity to biological materials because it measures particle fouling of a submicron filter pad. the Analyst Volume 26 Number 3
T.U.T.O.R. continued
Biologically, particles are more likely to stick to the RO membrane’s polymer surface and to its spacing material between the envelopes because of their sticky plastic-like sugars, called polysaccharides (aka, extracellular polymeric substances, or EPS) and can be difficult to remove by chemical cleaning. They may be present in a natural water source or may be created in a water distribution piping system if not aggressively chlorinated, or they may be created within the piping and system components located after the point of dechlorination, which should be immediately upstream of the RO. With insufficient chlorine, bacteria can form a slime layer, called a “biofilm,” on the inside surfaces of piping, tanks, and other components. Within the biofilm, polysaccharide particles are formed that can be shed into the flowing water. Many of the slime-creating bacterial species grow best when there is minimal dissolved oxygen in the water. These are called anaerobic bacteria. Iron-related bacteria (IRB) species are often present that can corrode iron out of stainless steel piping, which becomes integrated into its slime particles. The extent of the biological problems will often correlate with the concentration of organics in the water, which might be measured via a total organic carbon (TOC), biological oxygen demand (BOD), or a chemical oxygen demand (COD) analysis. Figure 3 illustrates how biofilm can develop inside a pipe. After dechlorination, a biofilm is free to grow on the inside of a pipe, where it can shed biological polysaccharide particles into the passing water. Figure 3: Ways biofilm can form inside a pipe. Source: Courtesy of Purewatercloud LLC
Chlorine Removal How chlorine is removed from the water source will often impact the prevalence of bacteria directly upstream 88
of the RO. Waiting too long to replace the “carbon” can result in the filter becoming a biological particle factory. A suggested replacement frequency would be when it is no longer reducing the inlet water TOC. Injecting an excessive concentration of SBS will result in that excess reacting with the dissolved oxygen in the water. This often occurs when using a “0.00 mg/L” chlorine concentration as an SBS injection control target due to the limited sensitivity and precision of chlorine test methods. It can also occur when using a minimal oxidation-reduction potential (ORP) reading as the control because of its lack of sensitivity to low chlorine concentrations. Rather, the SBS injection pump output should be adjusted based on obtaining a positive but minimal residual sulfite concentration, as directly analyzed onsite in the RO feedwater using a method designed specifically for low sulfite concentrations. How easily the chlorine is removed by carbon, or SBS, will depend on the type of chlorine. If chlorine gas (Cl 2) or sodium hypochlorite (NaOCl) is injected into water that does not contain ammonia (NH4+/NH3), “free chlorine” is the result. It is the most biocidal form of chlorine, especially at pH values less than 8.0, where most of the chlorine will be in the form of hypochlorous acid (HOCl) and can easily diffuse through the bacterial cell walls. Free chlorine is very reactive and so will immediately break down when mixed with SBS. Ammonia may be naturally present in some groundwater sources, or it may be added by a city water treatment facility. The ammonia combines with the chlorine to form chloramines (the total of all the chloraminated forms, mostly consisting of monochloramine, NH2Cl), which are not as reactive and so are not as effective as a biocide, nor are they as easy to break down by SBS or carbon. A higher SBS concentration or increased carbon sizing will likely be needed for its complete removal, although monochloramine at a pH less than 8.0 does not pose as great a threat to the membrane’s polymer as free chlorine. Many RO units are operated with monochloramine in their feedwater as a way to control biological activity within the RO, and still most of these systems achieve acceptable membrane life. Their concentration is usually measured using the “total chlorine” analysis.
the Analyst Volume 26 Number 3
T.U.T.O.R. continued
Summary
Many treatment facilities will provide chloraminated water at a pH well in excess of 8.0. The ammonia that results from the chloramine breaking down will go through the membrane as dissolved NH3 gas at the higher pH. This may cause the “product” water pH to be substantially higher than the feedwater, which may dramatically increase its conductivity. The high product water conductivity will then make it inaccurately seem like the RO is not rejecting ions well.
In conclusion, an understanding of RO lingo should make it easier to understand many of the issues that affect RO performance. When a problem arises, knowing the lingo will improve the ability to discuss the issue with others without feeling as if you are speaking different languages. Table B provides a summary of important terms used in the RO business. Figure 4 shows an example of an RO system installed in an end user’s site.
Table B: Common terms associated with RO systems.
RO Term Membrane Permeate Inlet Concentrate Recovery Vessels Crossflow Bank Array Pass Conductivity Fouling Scale Clean
Alternative Named Element Filter Product Feed Makeup Reject Brine Efficiency Housings
Scaling Cleaning
CIP
Scale inhibitor Pretreatment
Antiscalant
Polymer
Activated carbon
Carbon
AC/GAC
Polysaccharides Colloids Hypochlorous acid (HOCl) Chloramines
Slime/EPS Fines Free chlorine
Biofilm Clay Chlorine
Stage Banking
Total chlorine
Definition Spiral-wound membrane element installed in the RO system. The lower salinity water that has permeated the membrane. The water to be treated by the RO system. The water stream highest in salinity that exits the RO system. The percentage of feedwater that is converted to “product.” The pressure vessels that contain the “membranes.” The water stream flowing through the membrane’s channels. One or more vessels with parallel feed and reject connections. The number of vessels in each stage of an array, 2:1, 4:3:2, etc. An RO array where water permeates the membrane one time. Electrical conductance as a measure of the water’s salinity. RO performance loss caused by deposits of suspended solids. RO performance loss caused by formation of solid salts. Onsite circulation of a chemical to remove RO fouling or scale. An injected chemical that prevents scale formation. Entire RO system or just the components upstream of the RO. Coal, wood, or shells (coconut, nut) treated to create pure carbon granules. Sticky biologically-created materials. Extremely small charged particles that resist coagulation. The chlorine molecule that results from the dissolution of chlorine gas or sodium hypochlorite when ammonia is absent. The total of the chlorinated molecules that form from ammonia combining with hypochlorous acid or hypochlorite.
89
the Analyst Volume 26 Number 3
T.U.T.O.R. continued
Figure 4: Example of an RO system. Source: Courtesy of Purewatercloud LLC
Wes Byrne is president of Purewatercloud LLC. He has 40 years of RO and high-purity water treatment experience and authored the book Reverse Osmosis, A Practical Guide for Industrial Users (2nd edition, 2002, Tall Oaks Ventures LLC). Purewatercloud LLC provides consulting, online training and training seminars, membrane cleaning, software development, and RO monitoring products to support the needs of RO, UF, IX, and EDI manufacturers and end users. Mr. Byrne may be reached at WesByrne@ purewatercloud.com.
90
the Analyst Volume 26 Number 3
CWT Spotlight Justin Ranger, CWT
Account Manager, CH2O, Incorporated
What prompted you to obtain your CWT designation? When I was hired by my current company, it was part of my professional development to attain the CWT designation by the time I had reached five years of industry experience. In fact, I already had five years of industry experience when I was hired, but I was not prepared to take the exam. In my previous role as a service technician, I didn't realize the depth of knowledge that was available in this industry, so my knowledge was limited to the field work I was doing. I was challenged to study for the exam and I had a real desire to learn. How did you prepare for the test exam? Preparation fell into three stages: 1) About two years before I took the exam, I started using the Technical Reference and Training Manual (TRTM) along with several of the other books in the AWT bookstore as reference material while conducting my daily work. Every time I encountered something I didn't understand or had a question about, I would look it up; when a topic piqued my interest, I would read up on it. I took time to mesh the theory and explanation in the reference books with the testing and observations I made in the field; the exam is checking for professional competency, so you really need to understand the concepts inside and out. 2) About three months before my exam date, I read the TRTM cover to cover. 3) I attended the Technical Training seminar the week before taking the exam. The second and third stages were important to round out the theory and to get more exposure to topics that I had less direct experience with.
Why do you feel this credential was important to have? I think that it demonstrates a personal commitment to the industry—that an individual has enough experience and knowledge to be competent and that they have taken the time to demonstrate it. The exam is not something that you can cram for the night before, and likewise, just because someone has years of experience, if they don't study, their chances of passing will likely be low. On the contrary, those that prepare with intentionality and purpose, they will likely pass with little effort. Learning is a lifelong process, but the CWT designation provides a benchmark. If you know the boundaries of your knowledge, when you encounter something you don't know, you then have a basis to search for the answer. If you don't know what you don't know, then it is more difficult to find the solution to the problem. What are the advantages of having the CWT designation? I view the CWT as representing experience, knowledge, and integrity. I think this provides confidence to those who hold the designation and also gives assurance to customers and prospects that the individual is competent. How has the CWT designation improved your professional career? Having earned the CWT designation gives me more confidence in my abilities, demonstrates competence to customers and prospects, gives me tools to solve problems, and provides an opportunity to develop great relationships in the industry. It has only been helpful, and the substance of what it represents is of great value.
Congratulations to Our Newest CWTs Please join us in congratulating the latest individuals to become CWTs (March 6, 2019–July 25, 2019) Craig Bodenmiller, CWT, Technical Resources Group Adam Campo, CWT, Jaytech, Inc. Brian Irwin, CWT, Economic Alternatives, Inc. Bill Korman, CWT, Guardian CSC
Robert Reynolds, CWT, Industrial Water Technologies Inc. Paul Sharep, CWT, U.S. Water Services, Inc. Ken Sunderman, CWT, IPAC Chemicals, Ltd.
91
the Analyst Volume 26 Number 3
Ask the Experts The discussion below occurred on AWT’s online community, the Exchange. Be sure to join to be part of the conversation!
Corrosion Coupon Question 1
I have a rather odd scenario. I have coupon showing a massive amount of corrosion. What's odd is the tower water it's subjected to is around 215 Conductance, 70 calcium, 90 Alk. Not particularly an environment to conduce this kind of corrosion. The tower is using a dry chemical system with a circulation pump constantly providing flow through the manifold 3-5 gpm. Tower circulates 4-5 hours per day. Regarding the inhibitor, we maintain a residual at 2.7 PBTC.
Answer 4 Looks like either no or insufficient corrosion inhibitor resulting in pitting corrosion. Note that PBCT is not a very good corrosion inhibitor, you may want to consider an AMP/HEDPA mix in place of the PBCT, could still run 4 COC with such a mixed product. What is the chloride level in the cycled water, as higher corrosion rates are often linked to higher chloride levels. Dry feed systems often give inconsistent levels of inhibitor, you may want to do multiple analysis over an operating cycle.
I was thinking of some sort of electrical or grounding issue in the piping. Any thoughts?
Answer 5 Have you checked for SRBs/IRBs?
Answer 1 Being that the tower is only circulated 4–5 hours a day, I would first look at the potential of MIC. Attack looks to be more localized.
Answer 5 I am presuming your coupon is steel. With low hardness and low alkalinity, you would expect to see corrosion.
Answer 2 Please calculate the Saturation Index (either LSI or RSI) for this water. You will need to know your TDS, water temp, and pH. I think you will find with those low alkalinity and calcium hardness numbers you have corrosive water. You could either cycle up your water more to reduce corrosion or feed a corrosion inhibitor program. You up may want to have a look at the AWT TRTM in the cooling water section. It is a great resource.
PBTC does not offer corrosion inhibition. If you do not have total alkalinity at 300 to 500, ferrous metals will corrode in an open loop. Additionally, with only circulating 4–6 hours per day, you may be having stagnant issues. You may want to verify that you don't have a bacteria issue. Consider running the system continuously or at least more often; perhaps just from the sump to the basin. Check to see if you have a treatment intended for softer water. Also, if you have copper in the systems, check for presence of Triazoles in your treatment.
Answer 3 What type of corrosion is uniform, localized or pitting, what pH do you control, can you measure the phosphate residual, another data is if you measure the organic development that can also be corrosion by bacteria. If you can share this data, we can give you some suggestions more in line with your system.
92
the Analyst Volume 26 Number 3
Innovating Water Hygiene
Point of Use Filters Patented Monochloramine Disinfection Technologies Water Safety Plans Legionella Testing
Providing all the right tools to water treatment professionals
Join the Sanipur All-Star Team +1-484-351-8702 w w w. san i p u r. co m sales@sanipur.com
Capital Eyes
Here We Go Again By Janet Kopenhaver
It is the summer, and here we go again with the threat of a government shutdown and the country running out of money to pay our bills. One has to wonder why Congress cannot plan better—as we all have to do to pay our own bills on time.
The State of Affairs First, let us look at the debt ceiling issue. Secretary of Treasury Steven Mnuchin has warned that the United States is running out of cash much faster than previously projected. He has advised that the debt ceiling must be raised by early September to ensure that the government can pay its bills. The problem: Congress is scheduled to go on recess for the entire month of August and the first week in September. This means a deal must be cut between the White House and Congress within the next two to three weeks (at press time). The government spends roughly $900 billion more than it brings in through revenue each year, and it covers the difference by issuing debt, a way of borrowing money. But it can issue debt only up to a certain limit set by Congress. Congress last suspended the debt limit in 2018, but that suspension expired in March. The Treasury Department has worked to delay certain payments as a way to avoid falling behind on major payments, but it is projected to run out of this flexibility in either early September or at some point in October., depending on when tax payments come in. On another front, the new fiscal year begins on October 1, 2019, which means Congress must pass spending bills
94
for all the federal agencies before September 30, 2019. The White House has been trying to broker a budget deal with lawmakers for more than a month, but they remain far apart on how much money they want to authorize for the federal budget. While the administration has agreed to some increased budget levels for some agencies, they fall far short of what the Democrats want.
The Strategy The White House is asking for a stand-alone vote on raising the debt ceiling. However, Democrats have been fighting against that approach, as they believe that without linking the two votes in one legislative package, the administration will more easily be able to shut down the government and not agree to spending increases without worrying about the country defaulting on its debt. House Speaker Nancy Pelosi (D-CA) has already stated that she wants to raise the debt ceiling as part of a deal that would set spending levels for the next two years. Meanwhile, the White House has told federal agencies to submit new contingency plans by the beginning of August outlining their plans for a possible government shutdown—not a development that gives us much hope that our leaders will do their jobs and ensure that the government remains open. Janet Kopenhaver is president of Eye on Washington and serves as the AWT Washington representative. She can be reached at (703) 528-6674 or janetk@eyeonwashington.com.
the Analyst Volume 26 Number 3
Financial Matters
Estate Planning Portability Lives on Under the TCJA When the TCJA was passed, the big estate planning news was that the federal gift and estate tax exclusion doubled from $5 million to an inflation-indexed $10 million. It was further indexed for inflation to $11.18 million for 2018 and now $11.4 million for 2019. Somewhat lost in the clamor, however, was (and is) the fact that the new law preserves the “portability” provision for married couples. Portability allows your estate to elect to permit your surviving spouse to use any of your available estate tax exclusion that is unused at your death.
A brief history
At the turn of this century, the exclusion was a mere $675,000 before being hiked to $1 million in 2002. By 2009, the exclusion increased to $3.5 million, while the top estate tax rate was reduced from 55% in 2000 to 35% in 2010, among other changes. After a one-year estate tax moratorium in 2010, the Tax Relief Act (TRA) of 2010 reinstated the estate tax with a generous $5 million exclusion, indexed for inflation, and a top 35% tax rate. The American Taxpayer Relief Act (ATRA) of 2012 made these changes permanent, aside from increasing the top rate to 40%. Most important, the TRA authorized portability of the estate tax exclusion, which was then permanently preserved by the ATRA. Under the portability provision, the executor of the estate of the first spouse to die can elect to have the “deceased spousal unused exclusion” (DSUE) transferred to the estate of the surviving spouse.
How the DSUE works
Let’s say Kevin and Debbie, who have two children, each own $5 million individually and $10 million jointly with rights of survivorship, for a total of $20 million. Under their wills, all assets pass first to the surviving spouse and then to the children. If Debbie had died in early 2019, the $10 million ($5 million owned individually and $5 million held jointly) in assets would be exempt from estate tax because of the unlimited marital deduction. Thus, her entire $11.4 96
million exclusion would remain unused. However, if the election is made upon her death, Kevin’s estate can later use the $11.4 million of the DSUE from Debbie, plus the exclusion for the year in which Kevin dies, to shelter the remaining $8.6 million from tax, with plenty to spare for some appreciation in value. What would have happened without the portability provision? For simplicity, let’s say that Kevin dies later in 2019. Without being able to benefit from the unused portion of Debbie’s exclusion, the $11.4 million exclusion for Kevin in 2019 leaves the $8.6 million subject to estate tax. At the 40% rate, the federal estate tax bill would amount to a whopping $3.44 million. Although techniques such as a traditional bypass trust may be used to avoid or reduce estate tax liability, this example demonstrates the potential impact of the portability election. It also emphasizes the need for planning.
Other points of interest
Be aware that this discussion factors in only federal estate taxes. State estate taxes may also have a significant impact, particularly in some states where the estate tax exemption isn’t tied to the federal exclusion. Also, keep in mind that, absent further legislation, the exclusion amount is slated to revert to pre-2018 levels after 2025. Portability continues, although, for those whose estates will no longer be fully sheltered, additional planning must be considered. Furthermore, portability isn’t always the best option. Consider all relevant factors, including nontax reasons that might affect the distribution of assets under a will or living trust. For instance, a person may want to divide assets in other ways if matters are complicated by a divorce, a second marriage, or unusual circumstances.
Details, details
Every estate plan includes details that need to be checked and rechecked. Our firm can help you do so, including deciding whether portability is right for you. © 2019 Thomson Reuters
the Analyst Volume 26 Number 3
Annual Convention & Exposition September 11-14, 2019 Palm Springs, CA
Stop by Booth 523 to Learn More!
50% OFF SP-710/710B Trade In & Earn Discounts
Discount Program: July 1 - September 30 Trade in your SP-700/700B in ANY condition Earn 50% OFF list price on SP-710/710B Contact Pyxis Lab or AquaPhoenix Scientific order@pyxis-lab.com info@aquaphoenixsci.com Watch Our Ad on YouTube Scan the QR Code with your phone!
www.pyxis-lab.com
Business Notes
Creating a Culture of Continuous Improvement By Aravind Chandrasekaran, Ohio State University, and John S. Toussaint, Catalysis
American health systems have lowered costs and improved outcomes and patient satisfaction by applying the Toyota Production System (TPS) to the redesign of clinical and administrative processes. But in all too many cases, these efforts begin to slip when the leader who originally championed TPS leaves the organization. Through our research in health care and beyond, we’ve identified practices for sustaining TPS’ culture of continuous improvement. They include the following: incorporating TPS in succession planning for the CEO and board members, instilling lean behaviors in managers at all levels, creating your own success stories and establishing a TPS operating system. These practices can help leaders and teams from any industry to keep up with customer demand, navigate internal hierarchies and establish a system of continuous improvement.
Include TPS in Succession Planning For three consecutive years, St. Mary’s General Hospital in Kitchener, Ontario, has been ranked one of the three safest hospitals in Canada. But six years ago, the system was much lower on the list as it grappled with an unusually high level of sentinel events such as patient falls. Don Shilton, the chief executive, set his sights on eliminating those events altogether and achieved success by instituting improvement processes that encouraged front-line nurses to identify and solve problems, creating a new workplace culture. In one unit, for example, falls dropped more than 80% in a year as nurses designed and implemented new standard work practices. At the same time, Shilton was thinking ahead to his retirement. He realized that if TPS were to survive at St. Mary’s after he left, he needed to get the hospital’s governing board of trustees — whose members were outsiders — to understand and support the approach. 98
Toward that end, he got them to spend time on the front lines of St. Mary’s: the emergency room, inpatient units and clinics. There, they began to see what continuous-improvement processes and support systems look like and understand how they work. Before Shilton retired last year, the board’s recruitment committee developed a list of criteria for selecting his successor. At the top of the list was experience in continuous-improvement cultures.
Instill Lean Behaviors at All Managerial Levels Our research at various American hospitals found that while top leaders have been largely successful in rolling out the tools of continuous improvement, some are struggling to instill lean behaviors in managers and teams at all levels. Susan Ehrlich, the CEO of Zuckerberg San Francisco General Hospital, introduced TPS by creating a development plan for her physician and staff leaders tied to an existing self-rating system that tracks five observable behavioral dimensions. For example, to find out whether managers are “leading with humility,” the hospital tracks whether they are going to the front lines to understand how work is performed. What if the managers modeling these behaviors fail to participate in TPS, or leave the practice altogether? In a randomized controlled study of the Mayo Clinic system, we saw the continuous-improvement culture begin to erode when physicians leading daily “huddles” — short team meetings aimed at improving managing quality and safety — were either too busy with other duties to hold the huddles or had left the primary care practice. In several instances, we found that nurses and receptionists had important information but were not comfortable with sharing it. Huddles ultimately stopped occurring at these clinics. the Analyst Volume 26 Number 3
Business Notes continued
At the clinics in the Mayo system where huddles thrived, teams were rotating the leaders of the daily meetings, often allowing nurses or receptionists to take the spotlight. The major benefits of this approach include a flattening of the hierarchies among the teams and open communication about the struggles team members face when working to improve patient care.
Create Your Own Success Stories Sustaining and expanding a continuous-improvement culture means fighting the general reluctance of workers to change routines. One effective way to do that is by focusing on solving existing problems inside your own organization and not looking to the success of others. We saw this dynamic play out when working with physicians and nurses at Ohio State University’s medical center on a study to reduce readmissions of patients who had kidney transplants. Providers resisted the notion that successful continuous-improvement strategies used in other hospital units would work in theirs, so we quickly realized that name-dropping Toyota and the Cleveland Clinic would only compound resistance to change. To alter this mindset, we focused on isolating and solving a problem in their unit. Showing that a problem exists in a team’s day-to-day setting prompts conversations that lead to change. It also makes people less likely to initiate projects amid a leadership change. In this case, the renal transplant team was able to reduce readmissions
100
by 9% over nine months in 2017, and it continued to improve even after the clinic’s medical director departed.
Establish a TPS Operating System Most managers of clinical organizations are in their roles because they became accomplished problem-solvers through acts that saved the lives of their patients. Unfortunately, individual heroics aren’t enough. Some 250,000 Americans will die of medical errors this year, largely due to an autocratic operating system that doesn’t allow for front-line input. The secret to maintaining a continuous-improvement culture is making TPS a way of life for the entire organization. The Hospital for Sick Children, in Toronto, Canada, is one of many hospitals that is doing this. Its 10-component system begins with front-line teams, which huddle each shift to flag problems that small groups will later tackle. These wins, along with outstanding issues, are communicated daily in visual format to middle and top-level managers so that they have a clear idea of the organization’s overall performance. This system has helped the hospital cut wait times in the emergency room by 14%. Aravind Chandrasekaran is a professor at Ohio State University. John S. Toussaint is the founder and executive chairman of Catalysis. © 2019 Harvard Business School Publishing Corp.
the Analyst Volume 26 Number 3
Business Owners Meeting February 10-11, 2020 COLLABORATE
THRIVE NETWORK
IDEA EXCHANGE
GAIN RETURN
GROWTH
Hyatt Regency Clearwater Resort Clearwater, FL
SOLUTIONS PUMP GATHERING PUMP 101
the Analyst Volume 26 Number 3
Advertising Index 37 AMSA, Inc. 65 AquaPhoenix Scientific Inc. 43 Bio-Source, Inc. 27 Brenntag North America 102 Bulk Systems, Inc. 101 Chem-Met Company 17
CHEMetrics, Inc.
45 Environmental Safety Technologies, Inc. 77 French Creek Software, Inc. 63 IDEXX 57 Innovative Water Care 78 Keystone Insurance Group 47 LMI Pumps 39 Lovibond Tintometer 95 Lutz-Jesco America Corp. 52 Myron L Company 23 North Metal & Chemical Company 2
Pulsafeeder, Inc.
97 Pyxis Lab, Inc. 25 QualiChem, Inc. 81 Ques Industries, Inc. 93 Sanipur US LLC 84 Scranton Associates, Inc. 104 Special Pathogens Laboratory 99 USABlueBook 75 Univar Solutions 55 Walchem, IWAKI America Inc. 103 Water Science Technologies
102
the Analyst Volume 26 Number 3
BLT Best Legionella Test.
The perfect combination served by the right lab. • • • •
Accurate results Free results consultation Outbreak preventon Partnership with The Legionella Experts® THE LEGIONELLA EXPERTS ®
www.specialpathogenslab.com
Topped with: Expert Legionella microbiologists. Scientifically validated methods. Accredited for Legionella testing. Industry leader in prevention. Evidence-based solutions. More than a lab. Can’t beat that.
Visit us at booth 357/359