

The US macroeconomic data released in June 2026 were broadly mixed: demand and consumer activity remained resilient, but inflation remained above the Federal Reserve's target, and the housing sector appeared weak.
May CPI data showed consumer prices rose by 0.5% month-on-month and by 4.2% year-on-year, with core inflation at 2.9% year-on-year. The PCE index, which the Federal Reserve regards as its primary inflation gauge when making interest-rate decisions, rose by 4.1% year-on-year in May (core PCE by approximately 3.4% year-on-year). Ultimately, June releases confirmed that inflation remains above the 2% target and that the challenge facing the Federal Reserve remains substantial.
Retail sales in May grew by 0.9% month-on-month and by 6.9% year-on-year, indicating consistently high consumer demand despite rising prices.
May's employment report showed that the US economy added 172,000 new jobs, and unemployment fell to 4.3%. The rise in employment and the moderate increase in earnings indicate that the labour market remains resilient. For the Fed, this is an additional argument in favour of caution: the economy does not appear sufficiently weak to prompt rapid policy easing.
Source: Bloomberg, Astero Falcon analytics.
Thus, persistent inflation and a strong labour market could allow the Fed to keep the policy rate at its current level and even leave room for a further increase. Most market participants view a single 0.25% rate increase by the end of 2026 as the most likely scenario.
Kevin Warsh assumed office as the new Chair of the Federal Reserve on 16 May, and on 17 June he held his first meeting, at which the policy rate was left unchanged (at 3,5–3,75%); for the first time since June 2025 the vote was unanimous — not a single committee member voted for a rate cut, and half of the participants expect a rate increase.
One of the most notable changes was the nearcomplete winding down of the policy of signalling to the market (forward guidance and the dot plot). Warsh said that FOMC statements would become shorter and simpler and that the Fed would no longer pre-announce to markets the likely path of rates.
In addition, the new head of the Fed announced a comprehensive reform of the Fed: the creation of several working groups that will review communications policy, data analysis methods, inflation strategy, the structure of the central bank's balance sheet and internal decision‑making procedures. Amid political pressure from the US administration, Warsh separately emphasised the central bank's independence.
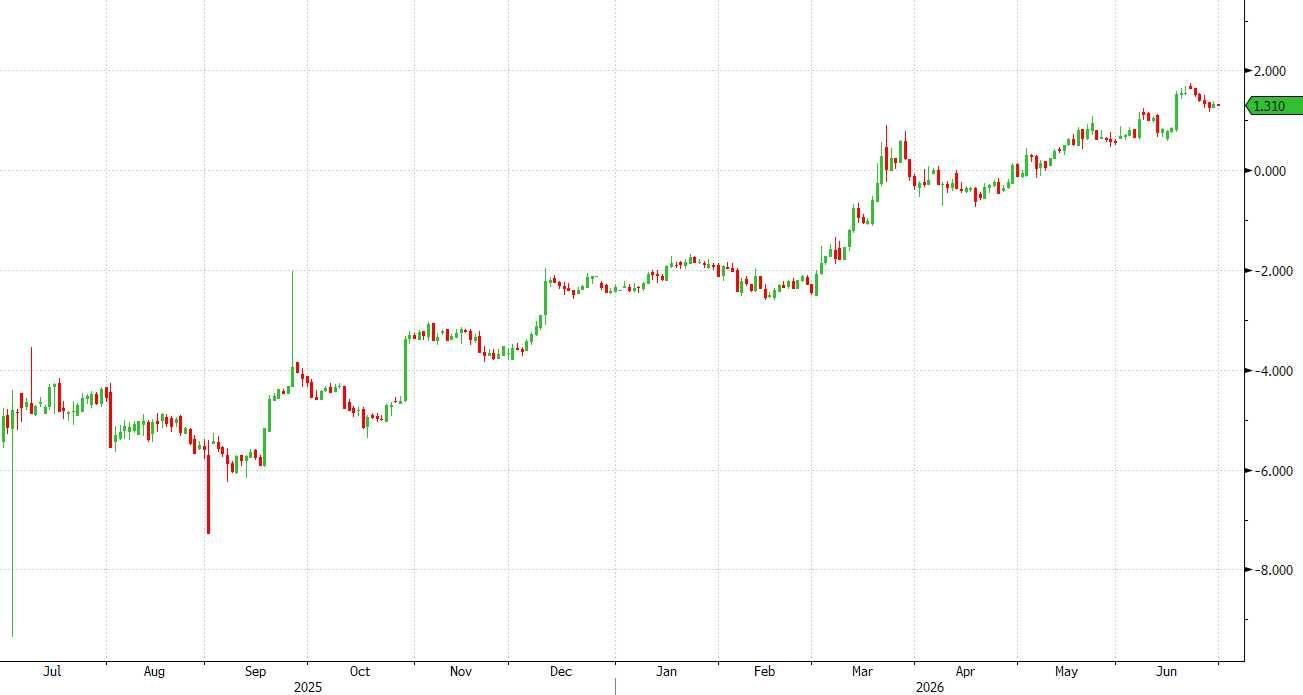
Since September 2025 market participants have sharply revised their expectations for the trajectory of the Federal Reserve's policy rate. Merely 9 months earlier investors were pricing in six rate cuts by the end of 2026 – but by June 2026 the base-case scenario had become a 0.25% rate increase.
Source: Bloomberg, Astero Falcon analytics.
The key event of the month was the listing of the American aerospace corporation SpaceX, whose principal shareholder is Elon Musk. It was the largest initial public offering (IPO) in history: the company raised a total of $86 billion. Market capitalisation at the start of trading stood at $1.8 trillion, an unprecedented valuation for a company going public, and in the first 3 days after trading began the share further rose by approximately 50%, reflecting heightened market enthusiasm. This single offering raised more capital than all IPOs in the US over the previous two years combined, making it a key event for the global capital market in 2026.
High demand during the subscription phase is partly explained by institutional demand. This spring two of the five largest American index providers approved a fast track procedure for inclusion of large new IPOs in their indices. As a result of this innovation, just 2 weeks after the IPO SpaceX shares entered the Russell 1000 index, and on 7 July they may also be included in the Nasdaq 100 index. Inclusion in an index could lead to further increases in share prices, owing to large inflows from passive exchange-traded funds that replicate the composition and dynamics of the indices.
Source: Bloomberg, Astero Falcon analytics.
Nevertheless, inclusion in an index or a successful listing does not make SpaceX a no-brainer investment; the company’s profitability today rests largely on a single segment: Starlink, the satellite internet service, which generated about $12 billion in revenue in 2025 (approximately 61% of the company’s total revenue) and grew by almost 50% year-on-year, while launch revenues are substantially lower ($4 billion) and grew by only 8% year-on-year; in total, SpaceX generated about $19 billion in 2025, but due to costs related to Starship launches and the acquisition of AI startup xAI, the net loss in 2025 amounted to $5 billion.
The company's current valuation reflects a high level of investor optimism. With a market capitalisation of about $2 trillion, the shares trade at a Price/Sales multiple above 100x, and the Price/Earnings ratio is not applicable due to the absence of earnings.
Against the backdrop of SpaceX's market success, all Mag7 shares showed weak performance in June. This may be because passive funds and private investors had been preparing in advance to add SpaceX shares to their portfolios and were freeing up liquidity by selling other large positions, primarily among past market leaders.
At the same time, it is notable that all the Magnificent Seven stocks have lagged the index since the end of last year; this suggests a rotation of capital into other industries and sectors, primarily into the shares of companies that have benefited from the AI boom (semiconductors, data centres, energy, etc.).
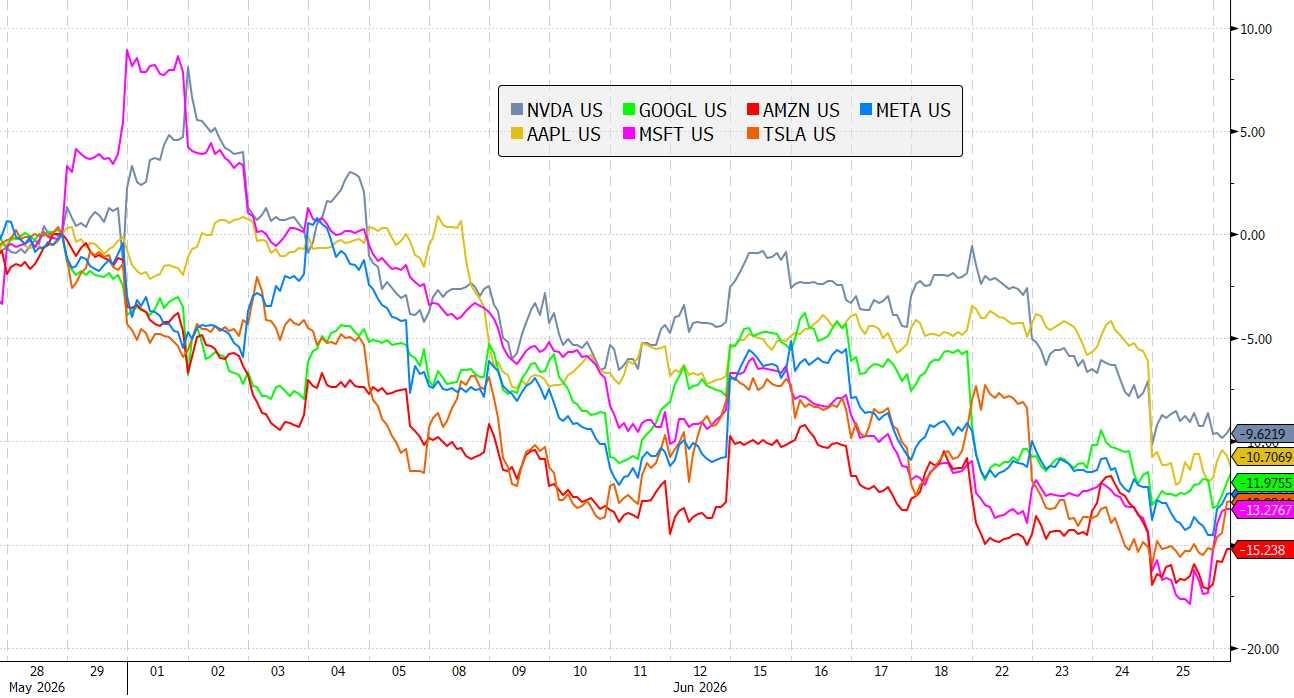
Throughout June the shares of the Magnificent Seven were under pressure, declining by 10% to 15%. The most likely reason was the news of the inclusion of SpaceX shares in major indices – passive funds were preparing in advance to buy SpaceX by selling other large positions.
Source: Bloomberg, Astero Falcon analytics.
On 17 June the Federal Reserve left the policy rate in the 3.50–3.75% range. The updated dot plot reflects a more cautious assessment of the interest-rate path by some FOMC participants. At his first press conference as chair, Kevin Warsh did not provide the market with concrete guidance on further decisions and emphasised that policy depends on incoming data.
For the market, this implies continued uncertainty, primarily at the short end of the curve: further dynamics could be determined by new data on inflation, the labour market and energy prices, rather than by preliminary signals from the Fed.
The market already offers a more attractive compensation for interest-rate risk than at the start of the year: the 10-year UST yield is around 4.38%, while the real yield on 10-year TIPS exceeds 2%. At the same time, long-term inflation expectations remain near 2.2%, i.e. the market is not yet pricing in the persistence of higher inflation over a multi-year horizon.
This creates a rationale for a modest overweight in duration in dollar-denominated bonds. The primary argument is the combination of high real yields, signs of slowing domestic demand and a potential easing of the energy-related inflation impulse in the second half of the year. The focus is on a gradual increase in duration predominantly in the 5–10 year segment, rather than a pronounced overweight at the long end of the curve in anticipation of a rapid and substantial decline in yields.
Selective exposure to dollar-denominated investment-grade emerging market bonds is additionally of interest. Such a position allows combining a moderate duration overweight with additional carry to U.S. Treasuries, however it is not a defensive equivalent of U.S. government bonds. Aside from interest-rate risk, it remains sensitive to movements in credit spreads, global risk appetite and the dollar.
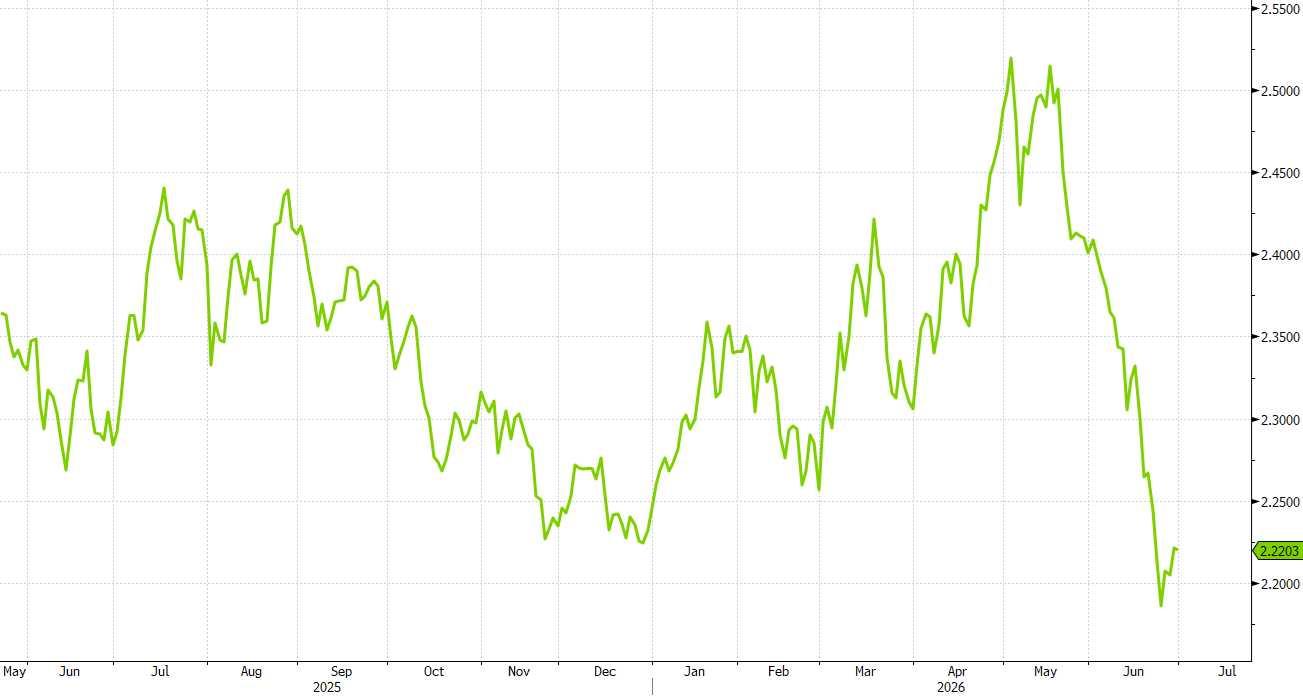
Despite the rise in nominal yields on treasuries, long-term inflation expectations (10-year breakeven inflation) have returned to 2% after a spring spike amid the Middle Eastern conflict. Investors believe that inflation will not stay elevated in the long run, and the yield on long-dated treasuries offers a relatively more attractive premium than at the start of the year.
Source: Bloomberg, Astero Falcon analytics.
In June the EUR/USD rate fell to 1.13, while the US dollar index rose to 101.5, its highest level since spring 2025; against the backdrop of economic problems and a slowdown in industry in Europe, the US appears a relatively more stable and growing economy; moreover, against the backdrop of the firmer rhetoric of the new Fed chair, the US dollar has regained some of its relative attractiveness in terms of interest-rate differentials.
In the eurozone, the combination of weak growth and elevated inflation looks more challenging. The energy shock is having a stronger effect on the region’s real incomes, as it remains a large importer of energy. The ECB raised the deposit rate to 2,25% and maintained a meeting-by-meeting approach. The regulator recognises both upside risks to inflation and downside risks to growth, so the further trajectory of rates could depend primarily on the dynamics of energy prices, services and wages.
The US dollar index closed June above 101, which for a long time served as a key level (support from 2022 to 2025 and resistance from 2025 to the present); if the index holds at current levels or continues to strengthen, this could indicate a regime shift and the beginning of a new period of dollar appreciation, although to confirm this reversal the dollar would need to remain at current levels or higher for at least another 2 weeks, only then could one speak with confidence of the dollar entering a new phase of appreciation; for now, the more conservative scenario is a continuation of a trading range between 97 and 101.
The strengthening of the US dollar in June did not prevent a rise in equities, but it contributed to declines in certain currencies and in some risk assets such as cryptocurrencies and precious metals; Bitcoin, other leading cryptocurrencies, and precious metals closed June at year‑to‑date lows, which is particularly unusual given the decline in Treasury yields throughout the month.
We consider that, in addition to the strengthening of the dollar, this could be related to a period of seasonal weakness in these assets; according to statistics for the previous 25 years, June has been the weakest month for precious metals, and price recoveries tend to begin in the second half of the year.
Source: Bloomberg, Astero Falcon analytics.
US Dollar Index DXY
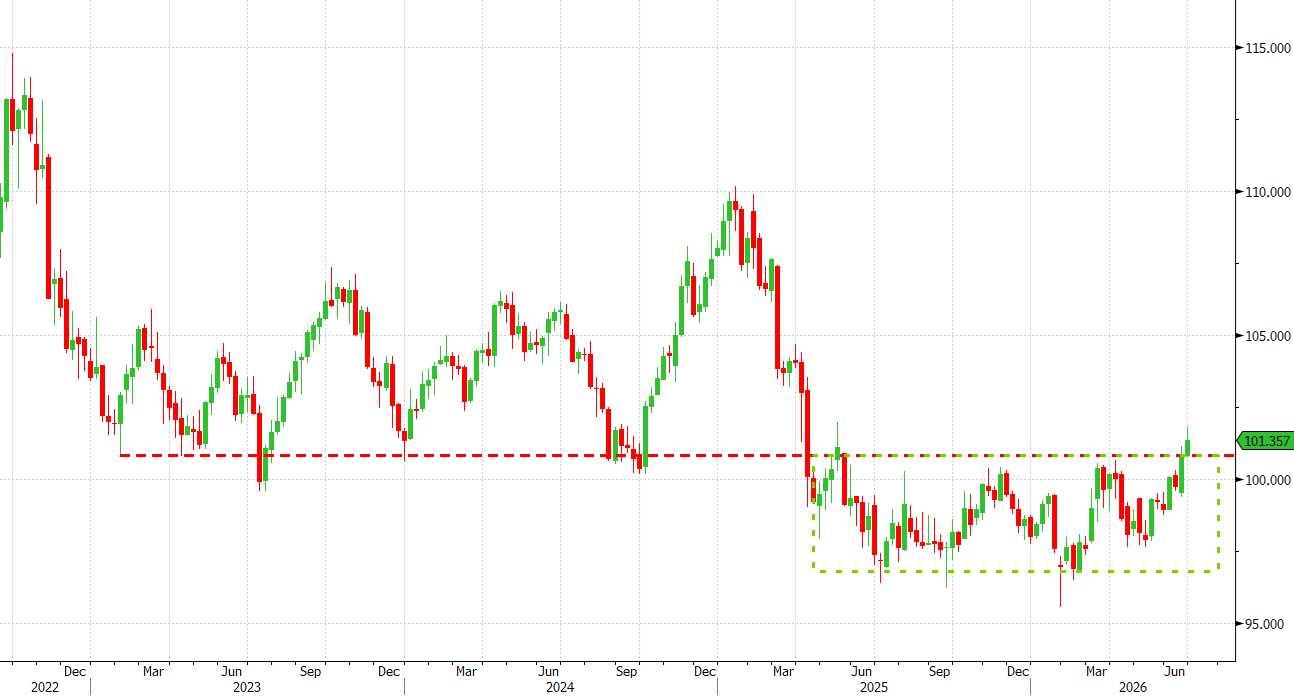
The dollar index closes June above the 101 level, which had long acted as resistance. If the dollar can hold above this level, this could open the way to appreciation to 105 (upside potential +4% from current levels).
XAG USD seasonal pattern 25 years average
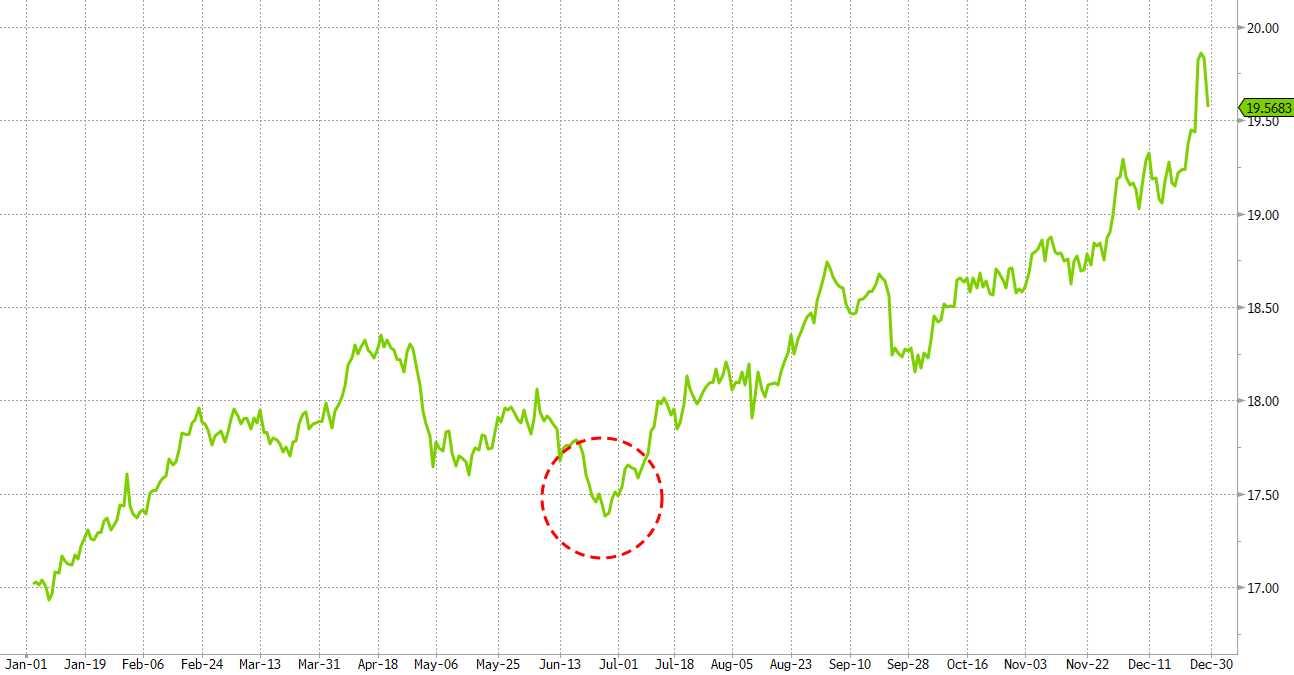
Precious metals, in particular silver, were under pressure throughout June – the main reason was the strengthening of the dollar. Historically, the end of June coincides coincides with a local low in metals.
Source: Bloomberg, Astero Falcon analytics.
Preliminary LSEG data as of the end of June, published by Axios, estimate global M&A volume in the first half of 2026 at approximately $2.7 trillion, about 47% higher year-on-year, while the number of deals fell 10% to the lowest level for a first half since 2020; private equity was an exception: the volume of sponsor-backed deals rose 54% to $583 billion, and the number of deals increased 10%. More than half of global M&A volume came from deals above $5 billion, meaning the market is again operating through balance sheets, credit relationships and strong platforms. The EQT/Intertek deal at GBP 10.7 billion EV and the Bridgepoint/Kayne Anderson Real Estate deal at $1.4 billion reflect this mode well. For family offices, access to capital deployment is increasingly concentrated with managers who can themselves source, finance and underwrite large control transactions.
Sovereign wealth funds are selling concentrated public positions and increasing investments in private assets. Invesco's 2026 study covered 90 sovereign wealth funds with assets of $17.2 trillion and showed that 17% of them plan to reduce exposure to public equities. 28–35% of them plan to increase private equity, private credit and infrastructure, and the average allocation to infrastructure almost doubled to 9% between 2022 and 2025. With the ten largest companies in the S&P 500 comprising 38% of the index, sovereign wealth funds are moving away from concentrated public beta towards private ownership of physical assets that are needed for AI.
SpaceX reopened the IPO window and immediately demonstrated that liquidity was not equivalent to stability. SpaceX priced at $135 per share on 11 June and began trading on Nasdaq under the ticker SPCX on 12 June; Guardian and Business Insider reported that it raised $75 billion at a valuation of around $1.77 trillion. The total amount raised further increased to $85.7 billion after the exercise of the underwriters' option, and Nasdaq announced the inclusion of SpaceX in the Nasdaq-100 prior to the open on 7 July. Shares opened at around $150, closed at $160.95, and the company's market capitalisation peaked at $2.1 trillion.
Notable deals announced in June 2026:
EQT / Intertek: On 18 June EQT agreed to acquire Intertek Group for GBP60,00 per share in cash. The offer values Intertek at approximately GBP 9,3 billion equity value and GBP 10,7 billion enterprise value; ADIA and Mubadala are participating as coinvestors. The deal shows that a large private equity (PE) firm is prepared to pay for sustainable cash flow if the public valuation leaves room for a control premium.
Bridgepoint / Kayne Anderson Real Estate: expansion of the platform by $1.4 billion. Bridgepoint has agreed to buy Kayne Anderson Real Estate in a cash-and-stock deal of approximately $1.4 billion, including $759 million in cash and $189 million in stock. The acquisition of Kayne Anderson increases Bridgepoint's assets under management to approximately $117 billion AUM and raises the share of fee income from the US to 42% from 28%.
Source: Bloomberg, Astero Falcon analytics.
Sovereign Wealth Funds Net allocations by year
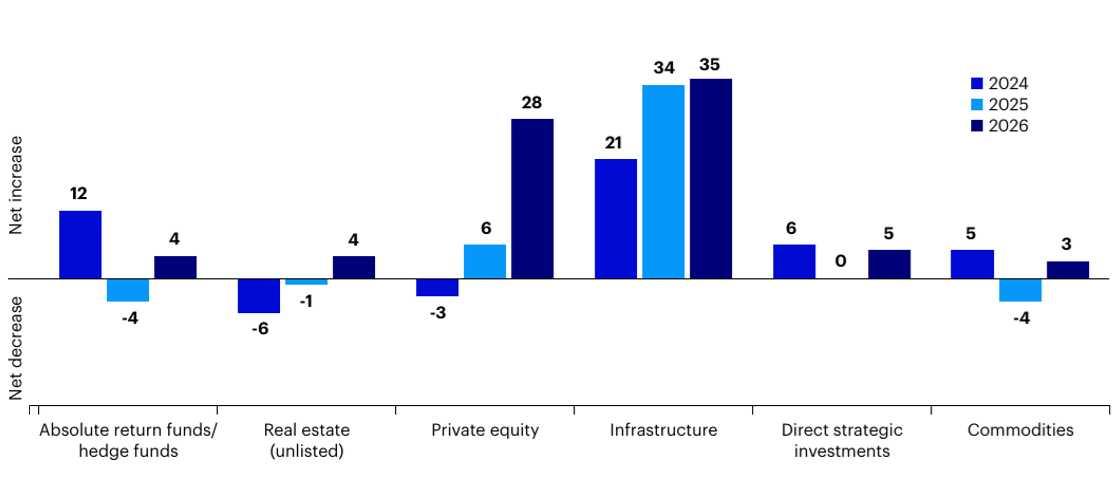
Sovereign wealth funds are gradually reducing their concentration in public markets and increasing investments in private assets.
Source: Bloomberg, Astero Falcon analytics.
Fixed Income
Swiss Bond Index (SBI) AAA-BBB
Bloomberg Barclays Euro Aggregate Corporate TR
Bloomberg Barclays Pan-European High Yield TR
Bloomberg Barclays US Corporate High Yield TR
Bloomberg Barclays Sterling Corporate TR
Bloomberg Barclays China Aggregate TR
Bloomberg Barclays Asia USD High Yield TR
Bloomberg Barclays Global High Yield TR
JPM EMBI Global Total Return Index
Bloomberg Barclays Global-Aggregate TR
Equities
NASDAQ 100 Stock Index
S&P 500 INDEX
Dow Jones Industrial Average
MSCI World Index
MSCI Europe Index
MSCI Emerging Markets Index
SPI
SMIM
DAX
FTSE 100 Index
Hang Seng Index
Shanghai Shenzhen CSI 300 Inde
Nikkei 225
Commodities
Gold
Silver
Copper
WTI
BRENT
Bloomberg Commodity Index
Currencies
EURCHF
CHFUSD
CHFGBP
EURUSD
EURGBP
GBPUSD
Source: Bloomberg, Astero Falcon analytics.
June 2026
0,88%
0,44% 0,47%
0,20% 0,83% 0,14% 0,66%
0,47% 0,63% 0,14%
June 2026 -1,78% -1,74% 2,44% -1,42% 2,10% -2,31% 4,76% 5,22% -1,11% 1,15% -8,41% 2,32% 5,70%
June 2026
-11,38% -22,04% -4,56% -19,01% -20,53% -8,73%
June 2026 1,28% -3,54% -1,88% -2,32% -0,64% -1,69%
2026
1,33%
3,69% 1,80% 2,84% 2,08% 2026 18,31% 9,31% 9,46% 9,14% 10,29% 22,74% 10,19% 9,24% 1,30% 7,72% -9,14% 8,64% 40,36% 2026 -6,84% -18,08% 7,31% 23,21% 20,21% 14,12%
2026 -0,92% -2,10% -0,28% -3,04% -1,23% -1,83%
This document has been prepared and issued by Astero Falcon (DIFC) Limited ("Astero Falcon"), a company incorporated in the Dubai International Financial Centre ("DIFC") and authorised and regulated by the Dubai Financial Services Authority ("DFSA").
This communication constitutes a Financial Promotion for the purposes of the DFSA Rulebook and is directed exclusively at Professional Clients and Market Counterparties as defined under the DFSA Conduct of Business ("COB") Module. It is not intended for Retail Clients and must not be distributed to, relied upon by, or acted upon by any person who does not meet the applicable DFSA client classification criteria.
The information contained in this document is provided solely for general market commentary, informational and discussion purposes and does not constitute: investment advice; a personal recommendation; investment research; an offer or solicitation to buy or sell any financial instrument; an invitation to engage in any investment activity; or any other regulated financial service under the DFSA Rulebook.
Nothing in this document should be interpreted as a recommendation that any investment strategy, financial instrument, asset class or transaction is suitable for any particular investor.
This material has not been prepared in accordance with the legal or regulatory requirements intended to promote the independence of investment research and should not be construed as "Investment Research" under the DFSA Conduct of Business Module.
The views, opinions, estimates, forecasts, targets, projections and forward-looking statements expressed herein reflect the judgment of Astero Falcon as of the date of publication only and are subject to change without notice. Such statements involve known and unknown risks, uncertainties and assumptions, and actual results or market developments may differ materially from those expressed or implied. No representation, warranty or assurance is given that any forecast, projection, target or expected outcome will be achieved.
Any references to market performance, historical data, seasonal trends or past market behaviour are provided for illustrative purposes only. Past performance is not a reliable indicator of future performance. The value of investments may rise or fall, and investors may lose part or all of their invested capital.
This document has been prepared without taking into account the specific investment objectives, financial situation, risk appetite or particular needs of any recipient.
Recipients should conduct their own independent assessment and obtain independent legal, tax, accounting and financial advice prior to making any investment decision.
Any investment decision should only be made following an assessment of suitability and appropriiateness where required under applicable laws and regulations.
Investments and financial markets involve risks, including, but not limited to: market risk; liquidity risk; credit and counterparty risk; currency and foreign exchange risk; interest-rate risk; operational risk; geopolitical and regulatory risk; and the risk of partial or total loss of capital.
Digital Assets / Virtual Assets / Cryptocurrencies
Any references to cryptocurrencies, digital assets, virtual assets, crypto tokens or blockchain-related products are provided solely as part of general market commentary. Such assets may not be regulated by the DFSA unless specifically classified under the applicable regulatory framework and may not benefit from investor protection arrangements applicable to traditional financial instruments.
These assets are highly speculative and may be exposed to: extreme price volatility; reduced liquidity; cyber and technology risks; operational failures; valuation uncertainty; market abuse and fraud risks; and the risk of total loss of capital.
Information contained herein has been obtained from sources believed to be reliable, including third-party market data providers and internal analysis. However, Astero Falcon does not represent or warrant, expressly or impliedly, the accuracy, completeness, reliability or timeliness of such information and accepts no liability whatsoever for any loss arising directly or indirectly from reliance on this document or its contents. Astero Falcon, its affiliates, directors, officers, employees or clients may from time to time hold positions in, provide services to, or otherwise have interests in securities, financial instruments or issuers referred to in this document.
Any potential engagement, onboarding or provision of financial services by Astero Falcon remains subject to: applicable DFSA rules and regulations; internal approval processes; client classification; Know Your Customer ("KYC") procedures;
Anti-Money Laundering ("AML"), counter-terrorist financing and sanctions screening requirements; and execution of definitive legal documentation.
This document is confidential and proprietary to Astero Falcon and may not be copied, reproduced, distributed, transmitted, disclosed or published, in whole or in part, without the prior written consent of Astero Falcon.
Distribution of this document may be restricted by law or regulation in certain jurisdictions. This document may not be distributed in any jurisdiction where such distribution would be unlawful or require registration, licensing or approval. Recipients are responsible for ensuring compliance with all applicable local laws and regulations.
© 2026 Astero Falcon (DIFC) Limited. All rights reserved.
Astero Falcon (DIFC) Limited Office 33, Level 7, Gate Village 10 Dubai International Financial Centre Dubai, United Arab Emirates Email: info@asterofalcon.com Website: www.asterofalcon.com
Chief Investment Officer: Elena Nefedova