Alternative Investments: A Potential Bottom in Precious Metals
Direct
But Only for
Macroeconomics: Elevated Inflation Due To Rising Resource Prices 01
In June consumer prices fell by 0.4% month-onmonth, and annual inflation slowed from 4.2% to 3.5%. The main contribution came from energy: prices fell by 5.7% month-on-month, including a 9.7% decline in petrol prices. However, on a yearon-year basis energy was still 15.7% more expensive, so the effect of the spring price surge has not completely disappeared.
The PCE index targeted by the Fed so far appears less comfortable; overall PCE fell by 0.1% m/m, and its annual growth slowed to 3.7% from 4.1% in May, while core PCE rose by 0.1% and was 3.3% y/y versus 3.4% a month earlier; in Q2 PCE inflation was 5.1% on an annualised basis, with core at 3.4%, reflecting the strong price impulse in April and May.
The US economy continues to grow, however individual components exhibit uneven dynamics. Real GDP increased by 1.5% on an annualised basis in Q2 after 2.1% in Q1. The slowdown is partly explained by an increase in imports and a reduction in government spending. Domestic private demand — consumption and fixed investment — by contrast accelerated to 3.9% from 1.7%.
Source: Bloomberg, Astero Falcon analytics.
Business investment supported economic activity. In the second quarter, real spending on equipment increased by 15.2% year-on-year after 15.8% in the first quarter. The rise encompassed industrial, transport and information-technology equipment. In the category of high-tech equipment and software related to AI, investment grew by almost 20% over four quarters. These investments lay the foundation for future productivity gains; however, their impact on aggregate employment may be difficult to isolate at present.
The labour market is signalling greater caution. In June the economy created only 57,000 jobs, and data for April and May were revised down in total by 74,000. Unemployment remained at 4.2%, but labour force participation fell by 0.3 percentage points to 61.5%. The number of long-term unemployed rose by 286,000 over the year, while employment in most major sectors changed little. Wages continue to grow by 3.5% year-on-year, although labour demand is gradually cooling.
Macroeconomics: Elevated Inflation Due To Rising Resource Prices 02
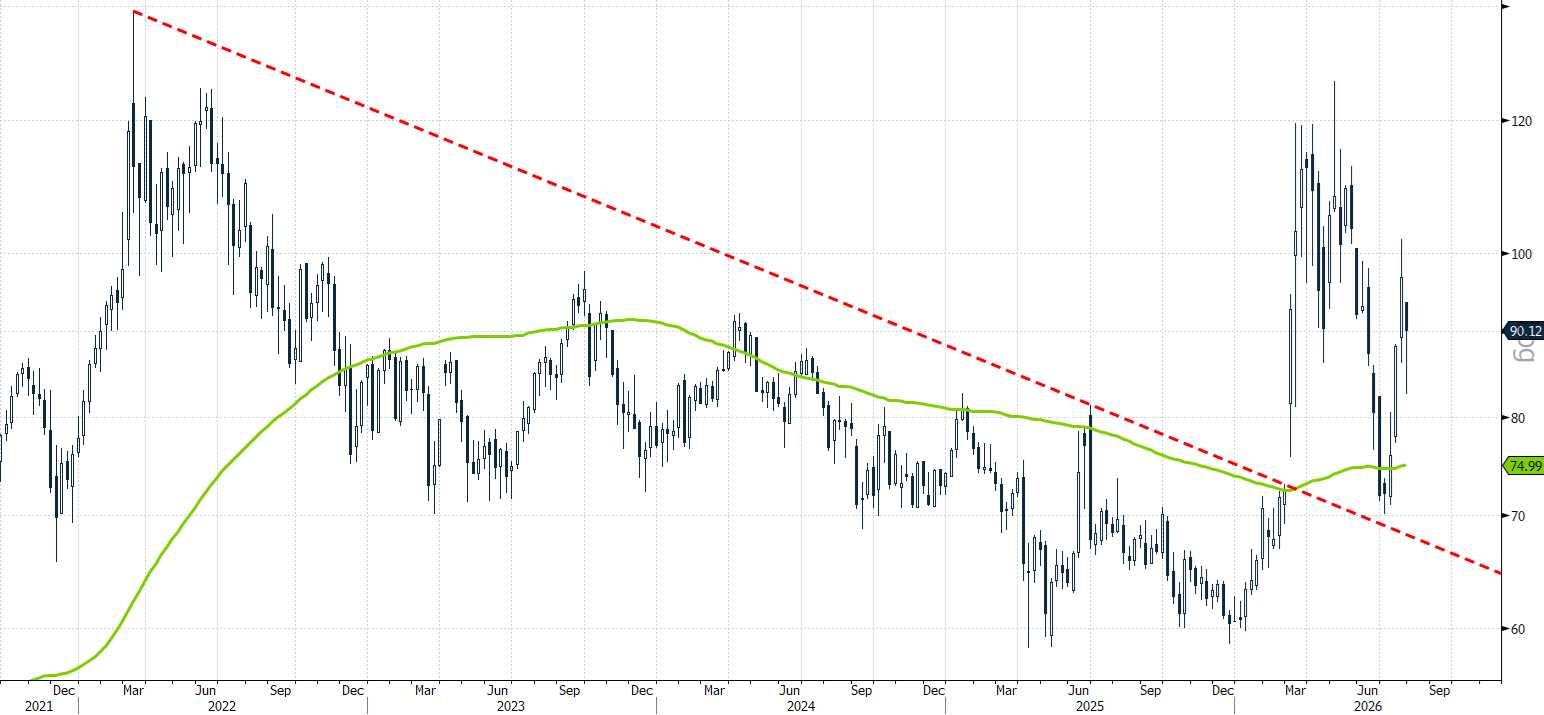
Energy prices remain a key source of inflationary pressure. After a short-term pullback from March through June, Brent crude oil has moved back towards the $100 per barrel mark and has settled above the 100week moving average, which could indicate a shift into an uptrend.
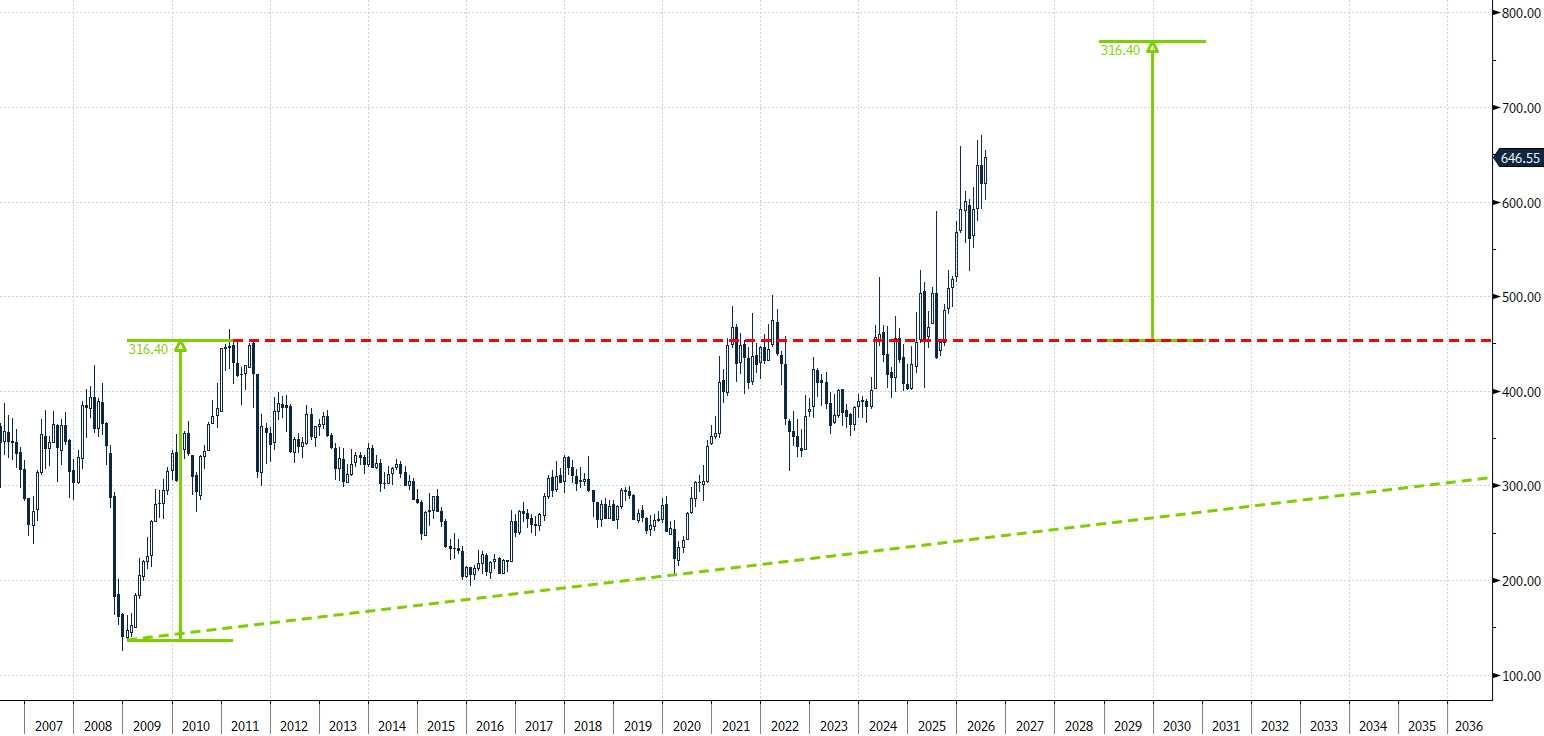
The price of copper is reaching new all-time highs, with potential to rise to $8 per pound. "Doctor Copper" points to a healthy economy with growing demand for industrial commodities, but is also creating increased inflationary pressure.
Source: Bloomberg, Astero Falcon analytics.
ICE Brent oil futures
Copper futures
Equities: Semiconductors Pulled the Market Into a Correction
Since the beginning of June, global equity markets have entered a correction, in exact accordance with the "Sell in May and go away" pattern; the peak in prices occurred on 2 June, and since then the majority of stocks have been trading sideways or declining. Rotation has continued for two months: sectors that had been growth leaders since the beginning of the year have entered a deep correction, while value stocks of "old economy" companies, by contrast, have tended to be more stable.
The leading growth sector, semiconductors, has fallen by more than 20% from its recent peak. On 10 July the South Korean company SK Hynix issued depository receipts on the Nasdaq, raising more than $26 billion, and this placement marked the peak of investor euphoria and a local peak for the entire sector.
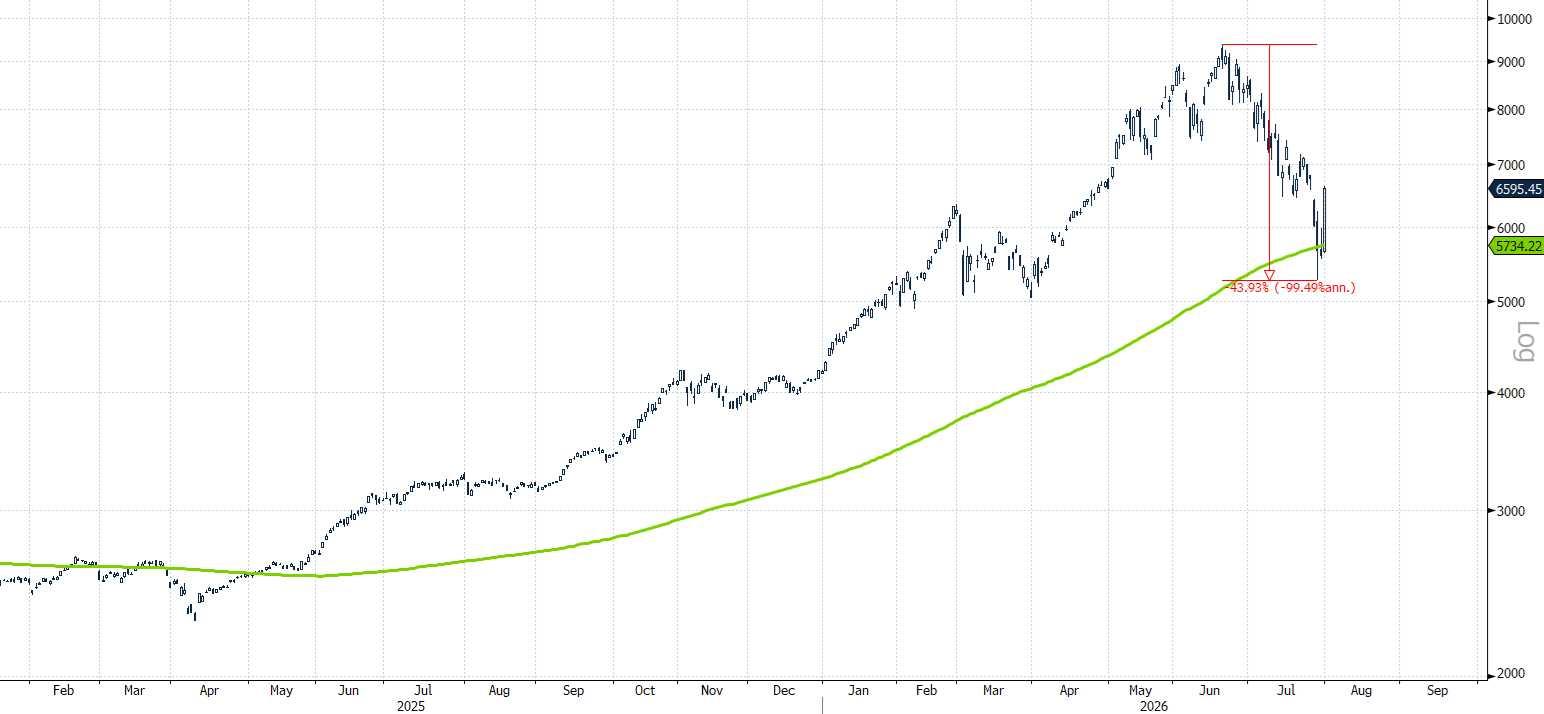
KOSPI, South Korea's equity index, in which 2 semiconductor companies (Samsung and SK Hynix) account for almost half of the total market capitalisation, fell by almost 50% in July. South Korean authorities introduced measures for emergency market stabilisation: they imposed a minimum cash deposit, limited the share of such holdings in portfolios and increased trading costs to curb speculative activity.
Source: Bloomberg, Astero Falcon analytics.
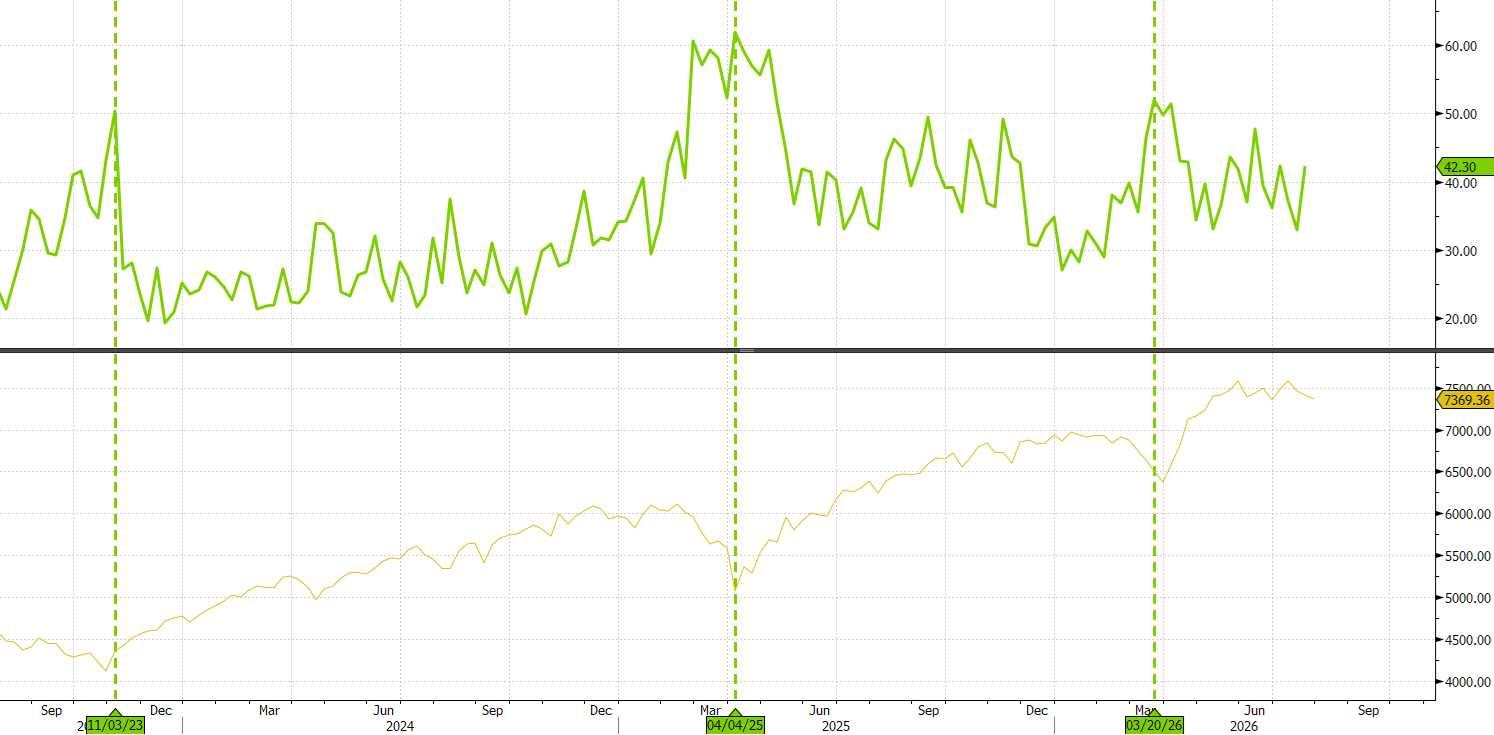
The correction in the semiconductor sector has spread to other fast-growing market segments, and by the end of July it was growth stocks that showed the largest decline, while the Nasdaq index pulled back by more than 10% from peak levels; at the same time the sharp shift in investor sentiment has led to more than 40% of portfolio managers expecting further declines in the equity market over a six-month horizon and only 29% expecting a rise — the lowest level of optimism in a year.
In the past, a similar level of pessimism has coincided with local market lows in equities. We consider that managers' pessimism is again a useful contrarian indicator and expect that the correction may be short-lived, and that current levels are attractive for increasing equity allocations in portfolios. This is also consistent with the technical picture: after a 10% decline the Nasdaq is trading only three percent from its 200day moving average, which historically has often acted as a strong level of support.
Equities: Semiconductors Pulled the Market Into a Correction
KOSPI Index
The South Korean KOSPI index found itself at the centre of a sell-off in the semiconductor market: since mid‑June prices have fallen -45%. Nevertheless, the 200-day moving average provided strong support, so technically this was merely a deep correction, and the long-term trend appears to remain bullish.
42% of portfolio managers expect that equities could be lower in six months' time. In the past, a similar level of pessimism was observed near the equity market's local low.
Source: Bloomberg, Astero Falcon analytics.
AAII Bearish Readings vs SPX Index
Bonds: Rising Yields Continue 05
At its 29 July meeting the Federal Reserve left the policy rate in the range 3,50-3,75%, but the vote was notably more hawkish than the decision itself: three of the 12 FOMC members voted for a 25 basis-point increase; the Fed noted that economic activity continues to expand at a solid pace, productivity and capital investment remain strong, employment gains are keeping pace with labour force growth, and unemployment has changed little, while inflation still exceeds the 2% target.
The Fed did not give a clear commitment on the rate trajectory, and any further decision may depend heavily on inflation and the labour market; market participants broadly agree that the rate could be raised by 0.25% by year-end — only the exact date differs, with the October meeting seen as the most likely timing, although the probability of a hike at the September meeting (16.09.2026) is estimated at 70%.
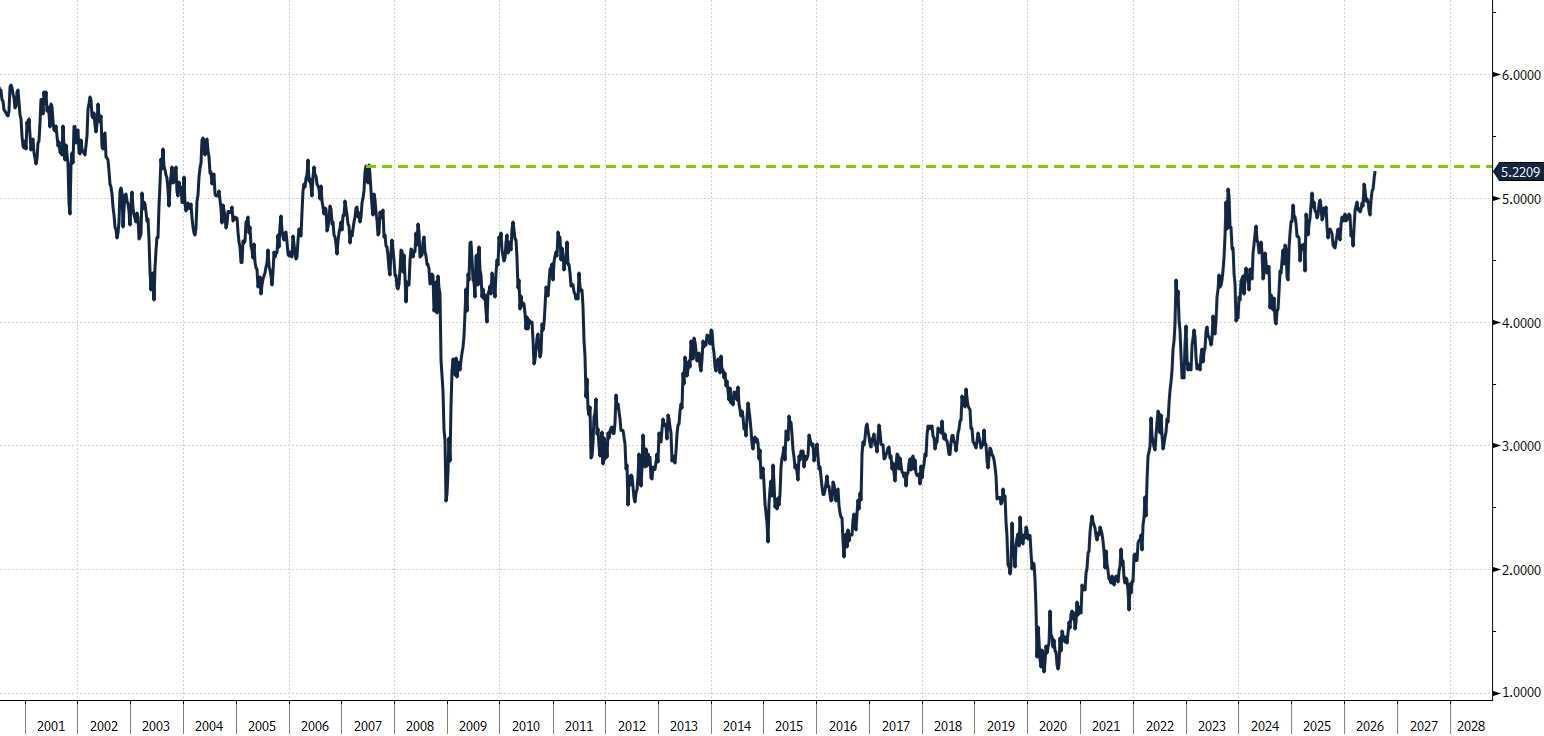
By the end of July the yield on 30-year Treasuries rose above 5% and reached its highest level since 2007. 10-year Treasuries are also approaching 5% and could rise further to 6–6.5%. Against the backdrop of rising yields, the bond market remains under pressure, with dollar-denominated investment-grade bonds (as exemplified by the iShares Investment Grade Bond ETF) showing a yearto-date return of -1.4% and having fallen more than high-yield bonds (the iShares High Yield Bond ETF is up +1.2% year-to-date, largely due to high coupons).
Credit spreads remain historically low (slightly above 1%), and our strategy remains unchanged. Investment-grade securities are unattractive, as the premium to treasuries does not compensate for the additional risk. Treasuries are attractive as a liquid alternative to deposits, and high-yield bonds as a source of absolute returns (provided the issuer's credit quality is high). Meanwhile, long-duration securities are more volatile in the current environment, so we prefer duration of up to 5 years.
BB- bonds, short duration, secured debt and companies without material refinancing risk over the next two years appear most attractive at present. In the EM corporate bond segment we favour foreign-currency issues of issuers with resilient external balances.
Source: Bloomberg, Astero Falcon analytics.
Bonds: Rising Yields Continue 06
US 30-year 5 Treasury yield
The Federal Reserve controls the level of yields on short-term Treasuries, but long-term yields are determined by market supply-and-demand dynamics; yields on long-term sovereign bonds continue to rise, which suggests a decline in demand; the yield on 30-year US government bonds has returned to peak levels not seen since 2007; French 10-year bonds yield 4%, while German yields are above 3% — the first time since the 2007 crisis.
US 10-year Treasury yield
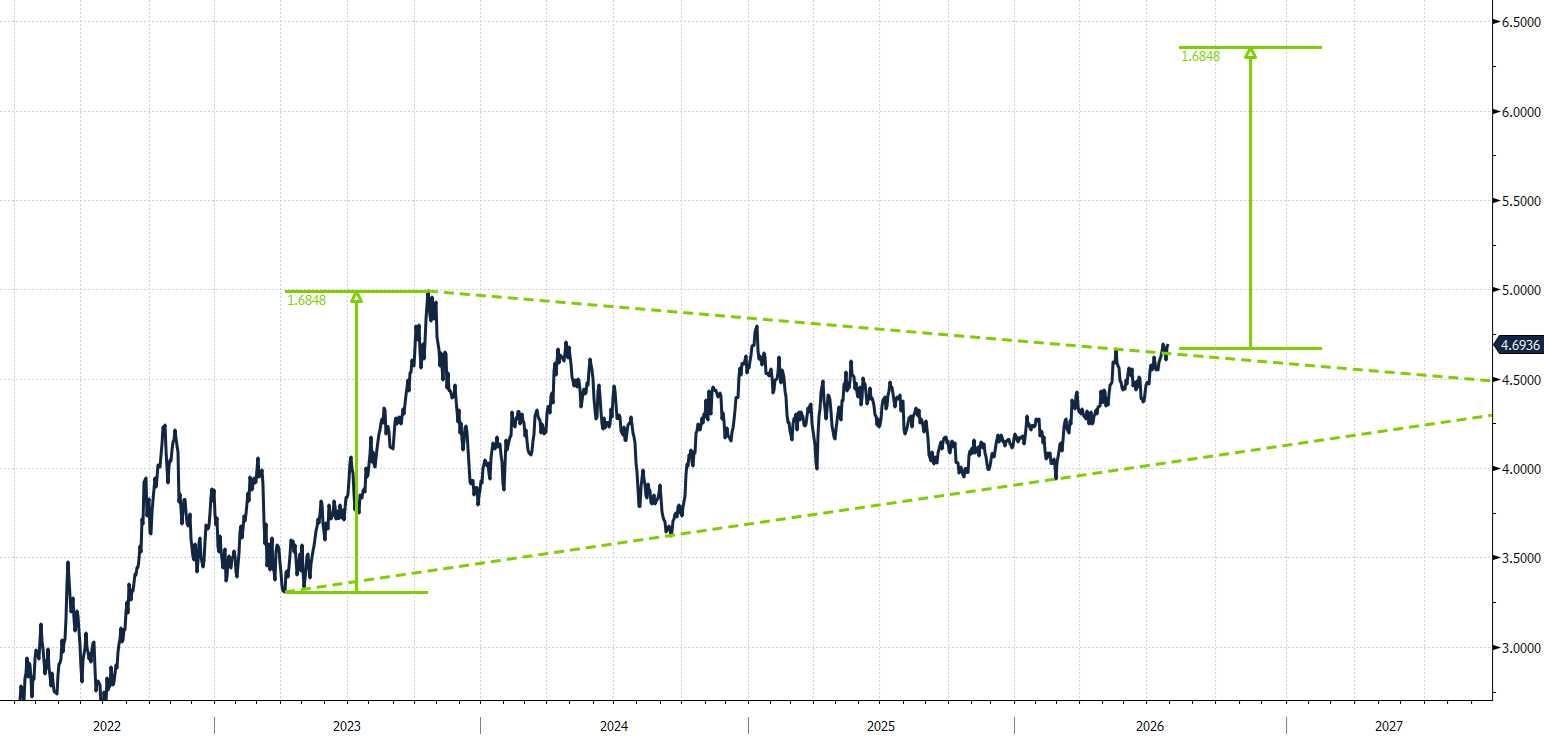
Yields on 10-year Treasuries are also continuing to rise and, from a technical analysis perspective, the target of this movement could be the 6–6.5% level.
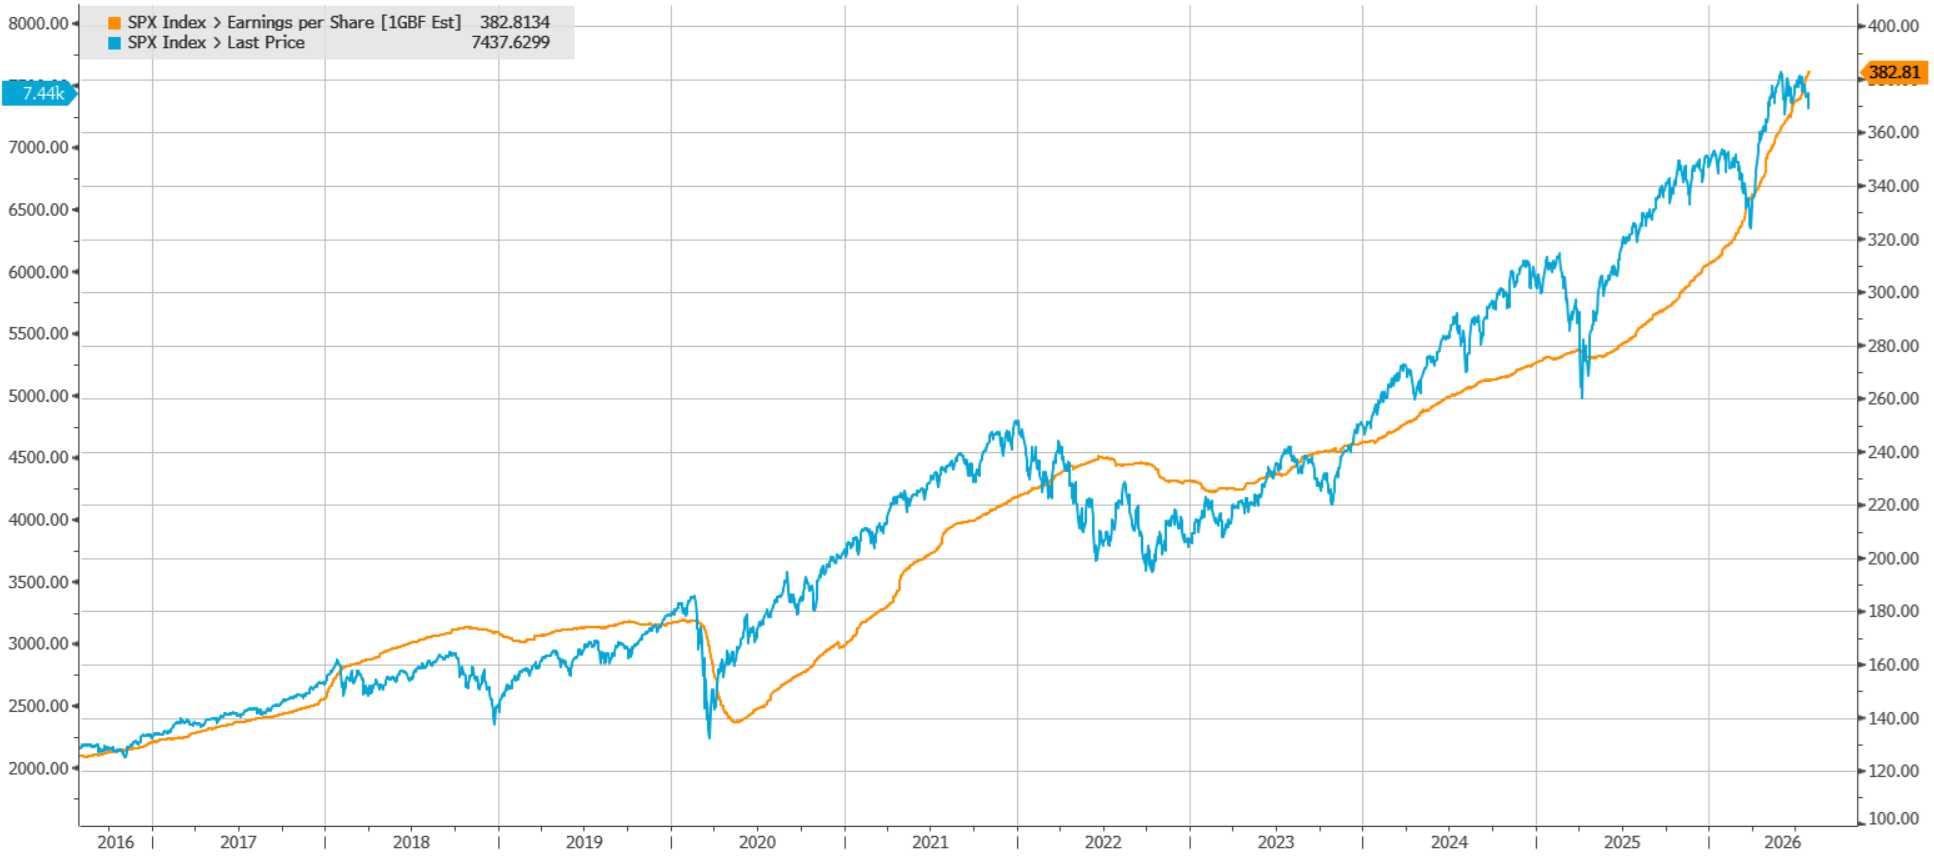
Earnings reporting season continues in the United States, and by the end of July results had been published by 4 of the top-10 largest American companies; the aggregate earnings-per-share (EPS) growth rate for the S&P 500 in the second quarter of 2026 was 38% year-on-year, which is the highest reading since the third quarter of 2021 (40%) and the second consecutive quarter with earnings growth above 20%, and this is also the seventh consecutive quarter of double-digit EPS growth.
Alphabet became the main driver of the index's earnings growth: the company reported an exceptionally large positive earnings surprise ($9.11 versus a forecast of $2.88), mainly due to the revaluation of securities. Excluding Alphabet's surprise, aggregate earnings growth of the S&P 500 would have fallen to 25.9%.
Investors closely scrutinised market leaders' results with respect to the efficiency of large capital expenditures; Meta shares fell nearly 10% due to disappointing earnings per share and a reduction in free cash flow, while Microsoft shares gained 15%: the company beat revenue and earnings expectations, and revenues from the Azure cloud service accelerated by 43% in the fourth quarter and exceeded $100 billion for the first time.
Amazon reported a record quarter with strong growth in profit and revenue. The company's revenue for the quarter was $201 billion, up 23% year-on-year, while net profit reached $63 billion — three times higher than in the second quarter of 2025. The cloud unit AWS was the key driver: its revenue increased 37% to $42 billion, and AWS operating profit rose to $16.6 billion with a margin of 40%. The company's operating profit rose 43% to $27.5 billion. Following the publication of the report, Amazon's shares rose by more than 10%.
Apple also delivered strong results: revenue growth of 17% year-on-year and profit growth of 22% year-on-year. The iPhone remains the primary source of revenue, with the service business (App Store, iCloud, Apple Music, etc.) the second-most important driver of sales. The company's gross margin improved to 49%, and operating cash flow for the quarter amounted to $28.7 billion. In light of the successful quarter, Apple announced a new $100 billion share repurchase programme and increased dividends by 4%.
The net profit margin of S&P 500 companies has reached a historic high. The aggregate net profit margin (net profit margin) in the second quarter of 2026 was 15.7%, the highest level since FactSet began tracking this measure in 2009 and above the prior record of 14.8% set in the first quarter of 2026. Alphabet's profit was a major contributor to this record: without it, the index's margin would have been 14.4%.
The forward 12-month P/E ratio for the S&P 500 stood at 20.1x, which is slightly above the 5-year (20x) and 10-year (19x) averages; analysts forecast the index's earnings could increase by 27.3% in calendar year 2026 and by 15.3% in 2027, and revenue could rise by 11.0% and 8.3% respectively.
In the long term, S&P 500 prices move in line with companies' fundamentals (revenue and earnings). At present the index trades on a forward P/E of 20x. So long as companies are able to grow their results and meet investors' expectations, such a high valuation may remain justified and the index's bullish trend could continue.
Source: Bloomberg, Astero Falcon analytics.
Alternative Investments: A Potential Bottom in Precious Metals 09
Ether and Bitcoin remain below their 200-day moving averages, which suggests a continued bearish trend. Nevertheless, we note the high relative strength of these assets: despite a deep correction in the equity market, key crypto assets behaved steadily over the summer months. Moreover, for the first time since April, Ether managed to hold above the short-term moving averages (8-, 21- and 50-day periods).
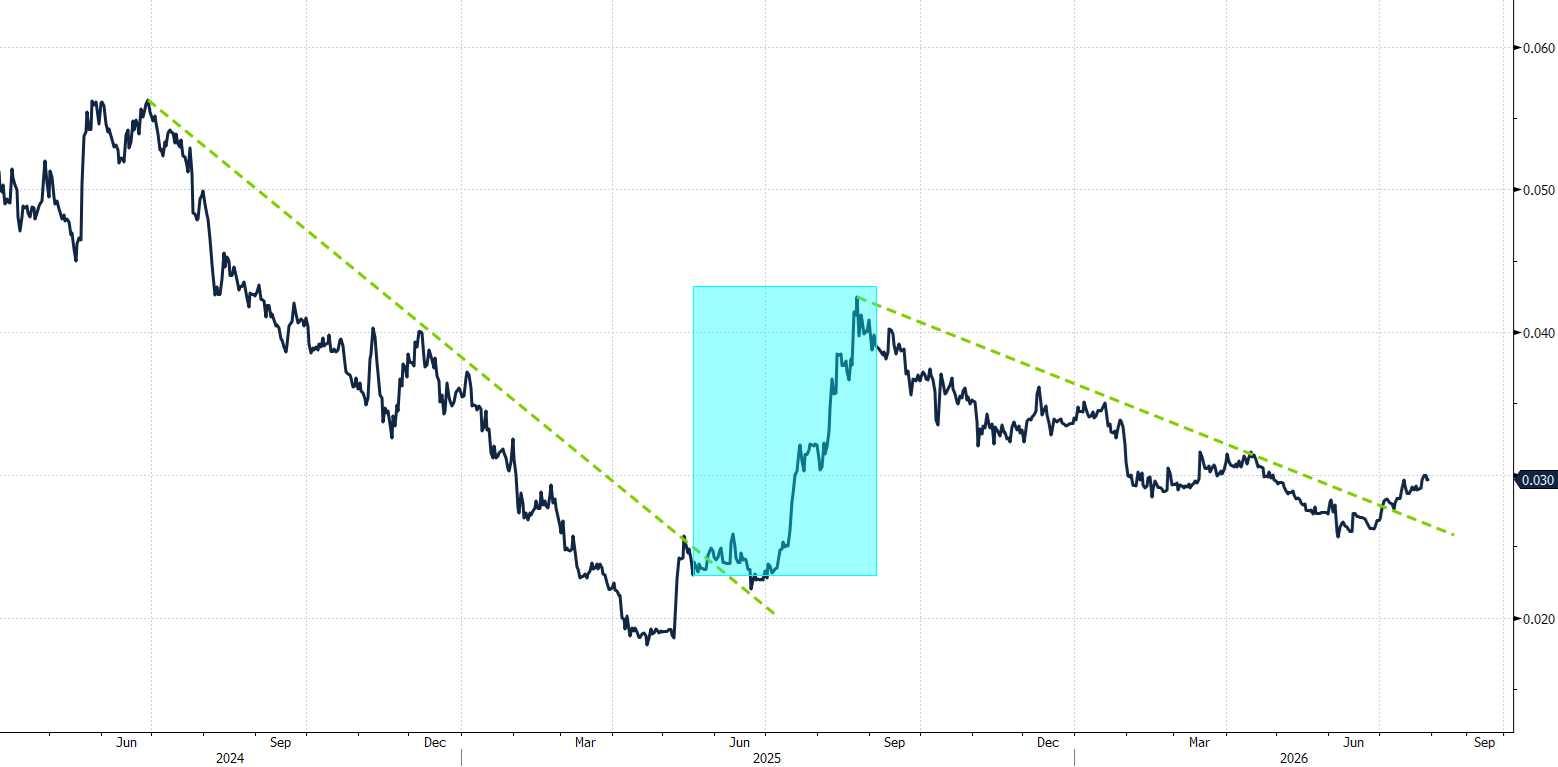
Although the 200-day moving average (at $2,200) still constitutes strong resistance, on the short timeframe Ether is showing positive momentum — both in absolute terms and relative to Bitcoin. The ETH/BTC ratio has broken the downtrend and refreshed a local high, which points to Ether's leading dynamics. The bear market has affected ETH prices more severely (-70% from peak levels) than BTC (-50% from last year's high), so the relief rally in Ether is locally stronger. The relative behaviour of ETH/BTC is reminiscent of summer 2025: then, after the downtrend broke, for 3 months ETH rose faster than BTC and gained +170% compared with BTC's +25%.
Precious metals remain in a 'sideways' trading range that is a mirror image of the 'sideways' in the dollar index; by the end of July gold remains below its 50-day moving average, which has reliably acted as a 'trend filter' for the uptrend since the beginning of 2023 and the downtrend since spring 2026; the minimum condition for a resumption of the uptrend in metals is that gold would need to establish and hold above $4,200 per ounce; the chart shows signs of rising demand (long wicks on the candles indicate buyers stepping in on dips), but so far they may be insufficient for the initiative to fully shift to the bulls.
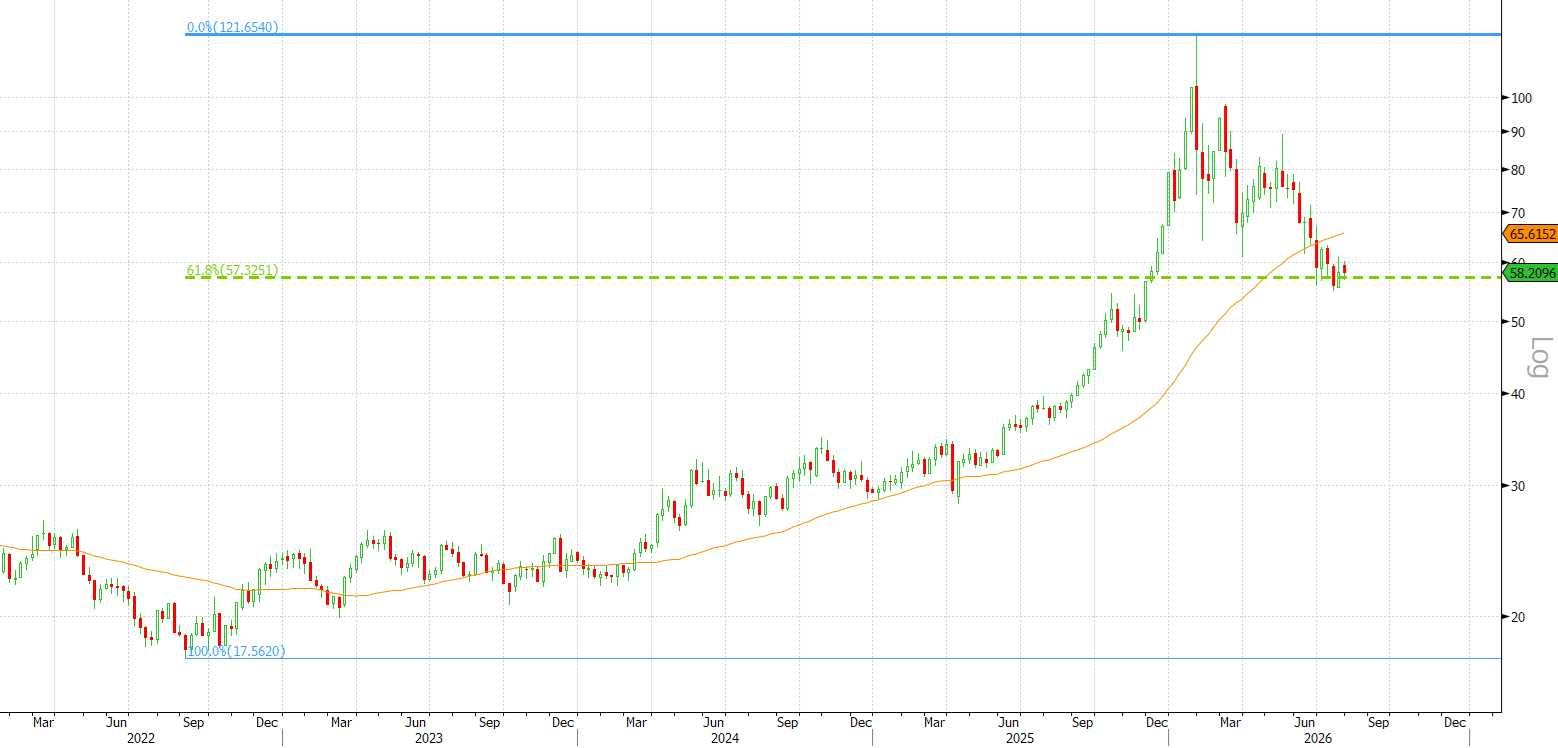
In silver, the situation is similar: for prices to resume their rise, they may need to hold above $65 per ounce. At the same time, the $57 level, corresponding to the 61.8% Fibonacci retracement of the entire move from 2022 to 2026, has held — we view this as a strong positive signal that a bottom could be forming at current levels.
Since May this year Ether has exhibited outperformance relative to bitcoin, and by analogy with 2025 we consider there could be scope for a faster recovery of ETH relative to the benchmark, as a result of ETH reaching more oversold levels during the preceding months.
Source: Bloomberg, Astero Falcon analytics.
ETH / BTC
Alternative Investments: A Potential Bottom in Precious Metals
XAG / USD
Silver managed to hold at the key 61.8% Fibonacci level. The price of $57 per ounce could become a longterm bottom and the end of the 6-month correction.
Source: Bloomberg, Astero Falcon analytics.
Direct Investments: Market Operates, But Only for Large Deals 11
According to Valuation Research, in the first quarter of 2026 the volume of transactions involving private investment funds in the US amounted to $260.2 billion, which on an annualised basis is $1.04 trillion: a recovery compared with 2023, but still below 2025 ($1.19 trillion) and 2021 ($1.27 trillion). This composition explains a more cautious cycle: add-ons constituted 58.6% of total deals in the first quarter, buyout/LBO transactions were 18.2%, and growth or expansion investments were 23.2%.
According to Valuation Research, as of June the amount of dry powder in US private equity funds stands at $1.13 trillion, and globally at $2.42 trillion, while Aranca recorded a 57% increase in capital raised by PE funds versus the previous quarter, to $137 billion in the second quarter; however, according to EY, dividend distributions amount to around 15% of net asset value compared with the typical 20–25%, and 35% of the global private equity portfolio has been held for more than six years, and this gap explains why fundraising is concentrated in the hands of established managers even when capital is available: investors are effectively guaranteeing a manager’s ability to return cash rather than merely to deploy it; thus the question of capital allocation is whether a given fund can convert companies’ operational progress into real value in today’s financing and buyer environment, and a large stock of dry powder represents an opportunity only when the path to exit is at least as convincing as the entry scenario.
Aranca recorded 329 global exits from investments in the private equity sector in the second quarter, of which 152, or 46%, were strategic acquisitions; secondary buyouts and IPOs accounted for 46 and 48 exits respectively. The overall situation in the mergers and acquisitions market is also mixed: VRC reports that deal activity in North America in June was 52.3% lower than in January, while the value of corporate mergers and acquisitions in North and South America rose 71% year-to-date to $1.53 trillion.
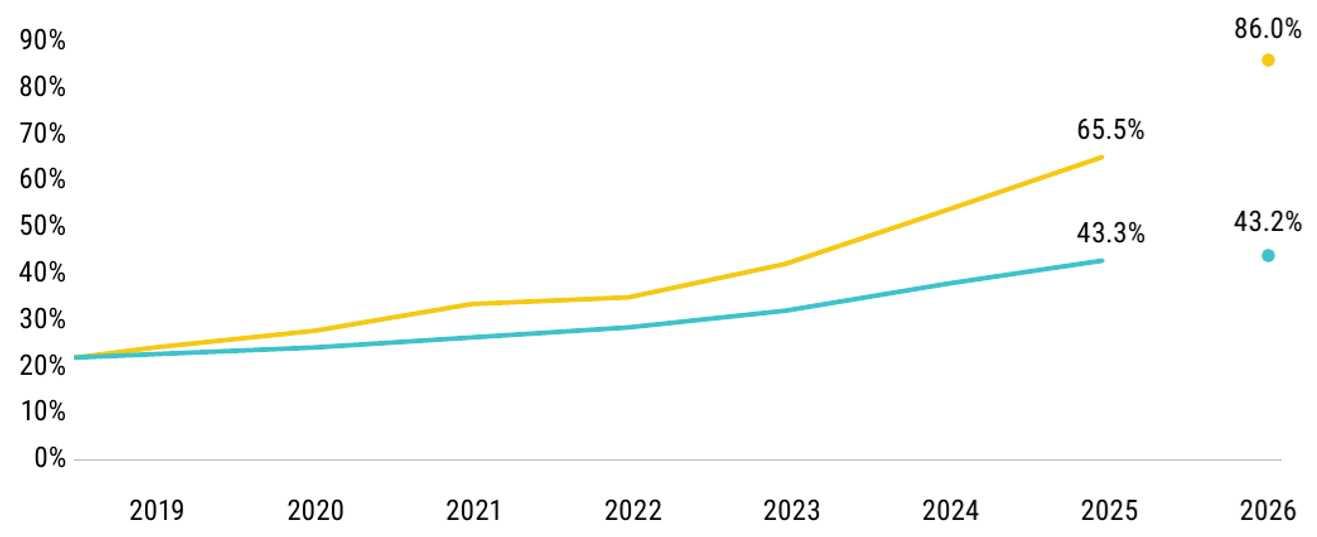
According to PitchBook‑NVCA, venture capital deal volume in the US in the first half of the year amounted to $412.7 billion, with rounds of $100 million and above accounting for 87.5% of invested capital; artificial intelligence accounted for 86.0% of total deal volume but only 43.2% of the total number of deals, and this gap is more significant than the claimed market recovery; the market is demonstrating record investment volumes, with opportunities unevenly distributed across stages, sectors and management firms; investors should distinguish between investments in a small group of leaders in artificial intelligence and investments in the venture asset class as a whole.
Large venture firms attracted $64.5 billion in the first half of the year versus $7.9 billion for emerging firms and accounted for 89% of capital in the PitchBook‑NVCA sample; new funds raised only $3.4 billion across 53 funds, which, on a yearon-year basis, is the lowest figure since 2016; as with PE, capital flows are concentrated among more mature managers.
Source: Bloomberg, Astero Falcon analytics.
Direct Investments: Market Operates, But Only for Large Deals
AI Share of deal value orange and share of deal count blue
Deal Concentration Continues to Rise: Artificial Intelligence Accounted for 43% of Total Deals and 86% of Total Volume
This document has been prepared and issued by Astero Falcon (DIFC) Limited ("Astero Falcon"), a company incorporated in the Dubai International Financial Centre ("DIFC"), authorised and regulated by the Dubai Financial Services Authority ("DFSA") under DFSA Firm Reference Number F010362.
Astero Falcon is authorised by the DFSA to carry on the Financial Services of Managing Assets, Advising on Financial Products, Arranging Deals in Investments and Arranging Custody, subject to the scope of its DFSA licence.
This document constitutes a Financial Promotion for the purposes of the DFSA Rulebook and is directed exclusively at Professional Clients and/or Market Counterparties, as defined in the DFSA Conduct of Business ("COB") Module.
It is not intended for Retail Clients and must not be distributed to, relied upon by, or acted upon by any person who does not meet the applicable DFSA client classification criteria. Any person who is not a Professional Client or Market Counterparty should disregard this document immediately.
The information contained in this publication is provided solely for general market commentary, information and discussion purposes. It does not constitute: investment advice; investment research; a personal recommendation; an offer or invitation to buy or sell any financial instrument; a solicitation to enter into any investment transaction; an arrangement in relation to investments; or any other regulated Financial Service under the DFSA Rulebook.
This publication has not been prepared in accordance with the legal and regulatory requirements designed to promote the independence of Investment Research and should not be regarded as Investment Research under the DFSA Conduct of Business Module.
Any references to "Astero Falcon", "we", "our", or similar expressions represent the Firm's market views and opinions as at the publication date only. Such views are based upon information available at that time and may change without notice. They should not be interpreted as investment advice, a recommendation, or a representation that any particular investment strategy or financial instrument is suitable for any recipient.
Any forecasts, estimates, targets, projections, expectations, opinions, or forward-looking statements contained in this publication are based on assumptions and current market conditions which may prove to be inaccurate. Actual events or market outcomes may differ materially. No representation, warranty or assurance is given that any forecast, projection, target or expected outcome will be achieved.
Any references to historical performance, market trends or statistical information are provided solely for illustrative purposes. Past performance is not a reliable indicator of future results, and future performance cannot be guaranteed. The value of investments and any income derived from them may rise or fall, and investors may lose some or all of their invested capital.
This publication has been prepared without taking into account any recipient's individual investment objectives, financial situation, risk tolerance, tax status or particular needs. Before making any investment decision, recipients should undertake their own independent assessment and obtain independent legal, tax, accounting and financial advice where appropriate.
Investing in financial markets involves risks, including but not limited to:
market risk; liquidity risk; credit and counterparty risk; foreign exchange risk; interest rate risk; operational risk; geopolitical and regulatory risk; and partial or total loss of invested capital.
Digital Assets / Virtual Assets
Any references to cryptocurrencies, digital assets, virtual assets, crypto tokens or blockchain-related products are included solely as part of general market commentary.
Unless expressly authorised under applicable DFSA legislation, Astero Falcon does not provide regulated Financial Services relating to such assets. These assets may not be regulated by the DFSA and may be subject to extreme volatility, reduced liquidity, cyber security risks, technological failures, valuation uncertainty, market abuse and a significant risk of financial loss.
Information contained in this publication has been obtained from sources believed to be reliable, including Bloomberg and other third-party market data providers, together with Astero Falcon's internal analysis. However, Astero Falcon does not warrant or guarantee the accuracy, completeness, reliability or timeliness of such information and accepts no liability for any loss arising directly or indirectly from reliance upon this publication.
Astero Falcon, its directors, officers, employees, affiliates or clients may hold positions or have interests in the financial instruments, securities or markets referred to in this publication and may buy or sell such investments from time to time, subject to applicable laws, regulations and the Firm's Conflicts of Interest Policy.
Any potential engagement with Astero Falcon or the provision of Financial Services remains subject to:
compliance with applicable DFSA legislation;
internal approval processes;
client classification requirements;
Know Your Customer (KYC) and Customer Due Diligence requirements;
Anti-Money Laundering, Counter-Terrorist Financing, sanctions and proliferation financing controls; and
execution of appropriate legal documentation.
Distribution of this publication may be restricted by the laws or regulations of certain jurisdictions. Persons into whose possession this publication comes are responsible for informing themselves about, and complying with, all applicable legal and regulatory requirements.
No part of this publication may be reproduced, copied, transmitted, distributed or published, in whole or in part, without the prior written consent of Astero Falcon, except where permitted by applicable law.
Astero Falcon (DIFC) Limited
Office 33, Level 7, Gate Village 10, Dubai International Financial Centre, Dubai, United Arab Emirates