Global Markets: Risk Aversion Amid Escalation in Iran
Equities: The March Sell-Off
Bonds: Rising Yields and Spreads
Currencies: The US Dollar – Key to Risk Asset Behaviour
Alternative Investments: An Attempt at Stabilisation
Direct Investments: Decline in Quality of
Global Markets: Risk Aversion Amid Escalation in Iran 01
March was marked by the military escalation in the Middle East. On 28 February, the US and Israel struck Iran, to which Iran responded by attacking targets in Israel and eight Arab countries allied with the US in the region. Perhaps the most significant asymmetric response from Iran was the closure of the Strait of Hormuz, through which up to one-third of global oil traffic passes.
In addition to military bases in the region, Iran also attacked a number of civilian and energy facilities. In particular, the CEO of QatarEnergy stated that the Iranian attacks disabled 17% of Qatar’s liquefied natural gas (LNG) export capacity, resulting in an estimated loss of approximately $20 billion in annual revenue.
Amid the closure of the Strait of Hormuz, oil prices surged sharply, triggering an oil and gas crisis in many countries across Asia and Europe. The market price of light crude reached up to $120, nearly doubling compared to the end of February. The uncontrolled rise in oil prices threatens a global economic crisis, but it impacts oilimporting countries and those in close proximity to the military conflict most severely.
The primary concern among investors at present is that the surge in oil prices may trigger a cascade of inflation alongside a simultaneous decline in consumption. Oil and its derivatives play a significant role in industry, serving not only as fuel but also as raw materials for numerous sectors including the chemical industry, materials manufacturing, construction, engineering, pharmaceuticals, and others.
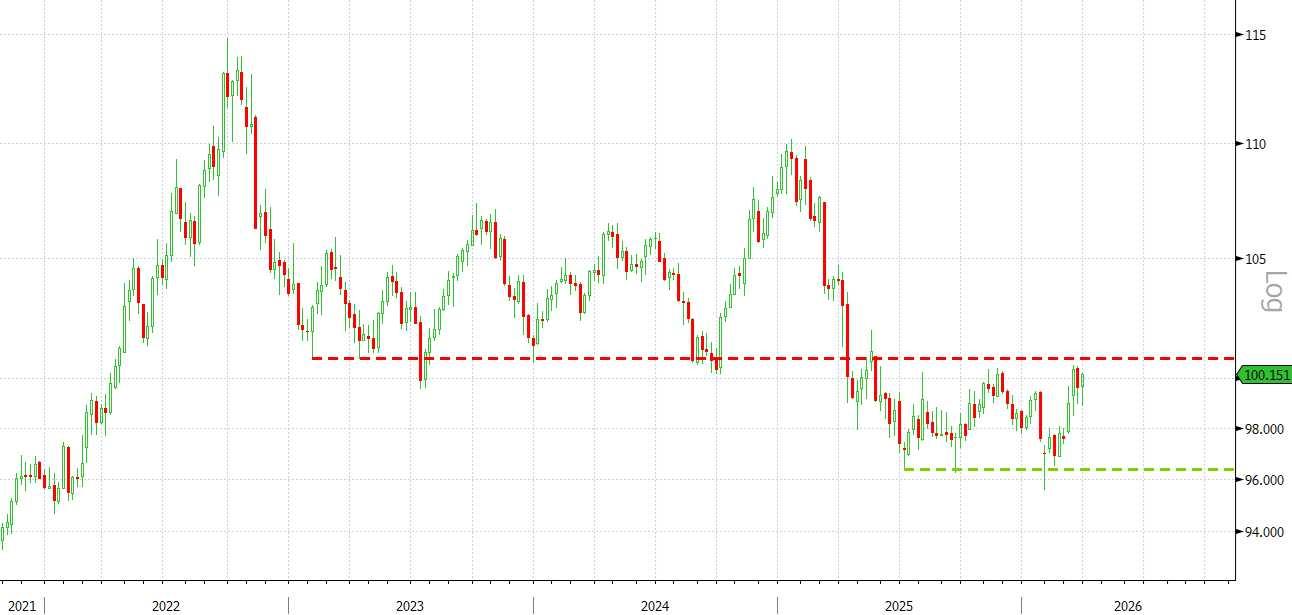
US Dollar Index
Asian and European countries are the most vulnerable to disruptions in oil supply. Already in March, several Asian countries were forced to impose restrictions on the volume of petrol sales, and the protracted conflict also threatens a food crisis, as rising prices and a shortage of fertilisers put the upcoming sowing season in key regions (notably India) at risk of failure.
The prolonged conflict in the Middle East may also impact the political landscape: the US midterm elections are scheduled for late 2026, and an unsuccessful military operation could alter the current balance of power, notably strengthening the Democrats.
The primary beneficiary of the escalation in the Middle East has undoubtedly been the US dollar, as the most liquid and secure asset. The strengthening of the dollar has reflected global uncertainty and the flight to safety: the appreciation of the US currency coincided with declines across the entire spectrum of risk assets (equities, crypto, precious metals, and other currencies).
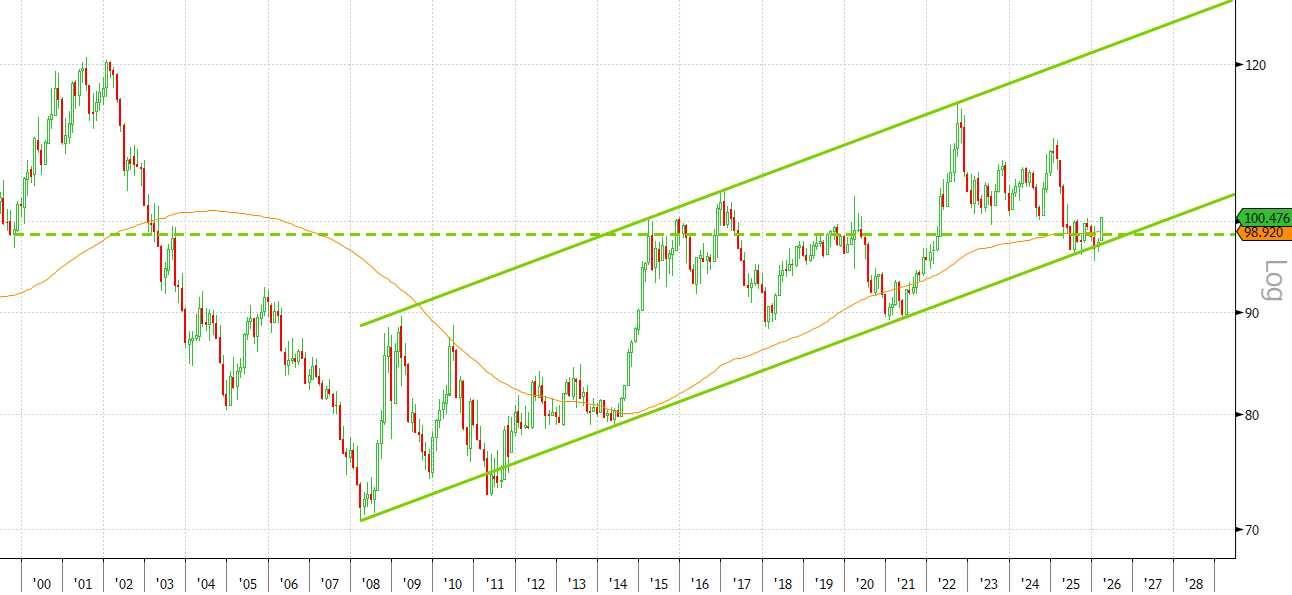
The US dollar was the only stable asset in March. The conflict in the Middle East made the US dollar the safe haven currency (both politically and economically), leading to a rise in the dollar amid a widespread risk-off sentiment among investors. A break above the 101 level could pave the way for further dollar appreciation.
Source: Bloomberg, Astero Falcon analytics.
Equities: The March Sell-Off 02
Since the beginning of the year, key global equity indices have already reached correction territory with drawdowns of more than -10%, most of having occurred in March. In just one month, the S&P 500 index fell by -8%, while the UK FTSE 100, German DAX, and pan-European Eurostoxx 50 declined by more than -10%.
In the event of oil supply disruptions, the regions importing raw materials are the most vulnerable –primarily including countries in Europe and Asia (China, South Korea, India). In March, the equity indices of these regions declined more sharply than the US stock market – and simultaneously, their currencies also depreciated, resulting in a double whammy in US dollar terms.
Within the S&P 500, the only sector that showed a positive result in March was Energy, with a performance of +14%, while the worst-performing sector since the beginning of the year is Consumer Cyclicals (-12.5%).
The VIX volatility index remained elevated around 25-30 throughout March, the CNN Fear and Greed index closed the month at 10 (Extreme Fear), and according to the AAII survey, more than half of retail investors are bearish. All of this creates favourable conditions for an imminent relief rally. In April, the next earnings season begins in the US – it may become a source of positivity for the market.
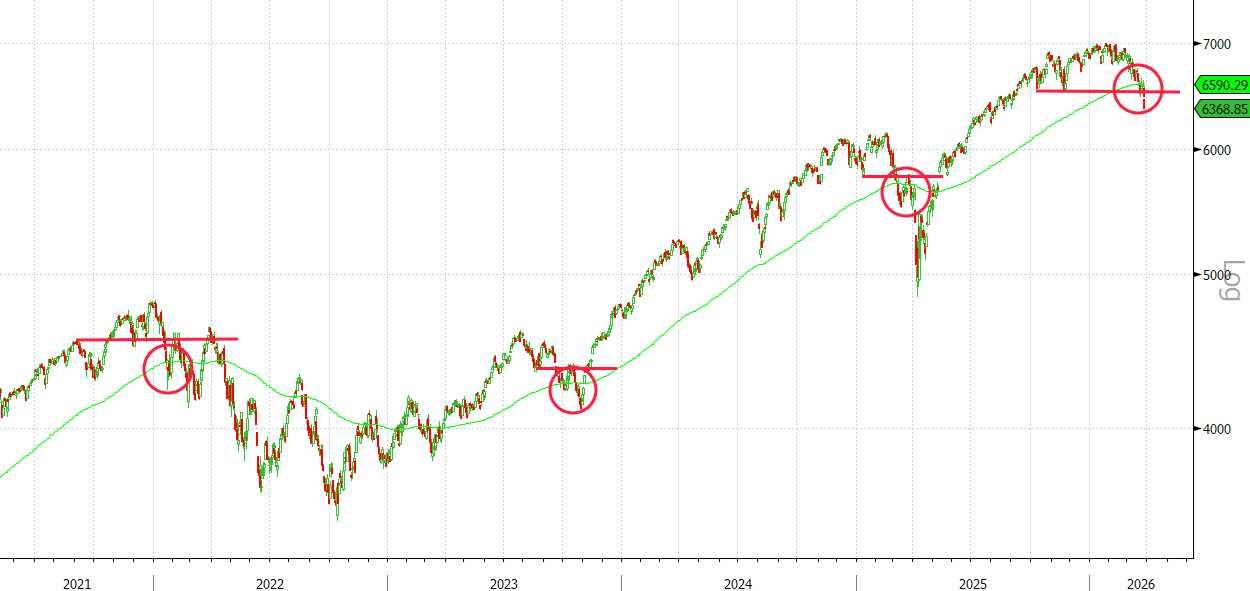
From a technical standpoint, the S&P 500 closed below its 200-day moving average for the first time since April 2025. A key signal for us will be the behaviour of the indices following the likely April rebound: whether they can sustain levels above the 200-MA and overcome the horizontal support, which has now turned into resistance (as indicated on the chart). In October 2023, the index spent only one week below the 200-MA, and a swift rebound negated the negative signal. In spring 2025, the index returned above the 200-MA on the second attempt, amid verbal interventions by Trump. This time, de-escalation will require Iran’s willingness to engage in negotiations, which is not yet evident. Therefore, after the probable rebound during the spring months, we plan to reduce equity exposure and increase the share of defensive instruments.
For the fourth time since 2021, the S&P 500 index has breached the 200-day moving average. Two of the previous three signals did not lead to a bear market, but in 2022 the signal correctly indicated further market weakness. The determining factor in April and May will be the market's retest of the 200-MA level.
Source: Bloomberg, Astero Falcon analytics.
S&P 500 Index
Equities: The March Sell-Off 03
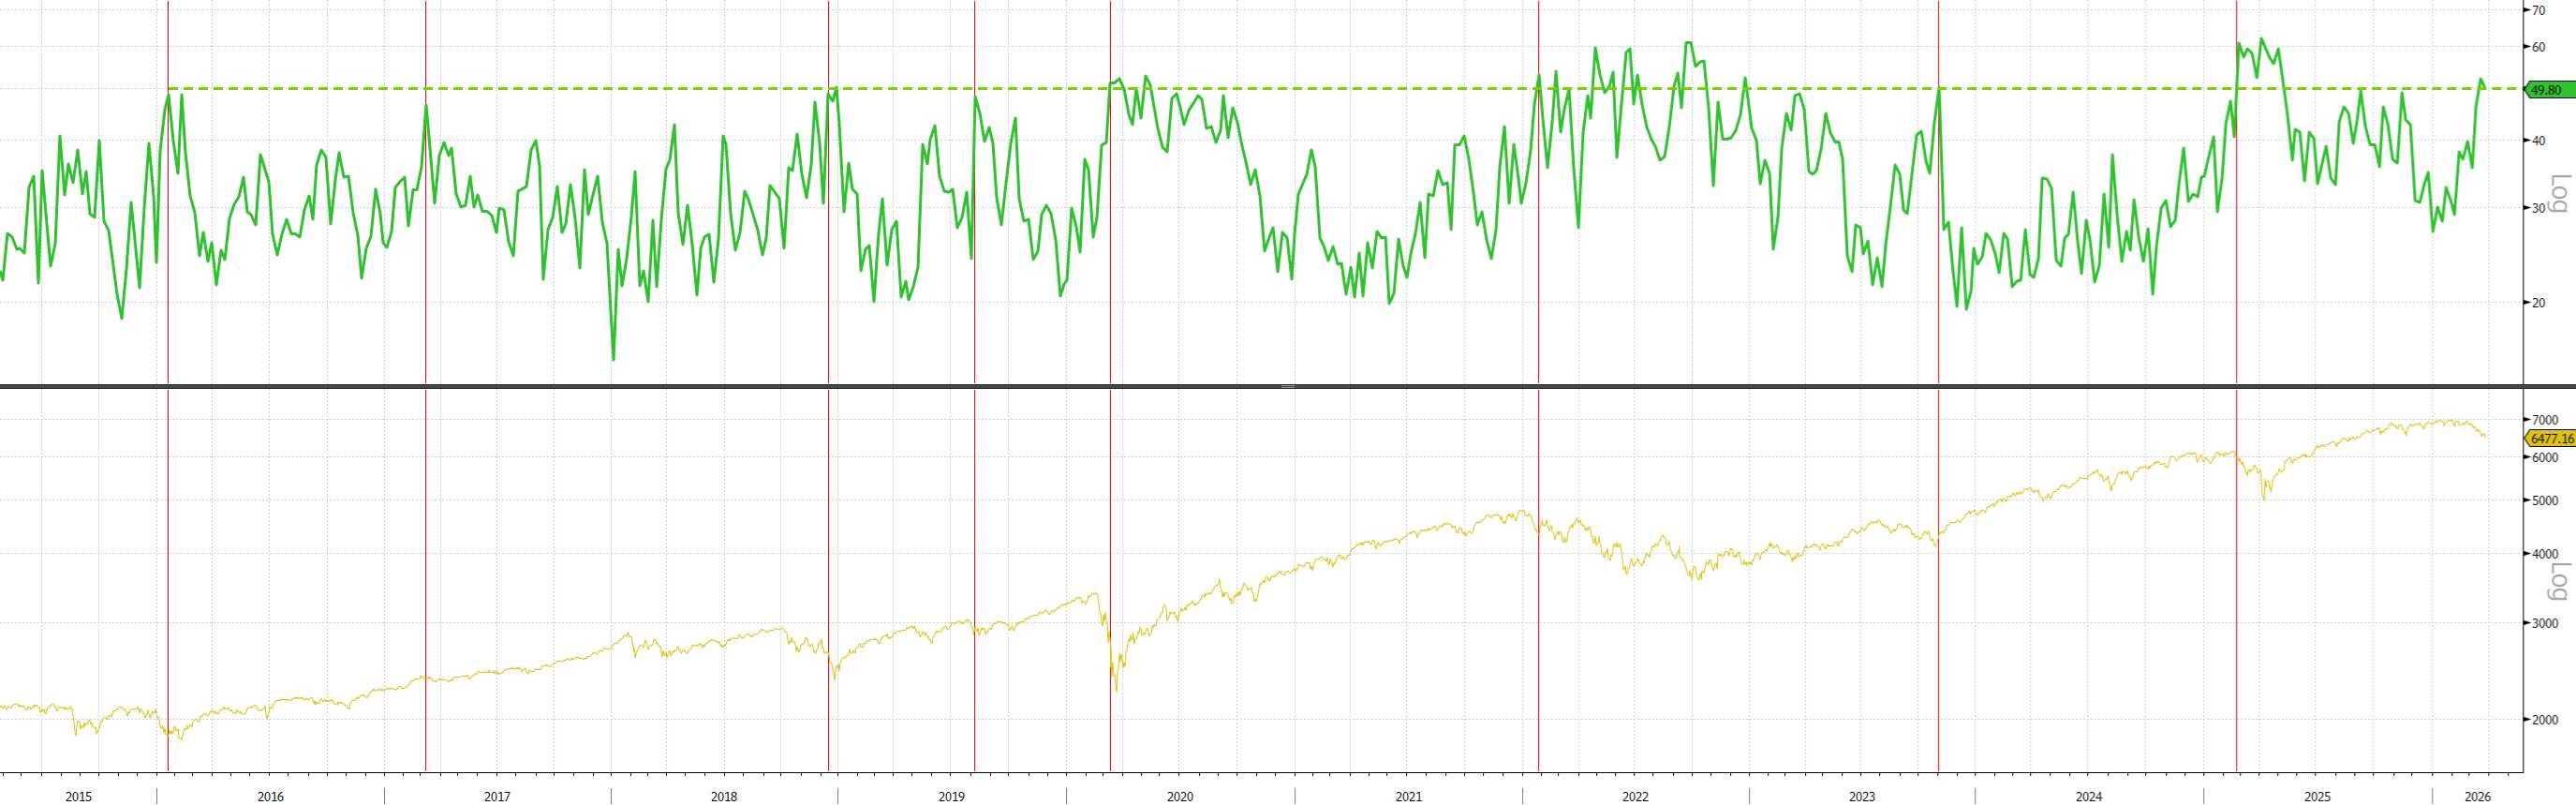
AAII Percentage of Bearish Retail Investors vs S&P 500
Based on past episodes of market volatility, instances when more than half of retail investors expect a further market decline typically occurred closer to the end of the correction and triggered at least a shortterm relief rally in equities.
Source: Bloomberg, Astero Falcon analytics.
Bonds: Rising Yields and Spreads 04
The global bond market is concluding Q1 2026 in significantly tighter conditions than the consensus had anticipated. The Bloomberg Global Aggregate Index, which had risen by +2.06% as of 27 February, had given back all of its gains by the first ten days of March. The cause, as with other asset classes, was an external shock – military strikes on Iran, Tehran’s closure of the Strait of Hormuz, and the market’s rapid reassessment over just a few days of the interest rate trajectories of all major central banks.
The closure of a key oil artery became an inflationary shock, radically altering bond market behaviour amid deteriorating geopolitical conditions (unlike the deflationary nature of the 2008 financial stress). The standard market reaction to geopolitical escalation involves a flight to quality: investors move into government securities, yields decline, and curves flatten. In March 2026, the opposite scenario unfolded: the conflict in Iran represented a supply shock with pronounced second-order inflationary effects — to which the market responded by selling long-dated bonds.
Amid accelerating inflation, central banks will be compelled to raise rates. As of early March, investors on average expected that the ECB and the SNB would not revise their key rates until the end of the year, while the Bank of England and the US Federal Reserve would cut rates twice by December 2026. By the end of the month, expectations were sharply adjusted – the current consensus now anticipates that the ECB and the Bank of England will implement as many as three rate hikes by the end of the year, while the US Federal Reserve will take a prolonged pause, leaving the key rate unchanged until the year-end at a minimum.
As a result, sovereign bonds of Western countries have reached multi-year highs in yields. The British market deserves particular attention. The yield on 10-year gilts reached 4.942% on 19–20 March — the highest level since July 2008. Over 15 trading sessions since the beginning of the conflict, the yield increased by 68 bp, and the scale of the movement is not only due to oil. In February 2026, the UK government budget deficit reached £14.3 billion compared to £12.1 billion a year earlier, nearly twice exceeding the market forecast — the second largest February figure in history.
Credit spreads in corporate bonds have also increased since the beginning of the year: by +20 bp (to 1.15%) in BBB bonds and by 60 bp (to 3%) in US dollar high yield bonds.
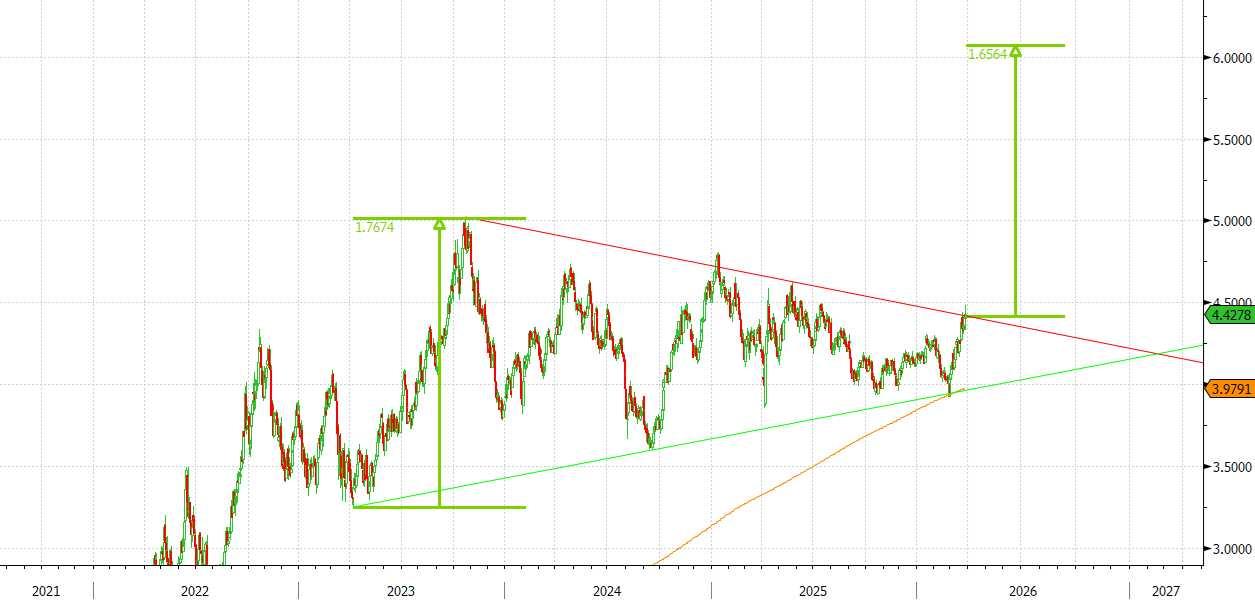
Technical analysis confirms the signal from the fundamental picture. In March, the yield on 10year Treasuries reached 4.5%, surpassing the previous local peak of 4.3% in January 2026. Since 2023, a symmetrical triangle has formed, and yields are one step away from a breakout upwards. In this case, the target movement would be a yield of 5.5%-6% on 10-year Treasuries, which aligns with the dominant inflationary scenario.
Thus, we observe the realisation of the main risk for G7 sovereign debt, which we discussed in the annual review: an increase in the size of government debt (both in absolute terms and as a percentage of GDP) alongside rising yields (the cost of servicing it). In our view, sovereign bonds and IG bonds are not an attractive asset class for this year – in the event of rising yields, their prices will continue to decline, and credit risks are underestimated.
Source: Bloomberg, Astero Falcon analytics.
Bonds: Rising Yields and Spreads
US 10-year Treasury Yield
Sovereign debt of G7 countries has reached multi-year highs in yields. In particular, the yield on 10-year Treasuries has reached 4.5% and is attempting to break upwards from a 3-year consolidation. We consider it likely that the yield on these securities will rise to 5.5%-6% as a result of an inflation shock. A similar situation is observed in government bonds of other leading Western countries.
US Dollar Index (monthly)
On the monthly timeframe, the strengthening of the US dollar coincided with the 100-period moving average and horizontal support at the 100 level. Given the significance of these levels, further appreciation of the dollar appears more likely.
Source: Bloomberg, Astero Falcon analytics.
Currencies: The US Dollar – Key to Risk Asset Behaviour
Against the backdrop of geopolitical escalation in the Middle East, the asset that held up the best was the US dollar. Unlike previous episodes of global tension, this time even US Treasuries did not serve as a safe haven.
In January, the dollar declined due to momentum from the previous year, but February marked a turn and by the end of March, the dollar index reached long-term resistance (DXY at the level of 101). If this level is breached upwards, it could pave the way for further dollar appreciation of 4%-5% from current levels. Dollar strengthening is typically a headwind for risk assets.
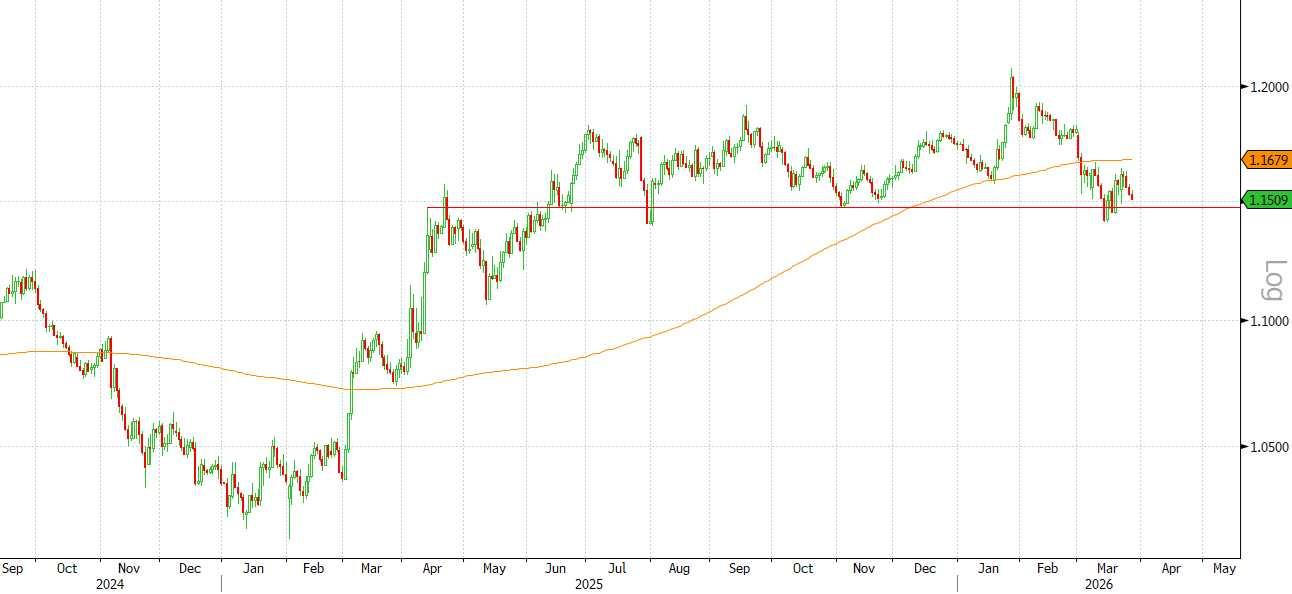
The same picture, but in a mirror-opposite form, is observed in the EUR/USD pair, which constitutes about 60% of the currency basket within the DXY. In early March, the euro closed below the 200-day moving average for the first time in 2 years, then tested it from below but failed to reclaim this level, which has now turned from support into resistance. Although the EUR/USD pair is still trading within the 1.15-1.18 range, a close below the 200-DMA significantly differentiates the situation from last year and makes a scenario of euro weakening more probable.
EUR / USD
The primary factors behind the strengthening of the dollar have been the economic self-sufficiency of the United States, including in terms of energy resources. As we noted in our previous reports, the struggle for energy resources is one of the main vectors of the current realignment of spheres of influence. The US is the undisputed global leader in oil production and is actively competing for new markets through military operations near other major producers (Russia since 2022 and Saudi Arabia since this year), rendering supplies from these regions politically and economically unfeasible.
Conflicts in Europe and the Middle East are literally making the US a safe haven for global capital.
The euro traded below its 200-day moving average throughout March, marking a significant paradigm shift compared to last year. Although support at the 1.15 level has not yet been breached, the 200-DMA line has turned from support into resistance, making further euro weakness the most probable outcome.
Source: Bloomberg, Astero Falcon analytics.
Alternative Investments: An Attempt at Stabilisation 07
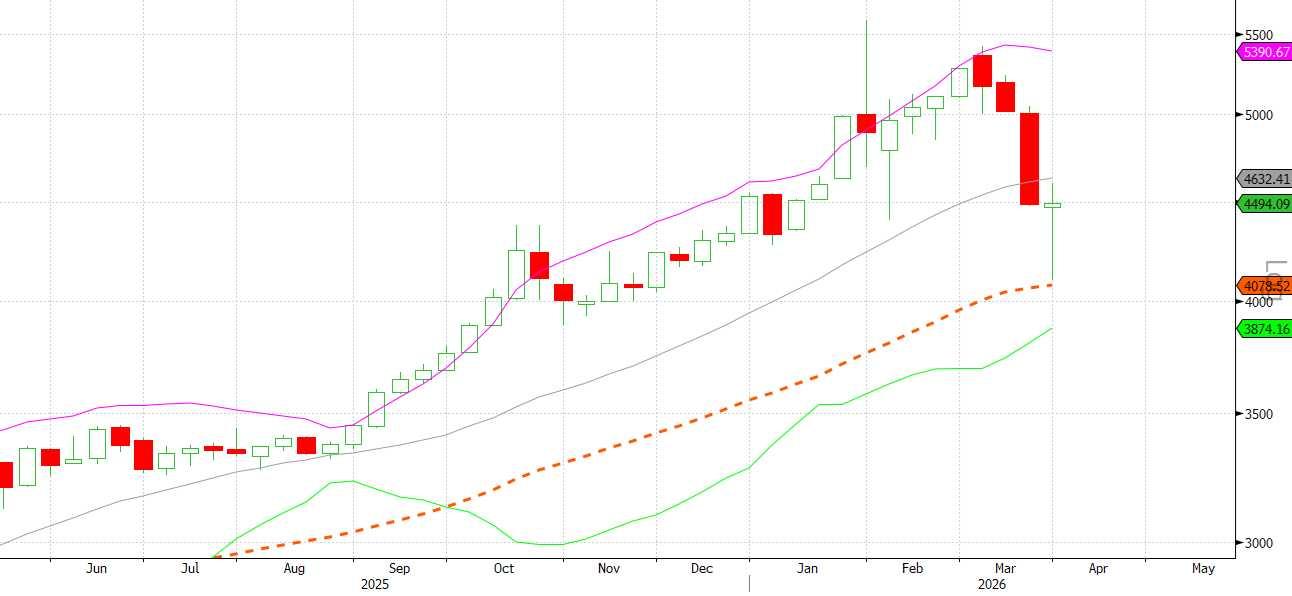
The correction in metals continued in March. Over the course of the month, the price of gold fell by -15%, and silver by -25%. Nevertheless, on the weekly chart, gold showed signs of stabilisation: the metal tested the 50-week moving average and rebounded strongly from this support. Moreover, in the last week of March, the metal opened with a sharp decline but closed the week at its peak, leaving a candlestick with a long "wick" on the chart and effectively closing at the midline Bollinger Band.
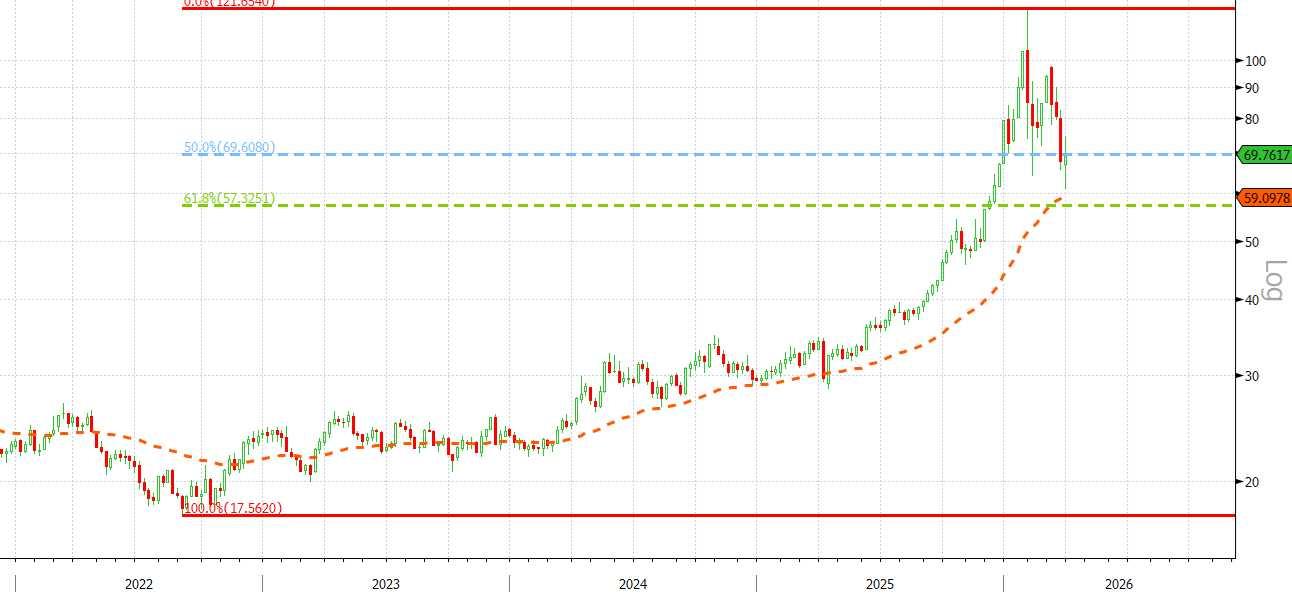
The situation in silver is similar, albeit with traditionally higher volatility. Like gold, silver declined to the 50-week moving average, which held as support. In March, the price of silver fell to $61 per ounce, closely matching the 61.8% Fibonacci retracement level of the entire movement since 2022.
The metal closed the month around $70, the next Fibonacci level. Thus, silver’s dynamics since late January fit a scenario of a sharp retest of key levels without breaking through them.
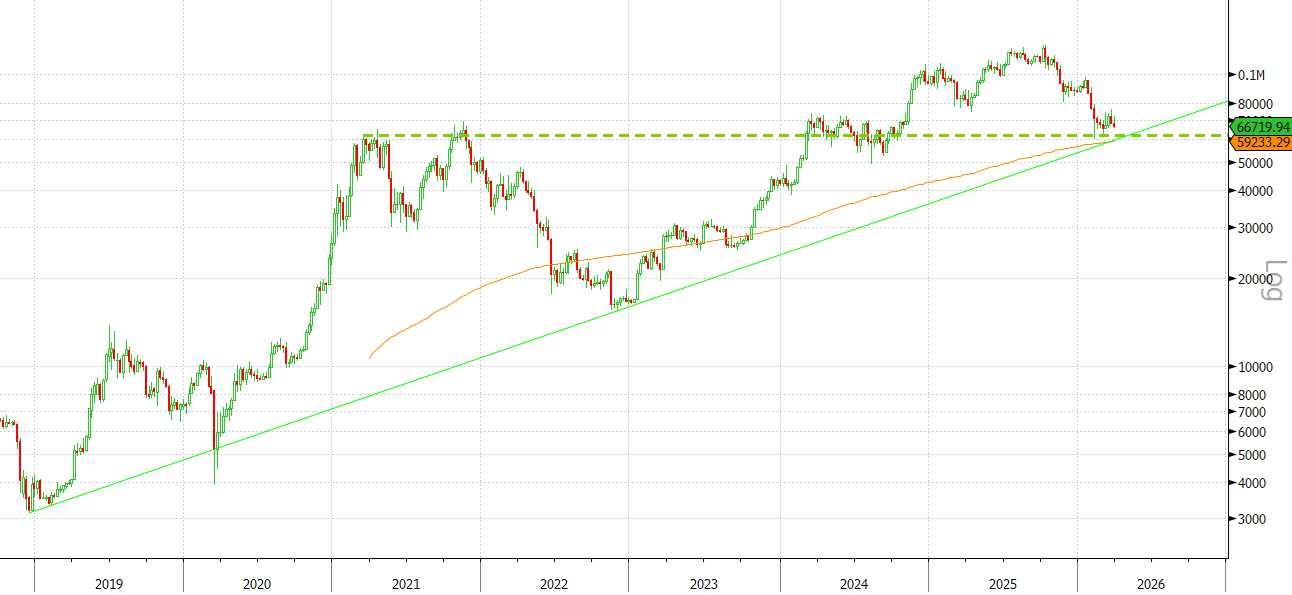
Cryptocurrencies have remained stable for two months despite the downturn in the stock market and high volatility in other assets. We continue to hold open positions but are not increasing them, as the growth potential from current levels remains limited. We consider the $60,000 level an important support, and the behaviour of Bitcoin in this area will be a key signal.
Source: Bloomberg, Astero Falcon analytics.
After reaching a record price of $120, silver sharply corrected since January. The fact that key support levels held indicates that the upward trend is not yet over.
Direct Investments: Decline in Quality of Underlying Assets 08
Seven funds restricted redemptions within a single quarter, revealing a structural mismatch in private credit liquidity. A wave of redemption restrictions swept through retail private credit funds in March, exposing the fundamental contradiction between semi-liquid products promising quarterly redemptions and loan portfolios with maturities of 5–7 years. Six major managers implemented restrictions during the month.
Taking into account the complete cancellation of Blue Owl’s quarterly tenders for OBDC II in February, total redemption requests in Q1 2026 exceeded $10 billion across seven funds (CNBC). J.P. Morgan Private Bank notes that the redemptions are "driven more by sentiment than fundamentals": the share of non-accrual loans in private BDCs stands at just 1.2% of value—below the ten-year average of 1.9%.
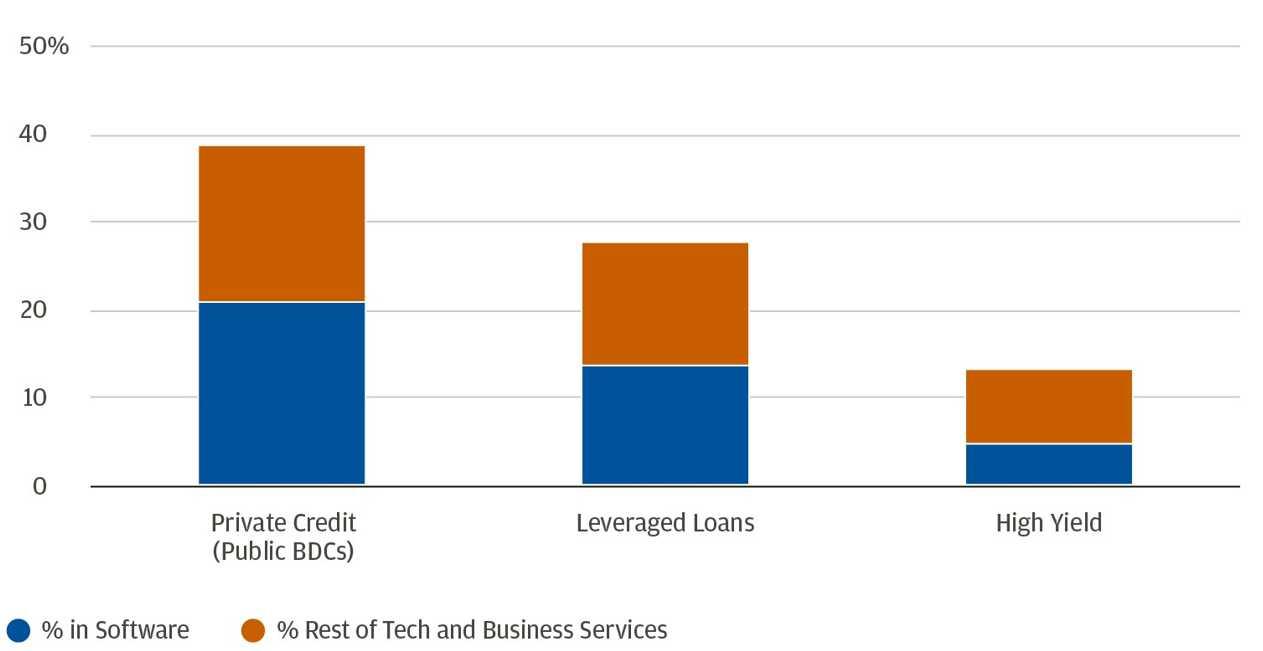
The wave of repayments was not an isolated liquidity event but was driven by fundamental concerns about the quality of the underlying assets. Private credit has the highest technological exposure among all credit markets: approximately 21% is attributed to the software sector, and including adjacent technologies and business services, this rises to 39%, compared to 27% for the leveraged loan market and only 13% for highyield bonds (J.P. Morgan). Around 96% of software companies are private, which explains why private credit, rather than public bonds, concentrated this exposure.
Private credit carries nearly 40% exposure to software and technology—three times more than high-yield bonds—making it the most vulnerable credit market to AI disruptions.
Agentic AI commoditises SaaS licensing based on "seats", compressing EBITDA multiples of software borrowers from approximately 30x at the end of 2022 to around 16x (UBS). The interest coverage ratio for private borrowers has stabilised at about 2.0x—half the 4.0x seen in public companies— leaving a smaller buffer for revenue shocks.
Software and Other Services as Percentage of Credit Market
Private credit carries nearly 40% exposure to software and technology—three times more than high-yield bonds—making it the most vulnerable credit market to AI disruptions.
Source: Bloomberg, Astero Falcon analytics.
March: US Dollar – The Only Safe Haven
At the current levels, three key supports have converged in the price of Bitcoin: the trendline since 2019, the 200-month moving average, and horizontal support. Despite the overall weakness in risk assets in March, Bitcoin remained relatively stable.
March 2026
-13,56%
-21,98%
-8,37%
53,51%
55,60%
10,94%
March 2026
1,05%
-3,88%
-1,87%
-2,89%
-0,92%
-2,02%
2026
-2,21%
-7,18%
3,69%
-2,98%
-3,70%
2,13%
Disclaimer 12
This document is issued by Astero Falcon (DIFC) Limited (“Astero Falcon”), a company incorporated in the Dubai International Financial Centre (“DIFC”) under Commercial Licence No. CL9556 and authorised and regulated by the Dubai Financial Services Authority (“DFSA”) under Firm Reference No. F010362. This material constitutes a Financial Promotion for the purposes of the DFSA General (“GEN”) Module and is directed solely at Professional Clients, as defined under the DFSA Conduct of Business (“COB”) Module. It must not be acted upon by, relied upon by, or distributed to Retail Clients.
This document is provided for information and general market commentary purposes only. It does not constitute investment advice, investment research, or an offer, solicitation, recommendation, or inducement to engage in any investment activity or to transact in any financial instrument or product. The content has been prepared without regard to the individual investment objectives, financial situation, or particular needs of any recipient, and no assessment of suitability or appropriateness has been undertaken. Recipients should obtain independent professional advice before making any investment decision and should not rely on this document as the sole basis for any investment decision.
This material does not constitute “Investment Research” as defined under the DFSA Conduct of Business Rules and has not been prepared in accordance with legal or regulatory requirements designed to promote the independence of investment research.
Forward-Looking Statements
Any forward-looking statements, opinions, projections, forecasts, or market expectations are inherently uncertain and subject to change without notice. Actual outcomes may differ materially due to market conditions, interest rate movements, macroeconomic developments, geopolitical events, regulatory changes, or other factors. Past performance is not a reliable indicator of future results.
Digital Assets & Cryptocurrencies
References to cryptocurrencies or digital assets are provided solely for market commentary purposes. Cryptocurrencies are not regulated by the DFSA unless classified as Investment Tokens or Crypto Tokens under the DFSA Rulebook. Such assets may be subject to extreme volatility, liquidity constraints, valuation uncertainty, cyber risk, and the risk of total loss of capital.
Risk Disclosure
Investments may involve, among other risks:
Market and price volatility
Credit and counterparty risk
Liquidity risk
Interest rate risk
Currency risk
Regulatory and legal risk
Geopolitical risk
Potential loss of capital
The value of investments and any income derived from them may fluctuate and may be adversely affected by various economic and market factors.
Data Sources
Information contained in this document has been obtained from sources believed to be reliable, including Bloomberg and internal analysis. However, no representation or warranty is made as to its accuracy, completeness, or timeliness. Astero Falcon accepts no liability for any loss arising from reliance on this document. Information is stated as at the publication date unless otherwise indicated.
Conflicts of Interest
Astero Falcon, its affiliates, directors, officers, or employees may have positions in, or may from time to time act as market makers, advisors, or counterparties in relation to, the financial instruments or markets referred to in this document.
Regulatory & Onboarding Restrictions
Any potential engagement with Astero Falcon is subject to full client classification, KYC, and AML procedures in accordance with DFSA requirements. Astero Falcon is under no obligation to enter into any transaction or engagement as a result of this document.
The Firm maintains appropriate systems and controls, including cybersecurity and operational resilience measures, in accordance with applicable DFSA requirements.
Confidentiality & Distribution
This document is confidential and may not be copied, reproduced, forwarded, or distributed, in whole or in part, without the prior written consent of Astero Falcon. Distribution of this document may be restricted in certain jurisdictions, and it is the responsibility of the recipient to ensure compliance with applicable laws. This document is not intended for distribution in any jurisdiction where such distribution would be contrary to local laws or regulations.