51 minute read
NACo special report: Doing More with Less


NACo POLICY RESEARCH PAPER SERIES • ISSUE 5 • 2016

JOEL GRIFFITH, JONATHAN HARRIS & DR. EMILIA ISTRATE
Executive Summary
Counties provide front line support for the health, safety and prosperity of communities and residents. But they are struggling to deliver essential services around the country. States increasingly limit counties’ capacity to raise adequate revenue to fund their activities. At the same time, state and federal governments are imposing more mandates on counties, without providing adequate funding. Counties have adopted additional fiscal solutions, but they are not sufficient to cover the needs of their residents and communities. NACo conducted interviews with state associations of counties and state and county officials in each of the 48 states with county governments between February and July 2016 to better understand county funding sources, state revenue limits, federal and state mandates on counties, new fiscal challenges and county fiscal solutions. Supplemented by additional research of state statutes, tax codes and local government finance literature, this analysis shows that:
1STATES ARE LIMITING COUNTIES’ REVENUE AUTHORITY TO FUND ESSENTIAL SERVICES. Property taxes and sales taxes are the main general revenue sources for most counties. While counties in 45 states collect property taxes, most often they keep less than a quarter of the property taxes collected in a state (23.7 percent). The bulk of property taxes in a state (49.9 percent) goes to schools. Forty-two (42) states place limitations on county property tax authority and the number of restrictions has expanded extensively since 1990s. Nearly half (45 percent) of current state caps on county property taxing authority have been enacted or modified since 1990. Only 29 states authorize counties to collect sales taxes, but with restrictions. Twentysix (26) impose a sales tax limit and 19 ask for voter approval. FORTY-TWO (42) STATES PLACE LIMITATIONS ON COUNTY PROPERTY TAX AUTHORITY 29 STATES AUTHORIZE COUNTIES TO COLLECT SALES TAX
2COUNTIES ARE STRUGGLING WITH MORE STATE AND FEDERAL MANDATES, NOT FULLY COVERED BY STATE AND FEDERAL AID.
Many county services are mandated by the states or the federal government, from activities in criminal justice and public safety, health and human services, transportation and infrastructure, to administration of elections and property assessments. U.S. Environmental Protection Agency (EPA) regulations comprise the federal mandate burden most likely to be cited by the state associations of counties and other officials interviewed. According to the interviews, nearly three-quarters (73 percent) of states have escalated the number and/or cost of mandates for counties, over the past decade, decreased state funding to counties over the past decade or done a combination of both.
3COUNTIES ARE ADJUSTING TO NEW FISCAL CHALLENGES ON THE HORIZON. Several developments are challenging local fiscal conditions across the nation. Marijuana legalization provided a new revenue stream for counties in five of the 25 states that passed this measure before November 2016 elections, but costs associated with potential substance abuse problems and driving under the influence may prevent counties from receiving a net financial benefit from this new source of revenue. In 14 states, plummeting prices for oil and natural gas over the past two years have erased
Editor’s Note: As a nationwide study, “Doing More With Less” refers to some services and functions that Arkansas counties NATIONAL ASSOCIATION of COUNTIES | NOVEMBER 2016 1do not provide even though counties in other states do. Correction: A map concerning county sales tax authority on page 12 shows that in Arkansas a local sales tax is permitted without voter approval. However, this information is incorrect.
much of the annual severance tax revenue received by counties. The “sharing economy,” a technological development best exemplified by AirbnB and Uber, is challenging county revenue structures. According to the interviews with the state association of counties and other officials, counties in nine states are experiencing fiscal losses because of home sharing. The rapid proliferation of “dark store” big-box retailers’ property valuation appeals is another issue confronting counties in more than 12 states. This approach argues for use of vacant big box stores as comparables for the assessment of operating retail store locations.
4COUNTIES ARE PURSUING VARIOUS SOLUTIONS TO ENSURE QUALITY SERVICE DELIVERY DESPITE FISCAL CONSTRAINTS.
Counties throughout the country partner with cities, other counties, nonprofit organizations and the private sector to deliver high-quality services to their residents in a cost efficient manner. For example, Iowa counties are part of more than 23,000 agreements with other local governments for service delivery ranging from ambulance services to public libraries. Further, 37 states grant counties the authority to create and/or manage special-purpose tax districts to fund specific services. In 22 of the 37 states, counties must first obtain voter approval. Finally, some states have passed legislation specifically meant to curb the imposition of unfunded mandates. For example, the Alabama Constitution requires a two-thirds approval of any such mandate by the state legislature; furthermore, the state cannot enforce the mandate until the following fiscal year.
County government roles and responsibilities continuously evolve as local conditions and needs change with shifting economies, aging populations or overburdened infrastructure. Local elected officials understand best the impact of legislation or administrative regulations on the county economy and county government budget. Counties need the state and the federal governments to provide full funding to cover for the compliance costs with the mandates they impose. Likewise, increased county autonomy regarding revenue generation and service provisions would relieve some of the fiscal pressures. The continued partnership with the state and federal governments is essential to counties’ ability to effectively and successfully support thriving communities across the country.

INTRODUCTION
County governments directly affect the economic vitality and quality of life in their communities. This role encompasses a range of services, from maintaining 45 percent of America’s roads to supporting nearly 1,000 hospitals to keeping communities safe through law enforcement. These services require massive resources including more than $106 billion annually in building infrastructure and maintaining and operating public works, more than $53 billion annually in construction of public facilities and nearly $70 billion annually for community health and hospitals.1
The increasing extent of state limitations on counties’ capacity to raise revenue is making provision of these services more difficult. State limitations include restricting the types of taxes counties may impose, limitations on the rates of permitted taxes, the total revenue collected and property assessments, along with an obstacle-strewn approval process.
Concurrent with these constraints, state and federal governments require counties to provide a growing scope of services. These mandates are often unfunded either entirely or partially. Revenue sharing by states and other state and federal funding for county services alleviate some of these mandate related costs. But in many instances, these supplementary sources have become more unpredictable and smaller in size. Overall, six years following the start of the Great Recession, fiscal tensions remain across counties, with inflation-adjusted general revenue fully recovered in only 46 percent of counties.2
Counties have adopted additional fiscal solutions, but they are not sufficient to cover the needs of their residents and communities. Some states allow counties and other local governments to create special-purpose taxing districts to fund specific services. But counties are also turning to more innovative solutions, such as service sharing and merged service provision with cities or other counties. Further relief requires both the state and federal government to curtail their reliance on unfunded mandates to accomplish policy objectives. Additionally, counties must be empowered to more ably self-govern including in matters related to revenue generation and provided the necessary funding to implement any additional mandates.
This study examines the pressure facing counties, including state limits on their ability to raise revenue and state and federal mandates. This includes a breakdown of county revenue sources. A discussion of the state limitations on property taxation and sales taxes follows. The report also examines the pervasiveness of state and federal mandates, which further complicate the fiscal dilemma. Lastly, several developing fiscal challenges are discussed along with some of the promising ways in which counties seek to overcome fiscal shortfalls.
The reader can access the information for each state through interactive maps and individual state profiles at ww.naco.org/StateLimits and County Explorer available at explorer.naco.org
FINDINGS
1STATE GOVERNMENTS ARE LIMITING COUNTIES’ REVENUE AUTHORITY TO FUND ESSENTIAL SERVICES.
Counties rely on two types of revenue to finance operations, services and other responsibilities: (1) revenues raised by the county from local taxes and user fees (referenced as “own funding”) and (2) funding from the state and federal governments. Most often, counties derive 76 percent of their annual revenues from own funding and the remaining 24 percent from intergovernmental transfers.3
COUNTY OWN FUNDING. Counties raise revenues locally either through taxes or user fees. Most often, the revenue raised through property taxes and other types of taxes are not restricted to a particular activity (called “general revenues”). By 2013, general revenues funded 62.5 percent of county expenses, an increase of 1.5 percentage points in the funding share from the prior six years. Of utmost importance are property taxes, which represent 72 percent of county general revenues. 4
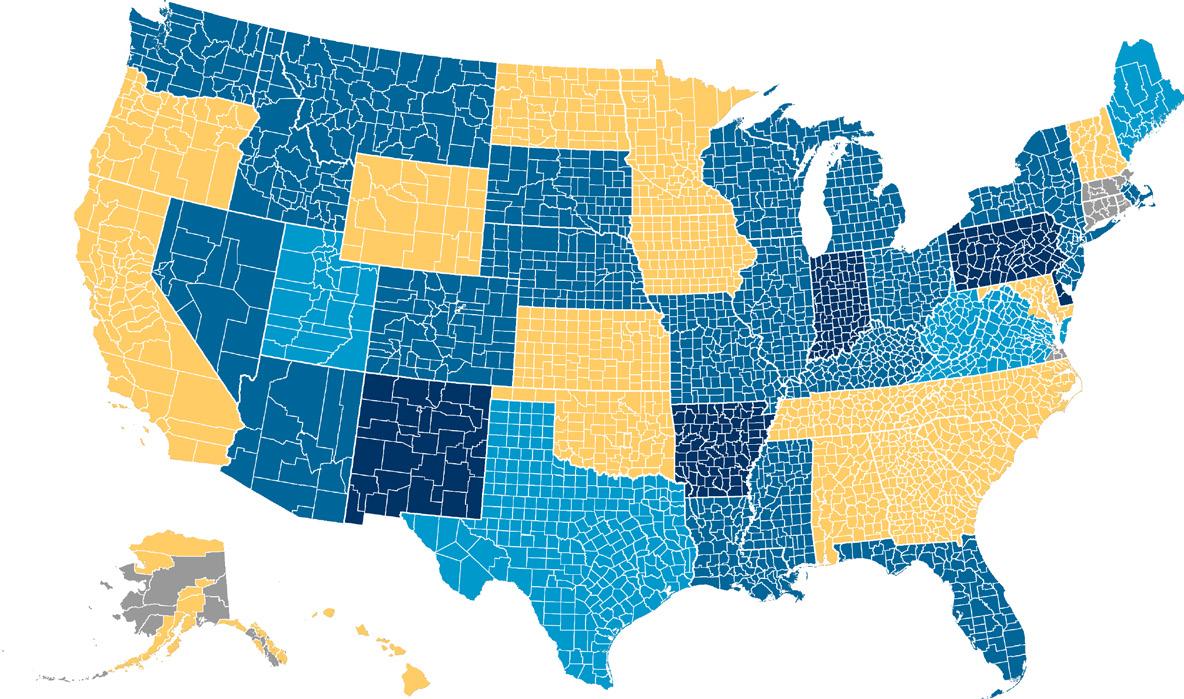
Counties keep only a small portion of the property taxes they collect. Most often, counties keep only 23.7 percent of the property taxes collected statewide, the bulk of which (49.9 percent) go to schools (See Map 1). Many property owners may presume that the county government retains for its own use all of the property taxes levied on a particular parcel because counties often collect not just taxes levied by the county government, but also property taxes levied by a myriad of governmental entities. These entities with separate levies may include cities, municipalities, schools and special districts. For example, counties in five states (Ill., Mass., Mich., N.H. and N.Y.) retain less than 10 percent of the property taxes collected statewide.6
Key Terms Used in this Study
CHARGES OR FEES FOR SERVICES: Government charges for services provided or for the use of government assets, such as road tolls, park entry fees and parking charges.
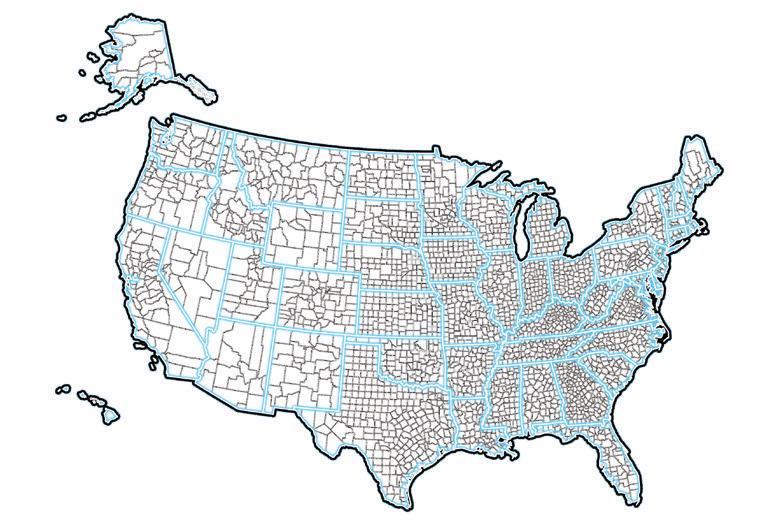
COUNTY GOVERNMENT: An organized entity with governmental character, sufficient discretion in the management of its own affairs to be an independent governmental unit and covering the geographical area of a county or county equivalent. Depending on the state, it can be known also as parish government or borough government. There are 3,069 county governments in the United States, including city-county consolidations, the District of Columbia and independent cities considered county governments under their state constitution or city charter. For ease of use, this study employs interchangeably “county” and “county government.”
AS OF NOVEMBER 2016
10%
20%
30%
40%
Note: Conn., R.I., and parts of Mass. have counties or county-equivalents with no county governments (marked in grey on the map). There was no data available for Maine and Vermont. Source: Figures reflect different fiscal years, as made available by interviewed state associations of counties and state and county officials in the states with county governments.
Only 29 states permit counties to implement a local option sales tax. In 19 of these 29 states, voter approval is needed to implement a sales tax, difficult to obtain. For example, five N.C. counties attempted to pass a 2.5 percent sales tax (a rate approved by the state) in their March 2016 elections; all failed to secure a popular vote. In four states (Mo., Texas, Utah and Wis.), any implemented sales tax must decrease property tax levies to prevent an overall tax increase.
Twenty-three (23) states authorize counties to implement a secondary sales tax for specific, statutorily defined purposes. This includes 19 of the 29 states allowing counties to implement a local option sales tax. Another four states (Hawaii, Ind., Md. and Minn.) permit counties to levy a sales tax for specific purposes, despite being precluded from levying a general sales tax. States often require voter approval for introducing these restricted purpose sales taxes or may ask the taxes to be implemented in increments of 0.1 percent, 0.15 percent or 0.25 percent.
NATIONAL ASSOCIATION of COUNTIES | NOVEMBER 2016
5
Key Terms Used in this Study
CAPITAL EXPENDITURE: Expenditures related to construction, purchasing or renovations for capital assets.
COUNTY-OWN FUNDING: Revenues raised by counties locally through taxes or user fees. This revenue may be classified as either general or restricted revenue.
COUNTY EXPENSES: Includes expenses for primary government activities (such as judicial and public safety programs) and business-type activities (such as waste disposal and collection services).
GENERAL REVENUES: Unrestricted revenues generated by taxes, unrestricted grants and contributions and in some counties, transfers and special items.
JUSTICE AND PUBLIC SAFETY SERVICES: Includes sheriff, police and related services (impound, task forces, general law enforcement and patrol); emergency management and medical services; 911 communications; fire protection; detention centers and related commissaries, stores and inmate services. Also included in this class are judicial functions: judges; attorneys; prosecutors; justices; court clerks; probate courts; courthouses; warrant services and law libraries.
PASSED-THROUGH FUNDS: Federal government funding used by counties, but received directly from the federal government by other entities, such as the state governments.
RESTRICTED REVENUE: Revenue which must be used to fund specific functions.
TAX REVENUES: Revenue generated by the taxes levied by the county. Most common are property taxes (assessed ad valorem on property within county borders), sales and use taxes (imposed on sales of goods within the county, or on the use of personal property not subject to a sales tax; also includes taxes related to hospitality), other taxes (include specific ownership taxes, severance taxes, transfer taxes, litigation taxes, inheritance taxes, insurance premium taxes and others). Less common county taxes include excise taxes (levied on goods/services for the purpose of controlling their provision (e.g., motor fuel taxes), licenses and permits (taxes which may be imposed by a county on a given class of business type or occupation; includes business license taxes and professional taxes), franchise taxes (imposed on public utilities, or for the use of public rights-of-way) and income taxes (based on income earned within county borders).
Besides taxes, counties also raise use fees or charges for services, such as filing and permit fees and water rates. These revenue sources are restricted frequently to fund expenses related only to that service for which the county charges a fee. Most often, they cover about 18 percent of county expenses, mainly expenses for utilities and water, sewage and solid waste.7 For instance, Florida allows counties to impose a real estate conveyance fee, which must go towards the creation of housing opportunities for low-income residents.
STATE AND FEDERAL FUNDING. States provide a variety of funding to counties. Many states distribute a share of the state’s general tax revenue to counties and other local governments. For example, Ohio and South Carolina accomplish this through a mechanism known as the Local Government Fund (LGF); this partially covers the county costs related to state-mandated programs. Some states transfer part of the state sales tax to counties through revenue sharing. Arizona counties receive approximately 13.5 percent of Ariz.’s state sales tax, an amount exceeding $744 million in fiscal year 2015. State income taxes are
sometimes shared as well; Illinois distributes one tenth of the revenue from the state income tax to local governments, including counties. States, such as Wyo. and Ky., also may share severance tax revenue. Oregon counties receive a portion of numerous state taxes, including the cigarette tax, liquor tax receipts, beer and wine taxes and video lottery receipts.
The federal government also provides funds to counties, either directly or passed-through other entities, such as the state (called here, “passedthrough funds”). According to the single audits submitted annually by counties that used more than $500,000 in federal dollars in fiscal year 2013, only 14 percent of federal funding used by counties was received directly. Most of this federal passed-through funding is restricted, either matched to certain programs, or received as reimbursement for expenditures made in those programs. Some of the major federal programs from which counties receive money directly include: Payment in Lieu of Taxes (PILT) ($ 452 million in FY2016), Community Development Block Grants (CDBG) ($3 billion in FY2016), Secure Rural Schools (SRS) ($278 million in FY2015) and the State Criminal Alien Assistance Program (SCAAP) ($60 million in FY2015). Counties utilize funding from dozens of federal programs, often passed-through the state or other entities.
The most used passed through federal funding streams to counties include the Medical Assistance Program ($24.8 billion in FY 2016), Temporary Assistance for Needy Families, Medical Assistance Program ($5.7 billion in FY 2016), Foster Care Title IV-E ($2.1 billion in FY 2016), Highway Planning and Construction ($1.9 billion in FY 2016) and Child Support Enforcement ($1.4 billion in FY 2016).
In 42 states, the majority of federal funding used by counties was indirect. In Calif., La., Minn., N.Y., Ohio, Tenn. and Wis., more than 90 percent of federal funding used by counties was passed-through the state government or other entities.
Counties typically possess little discretion over where to utilize these financial resources. Most often, 93 percent of the state and federal funding used by a county is restricted to specific activities.8 For instance, the state of Washington provides funds to counties for criminal justice expenses related to prosecutors and judges in Wash. The state of Maryland has directed nearly $2.8 billion to counties over the past decade for public school construction. Because these funds are often in the form of earmarked grants for operational expenses or capital expenditures of specific activities, counties do not have the flexibility to reallocate funds for other local needs.
STATES PLACE NUMEROUS LIMITS ON THE ABILITY OF COUNTIES TO RAISE REVENUE. Most states have limits on property taxes, the main general revenue source for counties. Of the 48 states with county governments, counties in 45 states collect property tax revenue (Maine, N.H. and Vt. are the exceptions). Forty-two (42) of these states place limitations on the ability of counties to generate revenue from property
Key Terms Used in this Study
ASSESSED VALUE: The property valuation upon which the property tax rate is applied in order to determine the property tax owed for a given property. Valuation for property tax purposes is not necessarily indicative of the property’s true market value. Also known as “taxable value.”
MILLAGE: Property tax assessed per $1,000 of a property’s assessed value.
PROPERTY TAX LEVY: The total amount of property taxes assessed on property within a particular jurisdiction in a given year.
PROPERTY TAX RATE: The rate which is multiplied by the assessed value of a piece of property to determine the amount of property tax payable by the owner.
ROLLBACK: A downward adjustment to the property tax rate (millage) applied to assessed values in order to avoid exceeding state limitations on property tax growth. Alternatively, some counties may also roll back their property tax rate in order to achieve the same result.
TAX FREEZE: Maintenance of assessed property taxes at a current level by adjusting the assessed value and/ or millage.
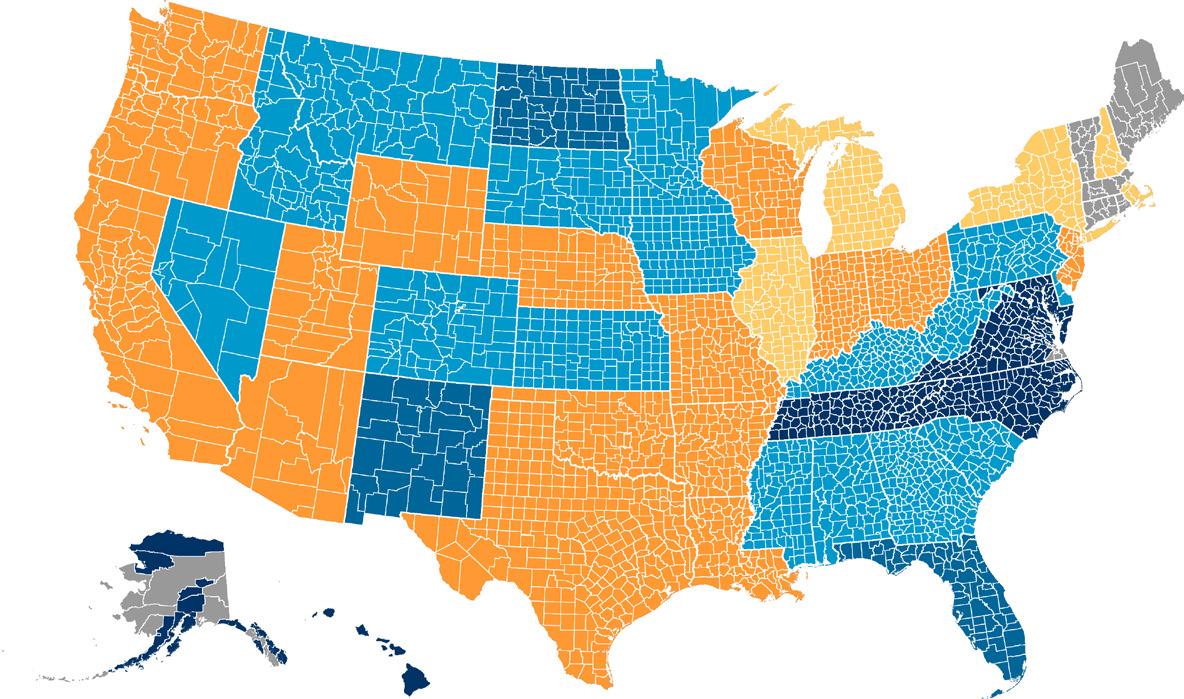
MAP 2.
AS OF NOVEMBER 2016
No Limit
Pre 1990
1990-2000
2000-2010
After 2010
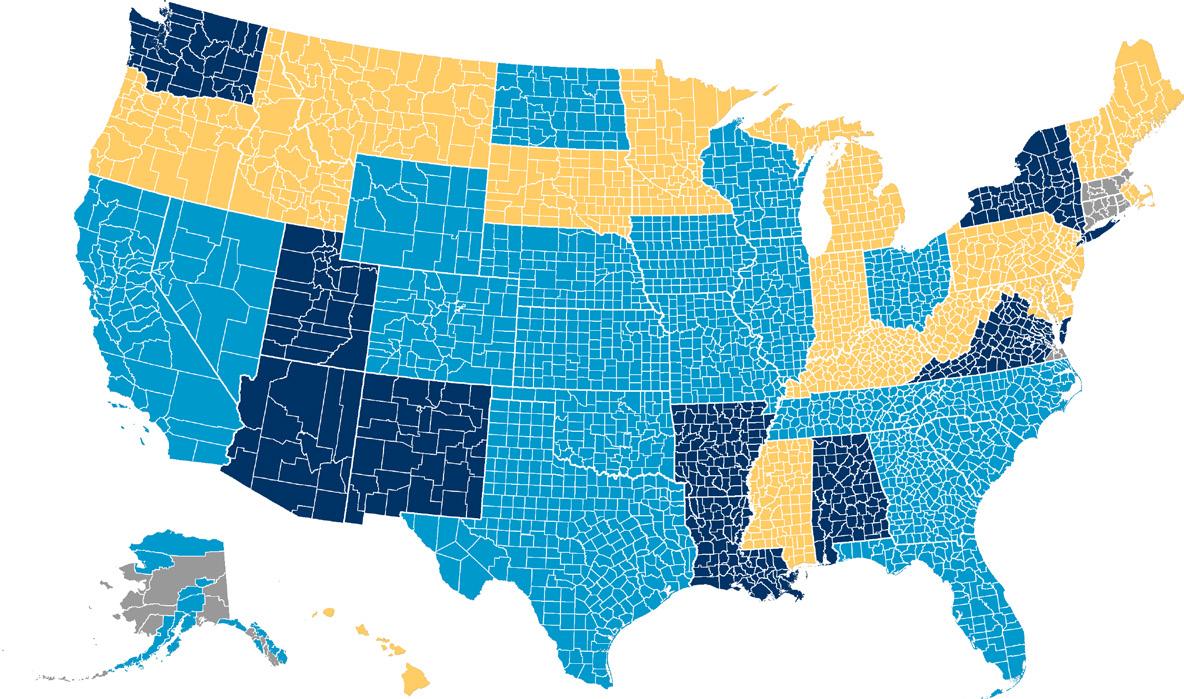
Notes: Year reflects latest change to state-imposed property tax limitations. Conn., R.I., and parts of Mass. have counties or county-equivalents with no county governments (marked in grey on the map). Source: NACo interviews with state associations of counties and state and county officials in each of the 48 states with county governments, research of state statutes, tax codes and local government finance literature.
taxes. This translates to 87 percent of counties facing at least one type of limit on their revenue authority through property taxes. These property tax limitations encompass the following manifestations: (1) rate limits, (2) levy limits, (3) assessment limits and (4) tax freezes and rollbacks.
State property tax limitations have expanded extensively since the 1990s. Nearly half (45 percent) of current state caps on county property taxing authority have been enacted or modified since 1990 (See Map 2). Some state limitations on property tax rates date as far back as the late 1800s for counties in states like Ark., Mo., Texas and Wyo. After the 1940s, states moved away from restricting property tax rates and focused on capping property assessment valuations and tax levies. Thirty-eight (38) of the 50 state limitations enacted since the 1970s concerned county property assessment and levy limits. State restrictions on property assessment and property tax revenue growth were enacted as recently as 2012 in Ariz. and N.Y.
PROPERTY TAX RATE RESTRICTIONS: (See Chart 1) The property tax rate is multiplied by the assessed value of a piece of property to determine the amount of property tax owed. Typically, property tax rates are expressed in millage rates, or ‘mills,’ or the dollar amount owed per $1,000 on the property’s assessed value.
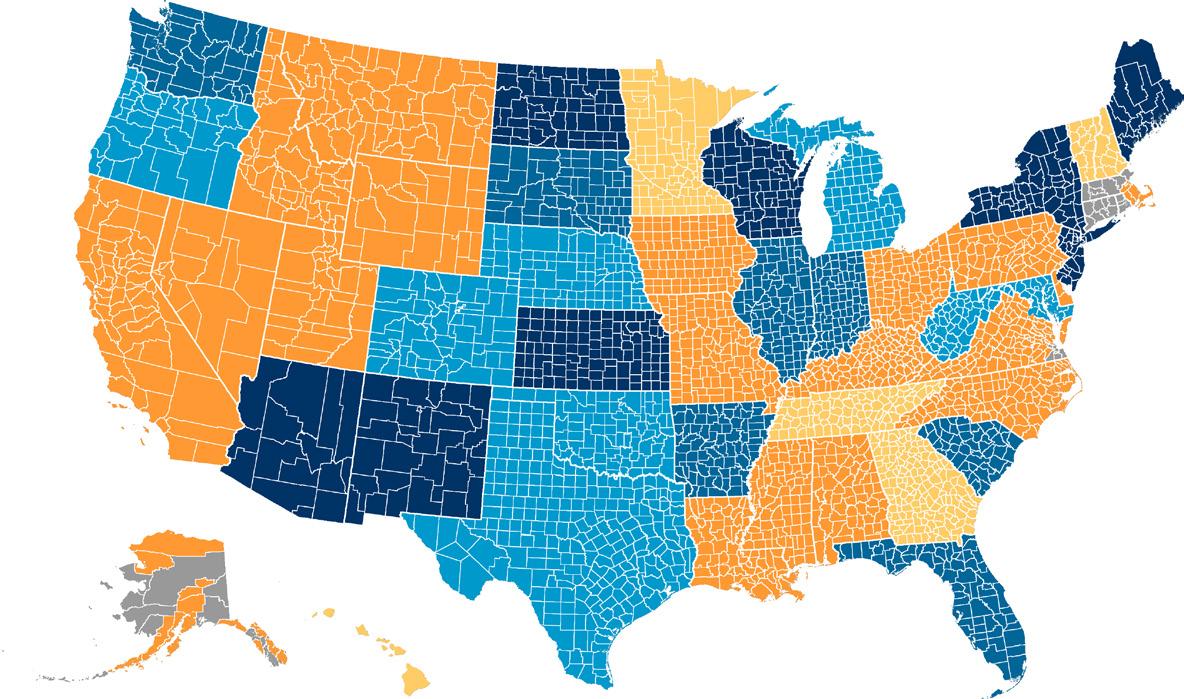
PROPERTY TAX RATE LIMITS. Most states restrict counties’ ability to raise the rate of property taxes (See Map 3). Restrictions on counties’ authority to set property tax rates affect counties in 35 states. In seven of these states (Ala., Alaska, Ariz., Ark., Ind., N.H., Ore., Vt., Wyo.), counties cannot exceed these statutory property tax rate limits under any circumstance.910 Seventeen (17) states with statutory tax rate limits allow the caps to be exceeded by voter approval only. In another four states (Iowa, Okla., Pa. and S.C.), counties may exceed property tax rate limits by board resolution. Counties in Calif., Key., N.M., Texas and Utah do not require either board resolution or voter approval to exceed these limits.
CHART 1.
PROPERTY TAX LIMITATIONS: DIVERSE AND WIDESPREAD
Rate Limit
Assessment Limit
Levy Limit
Property Tax Freeze
Disclosure Requirements
5 10 15 20 25 30 35 Number of States
Source: NACo interviews with state associations of counties and state and county officials in each of the 48 states with county governments, research of state statutes, tax codes and local government finance literature.
Property tax rate limits are varied in nature. Some property tax rate limits are tied to the previous year’s tax rate and budgetary needs; others are a strict millage cap on property tax rates. For instance, Wyo. counties cannot impose a property tax rate above 12 mills, which is $1,200 annually for a property assessed at $100,000. Other states limit the aggregate property taxes collected by a given rate.11 In Alaska, the borough total tax rate cannot produce revenues greater than $1,500 per resident per year, regardless of the millage or the assessed value.12
MAP 3.
LIMITATIONS ON COUNTY PROPERTY TAX RATES AND PROPERTY ASSESSMENTS
AS OF NOVEMBER 2016
No Authority To Levy Property Taxes
Neither Property Tax Rate Nor Assessment Limit
Only Property Tax Rate Limit
Only Assessment Limit
Both Property Tax Rate and Assessent Limit
Note: In Del., the state limit on property tax rates affect only Kent County. Conn., R.I., and parts of Mass. have counties or county-equivalents with no county governments (marked in grey on the map). Source: NACo interviews with state associations of counties and state and county officials in each of the 48 states with county governments, research of state statutes, tax codes and local government finance literature.
Property tax rate limits reduce the potential of property taxes to generate sufficient revenues for counties. These limits are particularly troublesome when the demand for county services exceeds significantly the rise in assessed property values, for example, when a county is adding population rapidly.
LEVY LIMITS: Restrictions on counties’ authority to set levies affect counties in 30 states (See Map 4).13 Property tax levy limits restrict the allowable increase in aggregate property tax revenues generated by counties annually. This is the second most common statutory limit on county property taxing authority imposed by states. In five of these states (Ark., Del., Ind., N.M. and Pa.), counties may not exceed this limit for any reason. Counties in 20 states need to get voter approval to exceed the levy limit. In the remaining five states, counties may exceed this limit without voter approval.
Levy limits vary in type. Certain levy limits cap property tax revenues to a fixed percentage annual increase. For example, counties in Ariz. cannot increase property tax revenues more than 2 percent annually; Nebraska counties’ levies may not increase more than 5 percent year to year. Other levy limits restrict
MAP 4.
AS OF NOVEMBER 2016
No Levy Limit
Levy Limit, Can Exceed Without Vote
Levy Limit, Can Exceed With Vote
Levy Limit, Cannot Exceed
Note: Conn., R.I., and parts of Mass. have counties or county-equivalents with no county governments (marked in grey on the map). Source: NACo interviews with state associations of counties and state and county officials in each of the 48 states with county governments, research of state statutes, tax codes and local government finance literature.
property tax revenues based on inflation (such as Mich.) or tax base growth. In Mont., property tax revenues may only increase at half the rate of inflation over the past three years (although new construction is excluded from this rate increase limits). Indiana restricts property tax revenue growth to no more than the six-year average growth in personal income.
PROPERTY ASSESSMENT LIMITS. In most states, the upwardly revised assessments must fit within a defined percentage. For instance, assessed values for properties in S.C. may not increase more than 15 percent over a five-year period. In Texas, assessed values of homestead properties may not increase more than 10 percent annually plus increases due to home improvements. Other assessment limits take inflation into account. The taxable value of a Mich. property may not increase more than 5 percent or inflation, whichever is less. Fifteen (15) states in which counties collect property taxes impose limits on property tax assessments increases. (See Map 3).
The property assessment limits hurt counties especially during a real estate comeback after a deep decline. For example, home values declined significantly during the latest downturn at the end of the 2010s. While states often limit upward movement in property assessments, they do not limit losses. As a result, many counties have seen much lower assessment values and declines in property tax revenues. As property values rebound, property tax revenue does not rebound at the same pace due to these limits on property assessments, unless the property is sold and a new baseline assessment value is established.
FREEZES AND ROLLBACKS. Six states (Ark., Ga., La., Tenn., Texas and Wash.) also have the option to freeze property taxes, and another 14 have the option to roll back property taxes if they exceed the state limitations. A property tax freeze adjusts either the assessed value of the property or the property tax rate in order to prevent the property tax assessed from increasing; a rollback adjusts the property tax rate (millage) in order to avoid exceeding state limitations on property tax growth. For instance, in Ark., the assessed value of real and personal property cannot increase by more than 10 percent over the previous year. If this does occur, the revenue is rolled back to the allowable limit to ensure that county revenues do not exceed the growth limit.14
DISCLOSURE REQUIREMENTS. In addition to property tax limits, 20 states have disclosure requirements, meaning counties must publicize or announce property tax increases. Often, they require notices published in the local newspaper. Minnesota requires that the county also hold a “truth-in-taxation” public hearing on tax increases and expenditure changes from the prior year.15
Key Terms Used in this Study
LOCAL OPTION SALES TAX: A tax collected by a local government on the sale of any taxable goods within its jurisdiction, if the local government is granted the authority by the state. Besides state authority, often the local government needs a local law or voter approval to implement the local option sales tax.
MAP 5.
COUNTY SALES TAX AUTHORITY
AS OF NOVEMBER 2016
No Local Sales Tax Permitted
Local Sales Tax Permitted With Voter Approval
Local Sales Tax Permitted Without Voter Approval
Note: Conn., R.I., and parts of Mass. have counties or county-equivalents with no county governments (marked in grey on the map). Source: NACo interviews with state associations of counties and state and county officials in each of the 48 states with county governments, research of state statutes, tax codes and local government finance literature.
SALES TAX LIMITS. Twenty-six (26) states set a local-options sales tax limit. Most often, the local-option sales tax limit is around 1.5 percent. Only three states, Ala., Alaska and Mo., do not restrict county localoption sales tax rates. Counties and boroughs in Alaska and Mo. must receive voter approval before the local-option sales tax takes effect, but counties in Ala. may institute the tax without voter approval. Few counties may exceed the sales tax cap with special authority. For example, counties in N.Y. may petition the state legislature to go above the 3 percent sales tax rate approved by the state before putting the proposed sales tax rate to popular vote.16 (See Map 5).
These many layers of limitations on county revenue authority hamper counties’ ability to service their communities. These state limitations force counties to prioritize spending in a manner often at odds with the community priorities, particularly when combined with unfunded mandates. Counties may be put in a difficult position to reduce or eliminate a program, because of insufficient revenue. These limitations hinder county elected officials and voters from engaging in self-governance.
2COUNTIES ARE COPING WITH MORE STATE AND FEDERAL MANDATES, NOT FULLY COVERED BY STATE AND FEDERAL AID.
Many county services are mandated by the states or the federal government, such as the administration of elections. In some states, counties are responsible for childhood education or even a portion of the community college costs. However, federal and state governments increasingly fail to provide counties with funds sufficient to cover the costs for mandated county services. Fifty-nine (59) percent of counties recorded dedicated grants covering a smaller percentage of county expenses between 2007 and 2013.17 When state and federal government funding for mandates diminishes, counties are forced to cover the shortfall with general revenues and user fees.
Key Terms Used in this Study
ADMINISTRATION SERVICES: Includes general governmental staff, services and functions such as county commissioners; treasurers; auditors; county clerks; councils; tax assessors, collectors; record and deed preservation; as well as financial and legislative departments. This category excludes functions that are specific to other categories such as courts (Justice and Public Safety); education and school boards (Education); and public works (Other); but otherwise encompasses all other central, legislative and executive activities and staff of the local county government.
DARK STORE METHOD: Valuation for property tax assessment purposes which assesses the value of currently operating “big-box” retail store locations as if they were vacant and closed.
HEALTH AND HUMAN SERVICES: Includes services related to healthcare (hospitals; mental health services; services for the physically disabled; indigent care; nursing, assisted living homes); veteran’s aid and services; pest, rodent, animal and weed control; animal shelters; environmental protection and improvement for purposes of public health; air pollution; welfare services; and child care and support.
MANDATE: Services, functions, or processes required of county governments by instruction from state or federal government authority. Funding to fulfill these mandates may be either funded or unfunded by the imposing authority.
Federal mandates impact the costs of many county functions and may emanate from statutory law or from federal agency rule making. With environmental issues, counties are often regulators, implementers of regulations and regulated themselves. U.S. Environmental Protection Agency (EPA) regulations are cited the most often as a federal mandate burden for counties by the state associations of counties and other officials interviewed. EPA clean water and air requirements affect local land use decisions and even postdisaster recovery efforts. A primary example is the use by the EPA of the Clean Water Act to issue storm water regulations impacting counties across the country. Further, EPA regulations affected negatively local economies relying heavily on mining, such as those in N.M. Regulations on federal lands are a major concern for counties in the West, but also counties in Miss. Land use regulations can diminish the revenue generating usages of public lands. For example, recently amended Bureau of Land Management (BLM) land use plans have excluded 2.8 million acres in three Nev. counties from future mineral extraction.
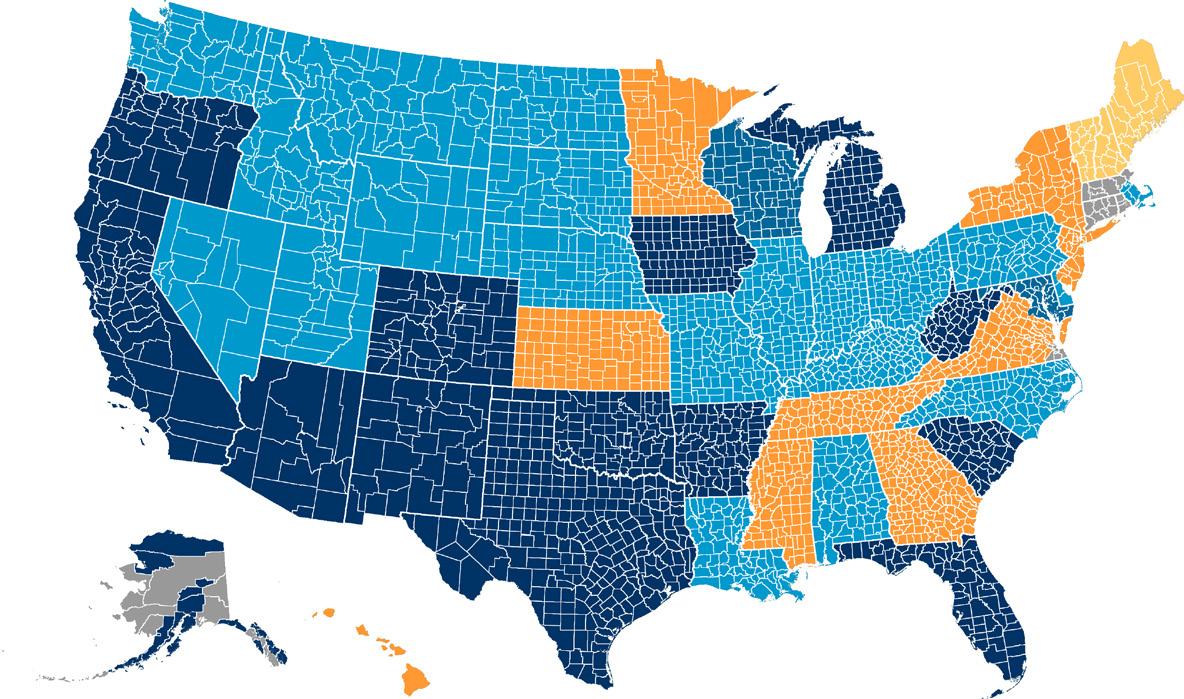
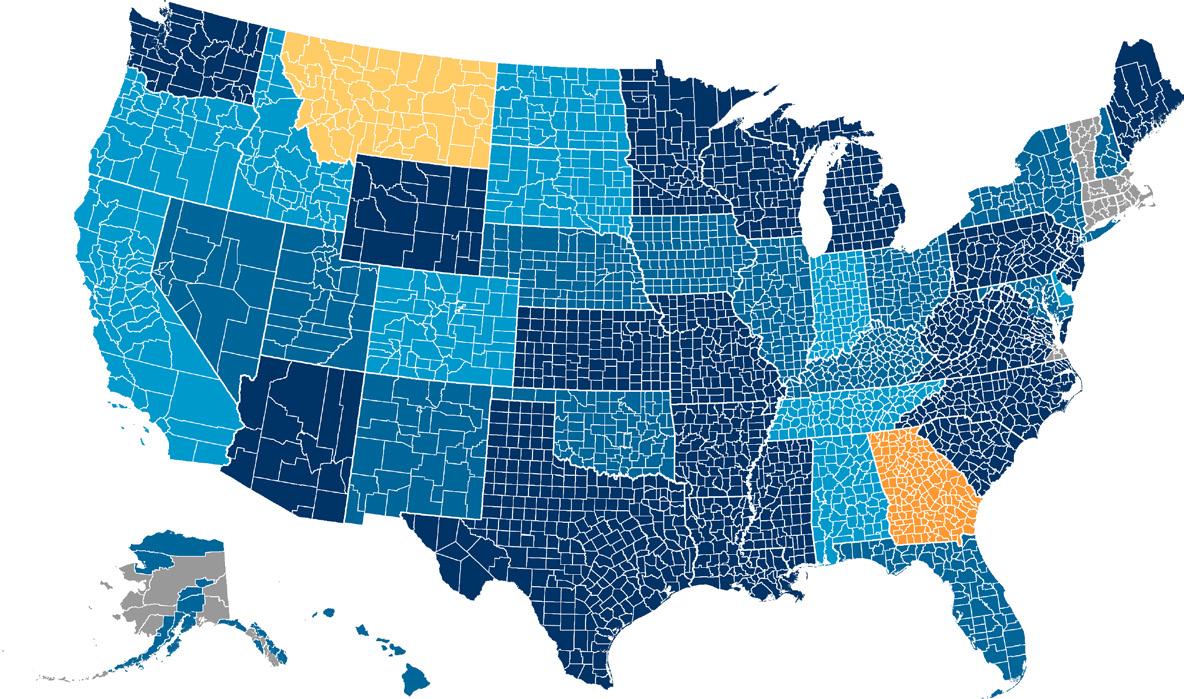
State mandates prove troublesome as well. According to the interviews with the state associations of counties and other state and county officials, nearly three-quarters (73 percent) of states are requiring counties to do more with what they have, decreasing state funding to counties or a combination of both. Over the past decade, counties in more than half of all states are experiencing a greater proliferation of mandates from states. Nearly half (45 percent) of state associations of counties reported counties receiving reduced state funding and facing more state mandates over the past ten years. (See Map 6).
MAP 6.
STATE MANDATES AND FUNDING FOR COUNTIES
AS OF NOVEMBER 2016
Decreased Mandates AND Increased Funding
Decreased Mandates OR Increased Funding
No Change (or Increases/ Decreases in Both)
Increased Mandates OR Decreased Funding
Increased Mandates AND Decreased Funding
Note: Conn., R.I., and parts of Mass. have counties or county-equivalents with no county governments (marked in grey on the map). There was no data available for Massachusetts and Vermont. Source: NACo interviews with state associations of counties and state and county officials in each of the 48 states with county governments, research of state statutes, tax codes and local government finance literature.
State and federal mandates multiplied rapidly over the past decade, across a wide range of policy areas. Although justice and public safety is an area of shared responsibility, states consistently attempt to shift more of the burden to counties. Arkansas and Missouri have only partially compensated counties for the true costs of the increased number of prisoners sent to county jails by the state. Florida counties are responsible for the detention costs for juveniles on a pre-trial basis, state court costs and a portion of the state’s Medicaid costs for the incarcerated. The state of Michigan sets the salary and benefit rates for district court judges; funding for these courts is provided by counties in six of these districts. In Ariz., the state requires counties to provide a separate tech system for the courts, without providing the full funding to cover the cost.
A cost shift is also occurring in the realm of health and human services. As an example, the state of New Hampshire transferred the cost of long-term care to counties following the Affordable Care Act’s expansion of Medicaid, without providing funding for the service. As a result, property taxes are increasing to cover the costs.18 The state of Georgia requires counties to share the cost of the state’s Health Department and the Department of Family and Children.
Mandates enacted by state and federal legislators or issued by administrative agencies may advance important public interests. However, they need to be accompanied by financial resources for implementation. In many instances, the governmental entity issuing the mandate fails to provide the necessary resources, leaving counties to resort to general revenues raised from property taxes. Further, local communities are not being granted the opportunity to weigh the benefits against the increased tax burdens to implement state and federal mandates.
3COUNTIES ARE ADJUSTING TO NEW FISCAL CHALLENGES ON THE HORIZON. Several developments are challenging local fiscal conditions across the nation.
MARIJUANA LEGALIZATION. In 25 states and the District of Columbia (33 states following the November 2016 election), marijuana legalization promises to increase the flow of revenue into state coffers. However, costs associated with potential substance abuse problems (such as behavioral health, family services and law enforcement) may prevent counties from receiving a net financial benefit from this new source of revenue. Only five states (Calif., Colo., N.Y., N.C., Wash.) have revenue sharing agreements with counties for excise taxes on marijuana. This revenue sharing follows one of two models. First, the state of Washington shares a small portion of the excise tax with local governments opting to allow sale of marijuana for recreational purposes within their jurisdiction.19 Second, Colorado shares a portion of marijuana sales revenue only with the localities that have not approved recreational marijuana use and sale; these funds are intended to address local impacts of marijuana legalization from neighboring jurisdictions. In addition, Colorado granted counties the ability to collect their own excise taxes on retail marijuana sales with no rate limitation.20 At the same time, counties in all these states face the possibility of increasing expenses related to issues such as substance abuse or driving under the influence.
OIL, NATURAL GAS AND COAL PRODUCTION. The oil and natural gas production boom of the last 20 years brought an influx of revenue to counties in 14 states, which receive a portion of the severance taxes from oil and natural gas production. (See Map 7). The sharp drop in energy prices since mid-2014 is now resulting in less revenues for oil and gas counties (See Chart 3). For example, the revenues received by La. parishes from a state severance tax dedicated to counties declined by two-thirds between 2012 and 2015.21 Oil production taxes comprise the majority of state funding to Alaska’s boroughs; the decline in oil prices has forced the state to cut this funding to boroughs by half as of 2016.22 Tax revenue from coal production is also on the decline. West Virginia counties are receiving less funding from coal severance taxes, oil and gas severance taxes. Kentucky funding from state coal severance tax to counties has dropped 60 to 80 percent in 2016 compared to a decade ago.23
MAP 7.
STATE OIL AND GAS FUNDING FOR COUNTIES
AS OF NOVEMBER 2016
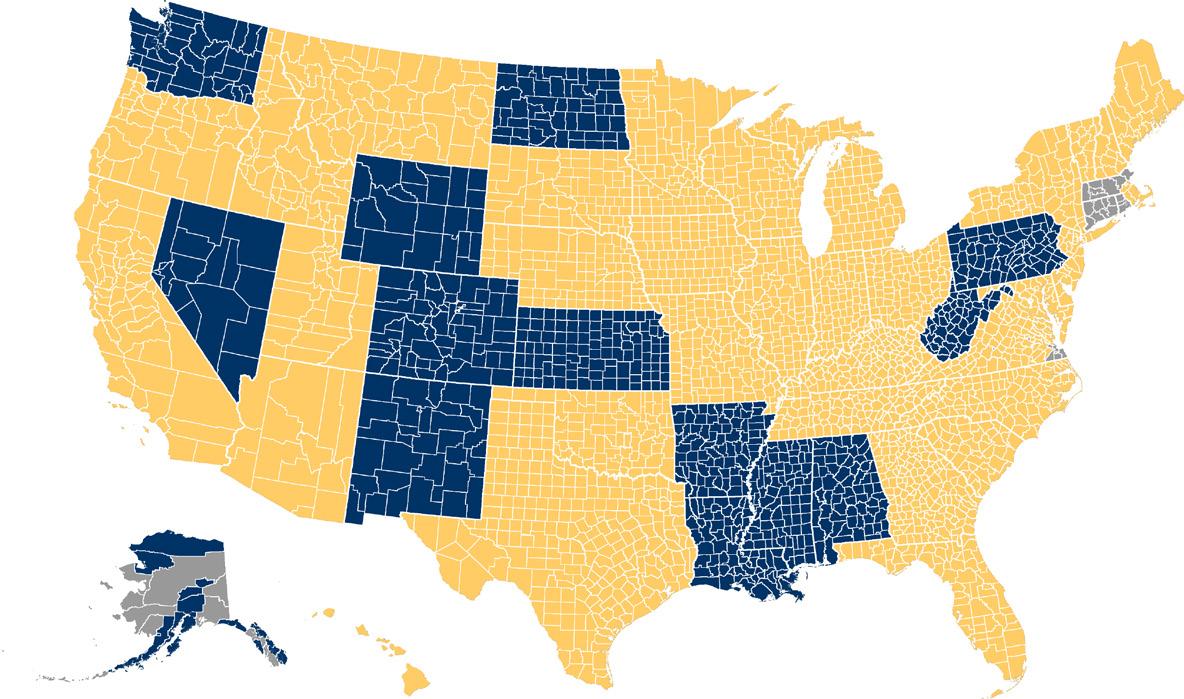
Does Not Receive Funding
Receives Funding
Note: Conn., R.I., and parts of Mass. have counties or county-equivalents with no county governments (marked in grey on the map). Source: NACo interviews with state associations of counties and state and county officials in each of the 48 states with county governments, research of state statutes, tax codes and local government finance literature.
SHARING ECONOMY. County tax systems have not integrated yet the sharing economy developments. Rideshare companies such as Uber and Lyft are matching individual drivers with passengers. Airbnb and GuestHouser enable private homeowners to rent their residences overnight directly to individuals through online booking. According to the interviews with the state association of counties and other officials, counties in nine states are experiencing a fiscal impact from home sharing. Overall, 81 percent of counties collect occupancy taxes and those counties that largely rely on tourism may be significantly affected by home sharing arrangements.
DARK STORES. Counties in at least 12 states are confronting valuation and assessment issues, including valuation appeals, due to the “dark store” method of assessing big-box stores. This method values currently operating retail store locations for tax purposes as if they were vacant and closed; proponents argue that this real estate could not be sold near the cost of construction, since these stores were built out for particular purposes. Since the assessment of a closed location is far lower than that of an operational facility, property tax revenue generated from operating big box store is significantly diminished with this valuation method.
Owners of this type of commercial real estate have achieved varying degrees of success litigating this matter in court, often by arguing the valuation method conflicts with statutory law. In October 2016, the U.S. Supreme Court refused Rite Aid Corp.’s petition for certiorari challenging property valuations of two N.Y. retail locations; the towns valued the locations based on the drugstore leases rather than using a dark store method.24 In May 2016, the Michigan Court of Appeals reversed a ruling by a tax tribunal held in favor of retailer Menard. The court held that the tax tribunal had “made an error of law and its decision was not supported by competent, material and substantial evidence” in allowing the dark store valuation method to apply.25
The state of Michigan is considered to be a “founding father” of dark store cases. Since 2013, Mich. counties have refunded approximately $78 million in property taxes related to dark store valuations. In Oakland County, Mich., a Target store once valued at $80 per square foot had its assessed value reduced to $30 after the county lost the assessment appeal. In Midland County, Mich., another Target’s assessed value was slashed from $66 per square foot to just $30 as well. Although various pieces of legislation have been introduced, none yet appear viable.
Counties often lack the human resources needed to challenge these valuations in court, even if financially possible. For instance, until October of 2016, Ala. state law required the local district attorney to handle all ad valorem tax cases within their respective district. Recently passed state legislation permits county boards to retain outside counsel in property tax appeals. Funding is derived from the county’s reappraisal budget.26
Counties can also take measures to prevent “dark store” appeals. For example, some counties in Ga. issued ordinances prohibiting deed restrictions and requiring big box stores to demolish the building upon discontinuation of retail use.27 One item on Wisconsin’s county legislative agenda for 2017-2018 in the taxation and finance arena is “Amend property tax assessment to close the ‘dark store’ loophole.” Counties recognize that this loss in property tax revenue results in a higher tax burden for the other property owners in the county, reduced services or both.
These are just of the challenges facing counties given technological, behavioral and economic shifts. Marijuana legalization is far from a national norm, and the costs have not been fully assessed. Tax revenues from oil, natural gas and coal production are particularly volatile due to market pricing and also potential regulatory impediments. Integrating the sharing economy into the tax system is still in an incipient form. The “dark store” valuation appeals are on the rise and spreading throughout the country. Counties are alert at rising issues and active in providing solutions.
4COUNTIES ARE PURSUING VARIOUS SOLUTIONS TO ENSURE QUALITY SERVICE DELIVERY DESPITE FISCAL CONSTRAINTS.
These partial solutions include service delivery sharing, special districts, constitutional changes and alterations of maintenance schedules.
Service Delivery Sharing. Counties throughout the country partner with cities, other local governments, other counties, nonprofit organizations and the private sector to deliver high-quality services to their residents in a cost efficient manner. The purpose and design of these partnerships varies; but with decreased state funding and increased requirements for counties, sharing services can play a vital role in delivering services. For example, Iowa counties are part of more than 23,000 agreements with other local governments for service delivery ranging from ambulance services to public libraries. But numerous other examples abound, including the following:
• Some N.C. cities and counties share 911 services. Others engage in city/county partnerships for sewer infrastructure upgrades.
• Nevada’s Carson City and some neighboring counties have partnered together to create a crosscounty health district.
• Kansas’ 105 counties share 27 community mental health centers.
• New Jersey’s city of Camden turned to Camden County to fight a crime epidemic. The county took over the city police department, creating a county-wide police force. By leveraging county resources, reduced murder rate by half in two years.
• In Neb., some counties co-developed a regional juvenile detention center for counties to hold inmates for other counties. Other Neb. counties created joint public agencies with cities or other governmental entities to develop fairgrounds, arenas or water redevelopment projects.
• Some Ky. counties partnered to create regional industrial parks, funded by their coal severance taxes.
Others created regional recycling centers in partnership with nonprofit organizations and neighboring counties. In central Ky., 17 counties have a regional recycling center. Moreover, Ky. counties partner to build and maintain county jails.
SPECIAL DISTRICTS: Special districts function administratively and fiscally independent from counties, but the county ultimately remains fiscally accountable for the district. Because taxes and fees imposed by special districts are not typically subject to county revenue limitations, they represent one solution to the fiscal impasse; however, these special districts can confuse citizens, are removed from full oversight and may add layers of bureaucracy.
Key Terms Used in this Study
SPECIAL DISTRICT: Taxing districts created by county governments or other governing bodies. Special districts function administratively and fiscally independent from county governments, although the county ultimately remains fiscally accountable for the district.
Thirty-seven (37) states grant counties the authority to create and/or manage special districts to fund specific services (See Map 8). In 22 of the 37 states, counties must obtain voter approval to create a special district.
MAP 8.
COUNTY AUTHORITY OVER SPECIAL DISTRICTS
AS OF NOVEMBER 2016
No Authority Over Special Districts

Authority Over Special Districts With Voter Approval
Authority Over Special Districts Without Voter Appeal
Note: Conn., R.I., and parts of Mass. have counties or county-equivalents with no county governments (marked in grey on the map). Source: NACo interviews with state associations of counties and state and county officials in each of the 48 states with county governments, research of state statutes, tax codes and local government finance literature.
Most commonly, special-purpose districts levy a separate property tax from the county to fund specific services, which can be as narrow or as broad as state statutes allow. For instance, S.C. counties may create special districts for libraries, water treatment, hospital and medical care, elections and economic development. Texas special districts complement county services. For example, Texas counties provide indigent health care in areas without a hospital district. Of special note, more than 1,000 special districts in Idaho created through referenda finance highways, firefighting, ambulance services, sewer and libraries.
CONSTITUTIONAL OPTIONS: Alabama counties have largely avoided unfunded mandates because a 1998 amendment to the Ala. Constitution requires a two thirds approval of any such mandate by the state legislature; furthermore, the state cannot enforce the mandate until the next fiscal year.
These varied solutions are enabling counties to enhance service delivery in a cost effective manner. Shared service provisions foster an enduring lean efficiency by eliminating government redundancy. Legislative and constitutional actions are also bold options to deter the allure of state unfunded mandates on counties. Lastly, special districts are a widely available mechanism for funding specific services beyond the state imposed revenue limits. Counties are using a combination of these tools to mitigate fiscal pressures.
Counties face a daunting problem. In most states, restrictions and limitations on revenue sources inhibit the responsiveness of counties to the demands of local residents.
Further complicating the financial health of counties is the growing volume of unfunded state mandates ranging from process guidelines to hefty demands on service provisions. In some cases, the state seemingly demands the impossible: fulfillment of the mandates while prohibiting counties from even developing revenue streams to pay for these mandates on their own. Adding further complexity to these pressures are the oft-incongruent demands of the electorate; the clamor for more expansive services occurs simultaneously with an insistence for a lightened tax burden.
Both the state and federal governments must be more cognizant of the financial pressures created by unfunded mandates. Prudence of a mandate cannot be inferred solely by the constitutionality of that mandate. Counties need the state and the federal governments to provide full funding to cover the compliance costs of the mandates they impose. Likewise, increased county autonomy regarding revenue generation and service provisions would relieve some of the fiscal pressures. Continued partnership with state and federal governments is essential to counties’ ability to effectively and successfully support thriving communities across the country.
Prudence of a mandate cannot be inferred solely by the constitutionality of that mandate. Counties face a daunting problem. In most states, restrictions and limitations on revenue sources inhibit the responsiveness of counties to the demands of local residents.

NATIONAL ASSOCIATION of COUNTIES | NOVEMBER 2016
1 National Association of Counties, “Why Counties Matter,” available at http://www.naco.org/sites/default/files/documents/CountiesMatter_brochure.pdf. 2 Emilia Istrate and Daniel Handy, “The State of County Finances: Progress Through Adversity,” NACo Trends Analysis Paper Series, Issue 6, October 2016, available at http://www.naco.org/sites/default/files/documents/2016%20County%20Finance%20Report_10.07.16.pdf. 3 Based on an analysis of the 2013 audited county financial statements of 2,112 counties in 45 states and the District of Columbia. 4 Emilia Istrate and Daniel Handy, “The State of County Finances: Progress Through Adversity,” NACo Trends Analysis Paper Series, Issue 6, October 2016, available at http://www.naco.org/sites/default/files/documents/2016%20County%20Finance%20Report_10.07.16.pdf. 5 See state profiles for state level data on property tax disbursements and state specific sources. 6 Figures derived by calculations based on NACo interviews with state associations. Number reflect values from differing fiscal years, dependent on state. 7 Ibid. 8 Emilia Istrate and Daniel Handy, “The State of County Finances: Progress Through Adversity,” NACo Trends Analysis Paper Series, Issue 6, October 2016, http://www.naco. org/sites/default/files/documents/2016%20County%20Finance%20Report_10.07.16.pdf. 9 Vermont counties have no independent authority to levy property taxes. Instead, the state of Vt. and its towns collect all local taxes, disbursing a portion of this revenue to counties. 10 .New Hampshire counties do not have the authority to levy any taxes on their own. Instead, municipalities levy and collect all taxes. The county convention determines what proportion of municipal tax revenues the towns must pay the county, and counties issue warrants annually to the towns within county borders to provide these funds. 11 Wyoming County Commissioners Association, interview response, March 2016. 12 Alaska Taxable 2015 https://www.commerce.alaska.gov/dcra/dcrarepoext/Pages/AlaskaTaxableDatabase.aspx 13 Kansas will be the 30th state after implementation of a levy limit effective January 1, 2017. 14 Association of Arkansas Counties, interview response, March 2016. 15 State of Minnesota, Department of Revenue, available at http://www.revenue.state.mn.us/propertytax/factsheets/factsheet_12a.pdf. 16 New York Association of Counties, interview response, April 2016. 17 Emilia Istrate and Daniel Handy, “The State of County Finances: Progress Through Adversity,” NACo Trends Analysis Paper Series, Issue 6, October 2016. 18 New Hampshire counties do not have the authority to levy any taxes on their own. Instead, municipalities levy and collect all taxes. The county convention determines what proportion of municipal tax revenues the towns must pay the county, and counties issue warrants annually to the towns within county borders to provide these funds. 19 Washington State Association of Counties, interview April 2016. 20 Colorado Counties, Inc., interview March 2016. 21 Police Jury Association of Louisiana, interview May 2016. 22 Alaska Municipal League, interview March 2016. 23 Kentucky Association of Counties, interview April 2016. 24 Rite Aid Corp. v. Huseby, U.S., No. 16-36, petition for certiorari denied October 3, 2016. 25 Menard, Inc. v. City of Escanaba, number 325718, before the State of Michigan Court of Appeals. 26 Association of County Commissions of Alabama, correspondence with NACo. 27 Association County Commissioners Georgia, interview March 2016.
ACKNOWLEDGEMENTS:
The authors want to thank the state associations of counties, state and county officials in each of the 48 states with county governments that provided essential information and comments for the study and the individual state profiles. Without them, this entire project would not have been possible. A special thanks goes to Bill Peterson, Executive Director of the Iowa State Association of Counties, and Doug Hill, Executive Director of the County Commissioners Association of Pennsylvania, who both provided substantive comments on a draft of the report. Within the National Association of Counties, we are grateful to Mike Belarmino, Matt Chase, David Jackson, and Brian Namey who made thoughtful and insightful contributions along the way. The authors also thank Dan Handy and Ricardo Aguilar for research assistance, Leon Lawrence III and Katy Solomon for graphics design, and Coleman Davis for designing the webpage of the report.
FOR MORE INFORMATION, CONTACT:
Research Department NATIONAL ASSOCIATIONNational Association of Counties of COUNTIES | NOVEMBER 2016 research@naco.org

Electronic
please remember that email is not the place to carry out or respond to a personal attack.
If you need to get someone’s attention, opt for making the text bold, but use it sparingly. Oh, and let’s not forget dreaded text message abbreviations like “u” or “ur” instead of “you” or “your.” I don’t even allow myself to use these in a text let alone an email.
Keep paragraphs short. Email is not read in the same way as a print letter, newspaper or novel; it is quickly scanned rather than read in-depth. Make each paragraph just a couple of lines long so the recipient can easily scan the email to get your message.
Occasionally, email will need to be more complex. Maybe you have three very important points you need to get across. If that’s the case, separate each idea into a distinct paragraph, then number them 1, 2 and 3. You can also announce in the beginning, “Please see the following three points…” If you don’t do this and instead blend the three ideas into one long blurb, the recipient may quit reading before the end and only respond to one of your points.
Commandment 9 “Thou shalt remember that it is written in stone.” The problem with writing as opposed to communicating verbally, is that once it’s sent electronically you can’t take it back. How many times have you hit “Send” and said, “Why
Continued From Page 22 <<<
did I do that?” Plus, writing allows the content to be reviewed and analyzed over and over again, as opposed to a statement in a conversation. And don’t write anything you don’t want someone else seeing. The potential is there for your message to be shared, either purposefully or accidentally.
These commandments are not of biblical proportion — there are not even 10 of them. But they do provide some good guidance for electronic communication.
If you want to be a good communicator, it’s best to communicate with people in the medium they prefer — and through more than one. Also, remember communication is a two-way street. It’s important to make sure you are understood by your intended audience.
I can’t guarantee you’ll become a master communicator if you follow these electronic communications commandments, but your correspondence will be more appreciated by your coworkers, legislators, family and friends.
Studies have found that most of us think we are communicating more effectively via email and text than we actually are. Which means we need to adhere to some or all of these commandments to effectively communicate so we won’t be saying, “I know that you think you understand what you thought I said, but I’m not sure you realize what you heard is not what I meant.”
Advertiser Resource Index
AAC Risk Management . . . . . . . . . . . . . . . . . . . . . . . . . . . . . . . . . . . . . . . . . . . . . . . . . . . . . . . . . . . . . . . . . . . . . . 29 AAC Workers’ Compensation Trust . . . . . . . . . . . . . . . . . . . . . . . . . . . . . . . . . . . . . . . . . . . . . . . . . . . . . . . . . . 35 DataScout . . . . . . . . . . . . . . . . . . . . . . . . . . . . . . . . . . . . . . . . . . . . . . . . . . . . . . . . . . . . . . . . . . . Inside Front Cover Apprentice Information Systems, Inc . . . . . . . . . . . . . . . . . . . . . . . . . . . . . . . . . . . . . . . . . . . . . . . . . . . . . . . . . . . 20 Crews and Associates . . . . . . . . . . . . . . . . . . . . . . . . . . . . . . . . . . . . . . . . . . . . . . . . . . . . . . . . . . . . . . . . . . . . . . . . 3 Custom Pavement Maintenance and Safety . . . . . . . . . . . . . . . . . . . . . . . . . . . . . . . . . . . . . . . . . . . . . . . . . . . . . . 8 Guardian RFID . . . . . . . . . . . . . . . . . . . . . . . . . . . . . . . . . . . . . . . . . . . . . . . . . . . . . . . . . . . . . . . . . . . . . . . . . . . . . 17 Ergon Asphalt & Paving . . . . . . . . . . . . . . . . . . . . . . . . . . . . . . . . . . . . . . . . . . . . . . . . . . . . . . . . . . . . . . . . . . . . . . . 4 Financial Intelligence . . . . . . . . . . . . . . . . . . . . . . . . . . . . . . . . . . . . . . . . . . . . . . . . . . . . . . . . . . . . . . . . . . . . . . . . 13 Nationwide Insurance . . . . . . . . . . . . . . . . . . . . . . . . . . . . . . . . . . . . . . . . . . . . . . . . . . . . . . . . . . . . . . . . . . . . . . . 28 Rainwater Holt & Sexton, PA . . . . . . . . . . . . . . . . . . . . . . . . . . . . . . . . . . . . . . . . . . . . . . . . . . . . . . . . . Back Cover Southern Tire Mart . . . . . . . . . . . . . . . . . . . . . . . . . . . . . . . . . . . . . . . . . . . . . . . . . . . . . . . . . . . . . . . . . . . . . . . . . 75 Tax Pro . . . . . . . . . . . . . . . . . . . . . . . . . . . . . . . . . . . . . . . . . . . . . . . . . . . . . . . . . . . . . . . . . . . . . . . . . . . . . . . . . . . 10
This publication was made possible with the support of these advertising partners who have helped to underwrite the cost of County Lines. They deserve your consideration and patronage when making your purchasing decisions. For more information on how to partner with County Lines, please call Christy L. Smith at (501) 372-7550.

