
20 minute read
Asia Floor Wage Alliance’s Survey Results & Living Wage Formulation 2022


2.1. Introduction
The preceding chapter presented the theoretical background for the Asia Floor Wage Alliance (AFWA) concept and methodology of a living wage. As mentioned earlier, AFWA periodically updates Asia Floor Wage (AFW) (living wage figure) throughfood basket surveys in production countries across Asia, and more recently, comprehensive consumption surveys. This chapter primarily focuses on the findings of the consumption survey conducted in 2022 and the subsequent updated AFW figure declared by AFWA.
Advertisement
The AFW concept is the sole women-centred living wage concept for garment workers across borders. The theoretical significance of a cross-border living wage formulation, particularly within brand-driven garment global supply chains, has been discussed in detail in the previous chapter. Operationally, this idea was developed as a strategy in the context of garment global supply chains (AFWA, 2007) by trade unions that faced the limitation of mounting a struggle for living wage within a nation-state context that is integrated into a global supply chain. AFW was conceived by trade union leaders, labour rights and human rights activists from various countries, especially in Asia, to combat detrimental race to the bottom prevalent in the global garment industry which perpetuated poverty-level wages.
A series of meetings and communications took place since 2005 to bring labour leaders together, with living wages for garment workers at the centre of the discussion (AFWA, 2017). All these processes facilitated the development of the Asia-centred, union led, industry-wide AFW living wage concept which was inspiring and historic because “for the first time a wage consensus was being sought across national borders and posed as a demand within a global industry” (AFWA, 2008; Bhattacharjee, Roy, and Kuruvilla, 2015 p.1). From these meetings and discussions, the AFWA was founded and the year 2007 was set as its founding year.
The AFW concept was developed as a regional and differentiated wage formulation demand that would serve as a “minimum living wage” in garment industry manufacturing in Asia (AFWA, 2007). In other words, AFW would be the floor for a living wage, not the ceiling. It adopts a women-centred perspective by considering a single-earner family with specific earner-dependent ratio. This approach includes the unpaid household work, including carework which is crucial for a family and is predominantly carried out by women (AFWA, 2009). It is calculated based on food and non-food expenditures required to support a worker’s family with three consumption units (1 consumption unit is equal to 1 adult or 2 children) (AFWA, 2008). The AFW concept uses the World Bank’s purchasing power parity (PPP) dollar as a common currency to express a regional or cross-country floor for living wage.
Food is the core and anchoring component in AFW formulation, and the previous chapter provides the theoretical background for this. Two elements facilitate making food the basis of calculating a living wage. First, food is globally recognised as the most effective element for measuring comparable need across countries. The Food and Agricultural Organisation (FAO) method uses caloric (Kcal) content as a measure for food requirements, helping to overcome the differences in diets across countries and regions. Second, each country usually has a government-defined specific standard food basket that provides a balanced diet and adequate protein. Both caloric measures and standard food baskets contribute to an effective calculation of food consumption.
AFW relies on Engel's Law, whose validity continues till present time. Engel's law establishes that food costs are linearly correlated with income, while non-food costs are non-linearly correlated with income. Based on this, the AFW assumes linearity between the cost of food and the earned wage of workers, and translates it into a ratio of food and non-food expenses in the wage determination. In other words, once food cost is determined, the non-food cost can be expressed as a factor of food cost. Together, these two components determine the wage or income.
The food cost is based on the caloric value of a daily food basket for an adult worker involved in physical work and is set at a standard of 3000 calories. This standard was based on the official basis for Indonesia’s KHL1 (governmental figure for living wage) which was considered the best regional standard at the time. The AFWA decision to use 3000 calories in 2008 exceeds the FAO recommendation for adequate calories and nutrients at 2330 calories per day (FAO, IFAD, UNICEF, WFP and WHO, 2022, p.181). This standard is supported by the ILO research on estimating the calorie requirement of a worker. ILO estimates a calorie requirement of 2950 calories per adult male worker (ILO, 2021, p.18). The AFW food basket differs across countries, but the total caloric amount is set at 3000 calories.
The non-food costs (e.g., housing, clothing, healthcare, reproductive health, fuel, transportation, education, etc.) have been simplified in the AFW as a factor of the food cost. In 2008, it was decided that the ratio of food to non-food to be an average of 1:1 or 50% each. In 2020, based on the government data, it was decided to adjust the ratio to 45:55. This ratio was then confirmed in the 2022 survey which is described below.
To estimate the food cost for a worker’s family, AFWA surveys garment workers using food baskets. AFWA collaborates closely with its union partners not only for data collection but also to determine the composition of the food basket in the country. Unlike non-food expenses, which vary among nations, a diet's cost and composition are relatively consistent. The content of the food basket is computed based on calorie content and offers a reference point for contrasting food prices between nations.
The first food basket survey was conducted in 2008 in Bangladesh, India, Indonesia, China, and Sri Lanka. The data from this survey was used to estimate the Asia Floor Wage figure, which was published for the first time in 2009. Since then, AFWA has been periodically conducting food basket surveys and updating its figures.
1 Indonesia Ministry of Manpower Decree No. 81/1995 changed the term for components and type of needs to determine minimum wage from Minimum Physical Needs to Minimum Living Needs. The Decree also raised the standard of calories to determine minimum wage from 2500 calories to 3000 calories. In 2006, the term was changed again to Decent Living Needs (KHL) but kept 3000 calories standard. See: Arifin, 2018.
Table 2.1: Asia Floor Wage figures by year of publication
In 2021, AFWA decided to expand the food basket survey to a full consumption survey in order to understand the ratio of food and non-food expenditure. This survey aimed to document food and non-food costs of a worker's family. The following sections discusses the Household Consumption Survey which was used to estimate the AFW living wage figure for 2022.
2.2 Household Consumption Expenditure Survey
The AFW estimation for 2022 was based on an extensive Household Consumption Expenditure Survey (HCES) conducted across different garment producing countries. It was primarily conducted in the first quarter of 2022. It encompassed workers from seven garment producing countries: Bangladesh, Cambodia, Indonesia, India, Myanmar, Pakistan and Sri Lanka. The survey covered household level expenditure of food as well as non-food items. The survey covered the following aspects in each of the segments.
Table 2.2: Items covered in the Household Consumption Expenditure Survey 2022
2 Reference period refers to the period for which the information was asked from the respondents. For instance, the consumption and expenses for cereals were asked for a month so that the respondents give details for the last month of the survey.
The data was collected from the workers in the export-oriented garment factories in the seven countries. The survey covered 1686 workers from 206 factories. The selection of workers for the survey was based onspecific exclusion and inclusion criteria, asfollows: Worker (1) should be a worker in a garment producing factory for at least the past year, and (2) should be able to map out the household expenditure at the granularity which is required. The survey was conducted by the trade unions and other partnering organisations operating in the respective countries.
The unit of analysis of the survey is the household of the garment worker. The consumption survey primarily captures information related to household consumption. Additionally, we have also gathered some basic profile information about the workers to ensure that data is representative of those employed in the factories.
Table 2.3: No. of factories and workers surveyed across 7 countries
The HCSE has used a structured interview schedule to collect data on consumption levels. The tool was divided into six sections: (1) Basic profile of the worker, (2) Employment profile of the workers, (3) Food consumption and expenditure, (4) Non-food consumption and expenditure, (5) Possession of assets, (6) Housing and living conditions.
2.3. Living Wage Estimation Method for HCES
The living wage estimation method adopted in the present survey is similar to the previous years and is based on caloric consumption/ nutritional requirements. The expenses required for a benchmarked caloric consumption determine the estimation of living wages for food. Furthermore, the survey aimed to verify AFWA’s assumption regarding the ratio of the food and non-food expenses, which is 45:55 respectively, as well as the assumption of 3 consumption units. The detailed survey contributed to an improved level of specification and precision, and the results confirmed the previously held assumptions. The following steps explains the estimation method followed:
Step 1: The estimation is primarily based on AFWA’s existing basis of nutritional requirement of 3000 Kcal for an individual and for a family of three consumption units. The food consumption data collects the quantity of food consumed by each family for a month, from which we derive total calories consumed. Since the survey collects the family size, it gives us the per capita calorie consumption. The caloric content of each food item is adopted from the National Nutrition Databases, utilising the updated and available information. In cases where the information is not available, we used World Health Organisation (WHO) food and nutrition standards. This further helped us calculate per capita caloric intake for a month.
Step 2: HCES also captured per capita expenditure on each of the food items. This facilitates the calculation of per capita expenditure on food consumption. Thus, per capita caloric consumption and per capita expenditure help us estimate per caloric expenditure. The per caloric expenditure leads to the estimation of food expenditure for 3000 Kcal for a family of three consumption units, which is one part of the living wages.
Step 3: HCES collected data on non-food expenditure, which facilitated the calculation of the actual ratio of food and non-food expenses.
Step 4: The sum of the estimated food and non-food expenditure gives us living wages in LCU. Respective country PPP$ conversion factors from World Bank sources are used for converting the same to PPP$. This facilitates a process of cross-border comparison and the development of a spectrum of countrywise living wages expressed in PPP$ across Asian production countries.
Step 5: The AFWA International Steering Committee, and in particular all trade union leaders, meet to discuss the country-wise spectrum of living wages in PPP$. This spectrum is always within an acceptable range of differences and can be discussed to arrive at an average regional Asia-level living wage figure based on consensus. This figure becomes the AFW (expressed in PPP$). The reverse conversion of the regional AFW living wage figure at PPP$ to the respective country's LCU gives the country-level living wage figures.
Table 2.4: Summary of key concepts and variables
Living Wage= Food Expenses for Family of 3 @3000Kcal (esti) + Non Food Expenses (esti)
Step 1 and 2:
Food Exp (esti)=Expenditure per Calories * 3000*30*3
Expenditure per calories= ������������������������������������������������ ������������������������������������������������������
Step 3:
Non Food Exp (esti)= FoodExp(esti) [FoodExp(esti)∗RatioofFoodExpinTotalConsumption] RatioofFoodExpinTotalConsumption
Ratio of Food and Non-Food Expenditure = FoodExp(actual)+NonFoodExp(actual) FoodExpenses(actual)
Living Wage= Food Exp (esti)+ Non Food Exp (esti)
Step 4:
Living Wage @PPP$= Living Wage*PPP Conversion Factor
Regional Living Wage= Average of Living Wages at PPP$
Country wise Living Wages= Regional Living Wages at PPP$ * PPP Conversion factor of the country
Food Exp (esti) is the estimated food expenditure at Living Wages, i.e., food expenditure at 3000 Kcal consumption per day for 3 consumption units
Expenditure per calorie is the expense incurred in consuming 1 calorie of actual food consumption of the workers. It is calculated as a ratio of per capita food expenditure to per capita calorie consumption.
Non Food Exp (esti) refers to the estimated non-food expenses at Living Wages. This is derived from the Food Exp (esti) and the ratio of food and non-food expenditure. This ratio is derived from the actual per capita values from the HCES.
2.4. Basic Profile of Workers
Women workers constituted the majority of the survey participants, specifically those between the ages of 18 to 49 years. They work in various roles such as tailors (sewing), checkers, helpers, cutters, and in other categories. On average, these women reside in a family of 2 to 6 people, with the majority of the families having children below 6 years and between 6-18 years.
In all surveyed countries except Pakistan, women constituted the majority of the respondents: 70% in Bangladesh, 82% in Cambodia, 70% in India, 74% in Indonesia, and 80% in Sri Lanka. The only exception was Pakistan, where 71% of the respondents were men. This is in accordance with the gender distribution in the industry.
Source: Primary Data
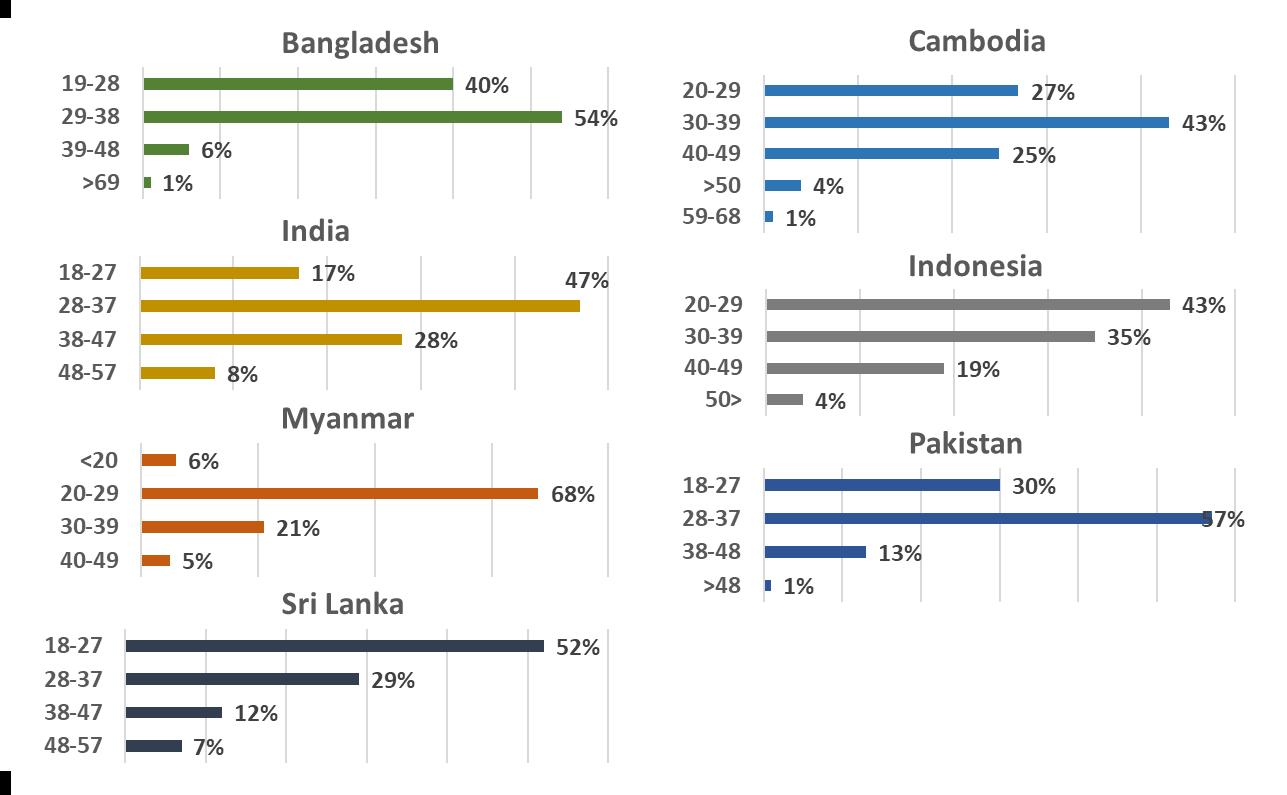
It is noteworthy that in Bangladesh, 90% of the workers in the industry are below the age of 38 years, with the largest proportion (54%) in the age category of 29 to 34 years. In Cambodia, over two-thirds (70%) of the workers are below the age of 39 years, and only 5% of workers are above 50 years of age. In India, almost two-thirds (64%) of the workers are below the age of 38 years, with 47% of workers falling in the age category of 28 to 37 years. In Indonesia, nearly four-fifths (78%) of the workers are below the age of 39 years, and 43% of workers are below 29 years. In Myanmar, almost four-fifths (74%) of the workers are below the age of 29 years, and only 5% of workers fall above 40 years of age. In Pakistan, more than four-fifths (87%) of the workers are below the age of 37 years, and 30% of workers are below 27 years. Lastly, in Sri Lanka, over four-fifths (82%) of the workers are below the age of 37 years, with 52% of workers falling below 27 years. This implies that the industry predominantly employs young workers. This raises significant concerns regarding the future prospects of women workers after they are pushed out of the industry at middle age, often with limited social security and no savings due to having earned only poverty level minimum wages.
Source: Primary Data
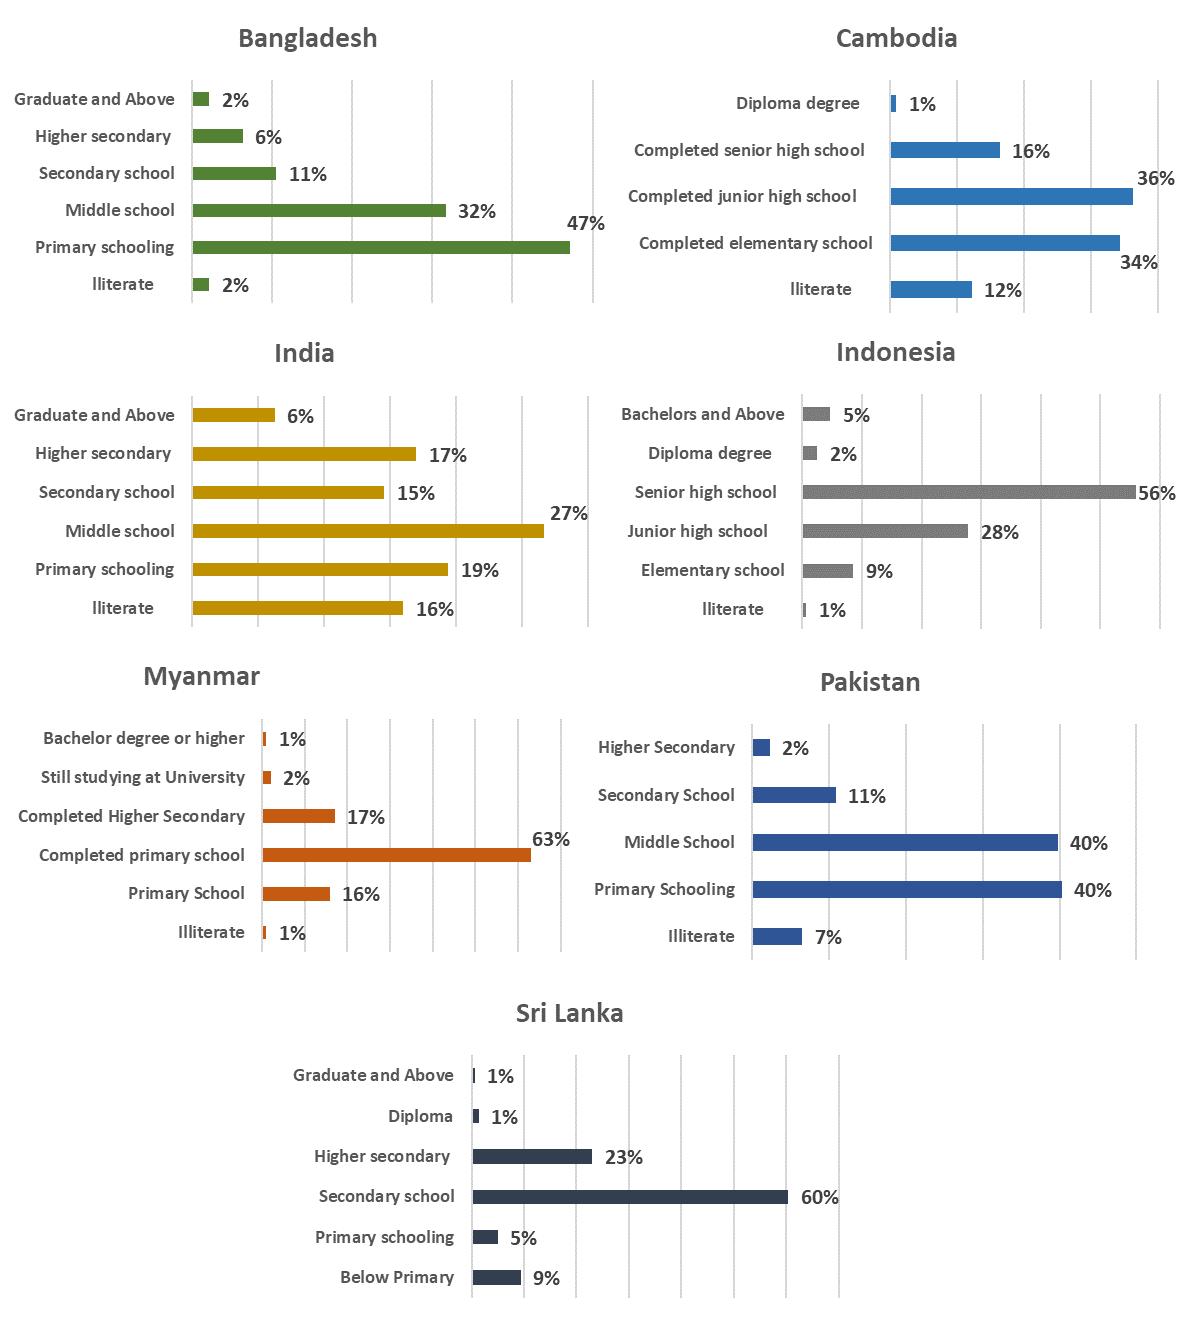
When it comes to education attainment, the data reveals the following trends. In Bangladesh, nearly half of the workers have completed primary education, and only one-tenth of the workers are educated above higher secondary. In Cambodia, approximately four-fifths of the workers have education only up to junior high school, with 12% among them being illiterate, and 34% have completed only elementary school education. In India, around one-third (35%) of the workers have primary level education, and even within this group, 16% of the workers reported being illiterate; and only 6% of the workers reported having an education beyond school. In Indonesia, more than one-third (38%) of the workers have education up to junior high school, and only 7% of the workers reported having any education beyond school. In Myanmar, four-fifths (80%) of the workers have education only up to primary school level, and even among them, 17% have not completed primary level education. In Pakistan, almost half (47%) of the workers have education only up to primary school, and 7% of the workers reported no education at all, none of the workers reported to have attained any kind of higher educational status. In Sri Lanka, the majority (60%) of the workers have completed secondary schooling, and only 2% reported having any education beyond school. These findings highlight that the labour-intensive garment industry allows for low-skill employment, and it attracts a vast labour pool with limited education and skills. However, without opportunities for upskilling and meaningful education, garment workers remain trapped in this poverty-wage industry with limited prospects for advancement towards a life of dignity.
Source: Primary Data
The family size of the workers differs across countries. In Bangladesh, the average family size of the workers is 4.4, while in Cambodia, India, Myanmar, and Sri Lanka, the average family size of the workers is 4. In Indonesia, the average family size of the workers is 3.6. The largest family size is 5 in Pakistan. In terms of standard adult consumption units, this family size translates into 3 consumption units for all countries, except Pakistan where it is 4 consumption units. Therefore, considering 3 as an average number for consumption units in production countries in Asia, is reasonable and legitimate.
Source: Primary Data
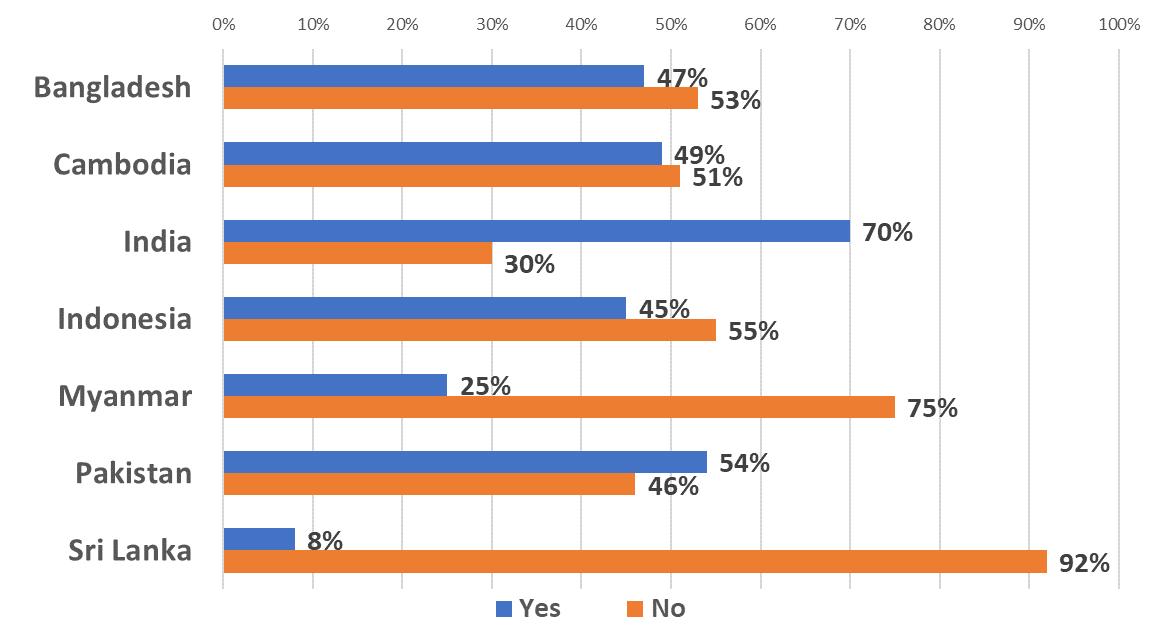
It is crucial to note that in Bangladesh, Cambodia, India, Indonesia, and Sri Lanka, 56% of workers have at least one child between 6-18 years. Similarly, this is the case for 48% of workers in Myanmar, and 46% in Pakistan. In terms of households with children below the age of 6, the figures are as follows: Bangladesh and Cambodia (49%), India (70%), Indonesia (45%), Myanmar (25%), Pakistan (54%), Sri Lanka (8%). This indicates that garment workers, who are predominantly women, bear significant childcare responsibilities, as care work remains disproportionally skewed towards women.


Source: Primary Data
2.5. Employment Profile
The survey aimed to include workers from the production floors. In Bangladesh, workers employed in tailoring/sewing form the majority (68%) of the respondents, 58% in Cambodia, 50% in India, 54% in Indonesia, 79% in Myanmar, 42% in Pakistan, and 36% in Sri Lanka. Others are helpers, checkers, cutters, or in ironing.

Figure 2.7: Job Role
Source: Primary Data
In Bangladesh, close to two-thirds (63%) of the workers reported being in regular or permanent employment, while the remaining workers are in temporary/casual/contract employment. In Cambodia, approximately four-fifths (74%) of the workers reported being Unspecified Duration Workers (UDC), while the rest are Fixed Duration Contracts (FDC) workers. In India, over three-fourths (74%) of the workers reported being in regular or permanent employment, with the remaining in temporary/casual/contract employment. In Indonesia, more than two-thirds (68%) of the workers reported being Unspecified Term Contract (UTC) workers, and 26% were Fixed Term Contract (FTC) workers, and the rest were in temporary/casual/contract employment. In Myanmar, almost all (96%) of the workers reported being in regular employment. In Pakistan, more than two-thirds (69%) of the workers reported being temporary or casual workers, while only 25% were regular/permanent workers, and the remaining were in contract employment. In Sri Lanka, more than two-thirds (78%) of the workers reported being regular/permanent workers, 25% were temporary/casual workers, and the rest were man-power workers (8%). It is important to note that the higher percentages of workers in regular or longer-term contracts can be attributed to the bias in the survey, as it was conducted primarily by unions. It demonstrates that union members fare better, and these results may not fully reflect the reality of the precarious nature of the industry’s employment relationships.
Source: Primary Data
2.6. Income Status of the Family
In Bangladesh, nearly three-fourth of the workers have more than one person working in the family, and around 26% of workers reported being the sole earners of the family. In Cambodia, almost half of the workers belong to a two-person family, and around 45% of workers reported being the sole earners of the family. In India, more than two-thirds (67%) of the workers have more than one person working in the family, and around 33% of workers reported being sole earners of the family. In Indonesia, more than two-thirds (64%) of the workers have more than one person working in the family, and around 36% of workers reported being the sole earners of the family. In Myanmar, close to three-fourths (71%) of workers have at least two persons working in the family, and around 29% of workers reported being the sole earners of the family. In Pakistan, more than half (57%) of the workers are the sole earners of their families. In Sri Lanka, almost more than two-thirds (61%) of the workers have more than one person working in the family, and around 39% of workers reported being the sole earners of the family.

Further, in terms of family income, the average reported in Bangladesh is BDT 24,137 while the average monthly individual wage is around BDT 10,821. In Cambodia, the average family income is reported to be KHR 156,0528, with an average individual monthly wage of around KHR 104,9072. The family income in India is reported to be INR 18,020 INR, with an average individual monthly wage of around INR 9999. In Indonesia, the family income is reported to be IDR 5,302,586, while the average individual monthly wage is around IDR 3,382,428. In Myanmar, the family income is MMK 426,520, PKR 33,213 in Pakistan, and LKR 58,897 in Sri Lanka. The average individual monthly wage in Myanmar is MMK 237,199; PKR 21,369 in Pakistan; and LKR 30,909 in Sri Lanka. This demonstrates the fact that more than one earner is required in the family, raising concerns about the lack of support for women workers’ who bear the double burden of household and care work at home.
Table 2.5: Income and earning members in the family
2.7. Food Consumption
The survey captured the pattern of food consumption by workers, focusing on both the nutritional value of the food consumed and the associated consumption expenditure. In Bangladesh, the workers reported a per capita consumption of 1950 Kcal/day at a cost of 120 BDT per day; 2521 Kcal/day at a cost of 3 USD per day in Cambodia; 2467 Kcal/day at a cost of 128 INR per day in India; 2148 Kcal/day at a cost of 28559 IDR per day in Indonesia; 1962 Kcal/day at a cost of 2213 MMK per day in Myanmar; 1921 Kcal/day at a cost of 130 PKR per day in Pakistan; 1834 Kcal/day at a cost of 271 LKR per day in Sri Lanka. The caloric figures raise extreme concerns as the consumption standards reported here are significantly below the international poverty standards. They depict a stark picture of the poverty and hunger prevailing in the industry due to the current wage structures.
Table 2.6: Income and per capita nutrition per day
Source: Primary Data
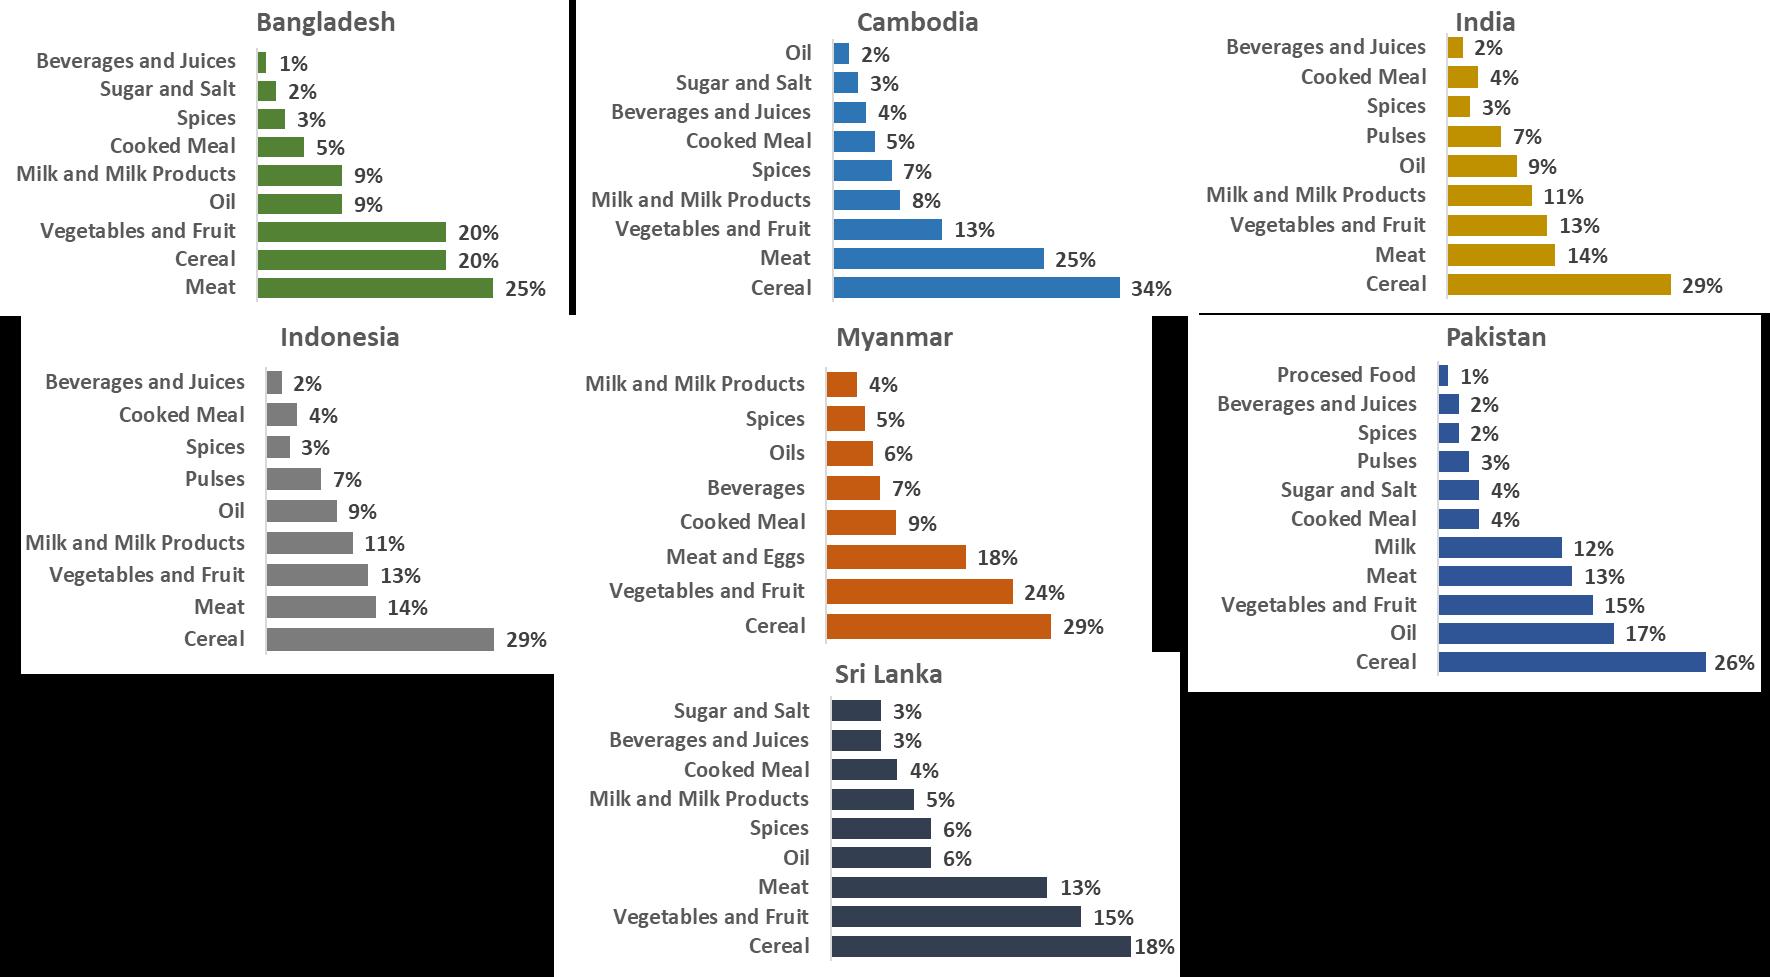
The share of nutrition in different food items consumed by workers and their families varies from country to country as seen in the following figures:

Figure 2.8: Share of food nutrition
Source: Primary Data
The below figure reports the share of expenditure in different food items which are consumed by the worker and their families:
Figure 2.9: Share of food expenditure in food items
Source: Primary Data
2.8. Non-Food Consumption
The survey collected data on the pattern of non-food consumption by workers. The non-food consumption is captured across six areas of consumption: footwear and clothing, educational and medical expenses, travel expenses, entertainment, services, and expenses on household consumables. The following graphs illustrate the share of expenditure in these six areas of non-food consumption among the workers.

Source: Primary Data
2.9. Income, Food and Non-Food Expenditure
The following figure compares the actual non-food consumption, monthly wages, and nonfood expenses estimated at living wages. It may be noted that the monthly wages of the workers are insufficient to meet even the basic non-food requirements of the families.
The data also reveals the actual average ratio of food and non-food consumption is 44:56, which is close to the decision made by AFWA in 2020 to adjust the ratio of food and non-food consumption from 50:50 (used since 2009) to 45:55.
2.10. Asia Floor Wage Estimates
Based on this data, taking into account the standards of 3000 calories, 3 consumption units, and the ratio of food and non-food at 45:55, the estimated Asia Floor Wage figures are as follows:
The Asia Floor Wage figure in PPP($) is 1600. This figure is then converted to local currency as follows:
2.11. Conclusion: Asian Overview
This chapter presents the methodology for estimating AFW living wages. Moreover, it offers a comprehensive overview of the status of living wages, the composition of expenditure and consumption baskets, and the working conditions in the garment manufacturing industries across Asian countries.
The table below shows a comparison between living wages, actual expenses3, and monthly wages4. The figures have been converted into PPP$ to ensure comparability.
Table 2.10: Monthly Wages, Actual Expenses and Living Wages
Source: Primary Data
Bangladesh (326 PPP$) reports the lowest wage figures followed by India (472 PPP$) and Pakistan (509 PPP$). Cambodia reports the highest wages at 704 PPP$ followed by Indonesia at 668 PPP$. A similar pattern can be observed, when considering the actual expenses incurred by the households.
However, in the case of living wages, Myanmar reports the highest at 1806 PPP$ followed by Cambodia (1776 PPP$) and Sri Lanka (1733 PPP$). On the other hand, Bangladesh and Pakistan report the lowest figures at 1219 PPP$ and 1276 PPP$ respectively.
Table 2 below shows the share of the workers’ current monthly wages to the actual expenses and to the living wages.
Table
2.11: Monthly wages as a share of actual expenses and living wages
Source: Primary Data
3 Actual expenses refer to the expenses incurred by the workers’ household as reported in the HCES survey described in this chapter
4 Monthly Wages here refer to the total wages received by the worker. It includes overtime wages, performance allowances and other benefits.
This comparison is primarily done to understand the inadequacy of the current wages and the gap between actual wages and the estimated living wage figures. It may be noted that in none of the countries are the wages of a single worker enough to cover even existing expenses, which are at poverty standards. Indonesia reports the highest wage share of actual expenses at 62%, followed by Cambodia at 60% and then India at 56%. In the case of wages as a share of estimated living wages, none of the countries report even 50%. Pakistan, Indonesia, and Cambodia report the highest at 40%, i.e., the existing wages of the workers are 40% of the estimated living wages for the respective countries. Here also, Bangladesh reports the lowest, which was also the case in the previous aspect.
Similarly, Table 2.12 below, shows that there also exists a systematic gap between minimum and living wages across Asian countries over time. Between 2014 and 2022, except for Bangladesh and Sri Lanka where the gap fell marginally by 2%, the gap has increased by 24% in India, 7% in Cambodia, and 26% in Indonesia. The prevailing legal minimum wages often act as a ceiling rather than a bottom line, and can be described as poverty-level wages as they tend to be below the subsistence level.
Table 2.12: Minimum vs Living Wage in Asia, 2014 and 2022
The comparative analysis conducted in this chapter across Asian countries bringsforth several insights. Despite the heterogeneous composition of the garment workforce in each country, a stark similarity is observed in the cost-of-living (or consumption) expenditures and the components of food and non-food items across Asia. This justifies the choice of Asia as the unit of analysis of a 45:55 ratio between food and non-food items, which allows for a regionally equivalent and consistent standard for estimating living wages.
Moreover, the composition ofthe garment labourforce exhibits similarity across Asia, including a high share of temporary, casual, or irregular employment, a predominance of women in the workforce ranging between 70%-85%, large family sizes or number of dependents, and a lack or inadequacy of social security benefits.
Finally, similarities can be observed in terms of the lack of quality of housing and living conditions for garment workers in the region. This includes the lack of asset ownership (assets owned are limited to household consumables like TVs, mobile phones, etc.), a predominance of rented housing or the lack of ownership of house or land, and limited access to sanitation facilities (shared use of toilets or access to clean drinking water) and healthcare infrastructure in urban areas.
This report highlights the continued deprivation of garment workers in terms of sustainable wages, economic or social mobility, skill acquisition, savings, and the accumulation of modest assets or wealth to be resilient to social and economic crises.
References:
Arifin, S. (2018). 20 Tahun Reformasi: Strategi Pemodal Menghadapi Kenaikan Upah Minimum. Majalah Perburuhan Sedane. Available from https://majalahsedane.org/20tahun-reformasi-strategi-pemodal-menghadapi-kenaikan-upah-minimum/ Asia Floor Wage Alliance (AFWA). (2007). Position Statement of Asia Floor Wage Alliance. Available from: https://asia.floorwage.org/wp-content/uploads/2022/01/AFW-PositionStatement-7-07.pdf
AFWA. (2017). Asia Floor Wage Alliance: A Short History at the Brink of Transition. Available from: https://asia.floorwage.org/wp-content/uploads/2022/01/A-Short-History-on-theBrink-of-Transition.pdf
AFWA. (2008). Asia Floor Wage Alliance: Public Launch Decision Statement. Available from: https://asia.floorwage.org/wp-content/uploads/2022/01/AFWHKG_DECISION_STATEMENT_8-08.pdf
AFWA. (2009). Perspective: Asia Floor Wage and Gender. Available from: https://asia.floorwage.org/wp-content/uploads/2022/01/AFW-and-Gender-PublicLaunch-2009.pdf
Bhattacharjee, A., Roy, A., Bhardwaj, K. (2015). Introduction. Towards an Asia Floor Wage: A Global South Labour Initiative for Garment Workers in Asia. Available from: https://asia.floorwage.org/wp-content/uploads/2022/01/Towards-an-Asia-Floor-WageNov-2015.pdf
FAO, IFAD, UNICEF, WFP and WHO. (2022). The State of Food Security and Nutrition in the World: Repurposing Food and Agricultural Policies to Make Healthy Diets More Affordable. Available from: https://www.fao.org/3/cc0639en/cc0639en.pdf
ILO. (2021). A Methodology to estimate the needs of workers and their families. Available from: https://www.ilo.org/wcmsp5/groups/public/ ed_protect/ protrav/ travail/documents/projectdocumentation/wcms_826326.pdf
