34 minute read
Women in Banking: Laurie Stewart


Laurie Stewart
CEO, Sound Community Bank Sequim, Washington
By Evan Sparks
Not far from the Strait of Juan de Fuca, between Washington state and British Columbia, the town of Sequim features a dynamic female leader: Sound Community Bank and its CEO, Laurie Stewart. A trailblazer for women in banking in Washington state, one of American Banker’s Most Powerful Women in Banking and now chair of the ABA, Stewart had a winding path to leadership — one forged by determination, generosity, openness to opportunity and a widening circle of family.
Laurie Stewart
An accidental banker While family has always come first for Stewart, banking was something she fell into accidentally. It was on Whidbey Island that she first got the idea that banking coud be more than just a job. She moved up the ranks to head teller, branch operations supervisor and the loan desk. She hit her first barrier when she asked to be promoted to an officer of the bank.
There was only one female bank officer in that location, and her boss told her that she shouldn’t wait to fill her shoes — the incumbent would have the job until she dies. Stewart chuckles as she recalls the conversation. “It’s really good I took his advice, because Jo Balda worked until she was 85, “ she says. “If I’d been waiting around for Jo’s job, I’d still be in Oak Harbor.”
Meanwhile Stewart learned all she could about banking completing her degree part-time. Her boss got her into a class for commercial lending officers by a ruse, knowing they wouldn’t welcome a woman as a student, she recalls. “He called the head office in Everett and said, ‘There are a bunch of us commercial lenders who have to go to this class for 10 weeks straight. We need someone to take notes.’”
Stewart then became a bank examiner, putting 80,000 miles on her car doing community bank examinations for two years. By then, banks had begun to hire what she call “token women,” and “I had skills that a lot of other women didn’t.” She returned to the Everett bank as an officer, becoming the first female VP there. She later joined a California-based thrift and rose to become its first female SVP. In 1989, while she was casting about for her next step, a recruiter called her about an opening at a $38 million-asset institution in Seattle. “What do you know about credit unions?” he asked.
Credibility on credit unions AGE Federal Credit Union was a cooperative for cooperatives: it served the employees of independent grocers and retailers and was a proud part of the Evergreen State’s strong culture of cooperative and mutual businesses like REI and Washington Mutual. Stewart was the board’s second choice, after the first hire — a veteran of a big bank — walked out on his first day when he realized how different a small credit union would be. found out the NFL was a not-for-profit, all of a sudden the NFL paid attention,” she says. “It was a huge deal. I think my experience can help with that conversation.”
Glen Simecek, president and CEO of the Washington Bankers Association, agrees. “She has credibility that few other bankers possess” on credit unions, he says.
It wasn’t long before Stewart realized the credit union would need to grow and change. The independent retailers who formed its field of membership were shrinking as chain supermarkets and retailers expanded. “The common bond we had was not sustainable,” she reflects. The credit union needed to grow to survive but it didn’t seem to Stewart fair to do that within the bounds of the credit union charter.
“Philosophically for me, I always had this back-of-my mind feeling that we call 911, we use the services in the community, but we don’t really support the community,” Stewart says. “We would maximize our tax advantage. Is that equitable if we move outside our area of focus?”
In the late 1990s, she began having conversations with the board about converting to a bank charter which would allow the organization to grow throughout the community. “That was really difficult for the board,” says longtime bank board member Bob Carney. “She had this vision of where we could go and certainly got us there, but the board struggled with it for a couple years. Once she picks a goal, she hits her goals.”

Stewart’s vision for converting the bank “gave us an opportunity to grow the institution,” adds David Haddad, the vice chairman of the bank. In 2003, what had by then been renamed Credit Union of the Pacific officially became Sound Community Bank, a mutual savings bank. (In 2012, it became a commercial bank.) In converting, Stewart made a rare move in the credit union world. “We paid an extra dividend to our members before we converted because they’d helped build the organization.”
Stewart didn’t have to persuade just the board — she also had to persuade the National Credit Union Administration, which was loath to see its members leave for another regulator. “We were probably the last credit union conversion before NCUA began applying some very arbitrary rules,” she says. “We did have resistance. It took us a long time to get NCUA’s approval.”
Today, amid a wave of acquisitions taking banking assets the opposite way, into the credit union sector — 12 in 2019 alone when this issue went to press — Stewart hopes to use her experience to focus public attention on the issue of credit unions’ tax advantage. She thinks bankers can make headway by pointing out that credit unions are the only tax-exempt organizations — apart from churches and very tiny nonprofitsthat don’t make key transparency filings. “When the public
‘It never occurs to me that somebody wouldn’t be my family.’’ Another priority for Stewart is to champion diversity and inclusion in the banking industry. As a female CEO who broke through glass ceilings in her rise to the C-suite, she consciously built a senior executive team that’s half female. Her inspirational qualities go beyond banking. “She’s one of the first people I call to ask for advice when navigating a male-dominated career field,” says Annie Olson, the firefighter. “I practiced mock interviews with her. It’s the most important part of the process.”
Stewart’s advice for women seeking to advance in banking: raise your hand. “Most women think that if they do a really good job, somone will lean down, pluck them out and promote them,” she says. “No! You’ve got to raise your hand and say, ‘I can do it, I want a shot.’ Women don’t raise their hands enough.”
She also challenges banks to think beyond race and sex when assessing diversity. “We’ve got a long way to go in terms of inclusion and thining about who’s comfortable,” She says. For example, Sound Community Bank recently worked with the Hiring Our Heroes program to onbard a U.S. Marine officer in the marketing department. It can be a challenge for some civilian companies to provide a welcoming environment for service men and women transitioning out of active duty, Stewart explains.
She also thinks banks have more to do to include LGBT bankers. Years ago, she hired a gay man to an executive role who had never felt it was safe for him to be out at work until he came to work for her. “You’ve got to be bold,” she says, both in setting goals for diversity and inclusion and communication benefits.
Her interest in diversity comes back to family, she thinks. “I don’t know if there’s something in my personality that naturally mothers,” Stewart reflects “Some part of that role of inclusiveness has been in me since I was a kid. It never occurs to me that somebody wouldn’t be my family.”
This article originally appeared in the November/December 2019 issue of ABA Banking Journal. © 2019 American Bankers Association. Reprinted with Permission. All Rights Reserved.
How Competitive Banking Industry in is the
Arkansas? by Timothy J. Yeager
Competition Intensity Depends on the Measurement A few years ago, a journalist asked me why the banking market in the Fayetteville MSA was so uncompetitive. I was surprised by the question because it is common knowledge that competition among the 33 banks in the MSA is extremely intense. Indeed, it seems there are branches on every corner.
The journalist was basing the question on the most recent deposit market share report from the FDIC, which showed that deposit holdings among banks in the MSA were highly concentrated. I assured him that, despite the report, the market for loans and deposits was highly competitive. That discussion, however, led me to think carefully about why deposit share concentration—the most common measure of banking market competition—could be such a misleading measure. My co-author, Garrett McBrayer, and I argue that this measure exaggerates the potential for collusion while diminishing the potential for competition. We developed a new measure, which we call the Bank Competition Index (BCI), that better balances collusion and competition, and it paints a very different picture of the intensity of competition in Arkansas’ urban banking markets.
Bank Competition is Rooted in Arkansas’ History In 1994, Arkansas became the second to last state (before Iowa) to deregulate intrastate branching across county lines. Although the number of banks has declined sharply since then from 275 to 92, the state still has a large number of community banks given the gradual adjustment to deregulation. We would expect, then, that competition would be fierce in Arkansas banking markets.
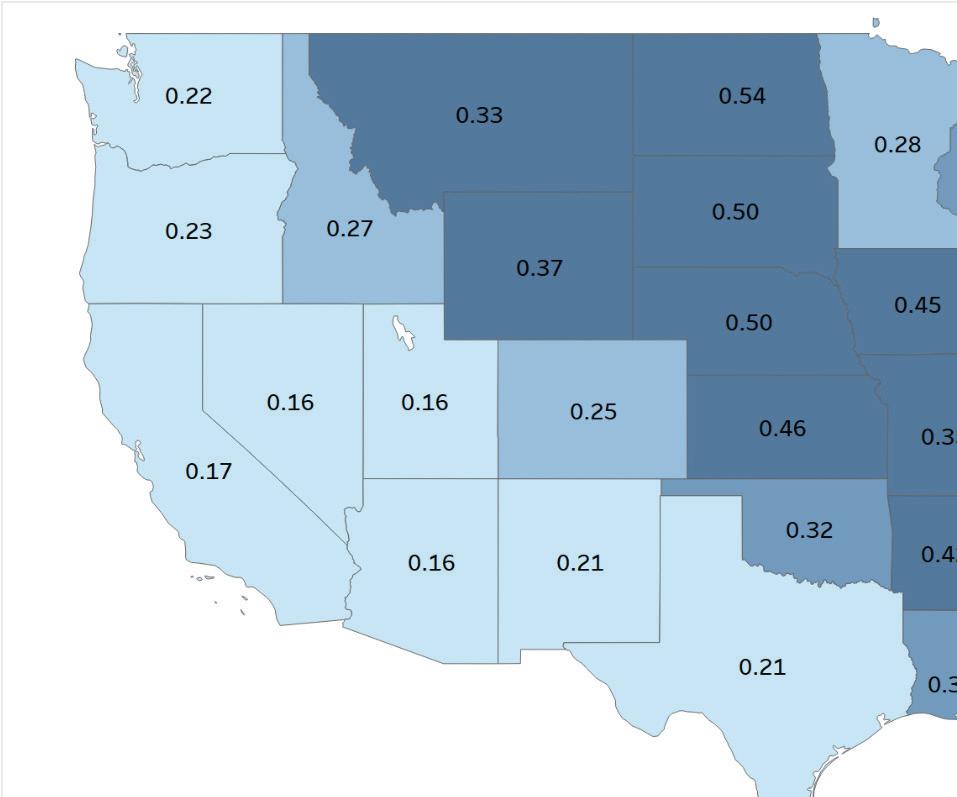
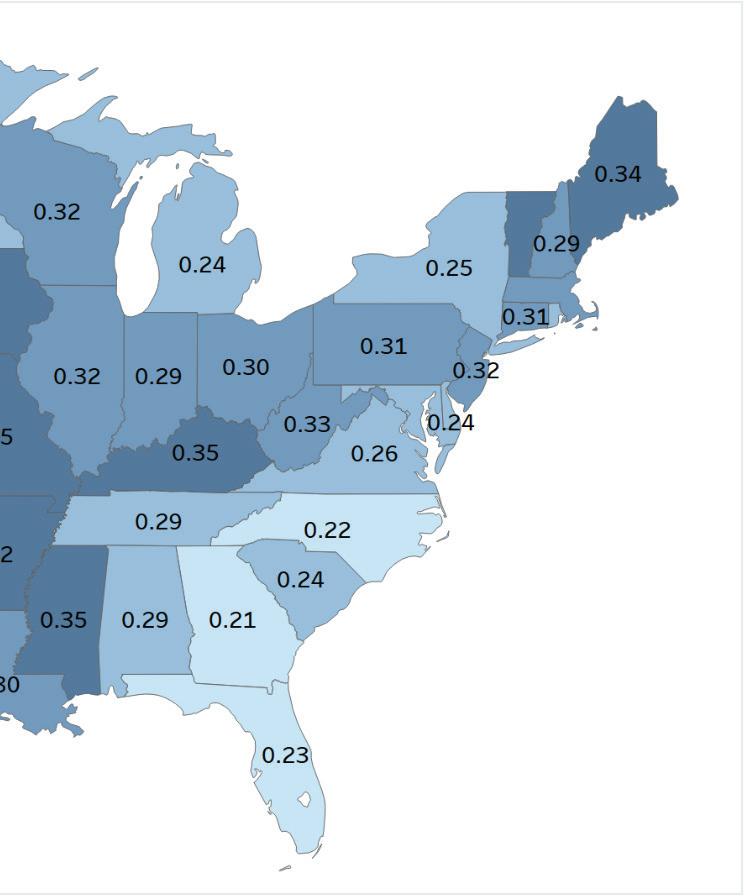
States with high numbers of banks should also have high numbers of branches competing for business. Figure 1 displays a heat map by state of offices per 1000 people. Higher values, reflected by darker colors, represent greater office density. At 0.42, Arkansas ranks sixth behind North Dakota, Nebraska, South Dakota, Kansas, and Iowa. Moreover, the state ranks 8th for the lowest deposit-share concentration, meaning that deposits are evenly distributed across banks in the state. These measures consistently reflect a high degree of bank competition within in the state. Banks, however, typically compete for business at the local level rather than the state level, and competition may differ significantly across markets within the state.
Deposit Concentration Can Be Misleading Most banks define their main competitors as other banks in the relevant county or metropolitan statistical area (MSA) where they operate, so competition should be measured locally. The most common measure, the deposit-share Herfindahl Hirschman Index (HHI), ranges between 0 and 1, and higher values indicate less competition because deposit share is less equally distributed among banks in the market. (See the nearby box insert for an explanation of how HHI is computed.)
The theory behind HHI as a measure of competition is that markets where a few firms have significant market share are less competitive because those firms can collude either explicitly or tacitly to drive up prices and earn monopoly profits. Banks operating in such markets should have relatively high net interest margins because they can exploit their market power by paying lower deposit rates or charging higher loan rates than banks in more competitive markets.
The FDIC Summary of Deposits data lists each bank’s deposits by branch each year as of June 30. From that data, we compute each bank’s deposit market share. The Herfindahl-Hirschman Index (HHI) is the sum of the squares of those market shares.
HHI ranges from 0 to 1, where 0 is the most competitive. If each bank in a market holds a small portion of the deposits, the sum of the squares of those market shares is close to zero. On the other hand, if one bank holds all the deposits, HHI equals one.
Consider a county with three banks: A, B, and C. Each has onethird of the deposits in the county. HHI is computed as (1/3)2 + (1/3)2 + (1/3)2 = 0.33. Instead, suppose that deposits are less equally distributed so that Bank A has 70% of the market share, B has 20%, and C has 10%. HHI in this case is computed as: (0.7)2 + (0.2)2 + (0.1)2 = 0.54. Higher deposit concentration leads to higher index values.
Deposit-share HHI calculated from the 2019 FDIC Summary of Deposits shows that the average metropolitan banking market in Arkansas is less competitive than the average of the 392 MSAs nationwide. Table 1 lists the eight MSAs in Arkansas, and the right-hand columns show the HHI value and percentile ranking for each MSA. Lower HHI values reflect greater competition. Jonesboro is the most competitive MSA in the state with an HHI ranking at the 14th percentile nationwide. Texarkana and Fort Smith rank near the top third in competition, while Hot Springs, Little Rock, and Memphis are close to the median. The Fayetteville MSA is at the 85 th percentile, and the Pine Bluff MSA ranks at the 99 th percentile, meaning that they are among the least competitive MSAs in the nation. The average Arkansas MSA for deposit-share concentration is at the 52 nd percentile. Based on their personal experiences, many Arkansas bankers would vehemently disagree with these rankings. Moreover, the rankings don’t correlate with the large numbers of banks and offices in the state, reflecting the long history of community banking and the relatively late branching deregulation. Deposit-share HHI seems to be omitting important characteristics of competition. banks’ market power comes from collusive behavior. However, market competition is diminished only if banks actually collude! Collusion becomes increasingly difficult as the number of banks in the market increase because coordination is more complex and the benefits to banks from deviating and underpricing the competition increase. If banks do not collude, markets where one bank has a dominant share of the deposits may be even more competitive than markets where deposits are evenly distributed.
The Bank Competition Index Given the limitations of deposit-share HHI, we developed the Bank Competition Index (BCI) that better balances the potential for collusion against the potential for competition. We constructed the BCI using two intuitive assumptions. First, bank competition is primarily a battle for scarce customer relationships because those relationships are the primary sources of market power. Second, more competition should depress the average net interest income of banks in the market.
Despite its widespread use, deposit-share HHI can be a misleading measure of bank competition because it assumes that Our research identifies three structural characteristics of a banking market that determine its competition intensity because they consistently compress bank margins. The first characteristic is the familiar deposit-share HHI of all banks in the market. This measure may be incomplete, but it still matters. Markets with more equally distributed deposits are likely to be more competitive because the potential for collusion is reduced. The second characteristic is the number of offices (main offices, full-service branches, and loan production offices) per 1,000 people in the market. The rationale is straightforward: more bank offices reflect banks’ financial and geographical commitments to compete for deposits and loans. Table 1. Competition Intensity of Arkansas MSAs BCI HHI MSA Value Pctl. Value Pctl. Little Rock-North Little Rock-Conway 0.28 1% 0.14 51% Hot Springs 0.27 1% 0.13 45% Fayetteville-Springdale-Rogers 0.23 1% 0.23 85% Fort Smith 0.23 2% 0.12 33% Jonesboro 0.18 10% 0.10 14% Memphis 0.15 16% 0.14 53% Texarkana 0.12 28% 0.12 38% Pine Bluff -0.03 85% 0.63 99% Average for all Arkansas MSAs 0.18 18% 0.20 52% Sources: FDIC Summary of Deposits, FFIEC Call Reports, and authors’ calculations. Banking Industry continued on next page. The Arkansas Banker n Winter 2019 39
The final characteristic is the distribution of customer relationships among banks in the market. To measure this, we compute the difference between the deposit-weighted and unweighted average ratios of nonmaturity deposits (deposits without explicit maturities) to total liabilities of all banks operating in the market. Nonmaturity deposits are core bank funds that reflect deep ties between depositors and the bank. A wider difference between the weighted and unweighted ratios signals more competition intensity because such markets contain a substantial share of banks with relatively few core deposits and, hence, few relationships. In the absence of collusion, these banks compete aggressively with the more established banks to deepen their customer relationships, which is the ultimate source of market power. Banking Industry continued from previous page.
Consider two markets, A and B. On average, nonmaturity deposits are plentiful in both markets. In Market A, most banks have relatively few nonmaturity deposits because one bank holds a dominant share of core deposits leaving the others to rely on noncore funding. In Market B, the nonmaturity deposits are held equally among the banks.
Because most banks in Market A hold few nonmaturity deposits, they have strong incentives to build customer relationships by wooing loan customers from other banks with generous terms and attracting local depositors with generous rates. In essence, the battle for customers offsets the potential for collusion. Because banks in Market B have higher percentages of nonmaturity deposits and, presumably, deeper community relationships, they have weaker incentives to attract customers from other banks.
Banks in Market A also have more powerful risk-taking incentives. On the one hand, they have incentives to underprice competitors to capture existing business. On the other hand, they have incentives to make loans to risky borrowers at high interest rates to offset high funding costs. Empirically, banks with less reliance on nonmaturity funds experience higher credit risk.
In sum, banking markets are more competitive if they have more equal deposit market shares, more offices per capita, and a more unequal distribution of market power as measured by wider differences between the weighted and unweighted average ratios of nonmaturity liabilities to total liabilities. We weight these three characteristics by their long-term impacts on net interest income to derive the BCI value for each market and each year. The index is constructed so that its long-term average is zero, and higher values reflect more intense market competition.
BCI shows that Arkansas MSAs are highly competitive Unlike deposit-share HHI, the BCI shows that the Arkansas MSAs are among the most competitive in the U.S. The left-hand columns of Table 1 list the BCI value and percentile ranking for 40 The Arkansas Banker n Winter 2019
each of the eight Arkansas MSAs relative to all MSAs in the U.S. Remarkably, four of the MSAs rank in the top six nationwide. The Little Rock market is the 2 nd most competitive MSA in the nation, followed by Hot Springs (3 rd ), Fayetteville (5 th ), and Fort Smith (6 th ). On average, the Arkansas MSAs are at the 18 th percentile of banking competition.
Table 2. BCI Factor Contributions
Nonmaturity MSA Spread Offices HHI Little Rock 45% 22% 34% Hot Springs 27% 43% 30% Fayetteville 64% 24% 13% Fort Smith 37% 21% 42% Jonesboro 11% 32% 57% Memphis 67% -18% 51% Texarkana 32% 5% 62% Pine Bluff -304% 48% 356%
For several of the MSAs, the differences between HHI and BCI percentile rankings are striking. Fayetteville and Little Rock, for example, drop from the 85 th and 50 th percentiles, respectively, to the 1 st percentile when measured by BCI.
Table 2 displays the percentage contribution from the three factors to each MSA’s BCI value, and the percentages in each row sum to 100%. The Little Rock and Fayetteville MSAs are more competitive than average primarily because of the wide gap between the weighted and unweighted nonmaturity liability ratios. The high BCI for the Hot Springs MSA results from the high number of per-capita offices, and the Fort Smith and Jonesboro MSAs are competitive primarily because of their even distributions of deposit shares across banks.
Competition in Arkansas counties
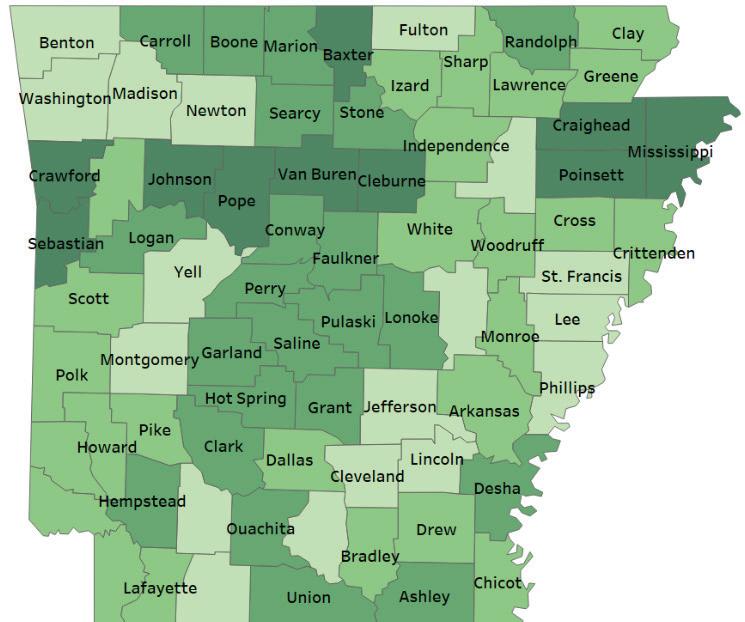
The relevant market for banks operating outside of MSAs is the county. In this case, the disagreement between HHI and BCI in measuring competition intensity in rural Arkansas counties is much smaller. Figure 2 2 displays a heat map for 2018 of all Arkansas counties (including those in MSAs) by competition quartile where competition is measured with deposit-share HHI. Darker shades represent more competition. According to this measure, just 39% of the 54 rural counties are more competitive than the median U.S. rural county. 1
Figure 3 displays a similar heat map where competition is measured with BCI. According to BCI, 46% of the Arkansas rural counties are more competitive than the median county. In sum, both HHI and BCI show that Arkansas banking markets in rural counties in 2018 are somewhat less competitive than the typical rural county nationwide.
Table 3 lists the ten most competitive rural Arkansas counties as ranked by BCI in 2018. Cleburne County is at the top of the list, and it ranks in the 2 nd percentile among rural counties nationwide. Indeed, each of the top ten Arkansas counties rank at or below the 15 th percentile.
Table 3. Ten Most Competitive Arkansas Counties BCI HHI County Value Pctl. Value Pctl. Cleburne 0.11 1.2% 0.19 14.6% Marion 0.10 1.7% 0.29 43.7% Baxter 0.10 1.7% 0.18 9.7% Lafayette 0.05 4.8% 0.43 69.9% Ashley 0.05 5.1% 0.27 37.5% Clark 0.02 9.2% 0.28 42.4% Van Buren 0.02 10.2% 0.19 12.9% Chicot 0.01 12.5% 0.32 51.5% White 0.00 14.3% 0.29 44.9% Cross 0.00 14.3% 0.34 54.2% Average 0.05 7.5% 0.28 38.1% Sources: FDIC Summary of Deposits, FFIEC Call Report
BCI and HHI do not always agree on competition intensity within a county. Lafayette County provides a clear example. With a population just below 6,700, the county has five banks operating in the market. Bodcaw Bank holds 57% of the county’s deposits, followed by BancorpSouth Bank with 16%. The unequal distribution of deposits among the banks suggests that competition is relatively weak. The difference between the weighted and unweighted nonmaturity deposit ratio, however, is 5.5%, second highest in the state. This difference indicates that several banks in the county are competing aggressively for business. In addition, the (adjusted) number of offices per 1000 people of 0.40 ranks tenth in the state. Empirically, these two characteristics offset the high deposit concentration, making it likely that banks in Lafayette compete rather than collude.

Conclusion No single indicator is a perfect measure of competition. However, our objective in developing the Bank Competition Index is to improve upon the heavily used deposit-share Herfindahl Hirschman Index by creating a measure that better accounts for bank competition rather than collusion.
We certainly believed that the new index would show that Arkansas banking markets were highly competitive, but even we were surprised when the results ranked four of the state’s MSAs in the top six nationwide. Our guess is that Arkansas bankers won’t find it difficult to believe that the markets they operate in are extremely competitive.
Timothy J. Yeager is Professor of Finance and holds the Arkansas Bankers Association Chair in Banking at the University of Arkansas. Garrett McBrayer is Assistant Professor of Finance at Boise State University. Source: FDIC Statistics on Depository Institutions
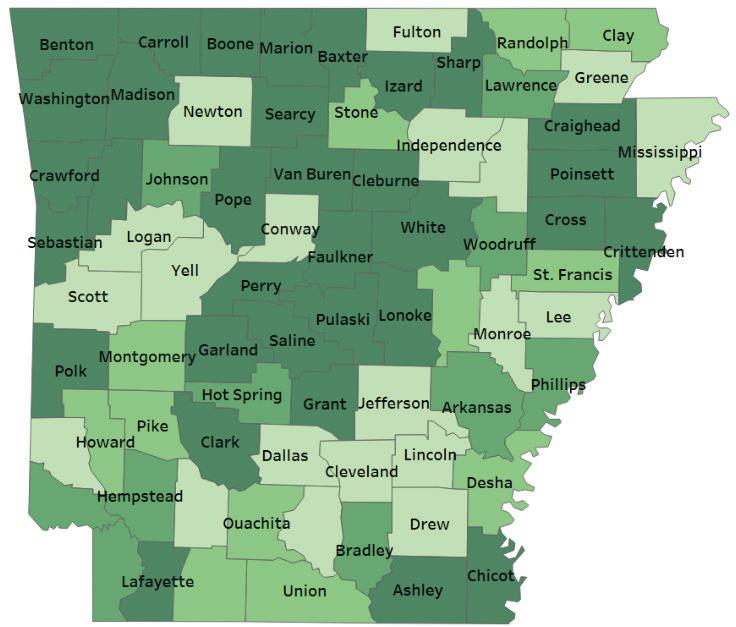

Figure 3. Competition Intensity by BCI Quartile
Source: FDIC Statistics on Depository Institutions
Table 1. See Arkansas Bank Competition.xlsx. US averages are from bci_all_years_all_vars.xlsx , MEANS sheet.
Table 2. See bci_all_years_all_var.xlsx sheet called BCI_Components
Table 3. See ArkansasBankCompetition.xlsx CNTYPCTL sheet.
1. Data from ArkansasBankCompetition.xlsx in sheet ARK2018. Ultimately data are from BCI_Tableau.xlsx
By Darrin Williams,
Southern Bancorp, Inc. CEO
As I travel across Arkansas from Blytheville to Mt. Ida or Eudora to Little Rock, I’m always intrigued to hear the stories and see the impact that local banks have on our communities. Whether providing access to capital for small businesses, helping folks buy their first home, or opening child savings accounts, banks are key anchors throughout the state because we open the doors to opportunity and prosperity. But, I have also learned that many in our communities don’t realize this prosperity because they don’t participate in the mainstream financial system.
Nationally, over six percent of households are unbanked and 19.6 percent are underbanked. Unbanked households have no formal banking relationship while underbanked households might have a minimal relationship such as a checking account. Both rely on alternative financial services (AFS) like check cashers or payday lenders.
In Arkansas, the number of unbanked and underbanked households is above the national average: eight percent and 22.7 percent, respectively. To put that into perspective, the unbanked population is roughly the same size as Conway, and the underbanked population is slightly larger than the population of Pulaski County and Benton County – combined. That’s a huge market that we can do a better job of serving. But first we have to understand what that market needs. To help illustrate the challenges faced by unbanked and underbanked households, Southern Bancorp recently partnered with the Financial Health Network to host a FinX – a financial experience. The event is a hands-on, empathy-building, educational simulation in which participants complete a series of daily financial tasks like cashing a paycheck, transferring money to another person, and buying household items. But there’s a catch: they cannot use traditional banking services like debit cards or direct deposit. Instead, participants must rely on AFS products like reloadable cash cards, check cashers, or wire transfers like the millions of unbanked and underbanked consumers have to do each day.

Tasks that may take a person with a banking relationship five minutes to do often take hours to complete for someone without such a relationship, not to mention the fees. One of the teams in our simulation, after trying three times unsuccessfully to cash a $15 personal check, ended up paying a six dollar check cashing fee to the one AFS provider that would even cash the check. Those fees represent money that could be reinvested in our local economies to build stronger communities and change customer’s lives. I first experienced FinX in 2017 as part of the Financial Health Network’s EMERGE Conference in Austin, TX. I was blown away by the difficulty, by the fees, and by the frustration of just trying to perform basic financial tasks. That’s why I wanted to bring FinX to Little Rock. Participants spanning the private, public, and nonprofit sectors used words like “frustrated,” “mad,” “disoriented” to describe their experience. As we all know, those are not exactly words we want people to associate with banking. But these feelings aren’t entirely unfounded. An FDIC Report noted that trust between customers and financial institutions was one of the main reasons people continue to be unbanked. Indeed, 30 percent of unbanked families said they don’t trust banks.
Further, many financial institutions do not have a product designed to tap into the unbanked and underbanked market. Unbanked households noted this, too: many said the reason they didn’t have a bank account was because the fees were too high or unpredictable. But Southern Bancorp and others are working to change that perception. Not only because it’s the right thing to do, but because it makes business sense.
According to a 2017 report from the Financial Health Network, formerly the Center for Financial Services Innovation, the underserved market is worth approximately $173 billion nationwide. And it’s growing. From 2015 to 2016, it grew by approximately $10.7 billion. That’s not a standalone report. LiveRamp – previously Axciom – also noted the market’s potential because of its size: in 2014, the segment was composed of 24 million households, or over 50 million adults. Not only do we need a product to reach this market segment, but we also need a coalition.

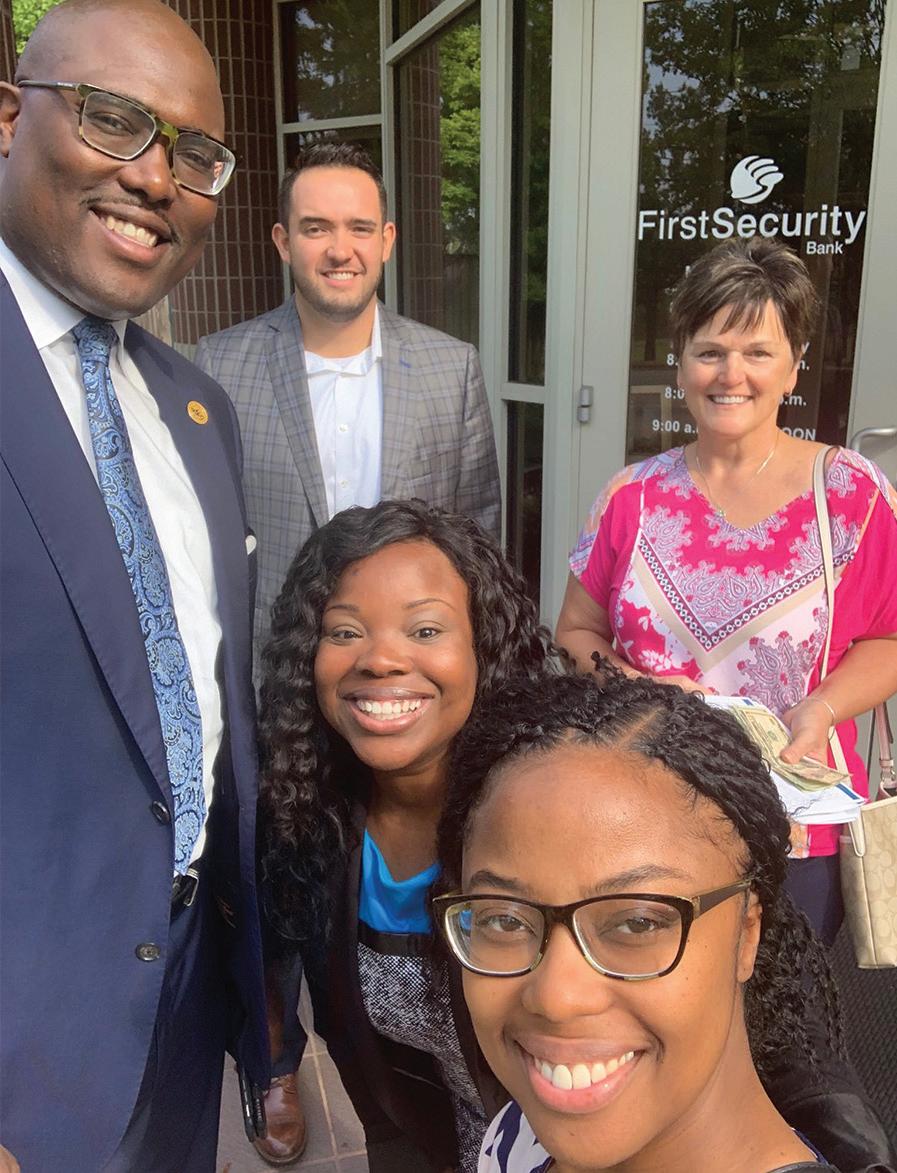
Bank On Arkansas+ is that coalition. Nationally, the “Bank On” movement is an attempt to address the underbanked problem by encouraging financial institutions to join together and create “safe” accounts, low-cost bank accounts that provide households with a safe place to save, conduct basic financial business, and build a credit history. In Arkansas, there are nine partnering financial institutions offering a Bank On certified account: Bank of America, Diamond Lakes Federal Credit Union, Iberia Bank, U.S. Bank, Wells Fargo, First Security Bank, Citizens Bank, Simmons Bank, and Southern Bancorp. These financial institutions, together with community-minded coalition partners like the United Way, the Arkansas Community Action Agencies Association, Inc., the Arkansas Foodbank, and Entergy Arkansas to name just a few, have committed to “ensuring that all Arkansans have access to safe, trusted, and affordable banking so they have the opportunity to save for themselves, build wealth for their families, and improve quality of life in their communities.”


I would highly recommend learning more about this coalition and consider joining at https://www.bankonar.org/. Having a certified Bank On product is not required to join, but simply being part of the coalition will help decrease the underserved population and open up more opportunities in communities throughout Arkansas. By working together, we can create a healthier financial future for all Arkansans.
(Top photo) Mayor Frank Scott announcing that the City of Little Rock was joining the BankOn Arkansas coalition. (left to right): Kara Wilkins, Executive Director, BankOn Arkansas+; Darrin Williams; Mayor Frank Scott; Little Rock City Director Ken Richardson; John P. Bethel, Director of Public Affairs, Entergy Arkansas.
(Middle photo, left to right) Mimi San Pedro, Chief Strategy Officer, The Venture Center; Staci Croom-Raley, Executive Director, HIPPY USA.
(Bottom photo, left to right) Little Rock Mayor Frank Scott; Miguel Lopez, VP of Community Development, First Community Bank; State Rep. Jamie Scott; Kendra Pruitt, Senior Advisor to Mayor Scott; Dana Batterton, Executive VP and Chief Risk Officer, FNBC Bank.
Industrial Hemp: A Challenging Crop

By Rick Novak Director of Seed Programs Department of Soil and Crop Sciences Colorado State University
In the last few years many people have become interested in growing industrial hemp. We have observed the acreage of this crop soar since the federal and state legislative approval of the cultivation of industrial hemp in Colorado. In just a few years, the planted acreage in CO has gone from 220 in 2014 to nearly 86,000 in 2019; nationally there were over 500,000 acres planted. The particularly strong interest in Hemp is a result of a rapidly growing cannabidiol (CBD) product market. Consumer acceptance and consumption of CBD products has been creating a strong demand for the crop production.
44 The Arkansas Banker n Winter 2019 What makes this crop unique is that hemp has been grown around the world for several hundred years. Industrial hemp was first classified by Carl Linnaeus in 1753. He named the plant Cannabis Sativa L. with the L representing the first initial of his last name. He was very familiar with this crop as it was widely grown at the time in Europe for its use in fiber products. There currently are three main product areas that this crop can be a source for: seed, fiber and last but most popular lately is the cannabidiol (CBD) market. The industrial hemp seed is relatively high in protein and oil, proving a quality feed source for many products consumed in world markets. The plant fiber is a very durable product but has a difficult time competing with synthetic products. The fiber is used around the world but is not as widely adapted. The last and fastest growing market for this crop is the CBD market. CBD is marketed now as a food and or a diet additive. There are numerous claims and testimonials promoting improved health benefits. As the recent interest and demand for consumer industrial hemp and CBD products continues to grow, it is creating market acceptance across the United States. Industrial hemp cultivation was legislated illegal in the 1930s. The prohibition of the cultivation of hemp ended all related crop production research and variety improvement. Other crop research continued to move forward with improved varieties throughout the years, leaving hemp far behind other crops. When Colorado legislation approved the cultivation of industrial hemp in 2014, it had many plant breeders scrambling because of the shortage of reliable genetics of industrial hemp. With very limited resources of reliable genetics available around the world, many hemp breeders simply relied on feral plant material to develop new plant varieties.
Development of new reliable and stable varieties doesn’t just happen overnight but may take several years. Plant breeders that are currently developing new hemp varieties are utilizing the Association of Seed Certifying Agencies (AOSCA) seed certification program as a variety verification process for maintaining their new varieties that are now being marketed. It is important to recognize that AOSCA seed certification was established over 100 years ago and began because of a need to have a traceable verification process that supports genetic purity for crop variety developers. Seed certification has been the most reliable and preferred method for maintaining genetic purity for many of the agricultural crops in our nation over the last century. Seed certification has worked very effectively to maintain varietal purity for many crops over the years and will work for industrial hemp as well.
I have identified some of the factors that make this crop a unique challenge.
1. The legislative limit of 0.3% Tetrahydrocannabinol (THC) for this crop separates industrial hemp from its sister crop marijuana. This strict limit of THC percentage is a concern for many because if the grower’s crop is tested by their respective regulatory agency and the field is determined to have a higher amount of THC than 0.3% the current law requires the crop to be destroyed. Since hemp production does carry a risk for the growing plants to go “hot”, the resulting destruction of the crop can be financially devastating.
2. Because of the lack of basic agronomic research, there are several production challenges. We do not have a clear understanding about plant fertility requirements, disease issues, pest problems and water requirements. Weed control is a huge issue for many growers as there are no commercial herbicides available labeled for this crop at this time. Without commercial herbicides available for weed control, growers must rely on mechanical weed control or hand weeding. Hence, the labor intensiveness may limit the size of production besides being costly to the crop budget. 3. Hemp can be grown in different planting schemes depending on what the intended production is to be used for. Planting schemes will also cause the plants to grow differently. Plant populations can be as low as 2,000 plants per acre for CBD production or at a higher population around 1,200,000 plants per acre for the production for seed or fiber. Row spacing can also be a variable in production fields. This variability can be associated to differing mechanical weed control options. Additionally, growers need to keep in mind that seed quality and seedling mortality in the field has been an issue for some growers. It is highly recommended that all seed be tested by an accredited seed laboratory to ensure good seed viability.
Even though significant challenges are associated with growing this crop, many industrial hemp growers are experiencing significant financial rewards and are excited about these new opportunities. I strongly recommend that any potential growers educate themselves with respect to all of the associated production risks. Successful growers can be described as great managers with strong attention to detail. Many successful growers start with modest acreage and expand as they learn the business. This crop can be described as an old crop reinvented with challenges and opportunities. Again I strongly encourage all potential growers of industrial hemp to seek out as much information as they possibly can.
Traditional officer call programs are being replaced by business development cultures. It’s a necessary transition for organizations that intend to attract, retain, and grow relationships. Historically, business development programs have been focused on two practices…identifying top customers or prospects and making calls. It’s a strategy with an acceptable foundation, but flawed execution. Identifying targeted customers and prospects is essential for any effective business development process. However, the addition of making calls, needs to change. Simply making calls doesn’t produce optimum results. Relationship managers need to add value to their activities, interactions and contacts. The old saying that time is money, is true. Time is the thing customers and business owners protect when they are contacted by a relationship manager from your bank. Time is the thing your employees will say is missing when they are assigned business development responsibilities. Time is a valuable commodity, so, using it wisely is a strategic advantage. Successful business development needs to transition from a program to a culture. Programs suggest there is a beginning and an end. Cultures, on the other hand, are driven by ongoing practices, embedded in everyone’s activities. Cultures thrive when values and behaviors are shared by the entire team. There are six foundations that business development cultures leverage to manage their success. Review the foundations and identify where your organization could enhance activities and migrate from a business development program to a business development culture. 1. Management Structure • Identify who will be the champions of your business development culture and make sure they are committed to active participation. • Utilize your top performers. They will set the benchmark for desired performance. Then identify which relationship managers and support must be involved because their engagement will ensure success. • Create business development job descriptions for leaders, participants, and support staff. 2. Information Management • Focus your activities on targeted customers, prospects and centers-of-influence. • Develop an information management system that is easyto-access, use and maintain. • Incorporate goal setting, performance tracking and reporting to assess relationship development activities and results. 3. Participant Accountability • Develop a uniform goal setting process that can be documented and incorporated into performance measurements. • Set realistic performance goals for activities and results that can be controlled by participants. • Help relationship managers outline the action plans and activities that will ensure they can achieve their established goals. 4. Performance Measurement • Define which business development activities and results will be measured, including the source of the measurement and the planned reporting frequency. • Create extremely simple ways to collect and report contact management information. 5. Sales Support • Provide training to enhance relationship building skills and support ways to create and manage referral networks. • Develop product and service information that can be used in-person or digitally. • Create digital content that can be used by participants to build connections and credibility. 6. Reward Systems • Develop rewards for activities and results. Activities will convert to habits and effective activities will convert to results. • Integrate coaching and mentoring into reward systems. There is no replacement for positive reinforcement. • Clarify rewards for individual and team categories. Leverage the potential of unifying your teams with shared achievements that are driven by desired outcomes for individual relationship managers. Whatever the status of our business development culture, enhancements will help improve results. Remember that transformations take time. Don’t expect overnight changes just because you have decided to focus on business development. Spend time identifying and leveraging your competencies. They represent a comfort zone for relationship managers. Then develop and introduce the necessary changes to move from the existing practices of your business development program to your emerging business development culture. Things Successful Business Development Cultures Have In Common 6 By Tom Hershberger, CEO, Cross Financial, Lincoln, NE

Over 20 bankers took aim at raising funds for the ABA BankPAC Skeet Shoot Tournament. The shoot was held at the Blue Rock Sportsmans Club in October and over $2,000 were raised for the ABA BankPAC.
Bankers shared a day of laughs and competition. They then enjoyed a BBQ lunch outdoors sponsored by BKD, LLP.

The event ended with the winners being announced and awarded prizes. First place winner was Patrick Hum with Stone Bank who won a Rugger shotgun sponsored by Works24. In second place, Vince Stone with Stone Bank. And tying for third place was Freddie Black and Duncan Bellingrath with Simmons Bank. The 2nd and 3rd place winners received sound cancelling ear muffs and a Yeti Mug from SettlePou.
ABA BankPAC, the bipartisan political action committee created to support candidates who advocate a free and competitive marketplace. The ABA BankPAC is your Political Action Committee (PAC). ABA BankPAC is nonpartisan and is comprised of a state and a federal PAC. One hundred percent of the funds raised for ABA BankPAC are used for political contributions.


Prize winners Patrick Hum (shown with Rick Wilson in top photo), Freddie Black, Vince Stone (second photo) and Duncan Bellingrath (bottom photo).

(Top photo on page) The group at the ABA BankPAC Skeet Shoot Tournament gathering at the Sportsmans Club in North Little Rock.