Local Market Update – October 2021 A Research Tool Provided by the Ann Arbor Area Board of Realtors®
Ann Arbor School District Single Family
October
Year to Date
Key Metrics
2020
2021
% Change
Thru 10-2020
Thru 10-2021
% Change
New Listings
150
83
- 44.7%
1,582
1,499
- 5.2%
Pending Sales
111
159
+ 43.2%
1,054
1,265
+ 20.0%
Closed Sales
109
103
- 5.5%
1,001
1,161
+ 16.0%
Days on Market Until Sale
29
25
- 13.8%
38
21
- 44.7%
Median Sales Price*
$422,000
$460,000
+ 9.0%
$404,000
$451,000
+ 11.6%
Average Sales Price*
$508,841
$497,050
- 2.3%
$469,987
$521,961
+ 11.1%
98.2%
99.9%
+ 1.7%
98.5%
101.5%
+ 3.0%
Inventory of Homes for Sale
332
146
- 56.0%
––
––
––
Months Supply of Inventory
3.3
1.2
- 63.6%
––
––
––
Percent of List Price Received*
Townhouse/Condo
October
Year to Date
Key Metrics
2020
2021
% Change
Thru 10-2020
Thru 10-2021
% Change
New Listings
75
54
- 28.0%
876
897
+ 2.4%
Pending Sales
69
69
0.0%
626
770
+ 23.0%
Closed Sales
77
59
- 23.4%
588
718
+ 22.1%
Days on Market Until Sale
39
34
- 12.8%
41
34
- 17.1%
Median Sales Price*
$267,500
$275,000
+ 2.8%
$236,000
$265,000
+ 12.3%
Average Sales Price*
$328,999
$322,303
- 2.0%
$281,919
$326,492
+ 15.8%
97.9%
99.0%
+ 1.1%
98.5%
100.3%
+ 1.8%
Inventory of Homes for Sale
187
83
- 55.6%
––
––
––
Months Supply of Inventory
3.2
1.2
- 62.5%
––
––
––
Percent of List Price Received*
* Does not account for sale concessions and/or downpayment assistance. | Percent changes are calculated using rounded figures and can sometimes look extreme due to small sample size.
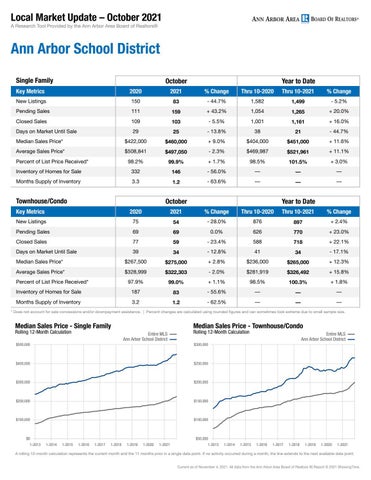
Median Sales Price - Single Family Rolling 12-Month Calculation
Median Sales Price - Townhouse/Condo Entire MLS Ann Arbor School District
Rolling 12-Month Calculation
$500,000
$300,000
$400,000
$250,000
$300,000
$200,000
$200,000
$150,000
$100,000
$100,000
$0 1-2013
Entire MLS Ann Arbor School District
$50,000 1-2014
1-2015
1-2016
1-2017
1-2018
1-2019
1-2020
1-2021
1-2013
1-2014
1-2015
1-2016
1-2017
1-2018
1-2019
1-2020
1-2021
A rolling 12-month calculation represents the current month and the 11 months prior in a single data point. If no activity occurred during a month, the line extends to the next available data point. Current as of November 4, 2021. All data from the Ann Arbor Area Board of Realtors ®| Report © 2021 ShowingTime.