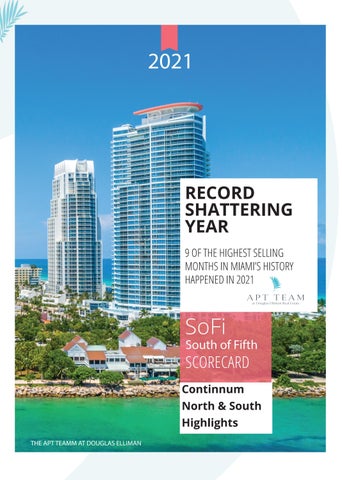
2021
RECORD SHATTERING YEAR 9 OF THE HIGHEST SELLING MONTHS IN MIAMI’S HISTORY HAPPENED IN 2021
SoFi
South of Fifth
SCORECARD
Continnum North & South Highlightss THE APT TEAMM AT DOUGLAS ELLIMAN
MIAMI: November to remember “The red-hot market, fueled by domestic and global homebuyers, has now established all-time annual records for total home sales (set in 10 months), all-time annual condo sales (set in nine months), and the all-time annual single-family home sales (set in 11 months). The red-hot market, fueled by domestic and global homebuyers, has now established all-time annual records for total home sales (set in 10 months), all-time annual condo sales (set in nine months), and the all-time annual single-family home sales (set in 11 months). Miami-Dade County total home sales rose 22.9% year-over-year in November 2021, from 2,459 sales to 3,021. Miami single-family home transactions increased 1.2%, from 1,154 to 1,168. Miami existing condo sales increased 42%, from 1,305 to 1,853.
35,961 total home sales in 11 months, surpassing previous annual record of 2013.
9 of the best 10 selling months Miami registered 35,961 existing total homes sales in 11 months, which surpasses the previous annual record of 30,041 transactions in the entire year of 2013, an increase of 19.7%. Of the top-10 best home sales months in Miami history, nine have happened in 2021 June 2021 (with its 4,057 total transactions) remains the No. 1 overall sales month in Miami history. November 2021 (with its 3,021 sales) ranks as the eighth-best sales month overall since MIAMI began tracking stats in 1993. Miami home sales are also significantly higher vs. November 2019. Miami total home sales are up 48.6% in November 2021 vs. November 2019, from 2,033 to 3,021. Miami single-family home sales (20.2% increase) and condo transactions (74.6% jump) are higher than November 2019”.
in Miami’s history happened in 2021
Transactions 4,057 / June 2021
6.
3,299 / August 2021
2. 3,960 / April 2021
7.
3,031 / September 2021
3,751 / March 021
8.
3,021 / November 2021
4. 3,632 / July 2021
9.
2,990 / December 2020
5. 3,536 / May 2021
10.
1.
3.
condos
74.6%
transaction increase
40%
11%
6%
86%
40%
11%
6%
2,978 / October 2021 86%
MIAMI: November to remember
MIAMI: November to remember Sales in November Single-family homes up by 1.2%.
Active Inventory
Condos/Townhomes up by 42%.
Percentage change based on year-to-year comparison
1,863 1,168
-43.6%
TOTAL ACTIVE LISTINGS down by
1,305
1,154
17,758 2020
2021
2020
10,011
2021
2020
2021
SINGLE-FAMILY HOMES
2.1 months Miami single-family luxury ($1-million-and-up) transactions rose 28.2% year-over-year to 209 sales in November 2021. Miami existing condo luxury ($1-million-and-up) sales surged 115.6% year-over-year to 207 transactions. Dollar volume sales for single-family homes through November 2021 increased 15% from preious year to $1,072.3 Billion. Dollar volume sales for condos and townhomes increased 92.8% to $1,129 Million.
SINGLE-FAMILY HOMES DOLLAR VOLUME $1,072.3 BILLION UP CONDOS/TOWNHOMES DOLLAR VOLUME $1,129 MILLION
CONDOS/TOWNHOMES
15%
UP 92.8%
3.7 months
MIAMI: SoFi 2021 Scorecard
MIAMI: SoFi 2021 Scorecard Properties $1M and over
Average sold price
Properties $1M and over
Average Sold $/SF 2020 Highest sold price
$3,609,912
$1,160
2020
2020 Ave Sold$/SF
2020 Days on market: 220
$22,000,000
2021 Highest sold price
$35,000,000
2021 Days on market: 192
# of Closed Sales $1,483
2021 Ave Sold$/SF
2021
$2,688,216 $2,688,216
287
67
2021 SoFi review Beds
SF
SP $
SP $/SF
DOM
Min
1
742
$1M
$608
0
Max
7
11,031 $35M
$4,257
2,114
Ave
3
2,170 $3.6M
$1,483
192
Percentage change 2021 vs 2020 Average Prices
34.3%
27.8%
Ave. Sold Price
Ave. Sold $/SF
2020 total volume
2021 total volume
$180,110,500
$180M
$1,036,044,902
$1.036B
475%
increase
2020
2021
2021
31.7%
DOM: Days on market RECORD ESTABLISHED BY THE APT TEAM, WHO HAD THE HIGHEST SALE/SQFT IN SOUTH OF FIFTH FOR 2021
2020 SoFi review
increase Max SP $/SF
Beds
SF
SP $
SP $/SF
DOM
Min
1
1,042 $1.05M $366
Max
5
6,807
$22M
$3,232
2,009
Ave
3
2,121
$2.7M
$1,160
200
MIAMI: Continuum North
MIAMI: Continuum South 2021 Continuum South Review
2021 Continuum North Review
SP $/SF
DOM
1,008 $800K
$794
2
7
11,031 $35M
$3,655
1,360
2
3,352 $9.72M
$1,855
198
Beds
Beds
SF
SP $
SP $/SF
DOM
Min
0
609
$820K
$1,001
7
Min
1
Max
4
4,154 $12.9M
$4,257
660
Max
Ave
2
3,352 $3.69M
$1,857
182
Ave
SF
SP $
2021 CLOSED SALES
2021 CLOSED SALES
32 2020 Continuum North review Beds
SF
SP $
SP $/SF
DOM
Min
0
609
$720K
$1,036
59
Max
3
2,190 $4.2M
$1,933
253
Ave
2
1,417 $2.2M
$1,423
137
2020 CLOSED SALES
4
www.theaptteam.com
SF
SP $
SP $/SF
DOM
$726
19
Min
1
1,201 $1.25M
Max
3
3,365
$6.2M
$1,944
2,009
Ave
2
3,352 $2.57M
$1,286
282
2020 CLOSED SALES
20
Percentage change
2021 vs 2020 Average Prices
Ave. Sold Price
2020 Continuum South Review Beds
Percentage change
39.9%
64
2021 vs 2020 Average Prices
21.8% Ave. Sold $/SF
49.8% Ave. Sold Price
30.7% Ave. Sold $/SF
THE APT TEAM AT DOUGLAS ELLIMAN 2021 Pinnacle Award recipient, Top 2% of agents company-wide, and #1 New Dev team Florida award. Over 15+ years in business, $800M+ sold, 4 languages spoken, hands-on service & proven results. The APT TEAM holds the highest sale per square foot for South of Fifth in 2021.*
THANK YOU Thank you
from THE APT TEAM AT DOUGLAS ELLIMAN
Recent notables & record breakers 50 S Pointe Dr., #3401, RECORD BREAKING SALE $12.9M | $4,257/SF highest sold$/sf buyer rep. 2821 S Bayshore Dr., #16A sold $4.375M seller rep. 2821 S Bayshore Dr., #12A, sold $4.175M seller rep. Baccarat Residenes, #4806 under contract, $2.6M buyer rep. 200 Biscayne Blvd Way #PH5401for sale $5.3M seller rep.
Adriana Pinto-Torres | Tracy Ferrer Directors of Luxury Sales Realtor Associates
adriana@theaptteam.com tracy@theaptteaam.com * Buyer repreented
786.493.1388 786.214.0099
www.theaptteam.com