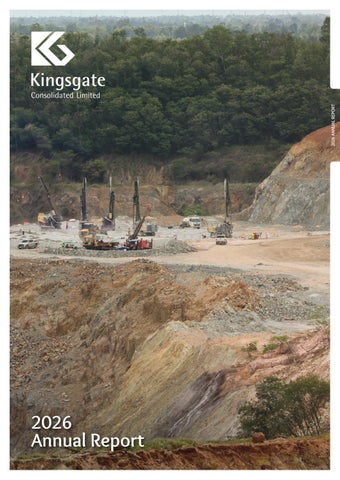
2026 Annual Report 2026 ANNUAL REPORT
Front cover: Grade control drilling as part of the A Pit expansion at the Chatree Gold Mine, Thailand. This Image: Crushed ore on the conveyor at Chatree processing plant.
Contents Chairman’s Review ............................
2
Managing Director & CEO’s Report ................................................
4
Directors’ Report .................................. 24 Remuneration Report ................... 32
6
Auditor’s Independence Declaration ...................................................... 45
8
Financial Statements ................... 47
Projects Report
Nueva Esperanza ................................. 14
Consolidated Statement of Profit or Loss and Other Comprehensive Income ............. 48
Exploration Report ......................... 16
Consolidated Statement of Financial Position ........................ 49
Operations Report Chatree Gold Mine .............................
Sustainability Report Kingsgate and Akara .......................
Mineral Resources and Ore Reserves ................................................ 18 Competent Persons Statement ......................................................... 22 Governance ..................................................... 23 www.kingsgate.com.au
Consolidated Statement of Changes in Equity ...................... 50 Consolidated Statement of Cash Flows ........................................... 51 Consolidated Entity Disclosure Statement ................... 52
Notes to the Consolidated Financial Statements ................... 53 Directors’ Declaration ................. 88 Independent Auditor’s Report ....................................................................... 89 Shareholder Information ........ 95 Corporate Information ............... 97
2026 ANNUAL REPORT
Contents
1
2 Chairman’s Review
Chairman’s Review The year under review saw the first full year of gold production from mining since Chatree was brought back to life in 2023. Prior to this production was, at least partly, from low grade stockpiles.
Chinese buying increased over the second half of the financial year and is, seemingly, continuing into this year as prices fluctuate. There seems to be little correlation to price and should indicate that gold is more likely to continue its strong performance rather than to have peaked.
This resulted in a commendable production of 86,078 ounces of gold and 766,009 ounces of silver.
As a prudent Board, your Company reviews these movements constantly, and, as has been discussed many times, because we are selling all year, producing on a weekly basis, the prices we receive are an average of those gold prices throughout the year.
Significantly this coincided with a massive rise in the price of both gold and silver, with gold peaking at US$5,597.23 per ounce and silver hitting an all-time high at US$121.67 in late January. Since then both have fallen (but to still very high historical levels).
The constant changes in the gold price create a dilemma for gold producers as to whether they should hedge or not and this is something we monitor constantly, bearing in mind that many of those companies that did on the way up were badly caught.
Whilst a continuation of the previous rises is dependent on a resolution of the Iran War, the truly significant thing has been the continuous strong buying since the peaks, and at all subsequent levels, by central banks, but particularly the Chinese.
One of the major inconsistencies in such a strong gold market has been the tendency of some contrarians to maintain a large short position in gold stocks, including your own Company. Contrary to the claim by some academics this adds nothing to the market
www.kingsgate.com.au
and opens up the assertion of many market observers to the possibility of manipulation. However, it seems to rest in the too hard basket for market regulators. The Nueva Esperanza Project in Chile has been given a new lease of life in recent times with the strong silver and gold prices changing completely
3
Chairman’s Review
Chairman’s Review
Mining in A Pit
The Company is now in a financially secure position and in good stead to plan its future progression. I would like to thank our employees and management for their continued support and excellent performance over the past year. Of particular note was the mine operations in getting the plant back to capacity in such a short period after quite a major mishap. its economics. As has been reported previously the buying out of the upfront royalty payments and the purchase of the water rights has significantly improved the corporate structure. Drilling has been completed over recent months to test the viability of using a heap-leach process leading to a feasibility study later this year. This should reduce the capital costs required in order to get into production. Despite renewed corporate interest from a number of sources we are well advanced in hiving off a separate company to get the project into operation. Already there is much interest from brokers and investors to participate and we will retain a significant interest. Whilst the current uncertainties in the world should overall be bullish for gold, the current political situation in Australia is quite perplexing.
Having endured what is arguably the worst government in memory things seem to go from bad to worse. The ham-fisted measures taken in the Federal Budget have already caused major disruption in the housing market and have been roundly condemned by most commentators. The pig-headed approach to energy policy and its disastrous effect on the Australian economy is realised by many thinking people but the ideology holds sway over common sense in the halls of power, despite the example of the devastation of the German economy caused by similar stupidity. The outlook for the current year is pretty good, despite some unexpected rock falls, the partial closure of plant 1 for seven weeks and an increase in waste material that needs to be moved over coming months.
No year is easy in Thailand and I would like to thank everybody involved for their dedication and loyalty. This year we have also welcomed two new directors – Kerry Stevenson and Greg Orell – and I thank them for their contributions during the year and we look forward to the future with renewed vigour.
Ross Smyth-Kirk OAM Executive Chairman
4 Managing Director & CEO's Report
Managing Director & CEO’s Report FY2026 was indeed a landmark year for Kingsgate. Having restored Chatree to full mining and processing operations, we converted that operational platform into consistent production, record financial performance, a substantially stronger balance sheet, and resumed returns to shareholders. The result demonstrates how far your Company has progressed and provides a strong foundation for the next stage of growth.
Chatree produced 86,078 ounces of gold and 766,009 ounces of silver for the year, or 97,159 gold equivalent ounces.1 Importantly, this was achieved through sustained performance rather than reliance on any single quarter. By year end, Chatree had delivered six consecutive quarters of more than 20,000 ounces of gold production, reflecting the growing stability of the mining and processing operation.
〉
All-in sustaining costs before royalties of US$1,178 per ounce, US$372 per ounce below the lower end of guidance;
〉
Record net profit after tax of A$277.9 million, driven by stronger production, disciplined cost management, and supportive realised metal prices;
〉
Cash, bullion and doré of A$179.2 million at 30 June 2026;2
Key highlights for FY2026 included:
〉
A reduction in Nebari borrowings of approximately A$38 million during the year, leaving approximately A$14 million outstanding at year end;
〉
The return of approximately A$27 million to shareholders through the payment of a 10-cent interim dividend;
〉
Gold production of 86,078 ounces and silver production of 766,009 ounces, meeting full-year production guidance;
〉
Six consecutive quarters of gold production above 20,000 ounces by the end of the financial year;
1 Gold equivalent was calculated on a quarterly basis using the average realised sale price for gold and silver for the period, and then aggregated for the full year. 2 Total cash includes restricted cash of A$26 million.
www.kingsgate.com.au
5
Managing Director & CEO’s Report
Managing Director & CEO's Report
Crushed ore conveyed into the processing plant for further size reduction
〉
The resolution of the long-running TAFTA arbitration by mutual agreement with the Kingdom of Thailand;
〉
Kingsgate’s inclusion in the S&P/ASX 200 Index in June 2026, recognising the Company’s growth, increased market relevance and improved liquidity; and
〉
Kingsgate’s position as the second-best performing stock in the ASX All Ordinaries for calendar year 2025.3
The cost result was particularly pleasing. While stronger metal prices increased royalty payments materially, our focus remained on maintaining downward pressure on the operating cost base. Delivering an AISC before royalties of US$1,178 per ounce, well below guidance, reflects improved plant performance, disciplined mine planning and the continued efforts of our teams to lift productivity across the operation. The cash generated at Chatree enabled Kingsgate to make significant progress on its capital allocation priorities. We continued to reduce debt, strengthened available liquidity, and resumed dividends after a long absence. Returning approximately A$27 million to shareholders through the payment of a 10-cent interim dividend was an important milestone. It demonstrates the Company’s capacity to reward our shareholders while retaining the financial flexibility required to sustain Chatree, invest in exploration, and pursue disciplined growth opportunities. The resolution of the TAFTA arbitration by mutual agreement during the year allowed Kingsgate
and the Thai Government to move forward on a constructive basis. Our relationship with the Thai Government remains strong, and our attention is firmly focused on Chatree’s continued operation and its contribution to Thailand. We are committed to maintaining strong relationships with government, regulators and the communities surrounding the mine. Our inclusion in the S&P/ASX 200 was also a significant milestone, reflecting the transformation in Kingsgate’s scale, financial performance, and market standing since the restart of Chatree. This followed an exceptional calendar year for shareholders, with Kingsgate finishing 2025 as the second-best performing stock in the ASX All Ordinaries3. While this recognition is welcome, our priority remains the consistent execution and disciplined decision-making required to create enduring value for shareholders. Safety also remains fundamental to every aspect of our operations. While our performance compares favourably with relevant industry benchmarks, any injury is one too many. We will continue to strengthen critical controls, reinforce visible leadership in the field, and ensure that lessons from operational events are embedded across the business. Nueva Esperanza also advanced during the year through work that improved its development options and corporate readiness. With the project now benefiting from a simpler ownership structure, long-term water access, and a technical program assessing a lower-capital heap-leach pathway, Kingsgate is well advanced in
evaluating options to unlock value while retaining meaningful exposure for our shareholders. Importantly, none of these outcomes would have been possible without the dedication and commitment of our people. I would like to thank everyone across Kingsgate, Akara and Nueva Esperanza for their hard work, professionalism, and resilience throughout the year. I also acknowledge our local communities, contractors, business partners and government stakeholders in Thailand, Chile, and Australia for their continued support. In conclusion, FY2026 established Kingsgate as a financially strong, consistent producer with a proven operating platform and a clear pathway for further value creation. Our task now is to build on that position safely, consistently, and with the same discipline that delivered this year’s results. I am confident that Kingsgate enters FY2027 well placed to build on this momentum, and continue its progress towards becoming a leading mid-tier gold producer.
Jamie Gibson
Managing Director and Chief Executive Officer
3 https://www.abc.net.au/news/2025-12-31/asx-ends-stressful-year-with-gold-and-lithium-stocks-surging/106188730
6 Operations Report
M YA N M A R LAOS Chiang Mai
Operations Report
CHATREE GOLD MINE Phichit
Phetchabun
THAILAND Bangkok
Chatree Gold Mine Chatree Gold Mine delivered a strong operational performance during the year ended 30 June 2026, producing 86,078 ounces of gold and 766,009 ounces of silver, at an all-in sustaining cost (AISC) of US$2,123 per ounce. Total sales for the current year were 86,125 ounces of gold and 739,238 ounces of silver at an average price of US$4,176 per ounce for gold and US$61.28 per ounce for silver. Chatree recorded a Total Recordable Injury Frequency Rate (TRIFR) of 7.05 for the year. In December, an independent review of Chatree’s HSEC management systems was conducted, which included a review of Safety and Health Management Systems, Chatree’s Major Risk Register and control frameworks. During the December quarter Kingsgate’s Thai subsidiary Akara Resources Public Company Limited (Akara), received ISO certification for ISO 9001:2015 – Quality Management System, ISO 14001:2015 – Environmental Management System, ISO 45001:2018 – Occupational Health and Safety Management System. A total of 22.1 million tonnes of material was moved during the year, comprising 6.1 million tonnes of ore and 16.0 million tonnes of waste, compared with 14.8 million tonnes of total material movement (including 4.5 million tonnes
www.kingsgate.com.au
M A L AY S I A
of ore) in the prior year. During the year, a new 6030 Caterpillar excavator arrived at Chatree and became operational in February 2026. The new excavator joins Chatree’s existing fleet and will help improve mining rates and support larger waste tonnage movements. Stockpile ore reclaim increased over the year (relative to the year ended 30 June 2025), enabling construction of the new expanded run-of-mine (ROM) facility which was completed in December 2025. The new, larger ROM design contains 10 “fingers” of varying grade, and
lithology type to optimise crusher feed blending for the processing facility. As at 30 June 2026, 4.27 million tonnes of ore stockpiles remained with an average contained gold grade of 0.42 grams per tonne, representing approximately 57,679 ounces of in situ gold. A custom gearbox for the Plant #1 SAG mill was installed prior to year end to improve reliability and minimise future maintenance downtime. Pleasingly, Plants #1 and #2 continued to operate well above their nameplate capacity of 5 million tonnes per annum and operated at approximately 5.47 million tonnes per annum for the year ended 30 June 2026. A total of approximately 5.47 million tonnes of ore with an average head grade of 0.60 grams per tonne of gold was processed during the year (year ended 30 June 2025: 5.42 million tonnes at 0.53 grams per tonne). Gold and silver recoveries both improved over the year ended 30 June 2026, at an average of 83.0% for gold and 60.7% for silver (year ended 30 June 2025: 82.3% for gold and 58.2% for silver). Plant availability for the year was 93.7% (year ended 30 June 2025: 95.7%).
7
Operations Report
Operations Report
Aerial view of the Chatree Gold Mine’s Processing Plants 1 and 2
Thailand-Australia Free Trade Agreement (TAFTA) As announced on 27 November 2025 (Refer to ASX: KCN release titled, “TAFTA Update”), Kingsgate and the Kingdom of Thailand respectively requested the Tribunal to terminate the arbitration proceedings commenced in November 2017 under the Thailand-Australia Free Trade Agreement (TAFTA), without the issuance of an award or a settlement agreement. The Tribunal acknowledged the parties’ requests, and on 29 December 2025 issued a formal order terminating the arbitration accordingly.
Technical studies During the year, a number of integrated technical and strategic workstreams were progressed to optimise the Chatree operation and support its continued development. These activities also provide key inputs to the preparation of the Mine Plan, which is currently being developed and is planned for submission later in 2026.
Land acquisition Land acquisition was progressed to secure the additional land required to support future mining activities and maintain flexibility for the continued operation of the mine. The program has secured land for future waste and tailings storage, providing additional capacity beyond the current mine plan. The acquired land will be incorporated into the Mine Plan, while discussions with other landowners continue to preserve opportunities for further mine life extension.
More details on the land acquisition are provided in the Company’s announcement (Refer to ASX: KCN release titled, “Strategic Land Secured to Support Chatree Mine Expansion”) dated 29 July, 2026.
Water management Water management remains an important focus as Chatree continues to operate as a no-release site. During the year, the Company built a stronger technical understanding of the site’s water system and continued to invest in its water management capability. A key step was expanding water transfer capacity, supporting the Company’s ability to move water across the site and manage it within a no release framework. To help reduce the onsite water inventory, the Company also invested in additional evaporation capacity, which is expected to be operational in H1 FY2027. Building on this improved understanding and capability, the Company progressed development of its Water Treatment and Share Strategy, structured around two complementary phases. A concept study assessing water treatment options is now substantially complete and underpins the strategy, which is designed to reduce the onsite water inventory, establish long-term treatment capacity, and support delivery of the mine plan while maintaining flexibility across mining fronts. The first phase, planned for the coming financial year, involves in pit treatment and a mobile treatment plant to improve water quality for use within operations, together with a controlled
irrigation trial on Company owned land using treated water, subject to the required technical work and approvals. The second, longer term phase would involve permanent treatment infrastructure and a potential controlled release or water sharing arrangement, subject to further study, design, consultation and regulatory approval. The strategy also reflects consideration for broader community benefit, including the beneficial use of treated water and the potential for proceeds from irrigation trials to support community development. Engagement with regulators and local communities will continue as the strategy progresses, building on Chatree’s established community relationships. In addition to the above, the Company has also been progressing water studies for the South-East Complex during the year. This included the installation of monitoring bores, baseline groundwater monitoring and pumping tests in preparation for the next stage of studies.
Tailings studies Studies continued to assess the capacity, safety and future requirements of the site’s tailings storage facilities. During the year an independent review of the tailings facilities was initiated, together with studies to identify opportunities to optimise existing storage capacity and assess potential expansion options. The outcomes of this work will inform the preferred approach to future tailings storage and provide an important input to the Mine Plan.
8 Sustainability Report
Sustainability Report Kingsgate and Akara Thailand Across our Thai operations, Kingsgate and its subsidiary Akara Resources remain focused on sound environmental, social and governance (ESG) practices and operating in a way that creates lasting value for shareholders, our people, and the communities that host the Chatree Gold Mine. Throughout FY2026, Akara continued to anchor its sustainability work around four pillars: building sustainable communities, expanding educational opportunities, enhancing health and wellbeing, and securing clean water for the region.
Communities
Community Engagement Engagement with the villages surrounding Chatree Gold Mine remains central to how Akara operates. Throughout FY2026, the Community Relations and Sustainable Development (CRD) team maintained regular contact with local communities through door-to-door visits and village meetings, complemented by Facebook, LINE Official and on-site feedback boxes. These channels provide opportunities to share operational updates, listen to residents and respond to issues raised by the community.
Sustainability Highlights for FY2026 Visited
over 7,700 households and participated in 243 village meetings
Conducted
a free annual health check for over 600 local residents across 33 villages
Planted
over 10,000 trees across 42,000 rai, plus a further 5,500 trees for on-site rehabilitation
Diverted
around 590 tonnes of mine waste for recycling
Recorded
Akara’s four-pillar sustainability strategy in action: sustainable community, educational opportunities, health and wellbeing, and clean water.
www.kingsgate.com.au
results within regulatory limits across every quarterly round of independent environmental monitoring in FY2026, covering water, air, noise, vibration and stack emissions
9 Sustainability Report
1
2
3
4
Sustainability Report
Four Pillar Strategy
Four Pillar Strategy
1
Sustainable Community
Tree planting
Women now hold 37% of supervisory roles at Akara, contributing to a more diverse and inclusive workforce
Opened the Akara Community Centre, bringing together sustainable farming demonstrations, agritourism and a shared recreation space for the community
Hosted
Thailand’s Minister of Industry on-site to see Akara’s tailings turned into low-carbon construction material through research with three Thai universities
Working alongside the Phichit and Phetchabun Forestry Centres, Akara helped plant over 10,000 new trees over 42,000 rai, while also gifting 1,570 fruit and shade tree seedlings to community volunteers. This figure is separate from the Environmental Department’s own on-site mine rehabilitation planting, reported later in this section under Environment.
Firebreak activity To reduce dry-season fire risk, Akara teamed up with the regional Forestry Centres and Forest Protection Units to clear firebreaks across nine community forests, turning 3,000 kg of collected leaf litter and branches into compost. The initiative helped safeguard roughly 4,800 rai and close to 960,000 trees, while Akara also donated firefighting equipment to support local fire prevention and response efforts.
An Akara staff member and a local student plant a sapling together under the Tree Planting with Miner program.
Cultural and religious events Akara kept up its long tradition of supporting local cultural and religious traditions, taking part in the annual Lent Candle Festival, Kathina
Akara volunteers clear a firebreak in a community forest to reduce dry-season fire risk.
Received three external awards for community and environmental performance during the year, including the CSR-Department of Primary Industries and Mines Continuous Award and the Royal Forest Department’s ‘Love the Forest, Love the Land’ commendation
u
continued
10 Sustainability Report
Household visits and village meetings Akara’s door-to-door program reached over 7,700 households across 29 villages within five kilometres of the mine in FY2026, alongside 243 village meetings to share project updates, discuss community fund activities and capture resident feedback. Community members and Akara employees gather at the Akara Community Centre’s Health and Recreation Park for its soft opening and the ‘MIND Market’, 25 March 2026. Akara representatives take part in a merit-making ceremony marking the end of Buddhist Lent Day at a temple near the Chatree Gold Mine. Samakkee merit-making ceremonies at nearby temples, and seasonal celebrations such as Songkran, Loy Krathong and Tak Bat Devo, a traditional Buddhist alms-giving ceremony, in villages throughout the area.
Akara’s CRD member teaches English at a school in the Chatree community.
Akara Community Centre Community members and Akara employees gather at the Akara Community Centre’s Health and Recreation Park for its soft opening and the ‘MIND Market’, 25 March 2026. Community members including Akara employees browse local vendor stalls at Akara Community Centre.
developing local capacity for agri-tourism through a learning centre and homestay; and providing shared recreational facilities, including a Health and Recreation Park with a football field, pétanque and badminton courts, a jogging track, playground and multi-purpose plaza. On 25 March 2026, Akara held a soft opening for the park with the ‘MIND Market’, organised in collaboration with the Phetchabun and Phichit Provincial Industry Offices. The event provided a platform for local businesses and community enterprises to showcase and sell their products to approximately 3,000 Akara employees and partners. Activities also included a friendly pétanque match between employees and villagers and a musical performance by students from the “Akara Academy” tutoring program.
To mark the third anniversary of the Chatree Gold Mine restarting operations, Akara opened the Akara Community Centre in March 2026. Located behind the Akara Friends of the Community office, the facility combines agricultural learning, community recreation and shared public space. Akara employees hand-deliver krathongs, part of 300 donated to three nearby temples for the festival.
Agricultural Clinic Through its Science & Health team, Akara’s Agricultural Clinic supported more than 40 farmers across over 1,200 rai through free soil testing, the provision of 9,000 kg of dolomite and 50 tonnes of soil-improvement lime. Working with local farmers and the Phichit Land Development Station, the program promoted better soil management and helped farmers improve their understanding of soil health and sustainable farming practices.
Recycling Roughly 590 tonnes of waste from the Chatree Gold Mine was recycled during the year.
Akara Community Centre’s Health and Recreation Park.
www.kingsgate.com.au
The Centre is designed to support three areas: promoting mixed and water-efficient farming methods, including the ‘Khok Nong Na’ water and soil management model and the cultivation of crops such as durian as alternatives to single-crop rice and sugarcane farming;
Community members including Akara employees browse local vendor stalls at the Akara Community Centre.
11 Sustainability Report
Educational Opportunities
3
Health & Wellbeing
4
Clean Water
Support for local schools
Community health checks
Water filtration
Akara continued to support education in local schools and communities through a range of initiatives, including coordinating school activities, improving infrastructure and volunteer teaching. Employees volunteered as teachers at primary schools near the mine and taught English and Chinese lessons, while scholarships and other education initiatives supported children from financially disadvantaged families.
Akara’s flagship Community Health Check provided more than 600 residents from 33 villages within five kilometres of the Chatree Gold Mine with free health screenings, including general check-ups, lung-function tests, X-rays, laboratory tests and biochemical screening for arsenic, manganese and cyanide. Supported through Akara’s Health Monitoring Fund, the program works in partnership with local sub-district health hospitals, which receive the results to support any necessary follow-up.
Akara kept its network of filtration stations around Chatree running throughout the year, continuing to track water quality through regular pH, hardness, turbidity and conductivity testing.
Akara Academy Akara Academy continued to provide free weekend learning opportunities for children aged seven to twelve, offering English, Chinese, Thai, Thai music and, newly this year, mental arithmetic. The program also celebrated graduates from previous seasons through a certificate ceremony and community craft market, providing opportunities for children and local vendors to showcase their creativity and skills.
Sustainability Report
2
Water for the Chatree community In FY2026, Akara supplied more than 130,000 bottles of drinking water to households, schools, temples and community gatherings in the Chatree community.
Community sporting events Akara supported a year-round program of sporting and recreational activities designed to promote health and strengthen community connections. Activities included the Akara Football Cup, sponsorship of a local football club, the Chalawan Running and Night Bike events, and village-level sporting tournaments. The Akara Sport Complex also provided shared facilities for football, pétanque, badminton, sepak takraw and jogging, as well as a venue for community events.
Employees health checks All Akara employees underwent annual health examinations under the company’s occupational health program, with key contractors held to the same standard for their own workers.
Akara employees help a student pick out a school uniform during the “Backto-School Shopping, Year 5” event, Phetchabun, 28 April 2026.
Children take part in a mental arithmetic class at Akara Academy.
Opening ceremony of Akara’s 2026 annual Community Health Check event, held with the support of local health authorities.
Villagers queue for X-ray checks at the annual Community Health Check event, FY2026.
Akara staff carry out routine water quality testing as part of the company’s ongoing support for clean water in communities surrounding the mine.
u
continued
12 Sustainability Report
Ms Wijittra Thongpliw (left), Senior Civil Engineer, reviews engineering plans on site at the Chatree Gold Mine.
People Workforce Local hiring remains a priority at Chatree as 98% of Akara’s employees are Thai nationals, and over 80% come from communities surrounding the mine. Women currently hold 37% of supervisory roles at Akara, reflecting the company’s focus on building a diverse workforce. Together, these efforts contribute to a longer-term talent pipeline, including by encouraging more women to pursue technical and field-based roles. Male Employees 63%
Female Employees 37%
A specialist from ALS, an independent environmental consultant, measures dust and air quality levels at one of the monitoring stations around the Chatree Community.
Environment Supervisory level employees
Health & Safety A key focus for FY2026 was further strengthening health and safety initiatives at the Chatree Gold Mine. During the year, Akara staff participated in a range of annual training sessions including; first aid, rope access, chemical management and cyanide leakage training.
www.kingsgate.com.au
Water
Dust
Chatree continued to operate on a nil-release basis, with rainfall captured and managed within the mine lease to prevent the discharge of water from the site. During FY2026, third-party specialists monitored 100 water quality points — 73 groundwater and 27 surface water — on a quarterly basis. Monitoring results remained within applicable water quality standards throughout the year.
Nine dust monitoring stations were checked quarterly by independent consultants, backed by three real-time PM2.5 monitors, and every reading stayed within permissible limits throughout FY2026.
13
Sustainability Report
Sustainability Report
Mr Cherdsak Utha-aroon, General Manager of Sustainability, escorts Minister of Industry Thanakorn Wangboonkongchana and his delegation on a tour of the Chatree Gold Mine, 27 February 2026.
Noise and vibration
Climate and circular economy
Awards and Recognition
Independent monitoring covered nine sites for noise and nine nearby villages for vibration, with results reported twice yearly to Akara and relevant authorities. Noise levels were within Thai Ministry of Natural Resources and Environment guidelines throughout the year, and vibration stayed below the thresholds set by the Ministry of Science’s Control Standards for Rock Crushing Plants.
FY2026 saw Akara achieve Carbon Footprint for Organization (CFO) certification and establish long-term climate commitments to Carbon Neutrality by 2050 and Net Zero by 2065. A rooftop solar initiative reduced grid electricity consumption at the Exploration and Community Relations team buildings by an average of 30%, with savings reaching 41% compared with the previous year. Meanwhile, ongoing circulareconomy research with several Thai universities is exploring the potential to convert mine tailings into low-carbon construction materials and biocement.
During FY2026 Akara’s community and environmental initiatives received external recognition on a number of occasions. On 12 September 2025, Akara received the 2025 Corporate Social Responsibility Promotion Award from the Ministry of Social Development and Human Security, recognising the company’s CSR performance in Phichit Province.
Ministerial Visit to Chatree
Mr Phuriwit Sangsiri, Head of Science & Health Department, showcases cement blocks made from Akara’s mine tailings at the “Tailings: Voices from Three Universities to Real-World Applications” seminar held on 8 May 2026.
On 27 February 2026, Thailand’s Minister of Industry, Thanakorn Wangboonkongchana, visited the Chatree Gold Mine with a ministry delegation to observe mining operations and discuss the role of the sector in Thailand’s industrial development. During the visit, the Minister highlighted mining as a critical upstream industry supporting the national economy and the supply of raw materials to downstream and emerging industries, while emphasising the importance of operating within a strong and transparent legal framework that considers the quality of life of surrounding communities.
Rehabilitation Around 40,200 square metres of disturbed ground was rehabilitated on site during FY2026, with 5,500 native trees planted as part of the ongoing restoration work.
On 18 September 2025, as part of the Royal Forest Department’s 129th anniversary, Akara received the department’s ‘Love the Forest, Love the Land’ commendation in recognition of its support for forest restoration initiatives around the mine. On 19 February 2026, Akara received the CSR-DPIM Continuous Award 2025 from the Department of Primary Industries and Mines.
Ms Yuwathida Phuk-on, Community Relations and Sustainable Development Manager, accepts the CSR Award 2025 from the Ministry of Social Development and Human Security, 12 September 2025.
14 Projects Report
PERU BOLIVIA
Projects Report
PA R A G U AY
Antofagasta
NUEVA ESPERANZA Copiapo
CHILE Santiago
ARGENTINA
Nueva Esperanza Silver – Gold Chile Nueva Esperanza is a prospective, pre-feasibility stage silver-gold development project located in the Atacama region of Chile, 140 km from Copiapo. The project is one of South America’s largest undeveloped silver deposits and is located in the Maricunga Belt where mines such as Salares Norte (Goldfields), Fenix (Rio2) and La Coipa (Kinross) operate.
Drill rig mobilisation and camp construction Drilling company Georock was awarded the contract to collect 1,100 m of fresh samples of PQ3 drill core from Arqueros, Chimberos and Teterita orebodies for comminution and leach metallurgical testwork utilising latest technologies.
Water bores equipping and pumping The two water bores for which the Nueva Esperanza Project has a permit to extract up to 50 litres per second were required to be fully equipped and capable of extracting water at licence capacity by 31 August 2026 to comply with the licensing agreement. Live pumping data must be relayed to the regulator to confirm that the work has been satisfactorily completed.
www.kingsgate.com.au
Water specialist company Hidrogestion was engaged to complete the work. Contract supervision was managed by hydrogeology consultant John McCartney and Laguna Resources personnel.
Mobilisation and construction of a camp for approximately 30 personnel from Georock and Hidrogestion has been completed. The diamond drill rig and ancillary earthmoving equipment arrived on site in late June in preparation for drilling to commence in July. Drilling was expected to take two to three months to complete depending upon weather. Contract geologists and field assistants were engaged to supervise and support the fieldwork.
15
Projects Report
Projects Report
Scanning technology Technology provider Veracio (Santiago) was engaged to conduct hyperspectral scanning of the metallurgical drill core to map alteration minerals and XRF non-destructive scanning to determine silver content. Results will be analysed to optimise selection of representative samples for comminution and leach testwork.
Technical, mining and engineering company engagement Meetings have been held with various Santiago-based metallurgical, analytical, environmental, mining contractor and engineering companies to prepare the project for a Feasibility Study.
Mineral Resource and Ore Reserve update
Matters subsequent
Cube Consulting has updated the Mineral Resources and Ore Reserves estimates to incorporate higher silver and gold forecast prices and a reduction of royalty considerations due to the purchase of royalties from Anglo American during 2026. Estimates were published on 10 September 2026 (refer Nueva Esperanza Mineral Resources and Ore Reserves Statement September 2026 available to view on www.kingsgate.com.au).
The water bores were equipped and pump-tested for a 24-hour period with verification of pumping rates by a notary. Supporting documentation was submitted to the regulator in late August 2026 to meet water extraction licensing requirements.
Water Bores
Drilling Metallurgical Drillhole TET-02 (103 m PQ3 core, vertical hole) was completed on 15 July. Recovery was excellent at >99%. The hole was designed to twin an historic drillhole to provide representative samples of lithology and grade for comminution and metallurgical testwork. Metallurgical Drillhole TET−01 (planned 111 m PQ3 Core, −60 degrees) was drilled to 50.6 m in early August, prior to evacuation of all personnel due to a major storm event. Drilling will recommence in early September when site access is re-established.
16 Exploration Report
M YA N M A R LAOS Chiang Mai
Exploration Report
CHATREE GOLD MINE Phichit
Phetchabun
THAILAND Bangkok
CAMBODIA
During 2026, exploration activities have primarily focused on progressing the Company’s Special Prospecting Licence Applications (SPLAs) in Phichit and Phetchabun. The Company is pursuing 15 SPLA applications in Phichit and four applications in Phetchabun, which together provide a foundation for future exploration and organic growth adjacent to the Chatree operations. The Company’s most recent exploration activities were completed in 2025 and reported in the Company’s quarterly reports for that period. Activities included drilling at the T Prospect (part of the Chatree South-East Complex) targeting high-grade, shallow gold mineralisation, and drilling at the Singto prospect testing a deeper geophysical target. Exploration activities were subsequently paused pending progress of the licence application process. In Phichit, two of the 15 SPLA applications were approved on 22 June, with the remaining 13 applications progressing through the required approval processes and expected to be granted by November 2026. In Phetchabun, the four SPLA applications continue to progress through the government approval process and are expected to be granted in early 2027.
www.kingsgate.com.au
The Exploration team is preparing for the recommencement of field activities, currently planned for November 2026. This includes updating relevant operating procedures, work instructions and management systems to support the safe and efficient restart of exploration activities.
Looking ahead, the Company remains focused on organic growth through brownfields exploration around the Chatree operations. Exploration will focus on advancing priority prospects through ongoing geological reinterpretation, with drilling and other field activities expected to recommence as the relevant licences are granted.
17 Exploration Report
667500E
675000E
682500E
690000E
697500E
Exploration Report
1815000N
N
1815000N
Phitsanulok
L West
9/2554
3/2554
14/2554
10/2563
7/2554
Nok Kaeo
28/2563
Jorakee
1/2568
11/2554
11/2563 2/2568
8/2554
1800000N
9/2563
37/2563
1807500N
Kra Tae South
10/2554
Phetchabun
12/2563
1800000N
1807500N
8/2569
T
46/2563
13/2563
4/2568
Singto
4/2554
15/2554
15/2563
5/2554
Sua Dao
4/2563
5/2563
Phichit
Mangkorn
16/2554 44/2563
45/2563
Figure 1: Prospect and SPLA application locations. In Phichit, 15 SPLA applications have been submitted, two of which have been granted, with the remainder in process; priority prospects shown. In Phetchabun, four SPLA applications are in process, relating to priority prospects Jorakae, Chang Puak, Singto and Chatree SE; no new SPLA applications were submitted for Nok Kaeo, Sua Dao or Mangkorn.
3/2568
Chatree South East Complex Mining Lease
Chang Puek
3/2563
Priority Prospects 4 Phetchabun SPLAs 2 Phichit SPLs
9/2569 9/2569
Phetchabun
13 Phichit SPLAs 17 Phetchabun SPLs Expired October 2025
0 1
Other Company SPLA
667500E
675000E
682500E
690000E
5
1770000N
1777500N
Legend
1770000N
36/2563 1785000N
1785000N
7/2563
1777500N
1792500N
6/2554
1792500N
16/2563
12/2554
10 km
697500E
u
continued
18 Mineral Resources and Ore Reserves
Mineral Resources and Ore Reserves as at 30 June 2026
Overview The Mineral Resources and Ore Reserves estimates in the following tables are as at 30 June 2026. For comparison purposes, data for 2025 has been included. 〉
Metric units are used throughout.
〉
All data is presented on a 100% asset basis.
〉
Mineral Resources and Ore Reserves are estimated as dry tonnes unless otherwise noted.
〉
Mineral Resource tonnes and grade are reported on an in situ basis.
〉
Mineral Resources are reported within a RPEEE shell.
estimates; there may therefore be small differences in the totals.
〉
Ore Reserve tonnes and grades are reported considering all relevant modifying factors including mining losses and dilution, operating and capital costs, process recovery factors and current mining approvals, based on recent mine operating performance, where relevant and budget estimates.
〉
All tonnage information has been rounded to reflect the relative uncertainty in the
〉
For Chatree, contained gold decreased by 4% and contained silver decreased by 7%, attributed entirely to mining depletion.
〉
For Nueva Esperanza, there was a 1% increase in contained gold and a 3% increase in contained silver. Details on the changes to the Nueva Esperanza Mineral Resource is set out in the announcement Nueva Esperanza
〉
All tenements are in good standing, and upon expiry will be eligible for a standard renewal.
〉
Commodity prices and exchange rates used to establish the economic viability of Ore Reserves are based on long-term forecasts applied at the time the Ore Reserve was estimated.
Mineral Resources As at 30 June 2026, Mineral Resources, inclusive of Ore Reserves, were estimated to contain 3.5 million ounces of gold and 85.9 million ounces of silver. Compared with the previous estimate as at 30 June 2025, this represents a decrease of 4% in contained gold and no change in contained silver.
Resources and Reserves Update September 2026 released on 10 September 2026 and available to view on www.kingsgate.com.au. For detailed tonnage, grade and metal content categorised by confidence classification, refer to the Mineral Resources table below.
Mineral Resources (inclusive of Ore Reserves) 1 2 3 4 7 9 Measured Resources Tonnes
Indicated Resources
Grade
Tonnes
Inferred Resources
Grade
Tonnes
Grade
Deposit
Mt
Au g/t
Ag g/t
Mt
Au g/t
Ag g/t
Mt
Au g/t
Ag g/t
Chatree 1 2 Open Pit Stockpiles South-East Complex 7
14.1 4.3 –
0.76 0.42 –
6.3 7.1 –
69.1 – 13.0
0.75 – 0.65
5.6 – 4.5
23.6 – 13.9
0.63 – 0.61
3.9 – 5.1
Total Chatree
18.3
0.68
6.5
82.2
0.74
5.5
37.5
0.62
4.3
–
–
–
26.1
0.34
68
4.7
0.48
37
26.1
0.34
68
4.7
0.48
37
Nueva Esperanza 3 4 9 Open Pit Total Nueva Esperanza Total Mineral Resources
www.kingsgate.com.au
19
Mineral Resources and Ore Reserves
Mineral Resources and Ore Reserves
Aerial view of A-Pit at Chatree
Total Resources June 2026 Tonnes
Grade
June 2025 Contained Metal
Tonnes
Grade
Contained Metal
Mt
Au g/t
Ag g/t
Au Moz
Ag Moz
Mt
Au g/t
Ag g/t
Au Moz
Ag Moz
106.8 4.3 26.9
0.73 0.42 0.63
5.3 7.1 4.8
2.5 0.1 0.5
18.3 1.0 4.2
113.6 3.6 26.9
0.72 0.43 0.63
5.5 7.3 4.8
2.6 0.1 0.6
20.1 0.8 4.2
138.0
0.70
5.3
3.1
23.5
144.1
0.70
5.4
3.2
25.1
30.8
0.36
63
0.36
62.4
29.4
0.38
64
0.36
60.7
30.8
0.36
63
0.36
62.4
29.4
0.38
64
0.36
60.7
168.8
0.64
15.8
3.5
85.9
173.5
0.65
15.4
3.6
85.8
u
continued
20 Mineral Resources and Ore Reserves
Ore Reserves As at 30 June 2026, Ore Reserves were estimated to contain 1.4 million ounces of gold and 61.4 million ounces of silver. Compared with the previous estimate as at 30 June 2025, this represents a decrease of 3% in contained gold and an increase of 22% in contained silver.
〉
For Chatree, contained gold decreased by 9% and contained silver decreased by 12%, attributed entirely to mining depletion.
〉
For Nueva Esperanza, contained gold increased by 37% and contained silver increased by 31%, attributed to increased
metal price assumptions and the purchase of the Anglo Royalty in 2026. Further detail is set out in the announcement referenced earlier. For detailed tonnage, grade and metal content categorised by confidence classification, refer to the Ore Reserves table below.
Ore Reserves 5 6 8 Proved Reserves Tonnes
Probable Reserves
Grade
Tonnes
Deposit
Mt
Au g/t
Ag g/t
Chatree 6 Open Pit Stockpiles
8.1
0.83
Total Chatree
8.1
Nueva Esperanza 8 Open Pit Total Nueva Esperanza
Grade
Mt
Au g/t
Ag g/t
6.9
33.9 4.3
0.81 0.42
6.2 7.1
0.83
6.9
38.2
0.77
6.3
–
–
–
23.7
0.34
68
–
–
–
23.7
0.34
68
Total Ore Reserves
Governance Assurance processes and internal controls applied to verify the Mineral Resources and Ore Reserves estimates includes: 〉
Processes for public reporting aligned with ASX Listing Rules Chapter 5 (2019) and the Australasian Code for Reporting of Exploration Results, Mineral Resources and Ore Reserves, December 2012 (JORC Code);
〉
Independent assessment of new or materially changed estimates; and
〉
Reconciliation performance metrics to validate Chatree Ore Reserve.
Endnotes to the Mineral Resources and Ore Reserves tables 1.
Chatree metallurgical recoveries are 86.4% Au and 57.9% Ag based on metallurgical testwork and plant performance.
2.
Chatree Mineral Resources are reported above a cut-off grade of 0.3 g/t Au within a RPEEE shell with assumed prices US$2800/oz Au and US$36/oz Ag.
3.
Nueva Esperanza metallurgical recoveries vary from 82% to 90% for gold and 71% to 88% for silver depending upon the deposit and the mineralogy.
4.
Nueva Esperanza Mineral Resources are reported above cut-off criteria as follows: Arqueros NSR$21.50 US/t; Chimberos NSR$21.56 US/t and Teterita 30 g/t Ag within a RPEEE shell with assumed prices US$3000/oz Au and US$38.50/oz Ag.
5.
www.kingsgate.com.au
Ore delivered to processing facility.
6.
Chatree Ore Reserves are reported above a break-even cut-off grade of NSR$16.16 using a gold price of US$1950/ oz and a silver price of US$26/oz.
7.
There is no Ore Reserve estimate for South-East Complex.
8.
Nueva Esperanza Ore Reserves are reported above a break-even cut-off grade of Arqueros NSR$21.50 US/t, Chimberos NSR$21.56 US/t and Teterita NSR$25.18 US/t using a gold price of US$2500/oz and a silver price of US$35/oz.
9.
Silver grades for the Indicated and Inferred Mineral Resource categories reported in the Nueva Esperanza Resources and Reserves Update September 2026 and released on 10 September 2026, have been corrected. Total contained metal is unchanged.
21
Mineral Resources and Ore Reserves
Mineral Resources and Ore Reserves
Royal Forest Department notice boards regarding Akara’s authorised use of forest land at Chatree
Proved and Probable Reserves June 2026 Tonnes
Grade
June 2025 Contained Metal
Tonnes
Grade
Contained Metal
Mt
Au g/t
Ag g/t
Au Moz
Ag Moz
Mt
Au g/t
Ag g/t
Au Moz
Ag Moz
42.0 4.3
0.82 0.42
6.3 7.1
1.10 0.1
8.5 1.0
48.0 3.6
0.79 0.43
6.5 7.3
1.22 0.05
10.0 0.8
46.2
0.78
6.4
1.2
9.5
51.6
0.76
6.6
1.3
10.8
23.7
0.34
68
0.26
51.9
15.8
0.37
78
0.19
39.7
23.7
0.34
68
0.26
51.9
15.8
0.37
78
0.19
39.7
69.9
0.63
27.3
1.4
61.4
67.4
0.67
23.3
1.5
50.5
22 Competent Persons Statement
Competent Persons Statement Information relating to Chatree Mineral Resources and Ore Reserves estimates is based on the Mineral Resources and Ore Reserves Statement released to ASX (ASX:KCN) on 10 October 2025, depleted for mine production to 30 June 2026. The announcement is available to view on www.kingsgate.com.au. Information relating to Nueva Esperanza Mineral Resources and Ore Reserves estimates is extracted from the ASX:KCN announcement Nueva Esperanza Resources and Reserves Update September 2026 released on 10 September 2026 and is available to view on www.kingsgate.com.au. Kingsgate confirms that it is not aware of any new information or data that materially affects the information included in the original market announcements describing the Mineral Resources and Ore Reserves referenced above, and that all material assumptions and technical parameters underpinning the estimates in the relevant market announcement continue to apply and have not materially changed. The Company confirms that the form and context in which the Competent Person’s findings are presented have not been materially modified from the original market announcement.
www.kingsgate.com.au
The information in this report that relates to the Chatree and South-East Complex Mineral Resources is based on, and fairly represents, information compiled by Racquel Kolkert, General Manager Technical Studies and Geology and a full-time employee of the Kingsgate Group, a Competent Person who is a Fellow of the Australasian Institute of Mining and Metallurgy. Ms Kolkert has sufficient experience that is relevant to the style of mineralisation and type of deposit under consideration, and to the activity being undertaken to qualify as a Competent Person as defined in the 2012 Edition of the Australasian Code for Reporting of Exploration Results, Mineral Resources and Ore Reserves. Ms Kolkert declares that she has no issues that could be perceived by investors as a material conflict of interest in preparing the reported information. Ms Kolkert has consented to the public reporting of these statements and the inclusion of the material in the form and context in which it appears. The information in this report that relates to the Chatree and Nueva Esperanza Ore Reserves estimates is based on, and fairly represents, information and supporting documentation compiled by Mitchell Rohr, Director of Mining Engineering and a full-time employee of Cube Consulting, a Competent Person who is a Member of the Australasian Institute of Mining and Metallurgy. Mr Rohr has sufficient experience that is relevant to the style of mineralisation and type of deposit under consideration, and to the activity being undertaken to qualify as a Competent Person as defined in the 2012 Edition of the Australasian Code for Reporting of Exploration Results, Mineral Resources and Ore Reserves. Mr Rohr declares that he has no issues that could be perceived by investors as a material conflict of interest in preparing the reported information. Mr Rohr has consented to the public reporting of these statements and the inclusion of the material in the form and context in which it appears.
The information in this Statement relates to the Nueva Esperanza Mineral Resources is based on, and fairly represents, information and supporting documentation compiled by Paul Hetherington, Senior Resource Geologist and a full-time employee of Cube Consulting at the time of the Mineral Resource estimation, a Competent Person who is a Member of Australasian Institute of Mining and Metallurgy. Mr Hetherington has sufficient experience that is relevant to the style of mineralisation and type of deposit under consideration, and to the activity being undertaken to qualify as a Competent Person as defined in the 2012 Edition of the Australasian Code for Reporting of Exploration Results, Mineral Resources and Ore Reserve. Mr Hetherington declares that he has no issues that could be perceived by investors as a material conflict of interest in preparing the reported information. Mr Hetherington has consented to the public reporting of these statements and the inclusion of the material in the form and context in which it appears.
23
Governance Corporate Governance Kingsgate is committed to maintaining high standards of corporate governance, underpinned by a comprehensive framework of corporate policies, procedures and training. This framework is guided by the ASX Corporate Governance Council’s Corporate Governance Principles and Recommendations (4th edition) and supports ethical and responsible decision-making, effective risk management, accountability, and the creation of sustainable long-term value for shareholders and other stakeholders. The Board believes that strong corporate governance is fundamental to the Company’s long-term success and to maintaining the confidence of shareholders, employees, regulators and the broader community. The Board regularly reviews the Company’s governance practices to ensure they remain appropriate for the Company’s size, operations and strategic objectives. Kingsgate’s 2026 Corporate Governance Statement, together with the Board and Committee Charters and key governance policies, is available on the Company’s website at https:// www.kingsgate.com.au/governance/. The importance of maintaining a robust governance framework has become increasingly significant as the Company has continued to grow, including its inclusion in the S&P/ASX 300 Index in September 2025 and the S&P/ASX 200 Index, effective June 2026. These milestones reflect Kingsgate’s strengthened market position and reinforce the Board’s commitment to governance practices that support sustainable growth and long-term value creation.
Modern Slavery Statement Kingsgate is subject to the Australian Modern Slavery Act (Cth) 2018 and will publish its third Modern Slavery Statement by the end of 2026. Kingsgate remains committed to identifying, assessing, and addressing modern slavery risks in its operations and supply chains, and will continue to report transparently on its efforts in future statements.
Governance
Governance
24 Directors' Report
Directors’ Report Your Directors present their report on the Group consisting of Kingsgate Consolidated Limited and the entities it controlled at the end of or during the year ended 30 June 2026.
Directors The following persons were Directors of Kingsgate Consolidated Limited during the year ended 30 June 2026 and up to the date of this report. Ross Smyth-Kirk OAM Executive Chairman Jamie Gibson Managing Director and Chief Executive Officer Greg Orrell Non-Executive Director (appointed 1 May 2026) Kerry Stevenson Non-Executive Director (appointed 18 March 2026) Peter Warren Non-Executive Director Nucharee Sailasuta Non-Executive Director (resigned 15 October 2025)
Principal activities Kingsgate Consolidated Limited (ASX: KCN) is an Australian gold and silver mining, development, and exploration company. The Company owns and operates the Chatree Gold Mine in Thailand and is advancing the Nueva Esperanza Silver-Gold Project in Chile. Kingsgate’s strategy is focused on delivering long-term value to shareholders through operational excellence, prudent financial management, and disciplined growth across its portfolio of precious metal assets.
www.kingsgate.com.au
Dividends 〉
An interim dividend declared for the half-year ended 31 December 2025 of 10 cents per fully paid share was paid on 10 April 2026 (31 December 2024: nil).
〉
Since year end the Directors have recommended the payment of an unfranked final dividend of 10 cents per fully paid ordinary share (30 June 2025: nil). The proposed dividend totals $26,604,816.10 and is expected to be paid on 11 November 2026 out of retained earnings as at 30 June 2026. This amount has not been recognised as a liability at year end.
Review of operations and results Operational performance Chatree Chatree Gold Mine delivered a strong operational performance during the year ended 30 June 2026, producing 86,078 ounces of gold and 766,009 ounces of silver, at an all-in sustaining cost (AISC) of US$2,123 per ounce. Total sales for the current year were 86,125 ounces of gold and 739,238 ounces of silver at an average price of US$4,176 per ounce for gold and US$61.28 per ounce for silver. Chatree recorded a Total Recordable Injury Frequency Rate (TRIFR) of 7.05 for the year. In December, an independent review of Chatree’s HSEC management systems was conducted, which included a review of Safety and Health Management Systems, Chatree’s Major Risk Register and control frameworks. During the December quarter Kingsgate’s Thai subsidiary Akara Resources Public Company Limited (Akara), received ISO certification for ISO 9001:2015 – Quality Management System, ISO 14001:2015 – Environmental Management System, ISO 45001:2018 – Occupational Health and Safety Management System.
A total of 22.1 million tonnes of material was moved during the year, comprising 6.1 million tonnes of ore and 16.0 million tonnes of waste, compared with 14.8 million tonnes of total material movement (including 4.5 million tonnes of ore) in the prior year. During the year, a new 6030 Caterpillar excavator arrived at Chatree and became operational in February 2026. The new excavator joins Chatree’s existing fleet and will help improve mining rates and support larger waste tonnage movements. Stockpile ore reclaim increased over the year (relative to the year ended 30 June 2025), enabling construction of the new expanded run-of-mine (ROM) facility which was completed in December 2025. The new, larger ROM design contains 10 “fingers” of varying grade, and lithology type to optimise crusher feed blending for the processing facility. As at 30 June 2026, 4.27 million tonnes of ore stockpiles remained with an average contained gold grade of 0.42 grams per tonne, representing approximately 57,679 ounces of in situ gold. A custom gearbox for the Plant #1 SAG mill was installed prior to year end to improve reliability and minimise future maintenance downtime. Pleasingly, Plants #1 and #2 continued to operate well above their nameplate capacity of 5 million tonnes per annum and operated at approximately 5.47 million tonnes per annum for the year ended 30 June 2026. A total of approximately 5.47 million tonnes of ore with an average head grade of 0.60 grams per tonne of gold was processed during the year (year ended 30 June 2025: 5.42 million tonnes at 0.53 grams per tonne). Gold and silver recoveries both improved over the year ended 30 June 2026, at an average of 83.0% for gold and 60.7% for silver (year ended 30 June 2025: 82.3% for gold and 58.2% for silver). Plant availability for the year was 93.7% (year ended 30 June 2025: 95.7%).
25
Directors' Report
Directors’ Report
Thailand-Australia Free Trade Agreement (TAFTA)
Water bores equipping and pumping
As announced on 27 November 2025 (Refer to ASX: KCN release titled, “TAFTA Update”), Kingsgate and the Kingdom of Thailand respectively requested the Tribunal to terminate the arbitration proceedings commenced in November 2017 under the Thailand-Australia Free Trade Agreement (TAFTA), without the issuance of an award or a settlement agreement. The Tribunal acknowledged the parties’ requests, and on 29 December 2025 issued a formal order terminating the arbitration accordingly.
There are two water bores for which the Nueva Esperanza Project has a permit to extract up to 50 litres per second. The bores are required to be fully equipped to enable live pumping data to be relayed to the regulator to confirm that the work has been satisfactorily completed. Water specialist company Hidrogestion was engaged to complete the work. Contract supervision was managed by hydrogeology consultant John McCartney and Laguna Resources personnel.
〉
unrestricted group cash of $85.6 million;
Nueva Esperanza Silver-Gold Project, Chile
Drilling company Georock was awarded the contract to collect 1100m of fresh samples of PQ3 drill core from Arqueros, Chimberos and Teterita orebodies for comminution and leach metallurgical testwork utilising latest technologies.
〉
bullion in safe (unrefined gold and silver) of $36.7 million;
〉
bullion receivables held at the Precious Metals Refining Company Limited (“PMR”) of $30.9 million and proceeds received in July 2025; and
Mobilisation and construction of a camp for approximately 30 personnel from Georock and Hidrogestion occurred prior to the end of FY2026. The diamond drill rig and ancillary earthmoving equipment arrived on site in late June in preparation for drilling to commence in July.
〉
restricted cash of $26.0 million relating predominantly to community and rehabilitation fund commitments.
Nueva Esperanza is a prospective, pre-feasibility stage silver-gold development project located in the Atacama region of Chile, 140km from Copiapo. The project is one of South America’s largest undeveloped silver deposits and is located in the Maricunga Belt where mines such as Salares Norte (Goldfields), Fenix (Rio2) and La Coipa (Kinross) operate.
Scanning technology
Drill rig mobilisation and camp construction
Technology provider Veracio (Santiago) was engaged to conduct hyperspectral scanning of the metallurgical drill core to map alteration minerals and XRF non-destructive scanning to determine silver content. Results will be analysed to optimise selection of representative samples for comminution and leach testwork.
Financial results As at 30 June 2026, the Group’s total cash and bullion totalled $179.2 million comprising of the following:
Contract geologists and field assistants were engaged to supervise and support the fieldwork.
Financial results Net profit/(loss) after tax ($’000) EBITDA ($’000) Dividends paid (cents/share) Share price 30 June ($/share) Basic earnings/(loss) per share (Cents) Diluted earnings/(loss) per share (Cents)
2026
2025
2024
2023
2022
277,912 343,541 10 4.95 106.2 106.2
29,457 94,458 – 2.26 11.4 11.0
199,761 213,789 – 1.62 77.5 76.8
4,738 11,072 – 1.51 2.06 2.04
(12,420) (10,406) – 1.33 (5.61) (5.61)
u
continued
26 Directors' Report
Production summary Units
2026
2025
kilotonnes kilotonnes Waste:ore
6,149 15,993 2.6:1
4,539 10,303 2.3:1
Units
2026
2025
2024
2023
kilotonnes Au g/t Ag g/t
5,472 0.60 7.4
5,417 0.53 6.2
3,456 0.41 7.87
723 0.55 9.71
Gold recovery Silver recovery
% %
83.0 60.7
82.3 58.2
81.0 54.4
83.2 56.8
Gold poured Silver poured
ounces ounces
86,078 766,009
74,661 625,698
37,015 460,356
9,705 112,097
ounces ounces US$/oz US$/oz
86,125 739,238 4,176 61.28
70,210 601,231 2,848 31
36,546 451,706 2,084 25
8,437 97,693 1,964 23
Units
2026
2025
Change (%)
$’000 $’000 $’000 $’000
596,446 (266,982) (54,561) 68,638
336,746 (220,135) (22,153) –
77% 21% 146% 100%
$’000 % $’000 Cents Cents
343,541 57.6% 277,912 106.2 10
94,458 28.1% 29,457 11.4 –
264% 29.5% 843% 832% 100%
Mining summary Open pit ore mined Open pit waste mined Stripping ratio
Production summary Ore treated Head grade – gold Head grade – silver
Revenue summary Gold sold Silver sold Average gold price received Average silver price received
Financial review Sales revenue Costs of sales1 Corporate, exploration, rehabilitation, and other costs2 Impairment reversal Earnings before interest, tax, depreciation and amortisation (EBITDA) EBITDA margin (%) Profit after income tax Basic earnings per share Dividends per share 1 2
Excluding depreciation and amortisation expenses (operating). Excluding depreciation and amortisation expenses (corporate).
www.kingsgate.com.au
27 Directors’ Report
Directors' Report
The graph below presents the reconciliation of statutory profit after income tax (NPAT) to EBITDA.
360 56,972
343,541
340
Group (A$’000)
320 300 286,569
14,730 277,912
280
(6,073)
260 240 220 200
NPAT
Income tax benefit
Net finance costs
EBIT
Depreciation & amortisation
EBITDA
Profit and loss
Balance sheet
Cashflow
The Group delivered record annual sales revenue of $596.4 million, up 77% on the previous year, and driven by strong precious metals prices and record production at Chatree. During the year, 86,125 ounces of gold was sold at an average gold price of US$4,176 per ounce, and 739,238 ounces of silver was sold at an average price of US$61.28 per ounce.
Total assets increased 43% to $772.4 million (FY2025: $541.8 million). Cash and cash equivalents increased by $61.8 million driven mainly by strong operating cash inflows of $225.7 million, net of $74.2 million in payments for mine properties, plant and equipment, $36.5 million in net debt repayments, and $26.6 million in dividend payments during the year.
The increased operating costs were reflective of the increased mining activity, with a 49% increase in total material mined to 22.1 million tonnes. The larger material movements and mining rates were supported by a new 6030 Caterpillar excavator which was commissioned in February 2026. Mining costs were also impacted by higher fuel prices and increased explosive usage associated with the A East Cutback during the June 2026 quarter. Inventory movements contributed a $49.3 million benefit, driven by increases in stockpiles, gold‑in‑circuit, and gold‑in‑safe.
The net carrying amount of exploration, evaluation and development assets increased by $101.8 million during the year, primarily due to the impairment reversal and the acquisition of royalties in respect of the Nueva Esperanza Project, as well as continued investment at Chatree, including tailings storage facility (TSF) lift construction and associated infrastructure, deferred stripping and revision to capitalised rehabilitation costs.
Operating cash inflows were $225.7 million, an increase of $138.4 million or 158%, reflecting a strong operational performance at Chatree. Net cash outflows from investing activities were $90.2 million, an increase of $34.1 million, mainly attributable to TSF2 construction, deferred stripping, and the royalties and water rights acquisition at the Nueva Esperanza Project.
During the year, an impairment reversal of $68.6 million in respect of Nueva Esperanza was recorded and this contributed to a Group EBITDA of $343.5 million, an increase of 264% on the previous year from $94.5 million to $343.5 million. The Group delivered a NPAT of $277.9 million, representing a record result for the Group.
Total liabilities were $213.4 million, a decrease of $9.1 million to the prior year. Movements included a $26.0 million increase in the rehabilitation provision, reflecting additional costs associated with the anticipated future covering of TSFs with High‑Density Polyethylene (HDPE) cover. In contrast, negative movements were observed following a 60% decrease in borrowings to $25.7 million (30 June 2025: $63.7 million) from the repayment of the term loan facility which was partially offset by the drawdown of the standby loan facility.
Net cash outflows from financing activities were $72.3 million, an increase of $60.5 million from the prior year. This movement reflects the repayment of the term facility, partially offset by the drawdown of the standby loan facility, scheduled lease liability payments, and dividends paid totalling $26.6 million.
Material business risks As a mining company, we operate in a dynamic and complex environment where various factors and risks can impact our operations, financial performance, and sustainability. It is crucial for our stakeholders to be aware of these material business risks. While we strive to manage these risks effectively, there can be no assurance that they will not have a significant impact on our business in the future. The following are the material business risks that could affect our Group:
u
continued
28 Directors' Report
Capital and financing risk Access to capital for exploration, development, and expansion projects is essential for our growth. Financial market conditions, interest rates, and credit availability can influence our ability to raise funds. The Group’s ability to successfully develop projects is contingent on the ability to fund those projects from operating cash flows or through affordable debt and equity raisings.
Political, economic, social and security risks The Group’s activities are subject to the political, economic, social and other risks and uncertainties in the jurisdictions in which those activities are undertaken, including changes in government policies, local community relations, and potential disruptions due to protests or conflicts in the regions we operate in. There can be no certainty as to what changes, if any, will be made to relevant laws in the jurisdictions where the Group has current interests, or other jurisdictions where the Group may have interest in the future, or the impact that relevant changes may have on the Group’s ability to own and operate its mining and related interests and conduct its business in those jurisdictions.
Market risks – commodity price volatility, exchange rates, credit risk and liquidity risk Commodity prices fluctuate according to changes in demand and supply. The Group is exposed to changes in commodity prices, which could affect the profitability of the Group’s projects. Significant adverse movements in commodity prices could also affect the ability to raise debt and equity. The Group is also exposed to foreign exchange rate risk arising primarily with respect to the US dollar and Thai baht. Credit risk arises from cash and cash equivalents, deposits with banks and financial institutions, as well as credit exposures to refineries including outstanding receivables and committed transactions. The Group has no significant concentrations of credit risk. The Group’s liquidity requirements are based upon cash flow forecasts. Liquidity management, including debt/equity management, is carried out under policies approved by the Board and forecast material liquidity changes are discussed at Board meetings. Further detail on the Group’s market risk exposures is detailed in Note 28 to the Financial Statements.
www.kingsgate.com.au
Mineral Resources and Ore Reserves
Community relations and reputational risk
Mineral Resources and Ore Reserves are estimates. These estimates are substantially based on interpretations of geological data obtained from drill holes and other sampling techniques. Actual mineralisation or geological conditions may be different from those predicted and as a consequence there is a risk that any part, or all of the Mineral Resources, will not be converted into Ore Reserves.
The Group has established community relations functions that have developed a community engagement framework, including a set of principles, policies, and procedures designed to provide a structured and consistent approach to community activities.
The fluctuations of the market price for gold and silver as well as increased production and capital costs, may render Ore Reserves unprofitable to develop at a particular site for periods of time.
Mining risks and insurance risks These risks and hazards could result in significant costs or delays that could have a material adverse impact on the Group’s financial performance and position. The Group maintains insurance to cover some of these risks and hazards at levels that are believed to be appropriate for the circumstances surrounding each identified risk. However, there remains the possibility that the level of insurance may not provide sufficient coverage for losses related to specific loss events.
Regulatory risk The Group’s mining operations are subject to the Mineral Act B.E. 2560 and other related regulations in Thailand. The Group is required to obtain and maintain various permits, licences, and government approvals necessary for mining operations, environmental compliance, explosives control, and related activities. Delays in approvals, changes in regulations, or non-compliance may adversely affect the Group’s operations, project development, and reputation. The Group continues to closely monitor regulatory developments and maintain compliance through ongoing engagement with relevant government authorities and stakeholders.
Reliance on contractors Some aspects of the Group’s activities are conducted by contractors. As a result, the Group’s business performance is impacted upon by the availability and performance of contractors and the associated risks.
Legal and litigation risk We may face legal disputes related to the contractual agreements, environmental claims, or other matters that can result in financial losses and damage to our reputation.
A failure to appropriately manage local community stakeholder expectations may lead to damage to the Group’s reputation and disruptions in the Group’s activities.
Health and safety of workers Ensuring the health and safety of our employees is paramount. Health crises, such as pandemics can disrupt operations and pose risks to our workforce. Mining operations inherently involve risks related to equipment failures, accidents and geological challenges. Ensuring the safety of our workforce and mitigating operational disruptions is a top priority. In FY2026, several safety improvement initiatives were completed. In the mining area, a traffic management review was undertaken, and improvements to roads and intersections were implemented based on its findings. In the processing area, a comprehensive Safe Work, Isolation and Permitting System was implemented. A purpose-built QA/QC and rehabilitation workshop was established by repurposing the redundant cyanide storage building. The workshop includes an overhead crane, lathe, milling machine, and radial drill. A dedicated waste management area was also constructed to improve housekeeping and waste segregation.
Environmental, health and safety regulations The Company continues to be subject to environmental, mining and regulatory restrictions in Thailand. Compliance to applicable laws and environmental standards is a prerequisite for the Group’s social license to operate and operational continuity. Failure to comply with such requirements may result in fines, legal liabilities, operational delays, suspension or revocation of permits, increased remediation costs, and reputational damage.
29 Directors’ Report
Climate change considerations, including carbon emissions and environmental sustainability, are increasingly important for our industry. Failure to address these issues can result in reputational harm and regulatory challenges.
Risk management It is essential to note that these risks are interconnected, and their impact may vary based on market conditions, industry trends, and other factors. We are committed to proactive risk management, continuous improvement, and transparency in our reporting to mitigate these material business risks and ensure the long-term success of our mining operations. Please note that this list of material business risks is not exhaustive, and there may be other risks specific to our industry or individual circumstances that could affect our business. Our Board and management team regularly review and update our risk assessment to adapt to changing conditions and implement strategies for risk mitigation.
Significant changes in the state of affairs There were no other significant changes in the state of affairs of the Group that occurred during the financial year not otherwise disclosed in this report or the consolidated financial statements.
Subsequent events
A metallurgical sampling drilling program commenced in July 2026. As noted in Kingsgate’s ASX release titled “Acquisition of Royalty and Water Rights at Nueva Esperanza” dated 14 May 2026, the Company is advancing a strategic review of value realisation pathways for Nueva Esperanza, including the potential for a separate listing of the Project on the Australian Securities Exchange (“ASX”).
At the date of this report, there is no matter or circumstance that has arisen since the end of the financial period, that has significantly affected, or may significantly affect, the operations of the Group, the results of those operations, or the state of affairs of the Group in subsequent financial periods.
Likely developments and expected results of operations
Kingsgate will continue to assess other viable gold and precious metal project opportunities that may offer value-enhancing opportunities for shareholders.
The year ahead marks the next chapter in Chatree’s life of mine plan. The Company is expecting an uplift in material movements, as the A East cutback continues and pre-stripping is initiated at the new Q Pit. The additional waste movements will enhance future access to the ore body and support long-term production targets. The commencement of mining of the new Q Pit will provide an additional higher grade ore source for the processing plant. Furthermore, the substantial completion of strategic land acquisitions surrounding Chatree secures areas to enable the next phase of mining.
Material business risks that may impact the results of Kingsgate’s future operations include tenure risks, environmental risks, ore reserve and mineral resource estimates, production estimates and metallurgical recovery, sovereign risks, debt funding risks, future commodity prices, exchange rate risks, development risks, reliance on key personnel, operating risks, capital costs, operating costs, occupational health and safety, and political and regulatory risks.
The Company continues to evaluate options and advance its Nueva Esperanza Project in Chile. Technical work is underway on Mineral Resources and Ore Reserves, environmental licences and permitting with equipping of water infrastructure largely completed.
Directors' Report
Climate change and sustainability
Environmental laws The Group is subject to various environmental laws in respect to its activities in Thailand and Chile. For the year ended 30 June 2026, the Group has operated within all applicable environmental laws and regulations.
Directors’ meetings Meetings of committees
Board meetings
Directors
Audit
Nomination
Remuneration
A
B
A
B
A
B
A
B
Ross Smyth-Kirk OAM2
9
9
2
2
3
3
2
2
Jamie Gibson
9
9
2
2
2
2
2
2
3
Greg Orrell
1
1
–
–
1
1
–
–
Kerry Stevenson5
2
2
–
–
1
1
–
–
9
9
2
2
3
3
2
2
2
2
4
Peter Warren Nucharee Sailasuta
1
A B 1 2 3 4 5
Number of meetings attended. Number of meetings held during the time the Director held office or was a member of the committee during the year. Nucharee Sailasuta resigned as a director on 15 October 2025. Ross Smyth-Kirk OAM ceased as a member of the Remuneration Committee on 30 June 2026. Jamie Gibson ceased as a member of the Audit, Nomination and Remuneration Committees on 30 June 2026. Greg Orrell was appointed as a director on 1 May 2026. He was appointed as a member of the Audit, Nomination and Remuneration Committees on 30 June 2026. Kerry Stevenson was appointed as a director on 18 March 2026. She was appointed as a member of the Audit, Nomination and Remuneration Committees on 30 June 2026.
u
continued
30 Directors' Report
Information on Directors/Company Secretary Ross Smyth-Kirk OAM B Com, CPA, FCSI
Executive Chairman Mr Smyth-Kirk was a founding director of the former leading investment management company, Clayton Robard Management Limited and has had extensive experience in investment management across the minerals and mining sectors. Mr Smyth-Kirk has been a director of a number of companies over the past 46 years in both Australia and the United Kingdom and was previously Chairman of the Australian Jockey Club Limited. He is Chairman of Kingsgate’s subsidiary, Akara Resources Public Company Limited. He is recognised as the chief architect of the rejuvenation of the Chatree mine after its forced closure in 2016 to now be once again fully operational and highly profitable. Mr Smyth-Kirk is a CPA, a Fellow of the Chartered Institute for Securities and Investment (FCSI) and holds a Bachelor of Commerce degree from the University of New South Wales.
Responsibilities Chairman of the Board, member of the Audit and Nomination Committees. Mr Smyth-Kirk was a member of the Remuneration Committee until 30 June 2026.
Jamie Gibson
MBA, GAICD GradCertGlobalBusPrac, DipMgt Managing Director and Chief Executive Officer Mr Gibson is the Managing Director and Chief Executive Officer of Kingsgate Consolidated Limited and has been with the Company since 2013. He has extensive experience in the mining and resources sector, spanning corporate strategy, operations, government relations, capital markets and business development. Mr Gibson has played a key role in the transformation of Kingsgate and the successful restart and ramp-up of the Chatree Gold Mine in Thailand, leading the Company’s return to gold and silver production and positioning the business for its next phase of growth.
Prior to joining Kingsgate, Mr Gibson worked in government as a Chief Advisor across the metals and coal mining portfolios and has extensive trade and investment experience throughout the Asia-Pacific region. He is a Director of Akara Resources Public Company Limited and previously served as a Board Member and Vice President of the Australia Thailand Business Council. Mr Gibson holds a Master of Business Administration and a Graduate Certificate in Global Business Practice from Macquarie University, a Diploma of Management from the Sydney Institute of Technology, and is a graduate of the Australian Institute of Company Directors.
Responsibilities Member of the Audit, Nomination and Remuneration Committees until 30 June 2026.
Greg Orrell B.S.
Non-Executive Director (appointed 1 May 2026) Mr Orrell is President and Chairman of Orrell Capital Management, the investment adviser to the OCM Gold Fund, and has served as President and Chairman of the Board of Trustees of the OCM Mutual Fund since 2003. He has been the Senior Portfolio Manager of the OCM Gold Fund since 1997. With more than 40 years’ experience as a broker, investment banker and fund manager, US-based Mr Orrell is regarded as one of the most experienced gold fund portfolio managers in the global precious metals sector. He has been recognised by Lipper Refinitiv for top fund performance in the precious metals category across multiple time periods. Mr Orrell brings deep expertise in gold markets, including a strong understanding of gold’s monetary role in the global economy. He is a widely quoted commentator on precious metals and mining equities across national financial publications, podcasts and broadcast media. Mr Orrell holds a Bachelor of Science in Economics and Business Administration from Saint Mary’s College, California.
Responsibilities Member of the Audit, Nomination and Remuneration Committees appointed 30 June 2026.
Kerry Stevenson BBus
Non-Executive Director (appointed 18 March 2026) Ms Stevenson is one of Australia’s leading commentators and advisers in the resources sector, bringing more than 20 years of experience across Australian and international resource capital markets, supported by a strong global network of industry participants and investors. She is widely recognised for her ability to connect investors with high-quality resource companies and for her disciplined, investorfocused approach to market engagement. Ms Stevenson is the founder of the Australian Gold Conference and Gold Coast Gold, and is a regular panellist at leading Australian and North American resource investment conferences. Ms Stevenson also hosts the Making Money Matter podcast and interview series, providing insights into financial markets, investment trends, and the resources sector. She currently also serves as an Advisory Board member of Kincora Copper, an ASX- and TSXV-listed gold-copper exploration company. Ms Stevenson holds a Bachelor of Business from University of Technology Sydney.
Responsibilities Member of the Audit, Nomination and Remuneration Committees appointed 30 June 2026.
Peter Warren B Com, CPA
Non-Executive Director Mr Warren is a highly experienced mining professional and was Kingsgate’s Chief Financial Officer and Company Secretary for six years until his retirement in 2011. He was previously Chief Financial Officer and Company Secretary for Equatorial Mining Limited and of the Australian subsidiaries of the Swiss-based Alusuisse Group. Mr Warren has also held various financial and accounting positions for Peabody Resources and Hamersley Iron and is former Director of Kingsgate’s subsidiary, Akara Resources Public Company Limited. Mr Warren is a CPA and holds a Bachelor of Commerce degree.
Responsibilities Chairman of the Audit, Nomination and Remuneration Committees.
www.kingsgate.com.au
31 Directors’ Report
MA/PhD of TPS
Non-Executive Director Appointed as a Non-Executive Director on 3 February 2023 and resigned 15 October 2025.
Jade Cook Company Secretary Ms Cook brings broad experience across a range of organisations in both in-house and outsourced capacities, working closely with Boards, senior management and stakeholders across multiple jurisdictions. She is an Associate of the Governance Institute of Australia and holds a Bachelor’s degree in Business Management and a Master’s degree in Corporate Governance. Appointed 27 March 2026.
Stephanie Wen
GAICD, LLB, B Com, MIA General Counsel and Company Secretary Appointed as General Counsel and Company Secretary on 1 August 2023 and resigned from both positions on 27 March 2026.
Directors' Report
Nucharee Sailasuta
32 Directors' Report
Remuneration Report Introduction
〉
This Remuneration Report forms part of the Directors’ Report. It outlines the remuneration policy and framework applied by the Company as well as details of the remuneration paid to Key Management Personnel (“KMP”). KMP are defined as those persons having the authority and responsibility for planning, directing and controlling the activities of the Company, directly or indirectly, including Directors and executive management. For FY2026, the Company’s KMP consists of the Executive Directors (including the Chief Executive Officer (CEO)) and the Chief Financial Officer (CFO).
In consultation with external remuneration consultants, the Group has structured directors and executive management remuneration framework that is market competitive and aligned with the operating model and business strategy of the organisation.
The information provided in this report has been prepared in accordance with s300A and audited as required by section 308(3C) of the Corporations Act 2001. The objective of the Company’s remuneration philosophy is to ensure that Directors and Executives are remunerated fairly and responsibly at a level that is competitive, reasonable and appropriate for the size of the Company, in order to attract and retain suitably skilled and experienced people.
avoid adverse community and investor perception and have regard to the Company’s commercial interest in controlling expenses by avoiding excessive pay to KMP.
The framework is intended to provide a mix of fixed and variable remuneration, with a blend of short and long-term incentives as appropriate.
Remuneration Committee The Remuneration Committee is a committee of the Board and has responsibility for setting policy for determining the nature and number of emoluments of Board members and Executives. The Committee makes recommendations to the Board concerning: 〉
Non-Executive Director fees;
〉
remuneration level of Executive Directors and other KMP;
Remuneration policy
〉
the executive remuneration framework and operation of the incentive plan;
This remuneration policy forms part of Kingsgate’s broader remuneration and retention strategy and has been designed to align the interests of shareholders, Directors, employees and other Company stakeholders. This has been achieved by setting a framework to:
〉
key performance indicators and performance hurdles for the executive team; and
〉
the engagement of specialist external consultants to design or validate methodology used by the Company to remunerate Directors and senior executives.
〉
〉
ensure an applicable balance of fixed and at-risk remuneration, with the at-risk component linking incentive and performance measures to both Group and individual performance; provide an appropriate and competitive reward for Directors and executive management to manage and lead the business successfully and to drive strong, long-term growth in line with the Company’s strategy and business objectives;
〉
facilitate transparency and fairness in Directors and Executive remuneration policy and practices;
〉
contribute to attraction, motivation and retention of highly skilled Directors and Executives; and
The Remuneration Committee Charter is in the Company’s Corporate Governance materials and may be viewed on its website at www.kingsgate. com.au/governance.
Remuneration consultants The Group engages the services of independent and specialist remuneration consultants from time to time on an ‘as needed’ basis to seek to ensure the Company’s remuneration framework and policies for senior executives are consistent with market expectations and are otherwise appropriate.
1 Separately, JFS also provided broader strategic advice and fees include costs related to these services.
www.kingsgate.com.au
During the year, Godfrey Remuneration Group (GRG) and JFS Strategic Consulting (JFS) were appointed by the Company to review benchmarking data of comparable companies and make recommendations. In this connection, GRG and JFS provided ‘remuneration recommendations’ (as defined under the Corporations Act 2001) and a declaration that the remuneration recommendations were made free from undue influence by the individual KMP to whom the recommendations relate. The recommendations included pay recommendations, implementation of variable remuneration policy and the adoption of an equity incentive plan for senior executives. This culminated in the adoption of a new equity incentive plan by the Company and the granting of awards under the plan as disclosed to ASX on 29 June 2026. The Board is satisfied that the remuneration recommendations received from GRG and JFS were made free from undue influence by any member of the KMP to whom the recommendations related. Fees paid and payable to GRG were $20,000 and to JFS were $69,7001.
Executive Director remuneration The Executive pay and reward framework is comprised of three components: 〉
fixed remuneration including superannuation;
〉
short-term performance incentives; and
〉
long-term incentives.
Fixed remuneration Total Fixed Remuneration (“TFR”) is structured as a total employment cost package, including base pay and superannuation. Base pay may be delivered as a mix of cash, statutory and salary sacrificed superannuation, and prescribed non-financial benefits at the Executive’s discretion. Executives are offered a competitive base pay based on benchmarking of equivalent roles. Base pay for executives is reviewed annually to ensure their pay is competitive with the market. An Executive’s pay is also reviewed on promotion.
33 Directors’ Report
Revenue ($‘000) Net profit/(loss) after tax ($‘000) EBITDA ($‘000) Share price at year end ($/share) Dividends paid (cent/share) KMP short-term employee benefits ($‘000s)
2026
2025
2024
2023
2022
596,446 277,912 343,541 4.95 10 *2,709
336,746 29,457 94,458 2.26 – 1,781
133,091 199,761 213,789 1.62 – 1,601
27,337 4,738 11,072 1.51 – 1,333
– (12,420) (10,406) 1.33 – 555
Directors' Report
The following table summarises the performance of the Group over the last five years:
* See page 41 for table outlining the short-term employee benefits.
Short-Term Incentives Linking current financial year earnings of executives to their performance and the performance of the Group is the key objective of our Short-Term Incentive (“STI”) Plan. The Remuneration Committee sets key performance measures and indicators for the individual executives on an annual basis that reinforce the Group’s business plan and targets for the year. Participation
The STI is a cash bonus with no deferral, up to a maximum percentage of TFR, based on the employee job band. The STI applies to site-based employees at the level of superintendent and technical staff above and Group management/executives.
How is performance measured?
A combination of specific Key Performance Indicators (KPIs) has been selected to reflect the core drivers of short-term performance and to provide a clear framework for delivering sustainable value to the Group and its shareholders. For the year ended 30 June 2026, the KPIs applicable to KMPs were: 〉 Safety – improvement in Total Recordable Injury Frequency Rate (TRIFR) (20%). 〉 Operational performance – delivery of mining movements relative to budget and gold production relative to guidance (20%). 〉 Financial performance – improvements in liquidity, free cashflows, capital availability and funding access (20%). 〉 Strategy & Growth – progress on merger and acquisition (M&A) activities, funding initiatives and other actions that enhance shareholder value (20%). 〉 Personal KPI – achievement relative to the individual’s role and delivery of their allocated section of budget (20%). The four KPI measure areas (safety, operational, financial, and strategy & growth) form the company KPI component of each individual’s score and constitute the primary performance measures for FY2026.
How much can the executives earn under the STI Plan?
Threshold (70%) – represents the minimum acceptable level of performance that needs to be achieved before any individual award is payable in relation to that performance measure. Target (100%) – represents a challenging yet achievable level of performance, assessed against historical results and/or expected future outcomes (as applicable), and is consistent with the company KPIs and the FY2026 budget approved by the Board of Directors. Stretch (Maximum 150%) – represents an outstanding level of performance and clearly exceeds expectations. At Target, the Executive Chairman/ Managing Director and CEO can receive an STI of up to 60% of TFR and for the CFO – up to 45% of TFR.
Is there Board discretion in the payment of an STI benefit?
Yes, the plan provides for Board discretion in the approval of STI outcomes.
u
continued
34 Directors' Report
How are performance targets set and assessed?
The recommended company KPIs for the period commencing were developed during FY2025 as part of preparation of the FY2026 budget, taking into account the Group’s key priorities and management’s assessment of what constitutes measured success for Kingsgate in 2026, consistent with budget expectations and progressive strategic priorities. Individual performance targets are set by the identification of key achievements required by role and to the delivery of allocated section of the budget for the upcoming assessment period in advance. The criteria for Executive KMP are recommended by the Managing Director/CEO for sign off by the Remuneration Committee and in the case of the Managing Director/CEO, are recommended by the Chairman by sign off by the Remuneration Committee. The relative achievement at the end of the financial period is determined by the above authorities with final sign off by the Remuneration Committee after confirmation of financial results and personal/ company performance against established criteria. The Remuneration Committee is responsible for assessing whether the KPIs are met. To assist in this assessment, the Committee receives detailed reports on performance from management which are verified by independent remuneration consultants if required. The Board of Directors has the discretion to adjust STIs for KMPs in light of unexpected or unintended circumstances.
How is STI delivered?
STIs are paid in cash after the conclusion of the assessment period and confirmation of financial results/personal performance and subject to tax in accordance with prevailing Australian taxation laws. STI are recognised as an expense in the financial year to which the performance relates and are paid either within that year or in the period following the measurement year.
What happens in the event of cessation of employment?
Executives are required to be employed for the full 12 months of the assessment period before they are eligible to receive benefits from the STI Plan.
STI outcomes The STI outcomes for the KMPs are summarised in the table below. The outcomes reflect both overall company performance for the year and individual’s KPI achievement. Maximum potential award
Achieved STI
STI awarded
Forfeited STI
$
% of max
$
%
Name
Position
Ross Smyth-Kirk OAM
Executive Chairman
387,000
62.0%
240,0001
38.0%
Jamie Gibson
Managing Director and Chief Executive Officer
540,000
50.9%
275,0002
49.1%
Mischa Mutavdzic
Chief Financial Officer
369,343
67.7%
250,0002
32.3%
1
Expensed and paid in FY2026.
2
Expensed and unpaid as at 30 June 2026.
No short-term incentive was expensed or awarded to executives under the previous STI Plan for the year ended 30 June 2025.
Long-Term Incentives Plan overview The Company operates a Long-Term Incentive (LTI) Plan under which eligible employees, including KMP, may be invited to receive performance rights. The issuance of performance rights forms part of Kingsgate’s broader remuneration and retention strategy and is designed to align the interests of key personnel with those of shareholders through long-term equity participation and performance-based outcomes. Each Performance Right carries the right to be issued one fully paid ordinary share for nil cash consideration upon vesting.
www.kingsgate.com.au
35 Directors’ Report
Directors' Report
During the year ended 30 June 2026, the Company made two separate grants of performance rights: the FY2025 Awards (relating to the performance year ended 30 June 2025) and the FY2026 Awards (relating to the performance year ended 30 June 2026). Both cohorts are assessed against three equally weighted performance hurdles but differ in their vesting profiles, applicable multipliers and performance periods, as detailed below.
Key plan terms Plan feature
Detail
Instrument
Performance rights (nil exercise price, nil issue price)
Plan
Kingsgate Consolidated Limited Employee Share Plan
Eligible participants
Key Management Personnel and selected senior employees
Grant dates
FY2025 Awards and FY2026 Awards: on 25 June 2026
Exercise price/issue price
Nil / Nil
Performance hurdles
Three equally weighted hurdles (33.33% each): Relative TSR, Absolute TSR and Mineral Reserve Growth
Performance multiplier
1.5x applied to Relative TSR and Absolute TSR vesting outcomes where performance is Exceptional. FY2025 Awards: No multiplier for Mineral Reserve Growth (Weighted Average Multiplier: 1.33x). FY2026 Awards: 1.25x multiplier for Mineral Reserve Growth (Weighted Average Multiplier: 1.42x).
Vesting profile
Staggered over 3 Award Years. FY2025: Year 1 – up to 60%; Year 2 – up to 30%; Year 3 – up to 10%. FY2026: Year 1 – up to 50%; Year 2 – up to 30%; Year 3 – up to 20%.
Lapse on cessation
All unvested performance rights lapse automatically on cessation of employment (unless the Board determines otherwise in its discretion)
Change of control
All unvested performance rights vest automatically immediately prior to a Change of Control Event
Disposal restrictions
Performance rights (vested or unvested) are subject to disposal restrictions under the Plan Rules. Plan Shares are subject to the Company's Securities Trading Policy.
Staggered vesting structure Performance rights vest on a staggered basis across three award years, subject to the Board’s annual assessment of performance against three equally weighted performance hurdles (33.33% each). Rights that do not vest in an award year lapse immediately and are not retested. Where performance against the Relative TSR or Absolute TSR hurdle is assessed as Exceptional, a 1.5x performance multiplier is applied to the vesting outcome for that hurdle. For the Mineral Reserve Growth hurdle, no multiplier applies for FY2025 Awards (Exceptional vesting capped at 100%), while a 1.25x multiplier applies for FY2026 Awards (Exceptional vesting capped at 125%). To avoid the need to issue additional rights if a multiplier is triggered, the number of performance rights granted to each participant already incorporates a weighted average performance multiplier (1.33x for FY2025 Awards; 1.42x for FY2026 Awards). The number that may vest is calculated by dividing the relevant annual vesting entitlement by the applicable weighted average performance multiplier before applying the vesting percentage.
FY2025 Awards – vesting schedule Award year
Max vesting
Vesting date
Expiry date
Year 1 Year 2 Year 3
Up to 60% Up to 30% Up to 10%
30 June 2026 30 August 2026 30 August 2027
30 August 2027 (unvested)/29 June 2041 (vested) 30 August 2027 (unvested)/29 June 2041 (vested) 30 August 2027 (unvested)/29 June 2041 (vested)
Note: Year 1 vesting for FY2025 Awards occurs on 30 June 2026 (immediately following the performance assessment for the year ended 30 June 2025). Participants will be notified by email of the actual number of performance rights that vest.
u
continued
36 Directors' Report
FY2026 Awards – vesting schedule Award year
Max vesting
Vesting date
Expiry date
Year 1 Year 2 Year 3
Up to 50% Up to 30% Up to 20%
30 August 2026 30 August 2027 30 August 2028
30 August 2028 (unvested)/29 June 2041 (vested) 30 August 2028 (unvested)/29 June 2041 (vested) 30 August 2028 (unvested)/29 June 2041 (vested)
Performance hurdles Each award year, the Board assesses the Company’s performance against three equally weighted hurdles. The hurdles, their definitions and vesting schedules are identical across both the FY2025 and FY2026 Awards, except where noted in respect of the Mineral Reserve Growth multiplier.
1. Relative Total Shareholder Return (Relative TSR) – weighting: 33.33% Relative TSR compares the Company’s TSR over the relevant Performance Period with the TSR of a Comparator Group of ASX-listed gold producers. TSR is calculated as the percentage change in a company’s 5-day VWAP of its shares measured from the trading day immediately before the start to the trading day immediately before the end of the relevant Performance Period. Comparator Group (ASX tickers): BCN, BGD, BGL, CEL, CYL, EMR, OBM, PNR, RSG, SBM and VAU. The Board may amend the Comparator Group to reflect corporate transactions, changes in market capitalisation, commodity exposure, development stage or jurisdiction. An independent third party may be engaged to calculate TSR rankings. Level of performance
Outcome/threshold
Vesting %
Threshold Target
Below 40th percentile 40th percentile 50th percentile Between 50th and 75th percentile (straight line) 75th percentile or above
0% 25% 50% 50%–100% 150% (×1.5 multiplier)
Exceptional
Dividend adjustment: Where comparator companies pay dividends, share prices are adjusted post ex-dividend date to ensure TSR correctly reflects both capital gain and dividend yield.
2. Absolute Total Shareholder Return (Absolute TSR) – weighting: 33.33% Absolute TSR measures the Company’s cumulative annual TSR over the relevant performance period using the same 5-day VWAP methodology. For multi-year periods (Years 2 and 3), TSR is measured on a cumulative basis from a fixed base date. Level of performance
Outcome/threshold
Vesting %
Threshold Target
5% cumulative TSR over the performance period 10% cumulative TSR over the performance period Between 10% and 12.5% cumulative TSR over the performance period (straight line) Above 12.5% cumulative TSR over the performance period
33% 66%
Exceptional
Dividend adjustment: As for Relative TSR.
www.kingsgate.com.au
66%–100% 150% (×1.5 multiplier)
37 Directors’ Report
3. Mineral Reserve Growth – weighting: 33.33% Directors' Report
The Mineral Reserve Growth hurdle measures the Company’s ability to replace and grow mineral reserves on a per-share basis, supporting long-term sustainability and disciplined capital allocation. Growth is calculated as the percentage change in JORC-compliant Ore Reserves between the applicable Baseline Ore Reserves date and the testing date, expressed on a per-share basis. The Board reviews the integrity of Ore Reserve calculations to ensure compliance with the JORC Code 2012 (or relevant offshore reporting standards).
FY2025 Awards – Mineral Reserve Growth vesting schedule Level of performance
Outcome/threshold
Vesting %
Threshold Target
90% of Baseline Ore Reserves per share 100% of Baseline Ore Reserves per share Between 100% and 120% per share (straight line) 120% or above of Baseline Ore Reserves per share
33% 66% 66%–100% 100% (no multiplier)
Exceptional
No performance multiplier applies to this hurdle for FY2025 Awards. Exceptional performance is capped at 100% vesting.
FY2026 Awards – Mineral Reserve Growth vesting schedule Level of performance
Outcome/threshold
Vesting %
Threshold Target
90% of Baseline Ore Reserves per share 100% of Baseline Ore Reserves per share Between 100% and 120% per share (straight line) 120% or above of Baseline Ore Reserves per share
33% 66% 66%–100% 100% (no multiplier)
Exceptional
A 1.25x performance multiplier applies to this hurdle for FY2026 Awards. Exceptional performance results in 125% vesting.
Performance periods The applicable performance period for each hurdle and each award year is set out below. For Absolute TSR, the measurement period is cumulative from a fixed base date; for Relative TSR it resets annually.
FY2025 Awards – performance periods Hurdle – FY2025 Awards
Year 1
Year 2
Year 3
Relative TSR Absolute TSR Mineral Reserve Growth
30 June 2024 – 30 June 2025 30 June 2024 – 30 June 2025 30 June 2021 vs 30 June 2024
30 June 2025 – 30 June 2026 30 June 2024 – 30 June 2026 30 June 2022 vs 30 June 2025
30 June 2026 – 30 June 2027 30 June 2024 – 30 June 2027 30 June 2023 vs 30 June 2026
FY2026 Awards – performance periods Hurdle – FY2026 Awards
Year 1
Year 2
Year 3
Relative TSR Absolute TSR Mineral Reserve Growth
30 June 2025 – 30 June 2026 30 June 2025 – 30 June 2026 30 June 2022 vs 30 June 2025
30 June 2026 – 30 June 2027 30 June 2025 – 30 June 2027 30 June 2023 vs 30 June 2026
30 June 2027 – 30 June 2028 30 June 2025 – 30 June 2028 30 June 2024 vs 30 June 2027
u
continued
38 Directors' Report
FY2025 performance assessment – Year 1 outcome The Board completed its assessment of the Company’s performance against the three performance hurdles for Year 1 of the FY2025 Awards (performance year ended 30 June 2025). The results and resultant vesting outcomes are shown below. Where a result was assessed as Exceptional, the 1.5x performance multiplier has been applied (Relative TSR and Absolute TSR only). FY2025 outcome
Performance hurdle
Measure
Weighting
Year 1
% Vesting
Relative TSR Absolute TSR Mineral Reserve Growth
Percentile ranking vs peers Cumulative TSR over the performance period Reserve growth per share vs baseline
33.33% 33.33% 33.33%
42th percentile 42.9% 155%
25% 150% 100%
Total weighted vesting (Year 1 – 60% tranche)
100%
91.67%
The number of performance rights that vest for any individual is calculated as: (Total performance rights granted ÷ 1.33) × weighted vesting % × 60% (Year 1 tranche). Actual participant-level outcomes are shown in the Rights Movement tables that follows.
Performance rights granted, vested, forfeited and balance The tables below summarise movements in performance rights held by KMP during the year ended 30 June 2026. All performance rights carry a nil exercise price and nil issue price.
FY2025 Awards Participants/role Ross Smyth-Kirk5 Executive Chairman Jamie Gibson5 Managing Director and Chief Executive Officer Mischa Mutavdzic Chief Financial Officer Total
Opening balance
Granted during year1
Vested during year2 4
Forfeited/ lapsed3
Closing balance4
Adjusted closing balance4 6
Grant date
–
337,245
139,115
63,235
134,895
59,601
25 June 2026
–
674,068
278,053
126,390
269,625
168,513
25 June 2026
–
278,227
114,769
52,169
111,289
90,421
25 June 2026
–
1,289,540
531,937
241,794
515,809
318,535
1. ‘Granted during year’ reflects the FY2025 Award grant made in 2026, incorporating the 1.33x weighted average performance multiplier. 2. ‘Vested during year’ reflects Year 1 vesting (up to 60% of total grant) based on performance for the year ended 30 June 2025, vesting on 30 June 2026. 3. ‘Forfeited/lapsed’ Performance relate to rights for the Year 1 vesting which based on performance for the year ended 30 June 2025 have lapsed. 4. Unvested performance rights expire on 30 August 2027; vested performance rights expire on the day before the 15th anniversary of the Issue Date. 5. Performance rights issued to Ross Smyth-Kirk and Jamie Gibson have been granted but will only be issued once shareholders’ approval at the next annual meeting is obtained. If this is not approved by shareholders, the Company will not issue the performance rights. 6. The adjusted closing balance reflects the closing balance as at 30 June 2026 less (i) the lapsed performance rights in respect of FY2025 Year 2 vesting conditions which is based on performance assessment outcomes for the year ended 30 June 2026 and (ii) less the aggregate forfeiture of 100,555 performance rights for Ross Smyth-Kirk and Jamie Gibson. On this basis, a total of 197,274 performance rights have been forfeited and/or lapsed after year-end.
www.kingsgate.com.au
39 Directors’ Report
Participants/role
Opening balance
Granted during year1
Vested during year2
Forfeited/ lapsed
Closing balance2
Adjusted closing balance2 4
Grant date
–
251,260
–
–
251,260
214,310
25 June 2026
–
502,207
–
–
502,207
428,353
25 June 2026
–
414,580
–
–
414,580
353,612
25 June 2026
–
1,168,047
–
–
1,168,047
996,275
Ross Smyth-Kirk3 Executive Chairman Jamie Gibson3 Managing Director and Chief Executive Officer Mischa Mutavdzic Chief Financial Officer Total
Directors' Report
FY2026 Awards
1. ‘Granted during year’ reflects the FY2026 Award grant made in 2026, incorporating the 1.42x weighted average performance multiplier. 2. Unvested performance rights expire on 30 August 2028; vested performance rights expire on the day before the 15th anniversary of the Issue Date. 3. Performance rights issued to Ross Smyth-Kirk and Jamie Gibson have been granted but will only be issued once shareholders’ approval at the next annual meeting is obtained. If this is not approved by shareholders, the Company will not issue the performance rights. 4. The adjusted closing balance reflects the closing balance as at 30 June 2026 less a total of 171,772 performance rights that lapsed after year-end based on the performance assessment outcome. The lapsed performance rights in respect of Year 1 vesting which is based on performance for the year ended 30 June 2026. These lapsed rights will be presented in the FY2027 table and have been tested after the year-end as per the plan rules.
Additional plan notes Cliff vesting: Unless otherwise indicated, vesting within each performance category operates on a cliff basis. Straight-line (pro-rata) vesting applies only within the 50th-75th percentile band for Relative TSR and within the 10%-12.5% band for Absolute TSR. Retesting: Performance rights that do not vest in an award year lapse and are not retested. Weighted average performance multiplier: For FY2025 Awards, the weighted average performance multiplier of 1.33x is calculated as (1.5x + 1.5x + 1.0x) ÷ 3. For FY2026 Awards, the weighted average performance multiplier of 1.42x is calculated as (1.5x + 1.5x + 1.25x) ÷ 3. Dividends: Performance rights do not carry entitlement to dividends or participation in new issues of securities. Dividend equivalents are not accrued. For TSR calculations, share prices of comparator companies are adjusted post ex-dividend date to ensure TSR reflects both capital gain and dividend yield. Board discretion: The Board’s determination of vesting outcomes is final and binding (absent manifest error). The Board retains discretion to adjust the Comparator Group and, in respect of cessation of employment, to determine whether some or all unvested rights may vest or remain on issue.
Directors and Key Management Personnel The remuneration framework outlined in this report covers Executive Directors, Non‑Executive Directors, and other Key Management Personnel (KMP) named below:
1 2
Ross Smyth-Kirk OAM
Jamie Gibson
Greg Orrell1
Kerry Stevenson2
Peter Warren
Nucharee Sailasuta3
Mischa Mutavdzic4
Executive Chairman
Managing Director and Chief Executive Officer
Non-Executive Director
Non-Executive Director
Non-Executive Director
Non-Executive Director
Chief Financial Officer
Appointed as a Non-Executive Director effective 1 May 2026. Appointed as a Non-Executive Director effective 18 March 2026.
3 4
Ceased serving as Non-Executive Director effective 15 October 2025. Appointed as a Chief Financial Officer effective 17 July 2025.
u
continued
40 Directors' Report
Changes since the end of the reporting period There were no changes to Directors and Key Management Personnel since the end of the reporting period.
Contract terms of the Executive Directors and Key Management Personnel Remuneration and other key terms of employment for the Executive KMPs during FY2026 are summarised in the following table: Term of agreement
Name
Fixed annual remuneration including superannuation FY 20261
FY 20251
Notice period by executive
Notice period by the Company 2
Ross Smyth-Kirk
Open
$430,000
$429,932
90 days
90 days
Jamie Gibson3
Open
$600,0003
$600,000
3 months
6 months
Open
$547,175
N/A
3 months
6 months
N/A
$557,500
6 months
6 months
Mischa Mutavdzic
4
Daniel O’Connell
5
4
1 Amount shown are annual salaries as at year end. This amount does not include the director fees received from subsidiary. 2 Notice period by the Company in respect of benefits payable in the event of an early termination. 3 Jamie Gibson is remunerated pursuant to the terms and conditions of a Consultancy Agreement entered into between Mr Gibson and the Company. Pursuant to the Agreement, Mr Gibson is entitled to a base fee of $50,000 per month plus GST, short-term and long-term incentives subject to Board approval. For a change of control event, the termination payment is 12 months of the base fee. If there are any termination entitlements to be paid under the change of control event, they will be limited by the Corporations Act 2001, the ASX Listing Rules, the Company’s Constitution, and any shareholder approval required by law. 4 Appointed as a Chief Financial Officer effective 17 July 2025. Mischa Mutavdzic is remunerated pursuant to the terms and conditions of a Consultancy Agreement between the Company and an entity associated with Mr Mutavdzic, of which he is the managing director. Pursuant to the Agreement, Mr Mutavdzic is entitled to a base fee of $50,000 per month plus GST effective 1 February 2026 (previously $45,833 per month plus GST for this role), short-term and long-term incentives subject to Board approval. For a change of control event, the termination payment is 12 months of the base fee. If there are any termination entitlements to be paid under the change of control event, they will be limited by the Corporations Act 2001, the ASX Listing Rules, the Company’s Constitution, and any shareholder approval required by law. 5 Ceased serving as Chief Financial Officer effective at the close of 3 February 2025.
Fixed annual remuneration, inclusive of the required superannuation contribution amount is reviewed annually by the Board following the end of the financial year.
Non-Executive Directors’ fees Non-Executive Directors are paid fixed fees for their services to the Company plus statutory superannuation contributions the Company is required by law to make on their behalf. Those fees are inclusive of any salary-sacrificed contribution to superannuation that a Non-Executive Director wishes to make. The level of Non-Executive Directors’ fees is set so as to attract the best candidates for the Board while maintaining a level commensurate with boards of similar size and type. The Board may also seek the advice of independent remuneration consultants, including survey data, to ensure Non-Executive Directors’ fees and payments are consistent with the current market. The Company does not give performance-based remuneration or retirement benefits to Non-Executive Directors. The maximum total remuneration for Non-Executive Directors is determined by resolution of shareholders and is currently set at $1,000,000 in aggregate. Non-Executive Directors’ base fees, inclusive of committee membership but not including statutory superannuation, are outlined as follows:
Non-Executive Directors’ remuneration excluding superannuation
Financial year ended 30 June 2026 1
Financial year ended 30 June 20251
$
$
405,000
180,000
1 On an annualised basis for all Non-Executive Directors. This amount does not include director fees received from subsidiary. Each Non-Executive Director received an annualised base fee of $90,000 for the period 1 July 2025 to 31 March 2026 and $135,000 effective from 1 April 2026.
The aggregate remuneration of Non-Executive Directors is set by shareholders in general meeting in accordance with the Constitution of the Company, with individual Non-Executive Directors’ remuneration determined by the Board within the aggregate total. Non-Executive Directors do not receive any additional fees for serving on committees of the Company. There are no retirement allowances for Non-Executive Directors.
www.kingsgate.com.au
41 Directors’ Report
Additional statutory disclosures Details of the nature and amount of each major element of the remuneration of the Directors and the Group Key Management Personnel are set out in the following tables:
Non-Executive Directors
Greg Orrell3 Kerry Stevenson4 Peter Warren Nucharee Sailasuta5 by Company by subsidiary Sub-total Non-Executive Directors Compensation
Other benefits
Other benefits
Superannuation
Performance rights (FY2025)
Performance rights (FY2026)
Total
Share-based payment7
Non-monetary benefit
Name
Postemployment
Cash bonus
Year ended 30 June 2026
Long-term benefits
Cash salary and fees
Short-term benefits
$
$
$
$
$
$
$
$
$
22,500 37,266 101,250
– – –
45,000 12,787
– – –
– – –
– – –
– 4,472 12,150
– – –
– –
– –
– –
– –
– –
– – –
22,500 41,738 113,400 45,000 12,787
218,803
–
–
–
–
16,622
–
–
235,425
400,000 88,091
240,000 –
4,3401 –
41,4732 –
4,5592 –
30,000 –
752,6698 –
44,287 –
1,517,328 88,091
600,000 44,045
275,000 –
– –
– –
– –
– –
1,504,3979 –
88,519 –
2,467,916 44,045
Mischa Mutavdzic6
547,175
250,000
–
–
–
–
620,951
73,074
1,491,200
Sub-total Executive Directors and other KMP Compensation
1,679,311
765,000
4,340
41,473
4,559
30,000
2,878,017
205,880
5,608,580
TOTAL
1,898,114
765,000
4,340
41,473
4,559
46,622
2,878,017
205,880
5,844,005
Executive Directors
Ross Smyth-Kirk by Company by subsidiary Jamie Gibson by Company by subsidiary
Other KMP
1 2 3 4 5 6 7 8 9
Non-monetary benefit related to car park space. Represents annual leave (short-term) and long service leave (long-term) entitlements measured on an accrual basis and reflects the leave expenses over the 12-month period. Appointed as a Non-Executive Director effective 1 May 2026. Appointed as a Non-Executive Director effective 18 March 2026. Ceased serving as Non-Executive Director effective 15 October 2025. Appointed as a Chief Financial Officer effective 17 July 2025. The equity settled share-based payment columns reflect the FY2026 accounting expense associated with performance rights granted for FY2025 and FY2026. This amount does not include a total of 75,294 performance rights forfeited and/or lapsed after year-end. This amount does not include a total of 101,112 performance rights forfeited and/or lapsed after year-end.
Directors' Report
Details of remuneration
42 Directors' Report
Year ended 30 June 2025 Name
Postemployment benefits
Long-term benefits
Short-term benefits Cash salary and fees
Non-monetary benefit
Other benefits
Other benefits
Superannuation
Termination benefits
Total
$
$
$
$
$
$
$
Non-Executive Directors
Nucharee Sailasuta by Company by subsidiary Peter Warren
90,000 43,686 90,000
– – –
– – 76,0003
– – –
– – 10,350
– – –
90,000 43,686 176,350
Sub-total Non-Executive Directors Compensation
223,686
–
76,000
–
10,350
–
310,036
400,000 87,372
3,7741 –
41,6992 –
3,6382 –
29,932 –
– –
479,043 87,372
600,000 43,686
– –
– –
– –
– –
– –
600,000 43,686
Daniel O’Connell4 by Company by subsidiary
265,808 11,312
– –
27,7532 –
– –
17,460 –
278,750 –
589,771 11,312
Sub-total Executive Directors and other KMP Compensation
1,408,178
3,774
69,452
3,638
47,392
278,750
1,811,184
TOTAL
1,631,864
3,774
145,452
3,638
57,742
278,750
2,121,220
Executive Directors Ross Smyth-Kirk by Company by subsidiary Jamie Gibson by Company by subsidiary
Other KMP
1 2 3 4
Non-monetary benefit related to car park space. Represents annual leave (short-term) and long service leave (long-term) entitlements measured on an accrual basis and reflects the leave expenses over the 12-month period. The Company retained Peter Warren Consulting Pty Limited on a 3-month contract following the cessation of Daniel O’Connell as CFO. The service scope includes reviewing and improving the Company’s financial systems and accounting structures, implementing recommended changes, and supporting the incoming CFO to ensure a smooth transition before FY2025 year-end. Daniel O’Connell ceased employment with the Company effective on the close of 3 February 2025, (ASX Announcement ‘Corporate Update’ on 4 February 2025).
www.kingsgate.com.au
43 Directors’ Report
The relative proportions of remuneration that are linked to performance and those that are fixed are as follows:
Executive Directors Ross Smyth-Kirk Jamie Gibson
Other KMP
Mischa Mutavdzic
Fixed remuneration 2026
STI/cash bonus 2026
At risk – LTI 2026
35% 26%
15% 11%
50% 63%
36%
17%
47%
Balance at start of year
Changes during the year
Balance at year end
5,078,058
(16,574)1
5,061,484
80,000
–
80,000
– 1,072 260,000 –
– – (110,000)2 –
– 1,072 150,000 –
–
–
–
Directors' Report
Name
Shareholdings for Directors and Key Management Personnel
Executive Chairman Ross Smyth-Kirk
Executive Director Jamie Gibson
Non-Executive Directors Greg Orrell3 Kerry Stevenson4 Peter Warren Nucharee Sailasuta5
Other KMP
Mischa Mutavdzic 1 2 3 4 5
Ross Smyth-Kirk’s daughter sold 16,574 ordinary shares on-market on 4 November 2025. Peter Warren sold 60,000 shares on-market on 27 February 2026 and sold 50,000 shares on-market on 1 May 2026. Greg Orrell appointed as a Non-Executive Director on 1 May 2026. Kerry Stevenson held 1,072 shares at time of her appointment on 18 March 2026. Nucharee Sailasuta resigned as a Non-Executive Director on 15 October 2025.
Loans to Directors There were no loans made to Directors or other Key Management Personnel at any time during the year.
END OF THE REMUNERATION REPORT
44 Directors' Report
Insurance of officers During the financial year, the Group paid premiums to insure Directors and Officers of the Group. The contracts include a prohibition on disclosure of the premium paid and nature of the liabilities covered under the policy.
Directors’ interest in contracts Mrs Nucharee Sailasuta was a Non-Executive Director of Kingsgate up until her resignation on 15 October 2025. She is a director and preference shareholder of the Company’s Thai subsidiary, Akara Resources Public Company Limited. Details of the related party transactions during the year were as follows: 〉
LotusHall Mining Heavy Engineering Construction Company Limited (LotusHall), of which Mrs Nucharee Sailasuta is the Chairman and co-founder, provided mining related services to Chatree Gold Mine during the year ended 30 June 2026. A total of $7,072,000 was recorded for services received from LotusHall from 1 July 2025 to 15 October 2025; and
〉
preference shareholder interest of $438,000 was expensed from 1 July 2025 to 15 October 2025.
Non-audit services Details of amounts paid or payable to the auditor for non-audit services provided during the year are detailed in Note 29: Auditors’ Remuneration. The Directors are satisfied that the provision of non-audit services during the period by the auditor is compatible with the general standard of independence for auditors imposed by the Corporations Act 2001. The Directors are of the opinion that the services disclosed in Note 29: Auditors’ Remuneration to the financial statements do not compromise the external auditors’ independence, based on the Auditors’ representations and advice received from the Audit Committee, for the following reasons: 〉
all non-audit services have been reviewed to ensure they do not impact the integrity and objectivity of the auditor; and
〉
none of the services undermine the general principles relating to auditor independence as set out in Code of Conduct APES 110 Code of Ethics for Professional Accountants issued by the Accounting Professional and Ethical Standards Board, including reviewing or auditing the auditor’s own work, acting in a management or decision-making capacity for the Company, acting as advocate for the Company or jointly sharing economic risks and rewards.
A copy of the Auditor’s Independence Declaration as required under section 307c of the Corporations Act 2001 is set out on page 45.
Rounding of amounts The Company is of a kind referred to in ASIC Corporations (Rounding in Financial Directors’ Reports) Instrument 2016/191 and in accordance with that instrument, amounts in the Directors’ Report have been rounded to the nearest thousand dollars except where otherwise indicated.
Auditors PricewaterhouseCoopers continues in office in accordance with section 327 of the Corporations Act 2001. This report is made in accordance with a resolution of Directors.
Ross Smyth-Kirk OAM Director Sydney 31 August 2026
www.kingsgate.com.au
45
Auditor’s Independence Declaration Auditor’s Independence Declaration
As lead auditor of Kingsgate Consolidated Limited's financial report for the year ended 30 June 2026, I As lead auditor of Kingsgate Limited's report declare that, to the best of myConsolidated knowledge and belief, financial there have been:for the year ended 30 June 2026, I declare that, to the best of my knowledge and belief, there have been: a) no contraventions of the auditor independence requirements of the Corporations Act 2001 in relation a) no contraventions of the auditor independence requirements of the Corporations Act 2001 in relation to the audit of the financial report; and to the audit of the financial report; and b) no contraventions of any applicable code of professional conduct in relation to the audit of the b) financial no contraventions report. of any applicable code of professional conduct in relation to the audit of the financial report.
Craig Thomason Craig Thomason Partner Partner PricewaterhouseCoopers PricewaterhouseCoopers
Sydney Sydney 31 August 2026 31 August 2026
PricewaterhouseCoopers, ABN 52 780 433 757 One International Towers ABN Sydney, Watermans PricewaterhouseCoopers, 52 780 433 757 Quay, BARANGAROO NSW 2000, GPO BOX 2650 SYDNEY 2001 One International TowersNSW Sydney, Watermans Quay, BARANGAROO NSW 2000, T: +61BOX 2 8266 0000, F: +61 2 8266 GPO 2650 SYDNEY NSW 20019999, www.pwc.com.au
pwc.com.au pwc.com.au
T: +61 2 8266 0000, F: +61 2 8266 9999, www.pwc.com.au
Liability limited by a scheme approved under Professional Standards Legislation. Liability limited by a scheme approved under Professional Standards Legislation.
Auditor’s Independence Declaration
Auditor’s Independence Declaration
46
www.kingsgate.com.au
47
Financial Statements Consolidated Statement of Profit or Loss and Other Comprehensive Income ...............
48
Consolidated Statement of Financial Position ......................
49
Consolidated Statement of Changes in Equity .....................
50
Consolidated Statement of Cash Flows ..................................
51
Consolidated Entity Disclosure Statement ...................
52
Notes to the Consolidated Financial Statements ......................... 53 Directors’ Declaration ....................... 88 Independent Auditor’s Report ............................................................................. 89
Financial Statements
Financial Statements
48 Financial Statements
Consolidated Statement of Profit or Loss and Other Comprehensive Income For the year ended 30 June 2026
Note
2026 $’000
2025 $’000
5a 5b
596,446 (323,711)
336,746 (266,850)
272,735
69,896
(21,324) (39,333) 2,521 3,332 68,638
(9,063) (12,624) 431 (1,164) –
286,569
47,476
649 (15,379)
172 (17,949)
(14,730)
(17,777)
271,839 6,073
29,699 (242)
277,912
29,457
(37,301)
41,658
Total other comprehensive (loss)/income for the year
(37,301)
41,658
Total comprehensive income for the year
240,611
71,115
Profit attributable to: Owners of Kingsgate Consolidated Limited
277,912
29,457
Total comprehensive income attributable to: Owners of Kingsgate Consolidated Limited
240,611
71,115
Cents
Cents
106.2 106.2
11.4 11.0
Sales revenue Cost of sales Gross profit Exploration and rehabilitation expenses Corporate and administration expenses Other income and expenses Foreign exchange gain/(losses) Impairment reversal
5c
5g
Profit before finance costs and income tax Finance income Finance costs
5d
Net finance costs Profit before income tax Income tax benefit/(expense)
6
Profit after income tax Other comprehensive income Items that may never be reclassified to profit and loss Exchange differences on translation of foreign operations (net of tax)
20a
Earnings per share Basic earnings per share Diluted earnings per share
30 30
The above consolidated statement of profit or loss and other comprehensive income should be read in conjunction with the accompanying notes.
www.kingsgate.com.au
49 Financial Statements
Consolidated Statement of Financial Position Note
2026 $’000
2025 $’000
7 7 8 9 10
85,631 21,143 43,909 70,748 10,377
23,782 10,137 25,074 40,373 5,120
231,808
104,486
4,904 38,713 103,118 326,124 52,494 6,567 6,039 2,638
4,860 19,747 107,614 224,363 63,690 872 16,150 –
Total non-current assets
540,597
437,296
TOTAL ASSETS
772,405
541,782
53,727 18,258 17,354 20,696
49,694 16,336 12,408 2,828
110,035
81,266
4,883 21,800 8,302 – 68,400 –
5,321 36,785 51,319 1,198 43,209 3,374
Total non-current liabilities
103,385
141,206
TOTAL LIABILITIES
213,420
222,472
NET ASSETS
558,985
319,310
748,899 2,497 64,753 (257,164)
724,948 2,868 99,965 (508,471)
558,985
319,310
ASSETS
Current assets
Cash and cash equivalents Restricted cash Receivables Inventories Other assets Total current assets
Non-current assets
Restricted cash Inventories Property, plant and equipment Exploration, evaluation and development Right-of-use assets Intangibles Other assets Deferred tax assets
7 9 11 13 12 14 10 6
LIABILITIES
Current liabilities Payables Lease liabilities Borrowings Provisions
15 12 16 17
Total current liabilities
Non-current liabilities
Payables Lease liabilities Borrowings Derivative financial instrument Provisions Deferred tax liabilities
EQUITY
Contributed equity Other equity Reserves Accumulated losses
15 12 16 17 6
18 19 20a 20b
TOTAL EQUITY The above consolidated statement of financial position should be read in conjunction with the accompanying notes.
Financial Statements Auditor’s Independence Declaration
As at 30 June 2026
50 Financial Statements
Consolidated Statement of Changes in Equity For the year ended 30 June 2026 Contributed equity $’000
Other equity $’000
Reserves $’000
Accumulated losses $’000
Total equity $’000
727,307 – –
– – –
58,307 – 41,658
(537,928) 29,457 –
247,686 29,457 41,658
–
–
41,658
29,457
71,115
Transaction with owners in their capacity as owners: Issue of warrants Share buy-back
– (2,359)
2,868 –
– –
– –
2,868 (2,359)
Total transaction with owners
(2,359)
2,868
–
–
509
Balance at 30 June 2025
724,948
2,868
99,965
(508,471)
319,310
Balance at 1 July 2025
724,948
2,868
99,965
(508,471)
319,310
Profit after income tax Total other comprehensive losses for the year
– –
– –
– (37,301)
277,912
277,912 (37,301)
Total comprehensive income for the year
–
–
(37,301)
277,912
240,611
Transaction with owners in their capacity as owners: Shares issued via exercise of warrants, net of cost Shares issued via exercise of options, net of cost Issue of warrants Dividends paid Share-based payment expense
17,299 6,652 – – –
(2,868) – 2,497 – –
– (1,669) – – 3,758
– – – (26,605) –
14,431 4,983 2,497 (26,605) 3,758
Total transaction with owners
23,951
(371)
2,089
(26,605)
(936)
748,899
2,497
64,753
(257,164)
558,985
Balance at 1 July 2024 Profit after income tax Total other comprehensive income for the year Total comprehensive income for the year
Balance at 30 June 2026
The above consolidated statement of changes in equity should be read in conjunction with the accompanying notes.
www.kingsgate.com.au
51 Financial Statements
Consolidated Statement of Cash Flows 2026 $’000
2025 $’000
578,944 (353,940) 649
334,248 (247,122) 172
225,653
87,298
Payments for property, plant and equipment Payments for exploration, evaluation and development Payments for intangibles Payments for right-of-use asset Net payments of deposits Increase in restricted cash
(12,160) (62,054) (1,202) (1,651) (429) (12,705)
(6,932) (32,363) (225) (4,329) (3,120) (9,129)
Net cash (outflow) from investing activities
(90,201)
(56,098)
Proceeds from term facility Repayments of term facility Proceeds from standby loan facility Repayments of standby loan facility Repayment of secured loan note Proceeds from insurance premium funding Repayments of insurance premium funding Repayments of advances from preference shareholder Payments for share buy-back Payments of lease liabilities Shares issued via exercise of warrants net of transaction costs Shares issued via exercise of options net of transaction costs Dividends paid Finance costs paid
– (51,068) 14,959 (435) – 3,253 (3,253) – – (16,704) 14,431 4,983 (26,605) (11,857)
51,940 (6,242) – – (17,152) 4,603 (3,368) (13,213) (2,359) (13,323) – – – (12,703)
Net cash (outflow) from financing activities
(72,296)
(11,817)
Note
Cash flows from operating activities Receipts from customers Payments to suppliers and employees Interest received
Net cash inflow from operating activities
Cash flows from investing activities
Cash flows from financing activities
25
Net increase in cash held
63,156
19,383
Cash at the beginning of the year Effects of exchange rate on cash and cash equivalents
23,782 (1,307)
3,890 509
Cash at the end of the year
85,631
23,782
Right-of-use asset
6,892
43,791
Total non-cash financing activities
6,892
43,791
Non-cash financing activities
The above consolidated statement of cash flows should be read in conjunction with the accompanying notes.
Financial Statements Auditor’s Independence Declaration
For the year ended 30 June 2026
52 Financial Statements
Consolidated Entity Disclosure Statement As at 30 June 2026 % of ordinary shares held directly or indirectly by the Company in the body corporate
Country of incorporation
Australian or foreign tax resident
Jurisdiction for foreign tax residual
Australia
Australian
N/A
Name of entity
Type of entity
Kingsgate Consolidated Limited (the Company)
Body corporate
Dominion Mining Limited
Body corporate
100%
Australia
Australian
N/A
Gawler Gold Mining Pty Ltd
Body corporate
100%
Australia
Australian
N/A
Dominion Copper Pty Ltd
Body corporate
100%
Australia
Australian
N/A
Yilgarn Metals Pty Ltd
Body corporate
100%
Australia
Australian
N/A
Kingsgate Treasury Pty Ltd
Body corporate
100%
Australia
Australian
N/A
Kingsgate Capital Pty Ltd
Body corporate
100%
Australia
Australian
N/A
Kingsgate Nominees Pty Limited*
Body corporate
100%
Australia
Australian
N/A
Kingsgate South America Pty Ltd
Body corporate
100%
Australia
Australian
N/A
Kingsgate Chile NL
Body corporate
100%
Australia
Australian
N/A
Laguna Exploration Pty Ltd
Body corporate
100%
Australia
Australian
N/A
Akara Resources Public Company Limited
Body corporate
100%**
Thailand
Foreign
Thailand
Issara Mining Limited
Body corporate
100%
Thailand
Foreign
Thailand
Suansak Patana Limited
Body corporate
100%
Thailand
Foreign
Thailand
Phar Mai Exploration Limited
Body corporate
100%
Thailand
Foreign
Thailand
Richaphum Mining Limited
Body corporate
100%
Thailand
Foreign
Thailand
Phar Lap Limited
Body corporate
100%
Thailand
Foreign
Thailand
Phar Rong Limited
Body corporate
100%
Thailand
Foreign
Thailand
Laguna Resources Chile Limitada
Body corporate
100%
Chile
Foreign
Chile
Minera Kingsgate Chile Limitada
Body corporate
100%
Chile
Foreign
Chile
*
Trustee of the Company under Executive Share Plan
**
The ordinary share class constitutes 48% of issued capital of Akara Resources Public Company Limited
www.kingsgate.com.au
53 Notes to the Consolidated Financial Statements
The Financial Report of Kingsgate Consolidated Limited (Kingsgate or the “Company”) for the year ended 30 June 2026 was authorised for issue in accordance with a resolution of Directors on 31 August 2026. Kingsgate is a company limited by shares incorporated in Australia whose shares are publicly traded on the Australian Securities Exchange using the ASX code KCN. The consolidated financial statements of the Company as at and for the year ended 30 June 2026 comprise the Company and its subsidiaries (together referred to as the “Group” and individually as “Group entities”). A description of the nature of the Group’s operations and its principal activities is included in the Directors’ Report.
1. Basis of preparation These general purpose financial statements have been prepared in accordance with the Australian Accounting Standards, other authoritative pronouncements of the Australian Accounting Standards Board and the Corporations Act 2001. The Company is a for-profit entity for the purpose of preparing the financial statements. The financial statements have been prepared on a going concern basis, which indicates continuity of business activities and the realisation of assets and settlement of liabilities in the normal course of business.
a. Compliance with IFRS The financial statements comply with International Financial Reporting Standards (“IFRS”) adopted by the International Accounting Standards Board (“IASB”).
b. Historical cost convention The financial statements have been prepared under the historical cost convention, as modified by the revaluation of available-forsale financial assets and financial instruments (including derivative instruments) at fair value through profit or loss. Comparative information
is reclassified where appropriate to enhance comparability or in conformity with revised standards and interpretations.
c. Functional and presentation currency The financial statements of the Group entities are measured using the currency of the primary economic environment in which the entity operates (“the functional currency”). The consolidated statements are presented in Australian dollars, which is the Company’s functional currency and presentation currency.
d. Rounding of amounts The Company is of a kind referred to in ASIC Corporations (Rounding in Financial/ Directors’ Reports) Instrument 2016/191 relating to the ‘rounding off’ of amounts in the financial statements. Amounts in the financial statements have been rounded off in accordance with the instrument to the nearest thousand dollars, or in certain cases, the nearest dollar.
e. Critical accounting estimates The preparation of financial statements requires the use of certain critical accounting estimates. It also requires management to exercise its judgement in the process of applying the Group’s accounting policies. The areas involving a higher degree of judgement or complexity, or areas where assumptions and estimates are significant to the financial statements are disclosed in Note 3.
f. New and amended standards adopted by the Group The Group has applied all the new standards and amendments that have been published and which are applicable for the first time for its annual reporting period commencing 1 July 2025. These standards and amendments did
Notes to the Consolidated Financial Statements
Notes to the Consolidated Financial Statements not have a material impact on the financial statements.
g. New standards and interpretations not yet adopted Certain new accounting standards and interpretations have been published that are not mandatory for 30 June 2026 reporting periods and have not been early adopted by the Group. These standards are not expected to have a material impact on the financial statements.
2. Material accounting policies The principal accounting policies adopted in the preparation of the financial statements are set out below. These policies have been consistently applied to all the years presented.
a. Principles of consolidation i.
Business combinations
Business combinations are accounted for using the acquisition method as at the acquisition date, which is the date on which control is transferred to the Group. Control is the power to govern the financial and operating policies of an entity so as to obtain benefits from its activities. In assessing control, the Group takes into consideration potential voting rights that currently are exercisable. The consideration transferred for the acquisition of a subsidiary comprises the fair value of the assets transferred, the liabilities incurred and the equity interests issued by the Group. The consideration transferred does not include amounts related to the settlement of a pre-existing relationship. Such amounts are generally recognised in profit or loss. Costs related to the acquisition other than those associated with the issue of debt or equity securities, that the Group incurs in connection with a business combination are expensed as incurred. Any contingent consideration payable is recognised at fair value at the acquisition date.
u
continued
54 Notes to the Consolidated Financial Statements
2. Material accounting policies continued Acquisitions of non-controlling interests are accounted for as transactions with owners in their capacity as owners and therefore no goodwill is recognised as a result of such transactions. The non-controlling interest in the acquiree is based on the fair value of the acquiree’s net identifiable assets. The adjustments to non-controlling interests are based on the proportionate amount of the net assets of the subsidiary. The acquisition of an asset or group of assets that is not a business is accounted for by allocating the cost of the transaction to the net identifiable assets and liabilities acquired based on their fair values.
ii.
Subsidiaries
Subsidiaries are entities controlled by the Group. The Group controls an entity when the Group is exposed to, or has rights to, variable returns from its involvement with the entity and has the ability to affect those returns through its power to direct the activities of the entity. The financial statements of subsidiaries are included in the consolidated financial statements from the date that control commences until the date that control ceases. The accounting policies of subsidiaries have been changed when necessary to align them with the policies adopted by the Group. Losses applicable to the non-controlling interests in a subsidiary are allocated to the non-controlling interests even if doing so causes the non-controlling interests to have a deficit balance. Intra-group balances and transactions, and any unrealised gains arising from intra-group transactions are eliminated in preparing the consolidated financial statements. Unrealised losses are also eliminated unless the transaction provides evidence of the impairment of the asset transferred.
b. Foreign currency translation i.
Transactions and balances
Foreign currency transactions are translated into the respective functional currencies of the Group entities at exchange rates on the dates of the transactions. Foreign exchange gains and losses resulting from the settlement of such transactions and from the translation at year-end exchange rates of monetary assets and liabilities denominated in foreign currencies are recognised in the profit or loss; except when they are deferred in equity as qualifying cash flow hedges and qualifying net investment hedges or, are attributable to part of the net investment in a foreign operation.
www.kingsgate.com.au
Translation differences on assets and liabilities carried at fair value are reported as part of the fair value gain or loss. Translation differences on non-monetary assets and liabilities such as equities held at fair value through profit or loss are recognised in profit or loss as part of the fair value gain or loss. Translation differences on non-monetary assets are included in the fair value reserve in equity. Exchange gains and losses which arise on balances between Group entities are taken to the foreign currency translation reserve where the intra-group balances are in substance part of the Group’s net investment. Whereas a result of a change in circumstances, a previously designated intra-group balance is intended to be settled in the foreseeable future, the intra-group balance is no longer regarded as part of the net investment. The exchange differences for such balance previously taken directly to the foreign currency translation reserves are recognised in the profit or loss.
ii.
Foreign operations
The results and financial position of all the Group entities (none of which has the currency of a hyperinflationary economy) that have a functional currency different from the presentation currency are translated into the presentation currency as follows: 〉
the assets and liabilities of the foreign operations, including goodwill and fair value adjustments arising on acquisition, are translated at the year-end exchange rate;
〉
the income and expenses of foreign operations are translated at average exchange rates (unless this is not a reasonable approximation of the cumulative effect of the rate prevailing on the transaction dates, in which case income and expenses are translated at the dates of the transactions); and
〉
The Group recognises revenue from gold doré sales at the point where the doré is delivered to the buyer at the buyer’s location.
d. Income tax Income tax expense comprises current and deferred tax. Current tax and deferred tax is recognised in profit or loss except to the extent that it relates to a business combination, or items recognised directly in equity or in other comprehensive income. Current tax is expected tax payable or receivable on the taxable income or loss for the year using tax rates enacted or substantively enacted at the reporting date, and any adjustment to tax payable in respect of previous years. Deferred tax is provided using the liability method, providing for temporary differences between the carrying amounts of assets and liabilities for financial reporting purposes and the amounts used for taxation purposes. The amount of deferred tax provided is based on the expected manner of realisation or settlement of the carrying amount of assets and liabilities, using tax rates enacted or substantively enacted at the reporting date. A deferred tax asset is recognised for unused tax losses, tax credits and deductible temporary differences, to the extent that it is probable that future taxable profits will be available against which they can be utilised. Deferred tax assets are reviewed at each reporting date and are reduced to the extent that it is no longer probable that the related tax benefit will be realised. Deferred tax is not recognised for: 〉
temporary differences on the initial recognition of assets or liabilities in a transaction that is not a business combination and that affects neither accounting nor taxable profit or loss;
〉
temporary differences related to investments in subsidiaries where the Company is able to control the timing of the reversal of the temporary differences and it is probable that they will not reverse in the foreseeable future; and
〉
taxable temporary differences arising on the initial recognition of goodwill.
foreign currency differences are recognised in other comprehensive income, and presented in the foreign currency translation reserve.
c. Revenue Revenue is measured at the fair value of the consideration received or receivable. Sales revenue represents the net proceeds receivable from the buyer.
Gold and silver sales Revenue from contracts with customers is recognised when control of the goods is transferred to the customers at an amount that reflects the consideration to which the Group expects to be entitled in exchange for those goods.
Deferred tax assets and liabilities are offset if there is a legally enforceable right to offset current tax liabilities and assets and, they relate to income taxes levied by the same tax authority on the same taxable entity. Additional income tax expenses that arise from the distribution of cash dividends are recognised at the same time that the liability to pay the related dividend is recognised.
55 Notes to the Consolidated Financial Statements
The Company and its wholly owned Australian resident entities formed a tax-consolidation group with effect from 1 July 2003 and are therefore taxed as a single entity from that date. The head entity within the tax-consolidation group is Kingsgate Consolidated Limited. Current tax expense or benefit, deferred tax assets and deferred tax liabilities arising from temporary differences of the members of the tax-consolidation group are recognised in the separate financial statements of the members of the tax-consolidation group using the “standalone taxpayer” approach by reference to the carrying amounts in the separate financial statements of each entity and the tax values applying under tax consolidation. Current tax assets or liabilities and deferred tax assets arising from unused tax losses assumed by the head entity from the subsidiaries in the tax-consolidation group, are recognised as amounts receivable or payable to other entities in the tax-consolidation group in conjunction with any tax funding agreement amounts. The Company recognises deferred tax assets arising from unused tax losses of the tax-consolidation group to the extent that it is probable that future taxable profits of the tax-consolidation group will be available against which the asset can be utilised.
may also require payment of interim funding amounts to assist with its obligations to pay tax instalments. The members of the tax-consolidation group have also entered into a tax sharing agreement. The tax sharing agreement provides for the determination of the allocation of income tax liabilities between the entities should the head entity default on its tax payment obligations. No amounts have been recognised in the consolidated financial statements in respect of this agreement as payment of any amounts under the tax sharing agreement is considered remote.
The head entity recognises the assumed current tax amounts as current tax liabilities or assets adding to its own current tax amounts, since they are also due to or from the same taxation authority. The current tax liabilities or assets are equivalent to the tax balances generated by external transactions entered into by the tax-consolidated group. The amounts receivable or payable under the tax funding agreement are due upon receipt of the funding advice from the head entity, which is issued as soon as practicable after the end of each financial year. The head entity
The right-of-use assets are classified as leases of property and are carried at cost less accumulated depreciation and impairment loss. The assets are amortised on a straight-line basis over the shorter of the asset’s useful life and the lease term. Lease payments are allocated between principal and finance cost. The finance cost is charged to profit or loss over the lease period so as to produce a constant periodic rate of interest on the remaining balance of the liability for each period.
Uncertain tax position
f. Impairment of assets
An uncertain tax treatment is any tax treatment applied by the Group where there is uncertainty over whether that treatment will be accepted by the tax authority. The Group is required to determine the uncertainty over income tax treatment by addressing the following:
Assets other than goodwill and indefinite life intangible assets are tested for impairment whenever events or changes in circumstances indicate that the carrying amount may not be recoverable. An impairment loss is recognised for the amount by which the assets carrying amount exceeds its recoverable amount. The recoverable amount is the higher of an asset’s fair value less costs of disposal or value in use. For the purposes of assessing impairment, assets are grouped at the lowest levels for which there are separately identifiable cash inflows which are largely independent of the cash inflows from other assets or groups of assets (cash-generating units). Non-financial assets other than goodwill that suffered impairment are reviewed for possible reversal of the impairment at each reporting date.
〉
the Group determines whether uncertain tax treatments should be considered separately, or together as a group, depending on which approach better predicts the resolution of the uncertainty;
〉
the Group determines if it is probable that the tax authorities will accept the uncertain tax treatment; and if it is not probable that the uncertain tax treatment will be accepted, the Group reflects the effect of the uncertainty in its income tax accounting in the period in which that determination is made (for example, by recognising an additional tax liability or applying a higher tax rate); and
Tax funding and sharing agreements The members of the tax-consolidation group have entered into a funding agreement that sets out the funding obligations of members of the tax-consolidation group in respect of tax amounts. The tax funding arrangements require payments to or from the head entity and any deferred tax asset assumed by the head entity, resulting in the head entity recognising an intra-group receivable or payable in the separate financial statements of the members of the tax-consolidation group equal in amount to the tax liability or asset assumed. The intra-group receivables or payables are at call.
cannot be determined at the consolidated entity’s average incremental borrowing rate.
〉
the Group measures the tax uncertainty based on the most likely amount or expected value, depending on whichever method better predicts the resolution of the uncertainty.
Based on the assessment completed by the Group, there is no material tax uncertainty that requires a tax liability to be recognised or that requires a different tax rate to be applied.
e. Leases Where the Group has entered into a lease contract for the right to control the use of an asset over the lease term, the present value of future lease commitments is recognised as a liability on the balance sheet at commencement date, with the corresponding asset recognised as a right-of-use asset. The lease liability represents the present value of the expected future lease payments, discounted at the rate implicit in the lease or if that rate
Notes to the Consolidated Financial Statements
Tax consolidation
g. Cash and cash equivalents Cash and cash equivalents includes cash on hand, deposits held at call with financial institutions, other short-term, highly liquid investments with original maturities of three months or less that are readily convertible to known amounts of cash and which are subject to an insignificant risk of changes in value, and bank overdrafts. Bank overdrafts are shown within borrowings in current liabilities in the statement of financial position.
h. Trade and other receivables Trade and other receivables are recognised initially at fair value and subsequently measured at amortised cost using the effective interest method, less provision for impairment. Receivables are due for settlement no more than 90 days from the date of recognition. Collectability of trade and other receivables is reviewed on an ongoing basis. The Group applies the AASB 9 simplified approach to measuring expected credit losses which uses a lifetime expected loss allowance for all trade and other receivables.
u
continued
56 Notes to the Consolidated Financial Statements
2. Material accounting policies continued The amount of the impairment loss is recognised in the income statement within other expenses. When a trade and other receivable for which an impairment allowance had been recognised becomes uncollectible in a subsequent period, it is written off against the allowance account. Subsequent recoveries of amounts previously written off are credited against other expenses in the income statement.
i.
Inventories
Raw materials and stores, work in progress and finished goods (including gold bullion), are stated at the lower of cost and net realisable value. Cost comprises direct materials, direct labour and an appropriate proportion of variable and fixed overhead expenditure, the latter being allocated on the basis of normal operating capacity. Costs are assigned to individual items of inventory on the basis of weighted average costs. Costs of purchased inventory are determined after deducting rebates and discounts. Net realisable value is the estimated selling price in the ordinary course of business less the estimated costs of completion and the estimated costs necessary to make the sale. Stockpiles represent ore that has been extracted and is available for further processing. If there is significant uncertainty as to whether the stockpiled ore will be processed it is expensed as incurred. Where the future processing of this ore can be predicted with confidence, e.g. because it exceeds the mine’s cut-off grade, it is valued at the lower of cost and net realisable value. If the ore will not be processed within the 12 months after the reporting date, it is included within non-current assets. Work in progress inventory includes ore stockpiles and other partly processed material. Quantities are assessed primarily through surveys and assays, and truck counts.
j.
Non-derivative financial assets
Loans and receivables Loans and receivables are non-derivative financial assets with fixed or determinable payments that are not quoted in an active market. They are included in current assets, except for those with maturities greater than 12 months after the reporting date which are classified as non-current assets. Loans and receivables are measured at amortised cost using the effective interest method, less any impairment losses.
k. Derivative financial instruments Derivative financial instruments are used by the Group to protect against the Group’s Australian dollar gold price risk exposures. The Group does not apply hedge accounting and accordingly all fair value movements on derivative financial instruments are recognised in the profit or loss. Derivative financial instruments are stated at fair value on the date a derivative contract is entered into and are subsequently remeasured to their fair value at each reporting date. The resulting gain or loss is recognised in the income statement immediately.
l. Property, plant and equipment Property, plant and equipment are stated at historical cost less depreciation. Historical cost includes expenditure that is directly attributable to the acquisition of the items. Subsequent costs are included in the asset’s carrying amount or recognised as a separate asset, as appropriate, only when it is probable that future economic benefits associated with the item will flow to the Group and the cost of the item can be measured reliably. The carrying amount of any component accounted for as a separate asset is derecognised when replaced. All other repairs and maintenance are charged to the income statement during the reporting period in which they are incurred.
Depreciation Depreciation and amortisation of mine buildings, plant, machinery and equipment is provided over the assessed life of the relevant mine or asset, whichever is the shorter. Depreciation and amortisation is determined on a units-of-production basis over the estimated recoverable reserves from the related area. In some circumstances, where conversion of resources into reserves is expected, some elements of resources may be included. For mine plant, machinery and equipment, which have an expected economic life shorter than the life of the mine, a straight line basis is adopted. The expected useful lives are as follows: 〉
mine buildings – the shorter of applicable mine life and 10 years;
〉
plant, machinery and equipment – the shorter of applicable mine life and 3–10 years depending on the nature of the asset.
The estimated recoverable reserves and life of each mine and the remaining useful life of each class of asset are reassessed at least annually.
www.kingsgate.com.au
Where there is a change in the reserves during the period, depreciation and amortisation rates are adjusted prospectively from the beginning of the reporting period. Major spares purchased specifically for a particular plant are capitalised and depreciated on the same basis as the plant to which they relate.
Impairment An asset’s carrying amount is written down immediately to its recoverable amount if the asset’s carrying amount is greater than its estimated recoverable amount (Note 2f).
Derecognition An item of property, plant and equipment is derecognised upon disposal or when no future economic benefits are expected to arise from the continued use of the asset. Any gain or loss arising on derecognition of the asset (calculated as the difference between the net disposal proceeds and the carrying amount of the item) is included in the profit or loss in the period the item is derecognised.
m. Deferred stripping costs As part of its mining operations, the Group incurs stripping (waste removal) costs both during the development phase and production phase of its operations. Stripping costs incurred during the production phase are generally considered to create two benefits, being either the production of inventory in the period or improved access to the ore to be mined in the future. Where the benefits are realised in the form of inventory produced in the period, the production stripping costs are accounted for as part of the cost of producing those inventories. Where production stripping costs are incurred and the benefit is improved access to the ore to be mined in the future, the costs are recognised as a non-current asset, referred to as a “production stripping asset”, if the following criteria are all met: 〉
future economic benefits (being improved access to the ore body) associated with the stripping activity are probable;
〉
the component of the ore body for which access has been improved can be accurately identified; and
〉
the costs associated with the stripping activity associated with that component can be reliably measured.
The amount of stripping costs deferred is based on the ratio obtained by dividing the volume of waste mined by the volume of ore mined for each component of the mine. Stripping costs
57
incurred in the period are deferred to the extent that the actual current period waste to ore ratio exceeds the life of component expected waste to ore (“life of component”) ratio. A component is defined as a specific volume of the ore body that is made more accessible by the stripping activity. An identified component of the ore body is typically a subset of the total ore body of the mine. It is considered that each mine may have several components, which are identified based on the mine plan. The mine plans and therefore the identification of specific components will vary between mines as a result of both the geological characteristics and location of the ore body. The financial considerations of the mining operations may also impact the identification and designation of a component. The identification of components is necessary for both the measurement of costs at the initial recognition of the production stripping asset, and the subsequent depreciation of the production stripping asset. The life of component ratio is a function of an individual mine’s design and therefore changes to that design will generally result in changes to the ratio. Changes in other technical or economic parameters that impact reserves will also have an impact on the life of component ratio even if they do not affect the mine’s design. Changes to the life of component ratio are accounted for prospectively from the date of change. The production stripping asset is initially measured at cost, which is the accumulation of costs directly incurred to perform the stripping activity that improves access to the identified component of ore. If incidental operations are occurring at the same time as the production stripping activity, but are not necessary for the production stripping activity to continue as planned, these costs are not included in the cost of the stripping activity asset. The production stripping asset is amortised over the expected useful life of the identified component of the ore body that is made more accessible by the activity, on a units of production basis. Economically recoverable reserves are used to determine the expected useful life of the identified component of the ore body. The production stripping asset is then carried at cost less accumulated amortisation and any impairment losses. The production stripping asset is included in mine properties. These costs form part of the total investment in the relevant cash generating unit to which they relate, which is reviewed for impairment in accordance with the Group’s impairment accounting policy (Note 2f).
n. Exploration, evaluation and feasibility expenditure Exploration and evaluation expenditure Exploration and evaluation expenditure incurred by, or on behalf of the Group is accumulated separately for each area of interest. Such expenditure comprises direct costs and depreciation and does not include general overheads or administrative expenditure not having a specific nexus with a particular area of interest. Exploration expenditure for each area of interest is carried forward as an asset provided the rights to tenure of the area of interest are current and one of the following conditions is met: 〉
the exploration and evaluation expenditures are expected to be recouped through successful development and exploitation of the area of interest, or alternatively by its sale; or
〉
exploration and evaluation activities in the area of interest have not at the reporting date reached a stage which permits a reasonable assessment of the existence or otherwise of economically recoverable reserves, and active and significant operations in, or in relation to, the area of interest are continuing.
Exploration expenditure is written off when it fails to meet at least one of the conditions outlined above or an area of interest is abandoned. The carrying value of exploration and evaluation assets is assessed in accordance with AASB 6 Exploration for and Evaluation of Mineral Resources and the Group’s impairment policy (Note 2f).
Feasibility expenditure Feasibility expenditure represents costs related to the preparation and completion of a feasibility study to enable a development decision to be made in relation to an area of interest and capitalised as incurred. At the commencement of production, all past exploration, evaluation and feasibility expenditure in respect of an area of interest that has been capitalised is transferred to mine properties where it is amortised over the life of the area of interest to which it relates on a unit-of-production basis.
o. Mine properties Mine properties represents the accumulated exploration, evaluation, land and development expenditure incurred by or on behalf of the Group in relation to areas of interest in which mining of a mineral resource has commenced.
When further development expenditure is incurred in respect of a mine property after commencement of production, such expenditure is carried forward as part of the mine property only when substantial future economic benefits are thereby established. Otherwise, such expenditure is classified as part of the cost of production. Amortisation of costs is provided on the units-of-production method with separate calculations being made for each component. The units-of-production basis results in an amortisation charge proportional to the depletion of the estimated recoverable reserves. In some circumstances, where conversion of resources into reserves is expected, some elements of resources may be included. Development and land expenditure still to be incurred in relation to the current recoverable reserves are included in the amortisation calculation. Where the life of the assets is shorter than the mine life, their costs are amortised based on the useful life of the assets.
Notes to the Consolidated Financial Statements
Notes to the Consolidated Financial Statements
The estimated recoverable reserves and life of each mine and the remaining useful life of each class of asset are reassessed at least annually. Where there is a change in the reserves during a six-month period, depreciation and amortisation rates are adjusted prospectively from the beginning of that reporting period.
p. Trade and other payables Trade and other payables represent liabilities for goods and services provided to the Group prior to the end of the financial year which are unpaid. The amounts are unsecured and are usually paid in line with normal creditor terms.
q. Borrowings Borrowings are initially recognised at fair value, net of transaction costs incurred. Borrowings are subsequently measured at amortised cost. Any difference between the proceeds (net of transaction costs) and the redemption amount is recognised in the profit or loss over the period of the borrowings using the effective interest method. Fees paid on the establishment of loan facilities are recognised as transaction costs to the extent that it is probable that some or all of the facility will be drawn down. In this case, the fee is deferred until the drawdown occurs. To the extent there is no evidence that it is probable that some or all of the facility will be drawn down, the fee is capitalised and amortised over the period of the facility to which it relates. Preference shares which are mandatorily redeemable on a specific date are classified as liabilities. The dividends on these preference shares are recognised in the profit or loss as finance costs.
u
continued
58 Notes to the Consolidated Financial Statements
2. Material accounting policies continued Borrowings are removed from the statement of financial position when the obligation specified in the contract is discharged, cancelled or expired. The difference between the carrying amount of a financial liability that has been extinguished or transferred to another party and the consideration paid, including any non-cash assets transferred or liabilities assumed, is recognised in other income or finance costs. Borrowings are classified as current liabilities unless the Group has an unconditional right to defer settlement of the liability for at least 12 months after the reporting date.
r. Borrowing costs Borrowing costs directly attributable to the acquisition, construction or production of qualifying assets are added to the cost of those assets, until such time as the assets are substantially ready for their intended use. Where the funds used to finance a qualifying asset form part of general borrowings, the amount capitalised is calculated using a weighted average of rates applicable to the relevant borrowings during the period. Where funds borrowed are directly attributable to a qualifying asset, the amount capitalised represents the borrowing costs specific to those borrowings. All other borrowing costs are recognised as expenses in the period in which they are incurred.
s. Provisions Provisions for legal claims are recognised when the Group has a present legal or constructive obligation as a result of past events, it is probable that an outflow of resources will be required to settle the obligation and the amount has been reliably estimated. Provisions are not recognised for future operating losses. Where there are a number of similar obligations, the likelihood that an outflow will be required in settlement is determined by considering the class of obligations as a whole. A provision is recognised even if the likelihood of an outflow with respect to any one item included in the same class of obligations may be small. Provisions are measured at the present value of management’s best estimate of the expenditure required to settle the present obligation at the reporting date. The discount rate used to determine the present value reflects current market assessments of the time value of money and the risks specific to the liability. The increase in the provision due to the passage of time is recognised as finance costs.
www.kingsgate.com.au
t. Restoration and rehabilitation provision The estimated costs of decommissioning and removing an asset and restoring the site are included in the cost of the asset at the date the obligation first arises and to the extent that it is first recognised as a provision. This restoration asset is subsequently amortised on a units-ofproduction basis. The corresponding provision of an amount equivalent to the restoration asset created is reviewed at the end of each reporting period. The provision is measured at the best estimate of present obligation at the end of the reporting period based on current legal and other requirements and technology, discounted where material using national government bond rates at the reporting date with terms to maturity and currencies that match, as closely as possible, the estimated future cash outflows. Where there is a change in the expected restoration, rehabilitation or decommissioning costs, an adjustment is recorded against the carrying value of the provision and any related restoration asset, and the effects are recognised in the income statement on a prospective basis over the remaining life of the operation. The unwinding of the effect of discounting on the rehabilitation provision is included within finance costs in the income statement.
experience of employee departures and periods of service. Expected future payments are discounted using market yields at the reporting date on corporate bonds with terms to maturity and currency that match, as closely as possible, the estimated future cash outflows. The obligations are presented as current liabilities in the balance sheet if the entity does not have an unconditional right to defer settlement for at least 12 months after the reporting period, regardless of when the actual settlement is expected to occur.
iii. Cash bonuses Cash bonuses are expensed in the income statement at reporting date. A liability is recognised for the amount expected to be paid if the Group has a present legal or constructive obligation to pay this amount as a result of past service provided by the Directors or employees and the obligation can be estimated reliably.
iv. Retirement benefit obligations Defined contribution plan Contributions to defined contribution superannuation plans are recognised as an expense in the income statement as they become payable. Defined benefit plan
u. Employment benefits
The Company’s Thai subsidiary, Akara Resources Public Company Limited (Akara), has a defined benefit plan which is the amount of pension benefit that an employee will receive on retirement, usually dependent on one or more factors such as age, years of service and compensation.
i.
Retirement benefit
Costs incurred that relate to an existing condition caused by past operations, but do not have a future economic benefit are expensed as incurred.
Wages and salaries, annual leave and sick leave
Liabilities for wages and salaries (including non-monetary benefits and annual leave) expected to be settled within 12 months of the reporting date are recognised in provisions for employee benefits in respect of employees’ services up to the reporting date and are measured at the amounts expected to be paid when the liabilities are settled. Liabilities for sick leave are recognised when the leave is taken and are measured at the rates paid or payable.
ii.
Long service leave and severance pay
The liability for long service leave and severance pay is recognised in the provision for employee benefits and measured as the present value of expected future payments to be made in respect of services provided by employees up to the reporting date. Consideration is given to the expected future wage and salary levels,
Under labour laws applicable in Thailand, employees completing 120 days of service are entitled to severance pay on termination or retrenchment without cause or upon retirement age of 60. The severance pay will be at the rate according to number of years of service as stipulated in the Labour Law which is currently at a maximum rate of 400 days of final salary. The liability recognised in the statement of financial position in respect of defined benefit pension plans is the present value of the defined benefit obligation at the end of the reporting period, together with adjustments for unrecognised past-service costs. The defined benefit obligation is calculated annually using the projected unit credit method. The present value of the defined benefit obligation is determined by discounting the estimated future cash outflows using market yield of government bonds that are denominated in the currency in which the benefits will be paid, and that have
59
terms to maturity approximating to the terms of the related pension liability.
v. Share-based payment transactions The Group provides benefits to employees (including Directors) in the form of share-based payments, whereby employees render services in exchange for shares or rights over shares (“equity settled transactions”). The Group accounts for equity-settled share-based payment transactions in accordance with AASB 2 Share-based Payment. Recognition and measurement: The fair value of equity-settled performance rights is determined at the grant date and recognised as an employee benefit expense, with a corresponding increase in the share-based payment reserve within equity, over the vesting period. The vesting period is the period during which all specified vesting conditions are to be satisfied. Market conditions: Where a performance hurdle constitutes a market condition (i.e. Relative TSR and Absolute TSR), the fair value at grant date reflects the probability of achieving that condition. These hurdles are incorporated into the fair value calculation and do not affect the number of rights assumed to vest for the purposes of recognising the expense. The expense is recognised regardless of whether the market conditions are ultimately satisfied. Non-market conditions: Where a performance hurdle does not constitute a market condition (i.e. Mineral Reserve Growth), the fair value at grant date does not incorporate the probability of achieving that condition. Instead, the number of rights expected to vest is revised at each reporting date based on the Group’s best estimate of the number of rights that will ultimately vest. The expense recognised reflects the revised estimate. Revisions to estimates: Any revision to the number of rights expected to vest due to a change in non-market conditions is recognised in profit or loss with a corresponding adjustment to the share-based payment reserve. Lapsed and forfeited rights: Where performance rights lapse due to failure to satisfy a non-market vesting condition, the cumulative expense previously recognised is reversed in the period in which the lapse occurs. Where performance rights lapse due to failure to satisfy a market condition (Relative TSR or Absolute TSR), the cumulative expense previously recognised is not reversed, as the probability of achieving the market condition was incorporated into the grant date fair value. Service condition: Where performance rights are forfeited upon cessation of employment,
the cumulative expense previously recognised is reversed in the period of forfeiture, unless the Board determines that some or all rights may remain on foot.
share to take into account: 〉
the after-income tax effect of interest and other financing costs associated with dilutive potential ordinary shares; and
Vesting and exercise: Upon exercise of vested performance rights, the balance of the share-based payment reserve attributable to those rights is transferred to contributed equity.
〉
by the weighted average number of additional ordinary shares that would have been outstanding assuming the conversion of all dilutive potential ordinary shares.
Performance multiplier: For performance rights subject to market conditions (Relative TSR and Absolute TSR), the grant date fair value per right is determined using a Monte Carlo simulation that incorporates the probability of achieving all performance outcomes, including the Exceptional threshold at which the applicable multiplier is triggered. The share-based payment expense is calculated by reference to the number of rights granted divided by the applicable performance multiplier, multiplied by the grant date fair value per right. The expense is not subsequently adjusted for actual market condition outcomes. For performance rights subject to non-market conditions (Mineral Reserve Growth), the grant date fair value is based on the share price at grant date. The number of rights expected to vest is estimated at each reporting date and revised as expectations change. For FY2026 Awards, this includes the potential effect of the 1.25x multiplier; for FY2025 Awards, no multiplier applies and the quantity estimate is capped at 100% of the base entitlement. Upon the exercise of the equity settled reward, the related balance of the share-based payments reserve is transferred to share capital.
v. Dividends Dividends are recognised as a liability in the period in which they are declared.
w. Earnings per share i.
Basic earnings per share
Basic earnings per share is calculated by dividing: 〉
the profit attributable to owners of the Company, excluding any costs of servicing equity other than ordinary shares; and
〉
by the weighted average number of ordinary shares outstanding during the financial year, adjusted for bonus elements in ordinary shares issued during the year and excluding treasury shares.
ii.
Diluted earnings per share
Diluted earnings per share adjust the figures used in the determination of basic earnings per
x. Contributed equity
Notes to the Consolidated Financial Statements
Notes to the Consolidated Financial Statements
Issued ordinary share capital is classified as equity and is recognised at the fair value of the consideration received by the Group. Incremental costs directly attributable to the issue of shares and share options are recognised as a deduction, net of tax from the proceeds.
y. Goods and services tax and similar value added taxes (GST) Revenues, expenses and assets are recognised net of the amount of associated GST, unless the GST incurred is not recoverable from the taxation authority. In this case it is recognised as part of the cost of acquisition of the asset or as part of the expense. Receivables and payables are stated inclusive of the amount of GST receivable or payable. The net amount of GST recoverable from or payable to, the taxation authority is included with other receivables or payables in the statement of financial position. Cash flows are presented on a gross basis. The GST components of the cash flows arising from investing or financing activities which are recoverable from, or payable to the taxation authority, are presented as operating cash flows. Commitments and contingencies are disclosed net of the amount of GST recoverable from, or payable to, the taxation authority.
z. Operating and segment reporting Operating segments are reported in a manner consistent with the internal reporting provided to the chief operating decision maker. The chief operating decision maker, who is responsible for allocating resources and assessing performance of the operating segments, has been identified as the Board of Directors. Segment results that are reported to the Board of Directors include items directly attributable to a segment as well as those that can be allocated on a reasonable basis. The operating segments are disclosed in Note 4.
u
continued
60 Notes to the Consolidated Financial Statements
2. Material accounting policies continued aa. Parent entity financial information The financial information for the parent entity Kingsgate Consolidated Limited, disclosed in Note 31 has been prepared on the same basis as the consolidated financial statements except as set out below.
Investments in subsidiaries Investments in subsidiaries are accounted for at cost in the financial statements of Kingsgate.
Share-based payments The issue by the Company of equity instruments to extinguish liabilities of a subsidiary undertaking in the Group is treated as a capital contribution to that subsidiary undertaking.
3. Critical accounting estimates, assumptions and judgements Estimates and judgements are continually evaluated and are based on historical experience and other factors, including expectation of future events that may have a financial impact on the Group and that are believed to be reasonable under the circumstances. The Group makes estimates and assumptions concerning the future. Actual results may differ from these estimates under different assumptions and conditions. The estimates and assumptions that could materially affect the financial position and results are discussed below.
changes in discount rates. When these factors change or become known in the future, such differences will impact the mine rehabilitation provision in the period in which they change or become known.
b. Reversal of impairment – Nueva Esperanza Project The Nueva Esperanza Silver-Gold Project (the Project) is an exploration and evaluation asset constituting a separate cash-generating unit (CGU) for the purposes of AASB 136 Impairment of Assets and AASB 6 Exploration for and Evaluation of Mineral Resources.
Reversal of impairment During the year ended 30 June 2026, the Group recognised a reversal of previously recognised impairment losses of $68,638,000 in respect of the Project CGU ($66,566,000 against exploration and evaluation assets and $2,072,000 against water rights intangible assets). The reversal is limited to the carrying amount that would have existed had no impairment been recognised, in accordance with AASB 136.117. Cumulative impairment losses of $76,088,000 were recognised against the CGU in FY18 ($42,652,000) and FY19 ($33,436,000). Items totalling $7,449,000 were not eligible for reversal.
Events giving rise to the reversal The reversal reflects the following changes in facts and circumstances since the original impairment charges were recognised: 〉
a. Restoration and rehabilitation provision Significant estimates and assumptions are required in determining the provision for mine rehabilitation as there are many transactions and other factors that will affect the ultimate liability payable to rehabilitate the mine site. Factors that will affect this liability include changes in technology, changes in regulations, price increases, changes in timing of cash flows which are based on life of mine plans and
〉
Material increases in commodity prices: long-term consensus gold and silver prices have increased materially, with gold at US$3,100/oz and silver at US$40/oz, representing approximately double to triple the prices underlying the FY18 impairment assessment (gold US$1,200/oz; silver US$18/oz). Market-based evidence of higher recoverable amount: market-based resource multiples derived from comparable entities indicate a recoverable amount materially more than the CGU’s carrying amount.
〉
Arm’s-length royalty acquisition providing external cross-check the Group acquired the royalty and water rights over the Project in May 2026 from Inversiones Anglo American Norte SpA in an arm’s-length transaction, removing pre-production royalties and securing long-term water rights, materially enhancing the Project’s economics.
Methodology The recoverable amount was determined on a fair value less costs of disposal (FVLCD) basis, classified as Level 2 under AASB 13, as management determined that a value in use could not be estimated reliably given the Project’s stage of development. FVLCD was assessed using EV/Mineral Resource multiples per AgEq ounce derived from peer analyses, applied to the Project’s Mineral Resources of approximately 88 Moz AgEq.
Reversal of impairment results Based on the methodology described above, the recoverable value is significantly greater than the net carrying value of the assets that can be reversed for impairment and as result, an impairment reversal amounting to $68,638,000 has been recorded in the statement of profit or loss (see table below for a list of each non-current asset reversed). Following this reversal of impairment, except for items totalling $7,449,000 that were not eligible for reversal, the full amount of the CGU that was previously impaired has been reversed.
Key estimation uncertainties The recoverable amount is subject to estimation uncertainty including gold and silver prices, currency exchange rates, project specific discount, and mineral resources determination. A change in one or more of the assumptions used to estimate the recoverable amount would result in a change in the CGU’s recoverable amount. Any reasonable change in the key assumptions used to determine the recoverable amount would not result in the estimated recoverable amount to be less than the amount reversed.
Exploration, evaluation and development $’000
Intangibles $’000
Total $’000
Carrying amount before reversal Reversal of impairment
42,282 66,566
3,786 2,072
46,068 68,638
Carrying amount after reversal
108,848
5,858
114,706
Carrying amount had no impairment been recognised
108,848
5,858
114,706
www.kingsgate.com.au
61 Notes to the Consolidated Financial Statements
The Group’s operating segments are based on the internal management reports that are reviewed and used by the Board of Directors (chief operating decision maker). The operating segments represent the Group’s mine and project and include the following: 〉
Chatree Gold Mine, Thailand; and
〉
Nueva Esperanza Silver-Gold Project Chile.
Information regarding the results of each reportable segment is included as follows:
2026
Chatree $’000
Nueva Esperanza $’000
Corporate $’000
Total $’000
External sales revenue Other income
596,446 1,275
– –
– 1,246
596,446 2,521
Total segment income
597,721
–
1,246
598,967
Segment EBITDA – before impairment reversal Impairment reversal Depreciation and amortisation
304,961 – (56,729)
(4,220) 68,638 (2)
(25,838)1 – (241)
274,903 68,638 (56,972)
Segment result
248,232
64,416
(26,079)
286,569
Finance income Finance costs
– –
– –
649 (15,379)
649 (15,379)
Net finance costs
–
–
(14,730)
(14,730)
Profit/(loss) before tax
248,232
64,416
(40,809)
271,839
Other segment information Segment assets Segment liabilities
583,520 (176,548)
115,483 (5,996)
73,402 (30,876)
772,405 (213,420)
Net assets
406,972
109,487
42,526
558,985
External sales revenue Other income/(expense)
336,746 811
– –
– (380)
336,746 431
Total segment income
337,557
–
(380)
337,177
Segment EBITDA Depreciation and amortisation
110,607 (46,715)
(6,666) (4)
(9,483)1 (263)
94,458 (46,982)
Segment result
63,892
(6,670)
(9,746)
47,476
Finance income Finance costs
– –
– –
172 (17,949)
172 (17,949)
Net finance costs
–
–
(17,777)
(17,777)
Profit/(loss) before tax
63,892
(6,670)
(27,523)
29,699
Other segment information Segment assets Segment liabilities
499,893 (144,342)
35,364 (19,282)
6,525 (58,848)
541,782 (222,472)
Net assets/(liabilities)
355,551
16,082
(52,323)
319,310
1
Notes to the Consolidated Financial Statements
4. Segment information
Includes foreign exchange gain of $3,332,000 for the Group.
2025
1
Includes foreign exchange losses of $1,164,000 for the Group.
u
continued
62 Notes to the Consolidated Financial Statements
2026 $’000
2025 $’000
Gold sales Silver sales
529,709 66,737
307,895 28,851
Total sales revenue
596,446
336,746
Direct costs of mining and processing Royalties and other expenses incurred upon the sales of doré Inventory movements Depreciation (operation)
195,831 119,364 (48,213) 56,729
154,908 60,739 4,488 46,715
Total costs of sales
323,711
266,850
Administration Statutory and professional fees Legal provision (Note 17) Depreciation (corporate)
14,917 8,352 15,821 243
9,000 3,357 – 267
Total corporate and administration expenses
39,333
12,624
Interest and finance charges Amortisation of deferred borrowing costs
14,726 653
17,650 299
Total finance costs
15,379
17,949
Property, plant and equipment (Note 11) Right-of-use assets (Note 12) Intangibles (Note 14) Mine properties (Note 13)
8,763 15,375 105 32,729
7,754 12,932 96 26,200
Total depreciation and amortisation expenses Included in: Depreciation – operation Depreciation – corporate
56,972
46,982
56,729 243
46,715 267
Included in: Cost of sales Corporate and administration expenses Exploration expenses
13,980 5,924 1,742
11,675 3,771 1,444
Total employee benefits expenses
21,646
16,890
Nueva Esperanza (Note 3b)
68,638
–
Total impairment reversal
68,638
–
5. Revenue and expenses a. Sales revenue
b. Cost of sales
c. Corporate and administration expenses
d. Finance costs
e. Depreciation and amortisation
f. Employee benefits expenses
g. Employee benefits expenses
www.kingsgate.com.au
63
2026 $’000
2025 $’000
Current tax Deferred tax
– (6,073)
– 242
Total income tax (benefit)/expense
(6,073)
242
Deferred tax expense included in income tax expense comprises: (Increase) in deferred tax assets (Decrease)/increase in deferred tax liabilities Other adjustment
(4,327) (1,685) (61)
(3,264) 3,924 (418)
Deferred tax (benefit)/expense
(6,073)
242
271,839 81,552
29,699 8,910
Tax effect of amounts not deductible/assessable in calculating taxable income Non-deductible expenses Non-deductible interest expense to preference shareholders Non-deductible interest and borrowing costs to loan facility
4,491 438 2,781
1,895 434 2,945
Effect of Thailand BOI tax rate (0%) and non-BOI tax rate (20%)
(81,194)
(17,017)
Non-deductible rehabilitation provision expenses
4,690
–
Other non-assessable tax differences Non-assessable impairment reversal True-up of prior year tax estimates Tax losses not brought to account
(971) (20,592) (2,657) 5,389
– – – 3,075
Income tax (benefit)/expense
(6,073)
242
6. Income tax a. Income tax expense
Notes to the Consolidated Financial Statements
Notes to the Consolidated Financial Statements
b. Numerical reconciliation of income tax expense to prima facie tax payable Profit before income tax Tax at Australian rate of 30%
On 8 June 2023, Kingsgate’s Thai‑controlled entity, Akara, received approval from the Royal Thai Board of Investment (BOI) in respect of the investment promotion certificate dated 20 March 2023 for the Chatree Gold Mine. The approval grants Akara an eight‑year exemption, including: 〉
the 20 per cent corporate income tax rate for the net profit of the BOI activities in the aggregated amount not over 100% of its investment excluding land and working capital;
〉
the 10 per cent withholding tax on dividends remitted overseas; and
〉
import duties on machinery, raw materials used in research and development, and raw materials used in production for export. 2026 $’000
2025 $’000
Foreign exchange losses recognised directly in foreign currency translation reserves
–
–
Total tax recognised in other comprehensive income
–
–
c. Tax recognised in other comprehensive income
d. Deferred tax offset Deferred tax liabilities amounting to $16,397,000 offset against deferred tax assets (2025: deferred tax assets amounting to $18,210,000 offset against deferred tax liabilities).
u
continued
64 Notes to the Consolidated Financial Statements
6. Income tax continued
2026 $’000
2025 $’000
Tax losses – Australian entities Tax losses – other entities
324,422 77,053
289,286 78,075
Subtotal
401,475
367,361
Total unrecognised deferred tax assets for tax losses
114,568
104,095
e. Unrecognised deferred tax assets for tax losses
f. Tax consolidation group Kingsgate Consolidated Limited and its wholly owned Australian subsidiary have implemented the tax consolidation legislation as of 1 July 2003. The accounting policy in relation to this legislation is set out in Note 2d. On adoption of the tax consolidation legislation, the entities in the tax-consolidation group entered into a tax sharing agreement which, in the opinion of the Directors, limits the joint and several liabilities of the wholly owned entities in the case of default by the head entity, Kingsgate Consolidated Limited. The entities have also entered into a tax funding agreement under which the wholly owned entities fully compensate Kingsgate for any current tax payable assumed and are compensated for any current tax receivable and deferred tax assets relating to the unused tax losses or unused tax credits that are transferred to Kingsgate under the tax legislation. The funding amounts are determined by reference to the amounts recognised in the wholly owned entities’ financial statements. The amount receivable/payable under the tax agreement are due upon receipt of the funding advice from the head entity, which is issued as soon as practicable after the end of each financial year. The head entity may also require payment of interim funding amounts to assist with its obligation to pay tax instalments. Assets
g. Recognised deferred tax assets and liabilities
Liabilities
Net
2026 $’000
2025 $’000
2026 $’000
2025 $’000
2026 $’000
2025 $’000
449 7,957 321
541 11,649 321
– (9,010) –
– (12,512) –
449 (1,053) 321
541 (863) 321
– – 161 9,631 516
– – 219 5,144 336
(7,353) (34) – – –
(8,976) (96) – – –
(7,353) (34) 161 9,631 516
(8,976) (96) 219 5,144 336
Total deferred tax assets/(liabilities) Set off tax
19,035 (16,397)
18,210 (18,210)
(16,397) 16,397
(21,584) 18,210
2,638 –
(3,374) –
Net deferred tax assets/(liabilities)
2,638
–
–
(3,374)
2,638
(3,374)
Deferred tax assets/(liabilities) Employee benefits Unrealised exchange losses/(gains) Financial assets Property, plant and equipment and exploration, evaluation and development Right-of-use assets Lease liabilities Restoration and rehabilitation provision Other items
Deferred tax assets/(liabilities) expected to be recovered within 12 months Deferred tax assets/(liabilities) expected to be recovered after more than 12 months
–
–
–
–
–
–
19,035
18,210
(16,397)
(21,584)
2,638
(3,374)
Total deferred tax assets/(liabilities)
19,035
18,210
(16,397)
(21,584)
2,638
(3,374)
www.kingsgate.com.au
65
h. Movement in deferred tax balances
2026
Balance at 1 July $’000
Initial recognition of temporary differences $’000
Recognised in profit or loss $’000
Balance at 30 June $’000
Deferred tax assets/(liabilities): Employee benefits Unrealised exchange losses Financial assets Property, plant and equipment and exploration, evaluation and development Right-of-use assets Lease liabilities Restoration and rehabilitation provision Other items
541 (863) 321
– – –
(92) (190) –
449 (1,053) 321
(8,976) (96) 219 5,144 336
– – – – –
1,623 62 (58) 4,487 180
(7,353) (34) 161 9,631 516
Net deferred tax assets
(3,374)
–
6,012
2,638
Notes to the Consolidated Financial Statements
Notes to the Consolidated Financial Statements
2025 Deferred tax assets/(liabilities): Employee benefits
544
–
(3)
541
Unrealised exchange losses Financial assets Property, plant and equipment Exploration, evaluation and development Right-of-use assets Lease liabilities Restoration and rehabilitation provision Other items
(863) 321 (189) (6,916) (402) 270 4,192 329
– – – – – – – –
– – (1,205) (666) 306 (51) 952 7
(863) 321 (1,394) (7,582) (96) 219 5,144 336
Net deferred tax liabilities
(2,714)
–
(660)
(3,374)
u
continued
66 Notes to the Consolidated Financial Statements
7. Cash and cash equivalents and restricted cash
2026 $’000
2025 $’000
Cash and cash equivalents Cash on hand Deposits at call
12 85,619
13 23,769
Total cash and cash equivalents
85,631
23,782
Restricted cash Current Non-current
21,143 4,904
10,137 4,860
Total restricted cash
26,047
14,997
Cash on hand These are petty cash balances primarily held by subsidiaries.
Deposits at call These deposits are at call and may be accessed daily.
Restricted cash Current restricted cash includes cash held on deposit with financial institutions that is restricted to use on community projects in Thailand and rehabilitation projects for Chatree Gold Mine. Non-current restricted cash primarily relates to cash held under an escrow account as required under the hire purchase agreement between Akara and Metro Machinery Co., Ltd as at 30 June 2026.
Risk exposure The Group’s exposure to interest risk and a sensitivity analysis for financial assets and liabilities are disclosed in Note 28.
8. Receivables
2026 $’000
2025 $’000
Trade receivables Other debtors
30,867 13,042
13,799 11,275
Total receivables – current
43,909
25,074
Current
Trade receivables Trade receivables represent gold and silver sales at the end of the financial year, where payment was yet to be received. No trade receivables were past due or impaired as at 30 June 2026.
Other debtors Other debtors primarily relate to Goods and Services Tax/Value Added Tax receivables.
Risk exposure The Group’s exposure to credit and currency risks are disclosed in Note 28.
www.kingsgate.com.au
67
9. Inventories
2026 $’000
2025 $’000
Consumables and stores Stockpiles and work in progress Gold bullion
27,288 30,205 13,255
21,041 11,132 8,200
Total inventories – current
70,748
40,373
Stockpiles
38,713
19,747
Total inventories – non-current
38,713
19,747
2026 $’000
2025 $’000
Prepayments Other deposits Other assets
10,092 285 –
4,664 302 154
Total other assets – current
10,377
5,120
Prepayments Other deposits
– 6,039
10,087 6,063
Total other assets – non-current
6,039
16,150
Current
Non-current
10. Other assets Current
Non-current
Notes to the Consolidated Financial Statements
Notes to the Consolidated Financial Statements
Non‑current prepayments as at 30 June 2025 comprised prepaid royalties and prepaid water rights relating to the Nueva Esperanza Silver-Gold Project in Chile. Following the acquisition of the royalty and water rights (refer Note 13), $6,327,000 of prepaid royalties were transferred to exploration and evaluation, and $2,528,000 of prepaid water rights were transferred to intangible assets.
u
continued
68 Notes to the Consolidated Financial Statements
11. Property, plant and equipment
2026 $’000
2025 $’000
Cost Accumulated depreciation and amortisation
164,846 (57,232)
139,754 (42,930)
Net book amount
107,614
96,824
Opening net book amount Additions Disposals Reclassification Depreciation and amortisation expense Foreign currency differences
107,614 12,160 (11) (92) (8,763) (7,790)
96,824 4,304 (359) – (7,754) 14,599
Closing net book amount
103,118
107,614
Cost Accumulated depreciation and amortisation
169,113 (65,995)
164,846 (57,232)
Net book amount
103,118
107,614
2026 $’000
2025 $’000
Right-of-use assets Plant and equipment Property
51,793 701
62,689 1,001
Total right-of-use assets
52,494
63,690
Finance lease liabilities Current Non-current
18,258 21,800
16,336 36,785
Total finance lease liabilities
40,058
53,121
At 1 July
Year ended 30 June
At 30 June
12. Right-of-use assets and finance lease liabilities This note provides information for leases where the Group is a lessee. The consolidated statement of financial position shows the following amounts relating to leases:
www.kingsgate.com.au
69 Notes to the Consolidated Financial Statements
2026 $’000
2025 $’000
Depreciation charge of right-of-use assets Plant and equipment Property
15,095 280
12,653 279
Total depreciation charge of right-of-use assets
15,375
12,932
Other item Interest expense
5,155
5,765
Total other item
5,155
5,765
Notes to the Consolidated Financial Statements
The consolidated statement of profit or loss and other comprehensive income shows the following amounts relating to leases:
The total cash outflow related to finance leases in the current period was $16,704,000 (2025: $13,323,000). The table below analyses the Group’s finance lease liabilities into relevant maturity groupings based on their contractual maturities.
Less than 1 year $’000
Between 1–2 years $’000
Between 2–5 years $’000
Over 5 years $’000
Total contractual cash flows $’000
Carrying amount $’000
At 30 June 2026
21,780
18,765
4,484
–
45,029
40,058
At 30 June 2025
21,258
20,923
20,286
–
62,467
53,121
Finance lease liabilities
u
continued
70 Notes to the Consolidated Financial Statements
13. Exploration, evaluation and development
Exploration & evaluation $’000
Feasibility expenditure $’000
Mine properties $’000
Total $’000
Cost Accumulated depreciation and amortisation Accumulated impairment
839 – –
88,532 – (63,091)
265,690 (104,340) –
355,061 (104,340) (63,091)
Net book amount
839
25,441
161,350
187,630
Opening net book amount Additions Depreciation and amortisation expense Foreign currency exchange differences
839 3,271 – 233
25,441 – – 464
161,350 34,393 (26,200) 24,572
187,630 37,664 (26,200) 25,269
Closing net book amount
4,343
25,905
194,115
224,363
Cost Accumulation depreciation and amortisation Accumulated impairment
4,343 – –
88,996 – (63,091)
341,226 (147,111) –
434,565 (147,111) (63,091)
Net book amount
4,343
25,905
194,115
224,363
Opening net book amount Acquisition of royalties Impairment reversal Rehabilitation provision revision Additions Disposal Reclassification Depreciation and amortisation expense Foreign currency exchange differences
4,343 – – – 274 – – – (322)
25,905 9,238 66,566 – 1,704 – 6,327 – (892)
194,115 – – 15,884 51,285 (123) 92 (32,729) (15,543)
224,363 9,238 66,566 15,884 53,263 (123) 6,419 (32,729) (16,757)
Closing net book amount
4,295
108,848
212,981
326,124
Cost Accumulation depreciation and amortisation Accumulated impairment
4,295 – –
116,297 – (7,449)
392,821 (179,840) –
513,413 (179,840) (7,449)
Net book amount
4,295
108,848
212,981
326,124
At 30 June 2024
Year ended 30 June 2025
At 30 June 2025
Year ended 30 June 2026
At 30 June 2026
Acquisition of royalties and water rights – Nueva Esperanza Project On 14 May 2026, Kingsgate acquired the pre-existing royalty and water rights over the Nueva Esperanza Silver-Gold Project in Chile from Inversiones Anglo American Norte SpA (ASX release “Acquisition of Royalty and Water Rights at Nueva Esperanza”). The acquisition extinguished pre-production royalty obligations and secured long-term water rights for the project. The transaction was treated as an asset acquisition. Total cash consideration of US$15.6 million was paid, comprising: 〉
US$8.1 million (A$11.2 million) for outstanding amounts accrued under the prior arrangements;
〉
US$6.7 million (A$9.2 million) to buy the royalty; and
〉
US$0.8 million (A$1.2 million) to buy the water rights.
www.kingsgate.com.au
71 Notes to the Consolidated Financial Statements
〉
US$1.75 million on a successful sale, IPO or joint venture of >25% of the project.
〉
US$1.25 million six months after commencement of commercial production.
〉
US$1.25 million upon achieving 6Moz of aggregate silver‑equivalent production.
〉
US$1.75 million upon achieving 12Moz of aggregate silver‑equivalent production.
14. Intangibles
2026 $’000
2025 $’000
Cost Accumulated depreciation and amortisation
1,087 (215)
742 (100)
Net book amount
872
642
Opening net book amount Acquisition of water rights Impairment reversal Additions Disposals Reclassification Depreciation and amortisation expense Foreign currency differences
872 1,202 2,072 – – 2,528 (105) (2)
642 – – 225 – – (96) 101
Closing net book amount
6,567
872
Cost Accumulated depreciation and amortisation
6,867 (300)
1,087 (215)
Net book amount
6,567
872
Notes to the Consolidated Financial Statements
A further series of milestone-based payments has not been recognised, as the triggering events remain uncertain and no present obligation exists:
At 1 July
Year ended 30 June
At 30 June
Water rights relate to the Nueva Esperanza Project. They give access to water for future mining operations and are recognised as intangible assets under AASB 138 because they are expected to be used mainly in the project’s development and production phases. The rights are recognised when controlled and expected to generate future economic benefits. Although legally indefinite, their economic life is limited to the life of mine. They are amortised on a straight-line basis over the life of mine, reviewed annually, and tested for impairment at each reporting date, with losses recognised when carrying amount exceeds recoverable amount.
u
continued
72 Notes to the Consolidated Financial Statements
15. Payables
2026 $’000
2025 $’000
Trade payables Other payables and accruals
18,022 35,705
11,806 37,888
Total payables – current
53,727
49,694
Other payables
4,883
5,321
Total payables – non-current
4,883
5,321
Current
Non-current
The Group’s exposure to currency and liquidity risk related to trade and other payables is disclosed in Note 28. Included in non-current other payables is a $4,352,000 (US$3,000,000) contingent consideration for the Nueva Esperanza Project which is due 24 months after the start of commercial operation.
16. Borrowings
2026 $’000
2025 $’000
Preference shares in controlled entitya Term facility Standby loan facilityb Insurance premium funding
11,588 – 3,827 1,939
– 10,469 – 1,939
Total borrowings – current
17,354
12,408
Preference shares in controlled entity Term facility Standby loan facilityb
– – 8,302
12,478 38,841 –
Total borrowings – non-current
8,302
51,319
Total borrowings1
25,656
63,727
Face value $’000
Carrying amount $’000
11,588
11,588
Current
Non-current
1
The Group has US$15 million (A$21,759,000) unused facilities as of 30 June 2026.
a. Preference shares in controlled entity Terms and conditions of outstanding preference shares in controlled entity were as follows:
Preference shares in controlled entity
Currency
Interest rate
Financial year of maturity
Thai baht
12%
n/a
During the year ended 30 June 2024 the terms of the Preference Shareholder Agreement, which is between the preference shareholder, Akara and Kingsgate Capital Pty Ltd relating to preference shares issued by Akara were amended. The amendment has extended the date whereby the preference shareholder may exercise a put option for the preference shares to be repaid at any time commencing from January 2026, by giving a six-month written notice of such intention resulting in the preference shares being repayable at the earliest in July 2026.
www.kingsgate.com.au
73 Notes to the Consolidated Financial Statements
On 5 January 2026, Kingsgate entered into a US$25,000,000 standby loan facility with Nebari Natural Resources Credit Fund II, LP, and other Nebariaffiliated entities (together, “Nebari”) (the “Facility”) to refinance Kingsgate’s existing Term facility. The Facility comprises Tranche 1 of US$10,000,000 and Tranche 2 of US$15,000,000. On 5 January 2026, Kingsgate received the Tranche 1 drawdown of US$10,000,000 (A$14,959,000), which was applied to the repayment of the existing Term facility. Tranche 2 remained undrawn as at 30 June 2026. The Facility was provided subject to security over interests and shares held in Kingsgate’s subsidiaries. Interest is calculated as the three-month Secured Overnight Financing Rate (“SOFR”) plus a margin of 6.00% p.a. on outstanding amounts. If the Term SOFR is less than 4.00% per annum, interest will be deemed to be 4.00%.
Notes to the Consolidated Financial Statements
b. Standby loan facility
An establishment fee of 1.00% on Tranche 1 and a commitment fee of 3.25% p.a. on the undrawn Tranche 2 were paid during the period. Straight-line amortisation applies to the Tranche 1 principal amount of US$10,000,000 commencing in June 2026 equal to 3.0% of the aggregate outstanding amount. The maturity date for Tranche 1 is 24 months from the closing date i.e. 4 January 2028.
Tranche 1
Currency
Interest rate
Financial year of maturity
USD
SOFR+6.00%1
2028
Total 1
Face value $’000
Carrying amount $’000
14,071
12,129
14,071
12,129
If the Term SOFR is less than 4.00% per annum, the rate will be deemed to be 4.00%.
The Tranche 1 principal amount is US$10,000,000 and a total of 1,851,585 unlisted warrants was issued to Nebari on 6 January 2026. Each warrant entitles the holder to subscribe for one ordinary share at an exercise price of $6.74 per share. The warrants were issued for no consideration and carry no dividend or voting rights. Fair value of 1,851,585 warrants issued The fair value at issue date of the warrants is determined using the Black-Scholes option pricing model which incorporates the following inputs: Term (years) Exercise price ($ per share) Underlying share price at the date of issue ($ per share) Exercised share price volatility over the terms of the warrants Risk free rate for the term of the warrants (based on government bond rate)
2.0 6.74 5.81 50% 4.08%
The assessed fair value of the 1,851,585 unlisted warrants issued was $1.35 per warrant resulting in an aggregate value of $2,497,301. The fair value of the warrant was recorded as a reduction in borrowings and an increase in other equity (refer Note 19). This valuation approach is considered to be level 3 fair value measurement (as defined by accounting standards) as it is derived from valuation techniques that include inputs that are not based on observable market data.
u
continued
74 Notes to the Consolidated Financial Statements
2026 $’000
2025 $’000
1,781 12,765 6,150
1,567 – 1,261
20,696
2,828
2,758 3,056 62,586
1,759 – 41,450
68,400
43,209
At the beginning of the financial year Additional provision charge to mine properties Charge/(credit) to profit and loss – unwinding of discount – additional provision recognised/(reversed) Amounts used during the year Foreign currency exchange differences
42,711 15,884
35,871 2,042
642 15,635 (1,619) (4,517)
987 – (1,638) 5,449
At the end of the financial year
68,736
42,711
17. Provisions
Note
Current
Employee benefits Legal provision Restoration and rehabilitation
2u, 24 2t
Total provisions – current
Non-current
Employee benefits Legal provision Restoration and rehabilitation
2u, 24 2t
Total provisions – non-current Movements in the restoration and rehabilitation provision: Restoration and rehabilitation
Legal provision – current The Group previously entered into a Settlement Agreement with its Political Risk Insurers in connection with the TAFTA arbitration. The Insurers’ entitlement under the Settlement Agreement is limited to recovery of their original financial contributions, together with interest. The contributions made by the Insurers consisted of a cash payment of US$55,000,000 and a further contribution totalling US$3,500,000 and $750,000 which represents the Group’s maximum exposure for this matter. Following the termination of the arbitration in December 2025 without any recovery, no amount became payable to the Insurers under the Settlement Agreement. The Insurers alleged that the Group breached the agreement by terminating the arbitration without their agreement. Subsequent to December half-year end, the Group continued commercial discussions with the Insurers, and a limited period without prejudice settlement offer which expired prior to 30 June 2026 was made to the Insurers. A provision of $12,765,000 has been recorded in respect of this matter. 2026 Shares
2025 Shares
2026 $’000
2025 $’000
Opening balance Shares issued via exercise of warrants, net of cost Shares issued via exercise of options, net of cost Share buy-back
256,561,572 6,986,589 2,500,000 –
257,751,692 – – (1,190,120)
724,948 17,299 6,652 –
727,307 – – (2,359)
Closing balance
266,048,161
256,561,572
748,899
724,948
18. Contributed equity
www.kingsgate.com.au
75
2026 Warrants
2025 Warrants
2026 $’000
2025 $’000
6,986,589 – (6,986,589) 1,851,585
– 6,986,589 – –
2,868 – (2,868) 2,497
– 2,868 – –
1,851,585
6,986,589
2,497
2,868
2026 $’000
2025 $’000
Foreign currency translation reserve Share-based payment reserve General reserve
55,194 12,900 (3,341)
92,495 10,811 (3,341)
Total reserves
64,753
99,965
At the beginning of the financial year Exchange differences on translation of foreign operations (net of tax)
92,495 (37,301)
50,837 41,658
At the end of the financial year
55,194
92,495
Share-based payment reserve At the beginning of the financial year Shares issued via exercise of options Share-based payment
10,811 (1,669) 3,758
10,811 – –
At the end of the financial year
12,900
10,811
General reserve At the beginning of the financial year
(3,341)
(3,341)
At the end of the financial year
(3,341)
(3,341)
19. Other equity Opening balance Warrants issued under term facility Shares issued via exercise of warrants under term facility Warrants issued under standby loan facility (Note 16b) Closing balance
20. Reserves and accumulated losses a. Reserves
Notes to the Consolidated Financial Statements
Notes to the Consolidated Financial Statements
Movements:
Foreign currency translation reserve
Foreign currency translation reserve Exchange differences arising on translation of the foreign operations are taken to the foreign currency translation reserve, as described in Note 2b.
Share-based payment reserve The share-based payment reserve is used to recognise the fair value of deferred rights, performance rights and options issued but not exercised. The share-based payment reserve also records the value of the equity instrument issued to the previous lender of the Group.
u
continued
76 Notes to the Consolidated Financial Statements
20. Reserves and accumulated losses continued General reserve The general reserve represents changes in equity as a result of changes in non-controlling interests and revaluation of employee benefit obligations recognised in other comprehensive income in prior periods. 2026 $’000
2025 $’000
At the beginning of the financial year Profit after income tax Dividend paid
(508,471) 277,912 (26,605)
(537,928) 29,457 –
Total accumulated losses
(257,164)
(508,471)
21. Commitments for expenditure
2026 $’000
2025 $’000
Property, plant and equipment Mine properties Right-of-use assets
2,779 – 4,994
419 125 –
Total
7,773
544
b. Accumulated losses
22. Dividends An interim dividend declared for the half-year ended 31 December 2025 of 10 cents per fully paid share was paid on 10 April 2026 (31 December 2024: nil). Since year end the Directors have recommended the payment of an unfranked final dividend of 10 cents per fully paid ordinary share (30 June 2025: nil). The proposed dividend totals $26,604,816.10 and is expected to be paid on 11 November 2026 out of retained earnings as at 30 June 2026. This amount has not been recognised as a liability at year end.
23. Related parties a. Controlling entity The ultimate parent entity of the Group is Kingsgate Consolidated Limited.
b. Subsidiaries Interests in subsidiaries are set out in the Consolidated Entity Disclosure Statement.
www.kingsgate.com.au
77 Notes to the Consolidated Financial Statements
The aggregate compensation provided to Key Management Personnel is set out below: 2026 $
2025 $
Short-term employee benefits Long-term employee benefits Post-employment benefits Share-based payments
2,708,927 4,559 46,622 3,083,897
1,781,090 3,638 336,492 –
Total Key Management Personnel compensation
5,844,005
2,121,220
Notes to the Consolidated Financial Statements
c. Key Management Personnel compensation
Detailed information on remuneration of Directors and Key Management Personnel is disclosed in the Remuneration Report.
d. Related party transactions Mrs Nucharee Sailasuta was a Non-Executive Director of Kingsgate up until her resignation on 15 October 2025. She is a director and preference shareholder of the Company’s Thai subsidiary, Akara Resources Public Company Limited. Details of the related party transactions during the year were as follows: 〉
LotusHall Mining Heavy Engineering Construction Company Limited (LotusHall), of which Mrs Nucharee Sailasuta is the Chairman and co-founder, provided mining related services to Chatree Gold Mine during the year ended 30 June 2026. A total of $7,072,000 was recorded for services received from LotusHall from 1 July 2025 to 15 October 2025; and
〉
preference shareholder interest of $438,000 was expensed from 1 July 2025 to 15 October 2025.
24. Employee benefits
2026 $’000
2025 $’000
Provision for employee benefits – current Provision for employee benefits – non-current
1,781 2,758
1,567 1,759
Total employee provisions
4,539
3,326
Employee benefits and related on-costs liabilities
Superannuation The Group makes contributions on behalf of employees to externally managed defined contribution superannuation funds. Contributions are based on percentages of employee wages and salaries and include any salary-sacrifice amounts. Contributions to defined contributions plans for 2026 were $730,000 (2025: $619,000).
u
continued
78 Notes to the Consolidated Financial Statements
25. Reconciliation of profit after income tax to net cash flow from operating activities
2026 $’000
2025 $’000
Profit for the year Depreciation and amortisation Net loss on sale of fixed assets Amortisation of deferred borrowing costs Net exchange differences Interest and finance charges Loss from derivative financial instrument Reversal of previously recorded derivative liabilities Share-based payment expenses Rehabilitation provision revision expenses Impairment reversal
277,912 56,972 169 653 (5,063) 14,726 – (1,198) 3,758 15,635 (68,638)
29,457 46,982 309 299 1,839 17,650 433 – – – –
Change in operating assets and liabilities: (Increase)/decrease in receivables (Increase)/decrease in prepayments (Increase)/decrease in other assets (Increase)/decrease in inventories Increase/(decrease) in creditors Increase/(decrease) in provisions Increase/(decrease) in deferred tax balances
(21,199) (5,339) 156 (56,347) 1,385 18,083 (6,012)
(13,385) (4,091) – (4,433) 12,265 (687) 660
Net cash inflow from operating activities
225,653
87,298
Cash and cash equivalents Borrowings – repayable within one year Borrowings – repayable after one year Finance liabilities – repayable within one year Finance liabilities – repayable after one year
85,631 (17,354) (8,302) (18,258) (21,800)
23,782 (12,408) (51,319) (16,336) (36,785)
Net cash and cash equivalents/(debt)
19,917
(93,066)
Cash and cash equivalents Gross debt – fixed interest rates Gross debt – variable interest rates Gross debt – nil interest rates
85,631 (53,585) (12,129)
23,782 (67,538) (49,310)
–
–
Net cash and cash equivalents/(debt)
19,917
(93,066)
Net cash and cash equivalents/(debt) reconciliation
www.kingsgate.com.au
79
Secured loan note
Term facility due within 1 year
Term facility due after 1 year
Standby loan facility due within 1 year
Standby loan facility due after 1 year
Insurance premium funding due within 1 year
Preference shares in controlled entity due within 1 year
Preference shares in controlled entity due after 1 year
Advances from preference shareholder due within 1 year
Lease liabilities due within 1 year
Lease liabilities due after 1 year
Total
$’000
$’000
$’000
$’000
$’000
$’000
$’000
$’000
$’000
$’000
$’000
$’000
$’000
Net cash and cash equivalents/(debt) as at 30 June 2024
3,890 (16,733)
–
–
–
–
(703)
–
(10,836)
(12,250)
(4,566)
(14,317)
(55,515)
Cash flows
(10,202) (35,897)
–
–
(1,236)
–
–
13,213
5,851
13,175
21,439
19,383
17,152
Foreign exchange adjustments
509
(40)
(353)
(1,283)
–
–
–
–
(1,642)
(619)
–
–
(3,428)
Other non-cash movements
–
(379)
86
(1,661)
–
–
–
–
–
(344)
(17,621)
(35,643)
(55,562)
Net cash and cash equivalents/(debt) as at 30 June 2025
23,782
–
(10,469) (38,841)
–
–
(1,939)
–
(12,478)
–
(16,336)
(36,785)
(93,066)
Cash flows
63,156
–
51,068
–
(5,211)
(9,062)
–
–
–
–
16,704
–
116,655
Foreign exchange adjustments
(1,307)
–
(1,758)
–
225
144
–
890
–
–
–
–
(1,806)
Other non-cash movements
–
–
(38,841) 38,841
1,159
616
–
(12,478)
12,478
–
(18,626)
14,985
(1,866)
85,631
–
(8,302) (1,939) (11,588)
–
–
(18,258) (21,800)
19,917
Net cash and cash equivalents/(debt) as at 30 June 2026
–
–
(3,827)
Notes to the Consolidated Financial Statements
Cash
Notes to the Consolidated Financial Statements
26. Subsequent events At the date of this report, there is no matter or circumstance that has arisen since the end of the financial period, that has significantly affected, or may significantly affect, the operations of the Group, the results of those operations, or the state of affairs of the Group in subsequent financial periods.
27. Contingent assets and liabilities The Group had no contingent assets or liabilities at 30 June 2026 that are required to be reported, aside from the legal matter provided for in Note 17 Provisions. At the time of preparing this financial report some companies included in the Group are parties to pending legal proceedings. The Directors have determined that the possibility of any outflow in settlement resulting from these proceedings is remote.
u
continued
80 Notes to the Consolidated Financial Statements
28. Financial risk management and instruments The Group’s activities expose it to a variety of financial risks: market risk (including foreign currency risk, price risk, fair value risk and interest rate risk), credit risk and liquidity risk. At this point, the Directors believe that it is in the interests of shareholders to expose the Group to foreign currency risk, price risk, and interest rate risk. Therefore, the Group does not employ any derivative hedging of foreign currency or interest rate risks. The Directors and management monitor these risks, in particular market forecasts of future movements in foreign currency and price movements and, if it is to be believed to be in the best interests of shareholders, will implement risk management strategies to minimise potential adverse effects on the financial performance of the Group. The Board provides written principles for overall risk management, as well as policies covering specific areas, such as foreign exchange risk, credit risk, use of derivative financial instruments and non-derivative financial instruments, and investment of excess liquidity. Risk management is carried out by the senior executive team. 2026 $’000
2025 $’000
Cash and cash equivalents Restricted cash Receivables Other deposits
85,631 26,047 43,909 6,324
23,782 14,997 25,074 6,365
Total financial assets
161,911
70,218
Payables Borrowings Lease liabilities Derivative financial instrument
(58,610) (25,656) (40,058) –
(55,015) (63,727) (53,121) (1,198)
Total financial liabilities
(124,324)
(173,061)
Financial assets
Financial liabilities
www.kingsgate.com.au
81 Notes to the Consolidated Financial Statements
Foreign exchange risk The Group operates internationally and is exposed to foreign exchange risk arising from currency exposures, primarily with respect to the US dollar and Thai baht and, as discussed earlier, no financial instruments are employed to mitigate the exposed risks. This is the Group’s current policy and it is reviewed regularly including forecast movements in these currencies by management and the Board. Foreign exchange risk arises from future commercial transactions and recognised assets and liabilities denominated in a currency that is not the functional currency of the relevant group entity. Currently foreign exchange risks arise primarily from: 〉
cash balances in US dollars;
〉
receivables denominated in US dollars for Australian entities; and
〉
payables denominated in Australian dollars for Thailand entities.
Notes to the Consolidated Financial Statements
Market risk
The functional currency of the Thai subsidiaries is Thai baht. The functional currency of the Chilean subsidiaries is the US dollar. The Company’s functional currency is the Australian dollar. The Group’s exposure to US dollar and Thai baht foreign currency risk arises mainly from balances receivable and payable between Group companies which are not considered to form part of the related investment balance in the entities. The unrealised foreign exchange gain/loss on these balances is therefore recorded in the statement of profit or loss of the Group. At the reporting date, expressed in Australian dollars these balances were as follows: USD denominated 2026 $’000
THB denominated 2026 $’000
Total 2026 $’000
USD denominated 2025 $’000
THB denominated 2025 $’000
Total 2025 $’000
Cash and cash equivalents Receivables Payables Borrowings
679 – (703) (12,129)
– 169,234 (169,234) –
679 169,234 (169,937) (12,129)
1,464 – (2,459) (49,310)
– 80,234 (80,234) –
1,464 80,234 (82,693) (49,310)
Total exposure to foreign currency risk
(12,153)
–
(12,153)
(50,305)
–
(50,305)
Impact on post tax profit and loss
One per cent weakened in Australian dollar against the US dollar One per cent strengthened in Australian dollar against the US dollar One per cent weakened in Australian dollar against the Thai baht One per cent strengthened in Australian dollar against the Thai baht
Impact on other comprehensive income
2026 $’000
2025 $’000
2026 $’000
2025 $’000
567 (555) 1,715 (1,715)
636 (623) 1,549 (1,534)
567 (555) 1,920 (1,916)
636 (623) 1,769 (1,750)
u
continued
82 Notes to the Consolidated Financial Statements
28. Financial risk management and instruments continued Interest rate risk The Group’s exposure to interest rate risk for classes of financial assets and financial liabilities, at 30 June 2026 and 30 June 2025 are set out as follows: Fixed interest rate maturing in Floating interest rate $’000
1 year or less $’000
1–2 years $’000
2–5 years $’000
More than 5 years $’000
Non-interest bearing $’000
Cash and cash equivalents Restricted cash Receivables Other deposits
81,578 26,047 – 5,962
– – – –
– – – –
– – – –
– – – –
4,053 – 43,909 362
85,631 26,047 43,909 6,324
Total financial assets
113,587
–
–
–
–
48,324
161,911
Payables Borrowings Lease liabilities
– (12,129) –
(347) (13,527) (18,258)
– – (17,371)
– – (4,429)
– – –
(58,263) – –
(58,610) (25,656) (40,058)
Total financial liabilities
(12,129)
(32,132)
(17,371)
(4,429)
–
(58,263)
(124,324)
Net financial assets/(liabilities)
101,458
(32,132)
(17,371)
(4,429)
–
(9,939)
37,587
Cash and cash equivalents Restricted cash Receivables Other deposits
3,578 14,997 – 6,007
– – – –
– – – –
– – – –
– – – –
20,204 – 25,074 358
23,782 14,997 25,074 6,365
Total financial assets
24,582
–
–
–
–
45,636
70,218
Payables Borrowings Lease liabilities Derivative financial instrument
– (49,310) – –
(3,471) (1,939) (16,336) –
– (12,478) (17,797) –
– – (18,988) –
– – – –
(51,544) – – (1,198)
(55,015) (63,727) (53,121) (1,198)
Total financial liabilities
(49,310)
(21,746)
(30,275)
(18,988)
–
(52,742)
(173,061)
Net financial assets/(liabilities)
(24,728)
(21,746)
(30,275)
(18,988)
–
(7,106)
(102,843)
Total $’000
2026
Financial assets
Financial liabilities
2025
Financial assets
Financial liabilities
www.kingsgate.com.au
83 Notes to the Consolidated Financial Statements
Credit risk arises from cash and cash equivalents, deposits with banks and financial institutions, as well as credit exposures to customers including, outstanding receivables and committed transactions. The Group has no significant concentrations of credit risk. The maximum exposure to credit risk is represented by the carrying value of the Group’s financial assets in the statement of financial position. The maximum exposure to credit risk at reporting date was: 2026 $’000
2025 $’000
Cash and cash equivalents Restricted cash Receivables Other deposits
85,631 26,047 43,909 6,324
23,782 14,997 25,074 6,365
Total exposure to credit risk at year end
161,911
70,218
Notes to the Consolidated Financial Statements
Credit risk
Liquidity risk The Group’s liquidity requirements are based upon cash flow forecasts. Liquidity management, including debt/equity management, is carried out under policies approved by the Board and forecast material liquidity changes are discussed at Board meetings. The following table analyses the Company’s financial assets and liabilities into relevant maturity groupings based on the remaining period at the reporting date. The amounts disclosed are the contractual undiscounted cash flows. The borrowings of the Group are repayable on demand, however the contractual amounts for borrowings also include the interests that are expected to be repaid until the repayment of these debts based on the cash flow forecast prepared by the Group. Carrying amount
1 year or less
1–2 years
2–5 years
More than 5 years
Total
$’000
$’000
$’000
$’000
$’000
$’000
Payables Borrowings Lease liabilities
58,610 25,656 40,058
53,727 21,713 21,780
106 9,242 18,765
4,7771 – 4,484
– – –
58,610 30,955 45,029
Total financial liabilities
124,324
97,220
28,113
9,261
–
134,594
Payables Borrowings Lease liabilities Derivative financial instrument
55,015 63,727 53,121 1,198
49,694 21,331 21,258 –
169 48,609 20,923 1,198
4,9231 7,044 20,286 –
229 – – –
55,015 76,984 62,467 1,198
Total financial liabilities
173,061
92,283
70,899
32,253
229
195,664
2026
2025
1
Primarily related to the contingent consideration for the Nueva Esperanza Silver-Gold Project in Chile (refer Note 15).
u
continued
84 Notes to the Consolidated Financial Statements
2026 $
2025 $
PwC Australia Other PwC network firms Other firms
445,500 289,730 29,030
431,250 309,250 –
Total audit and review services
764,260
740,500
PwC Australia Other PwC network firms
17,920 56,320
– –
Total other assurance services
74,240
–
PwC Australia Other PwC network firms
49,600 54,360
47,300 35,000
Total other services
103,960
82,300
30. Earnings per share
2026 Cents
2025 Cents
Basic earnings per share Diluted earnings per share
106.2 106.2
11.4 11.0
$’000
$’000
277,912
29,457
Number
Number
Weighted average number of ordinary shares used as the denominator: basic Adjustment for dilutive effect
261,600,762 –
257,631,359 9,180,328
Weighted average number of ordinary shares used as the denominator: diluted
261,600,762
266,811,687
29. Auditors’ remuneration Audit and review services
Other assurance services
Other services
Net profit used to calculate basic and diluted earnings per share
www.kingsgate.com.au
85 Notes to the Consolidated Financial Statements
As at, and throughout the financial year ending 30 June 2026, the parent entity of the Group was Kingsgate Consolidated Limited. 2026 $’000
2025 $’000
Profit/(losses) for the year
95,681
(37,108)
Total comprehensive income/(losses)
95,681
(37,108)
72,302 184,841 21,706 211,545
5,610 24,636 146,085 146,085
Issued capital Other equity Reserves Accumulated losses
748,899 2,497 12,521 (790,621)
724,948 2,868 10,432 (859,697)
Total equity
(26,704)
(121,449)
Summary of financial information Results of parent entity
Financial position of parent entity at year end
Current assets Total assets Current liabilities Total liabilities
Total equity of the parent entity comprising:
Notes to the Consolidated Financial Statements
31. Parent entity financial information
Contingent liabilities of the parent entity There are cross guarantees given by Kingsgate Consolidated Limited, Dominion Mining Limited and Gawler Gold Mining Pty Ltd as described in Note 32. No liability was recognised by the parent entity or the Group in relation to this guarantee, as the fair value of the guarantees is immaterial. As at 30 June 2026, the parent entity had no contractual commitments for the acquisition of property, plant or equipment.
32. Deed of cross guarantee Pursuant to ASIC Corporations (wholly owned Companies) Instrument 2016/785, the wholly owned subsidiaries listed below are relieved from the Corporations Act 2001 requirements for preparation, audit and lodgement of financial reports, and the Directors’ Reports. It is a condition of the Class of Order that the Company and each of the subsidiaries enter into a Deed of Cross Guarantee (“Deed”). The effect of the Deed is that the Company guarantees to each creditor payment in full of any debt in the event of the winding up of any of the subsidiaries under certain provisions of the Corporations Act 2001. If a winding up occurs under other provisions of the Corporations Act 2001, the Company will only be liable in the event that after six months any creditor has not been paid in full. The subsidiaries have also given similar guarantees in the event that the Company is wound up. The subsidiaries subject to the Deed are: 〉
Dominion Mining Limited; and
〉
Gawler Gold Mining Pty Ltd.
The above companies represent a ‘closed group’ for the purpose of the Class Order, and as there are no other parties to the Deed of Cross Guarantee that are controlled by Kingsgate Consolidated Limited, they also represent the ‘extended closed group’.
u
continued
86 Notes to the Consolidated Financial Statements
32. Deed of cross guarantee continued A consolidated statement of profit or loss and other comprehensive income, a summary of movements in consolidated accumulated losses, and consolidated statement of financial position, comprising the Company and controlled entities which are a party to the Deed, after eliminating all transactions between parties to the Deed of Cross Guarantee, is set out as follows: 2026 $’000
2025 $’000
Corporate and administration expenses Other income and expenses Foreign exchange (losses)/gain Intercompany dividend Impairment reversal/(losses) – Nueva Esperanza Project Loss from derivative financial instrument Intercompany loan write-off
(31,053) 12,501 (10,672) 25,000 68,638 – 38,966
(9,268) 13,229 10,098 – (3,840) (433) (37,502)
Profit/(loss) before financial costs and income tax
103,380
(27,716)
Finance income Finance costs
463 (8,165)
80 (9,473)
Net finance costs
(7,702)
(9,393)
Profit/(loss) before income tax Income tax expense
95,678 –
(37,109) –
Profit/(loss) after income tax
95,678
(37,109)
Total comprehensive income/(losses) for the year
95,678
(37,109)
Profit/(loss) attributable to: Owners of Kingsgate Consolidated Limited
95,678
(37,109)
Total comprehensive income/(losses) attributable to: Owners of Kingsgate Consolidated Limited
95,678
(37,109)
Summary of movements in consolidated retained earnings Accumulated losses At the beginning of the financial year Profit/(loss) for the year Dividend paid
(859,698) 95,678 (26,605)
(822,589) (37,109) –
At the end of the financial year
(790,625)
(859,698)
Statement of profit or loss and other comprehensive income
www.kingsgate.com.au
87
2026 $’000
2025 $’000
Current assets Cash and cash equivalents Receivables Other assets
71,373 264 667
5,203 100 310
Total current assets
72,304
5,613
Restricted cash Property, plant and equipment Investment in subsidiaries Intercompany receivables Right-of-use assets
476 27 30,619 80,960 458
140 33 18,192 – 661
Total non-current assets
112,540
19,026
TOTAL ASSETS
184,844
24,639
Current liabilities Payables Intercompany payables Provisions Borrowings Lease liabilities
2,362 181,143 13,423 5,766 161
1,557 90,716 623 12,408 161
Total current liabilities
202,855
105,465
Non-current liabilities Borrowings Lease liabilities Derivative financial instrument Provisions
8,302 375 – 20
38,841 570 1,198 15
Total non-current liabilities
8,697
40,624
TOTAL LIABILITIES
211,552
146,089
NET LIABILITIES
(26,708)
(121,450)
Contributed equity Other equity Reserves Accumulated losses
748,899 2,497 12,521 (790,625)
724,948 2,868 10,432 (859,698)
TOTAL EQUITY
(26,708)
(121,450)
Statement of financial position ASSETS
Notes to the Consolidated Financial Statements
Notes to the Consolidated Financial Statements
Non-current assets
LIABILITIES
EQUITY
u
continued
88 Directors’ Declaration
Directors’ Declaration In the Directors’ opinion: a)
the financial statements and notes that are set out on pages 48 to 87 and the Remuneration Report in the Directors’ Report, are in accordance with the Corporations Act 2001, including: (i)
giving a true and fair view of the Group’s financial position as at 30 June 2026 and of its performance for the financial year ended on that date; and
(ii)
complying with Australian Accounting Standards, the Corporations Regulations 2001 and other mandatory professional reporting requirements.
b)
the Consolidated Entity Disclosure Statement as at 30 June 2026 set out on page 52 is true and correct;
c)
there are reasonable grounds to believe that the Company will be able to pay its debts as and when they become due and payable; and
d)
at the date of this declaration, there are reasonable grounds to believe that the members of the extended closed group identified in Note 32 will be able to meet any obligations or liabilities to which they are, or may become, subject by virtue of the Deed of Cross Guarantee described in Note 32.
Note 1 confirms that the financial statements also comply with the International Financial Reporting Standards as issued by the International Accounting Standards Board. The Directors have been given the declarations required by section 295A of the Corporations Act 2001 from the Chief Executive Officer and Chief Financial Officer for the financial year ended 30 June 2026. This declaration is made in accordance with a resolution of the Directors.
Ross Smyth-Kirk OAM Director
Dated at Sydney on 31 August 2026 On behalf of the Board
www.kingsgate.com.au
89
Independent auditor’s report Independent auditor’s report
To the members of Kingsgate Consolidated Limited To the members of Kingsgate Consolidated Limited
Report on the audit of the financial report Report on the audit of the financial report Our opinion Our opinion
In our opinion, the accompanying financial report of Kingsgate Consolidated Limited (the Company) and its controlled entities (together thefinancial Group) isreport in accordance withConsolidated the Corporations Act(the 2001, including: In our opinion, the accompanying of Kingsgate Limited Company) and its controlled entities (together the Group) is in accordance with the Corporations Act 2001, including: a) giving a true and fair view of the Group’s financial position as at 30 June 2026 and of its financial performance for the ended; andfinancial position as at 30 June 2026 and of its financial a) giving a true and fairyear viewthen of the Group’s forAustralian the year then ended; and b) performance complying with Accounting Standards and the Corporations Regulations 2001. b) complying with Australian Accounting Standards and the Corporations Regulations 2001. What we have audited What we have audited The financial report comprises: The financial report comprises: • the consolidated statement of financial position as at 30 June 2026; • the consolidated statement of financial position as at 30 June 2026; income for the year then ended; profit or loss and other comprehensive • the consolidated statement of changes profit or in loss and other income for the year then ended; equity for thecomprehensive year then ended; • the consolidated statement of cash changes in for equity year then ended; flows the for yearthe then ended; • the notes consolidated statement offinancial cash flows for the year then ended; to the consolidated statements, including material accounting policy information otherto explanatory information; • and the notes the consolidated financial statements, including material accounting policy information andconsolidated other explanatory • the entityinformation; disclosure statement as at 30 June 2026; and • the directors’ consolidated entity disclosure statement as at 30 June 2026; and declaration. • the directors’ declaration.
pwc.com.au
PricewaterhouseCoopers, ABN 52 780 433 757 One International Towers Sydney, Watermans Quay, Barangaroo NSW 2000, PricewaterhouseCoopers, ABN2001 52 780 433 757 GPO BOX 2650 Sydney NSW One International Towers Quay, Barangaroo NSW 2000, T: +61 2 8266 0000, F: +61Sydney, 2 8266Watermans 9999, www.pwc.com.au GPO BOX 2650 Sydney NSW 2001 Liability by a scheme underwww.pwc.com.au Professional Standards Legislation. T: +61 2limited 8266 0000, F: +61approved 2 8266 9999,
pwc.com.au
Liability limited by a scheme approved under Professional Standards Legislation.
Independent Auditor’s Report
Independent Auditor’s Report
90 Independent Auditor’s Report
Basis for opinion We conducted our audit in accordance with Australian Auditing Standards. Our responsibilities under those standards are further described in the Auditor’s responsibilities for the audit of the financial report section of our report. We believe that the audit evidence we have obtained is sufficient and appropriate to provide a basis for our opinion. Independence We are independent of the Group in accordance with the auditor independence requirements of the Corporations Act 2001 and the ethical requirements of the Accounting Professional & Ethical Standards Board’s APES 110 Code of Ethics for Professional Accountants (including Independence Standards) (the Code) that are relevant to audits of the financial report of public interest entities in Australia. We have also fulfilled our other ethical responsibilities in accordance with the Code.
Our audit approach An audit is designed to provide reasonable assurance about whether the financial report is free from material misstatement. Misstatements may arise due to fraud or error. They are considered material if individually or in aggregate, they could reasonably be expected to influence the economic decisions of users taken on the basis of the financial report. We tailored the scope of our audit to ensure that we performed enough work to be able to give an opinion on the financial report as a whole, taking into account the geographic and management structure of the Group, its accounting processes and controls and the industry in which it operates. Audit Scope Our audit focused on where the Group made subjective judgements; for example, significant accounting estimates involving assumptions and inherently uncertain future events. In establishing the overall approach to the group audit, we determined the type of work that needed to be performed by us, as the group auditor, or component auditors from other PwC network firms operating under our instruction. Where the work was performed by component auditors, we determined the level of involvement we needed to have in the audit work at those components to be able to conclude whether sufficient appropriate audit evidence had been obtained as a basis for our opinion on the Group financial report as a whole.
www.kingsgate.com.au
91 Independent Auditor’s Report
Independent Auditor's Report
Key audit matters Key audit matters are those matters that, in our professional judgement, were of most significance in our audit of the financial report for the current period. The key audit matters were addressed in the context of our audit of the financial report as a whole, and in forming our opinion thereon, and we do not provide a separate opinion on these matters. Further, any commentary on the outcomes of a particular audit procedure is made in that context. We communicated the key audit matters to the Audit Committee. Key audit matter
How our audit addressed the key audit matter
Reversal of impairment - Nueva Esperanza Project (Refer to Note 2(f) Impairment of assets, Note 3(b) Reversal of impairment - Nueva Esperanza Project, Note 13 Exploration, evaluation and development and Note 14 Intangibles)
Our audit procedures, included but were not limited to the following:
During the year, the Group acquired royalty and water rights from a third party, which has enhanced the value of the Nueva Esperanza Project. Additionally, there has been a material increase in gold and silver prices since the time of the impairments which were recorded in 2018 and 2019. The conditions that warranted the previous impairments are no longer present. Management has assessed these developments as indicators for the reversal of previously impaired exploration assets. Following an evaluation based on fair value less costs of disposal, a full impairment reversal amounting to $68,638,000 has been recognised in relation to the Nueva Esperanza Project.
•
Evaluated the Group’s assessment of impairment reversal indicators by inspecting the royalty and water right acquisition contract and gold and silver prices;
•
Consulted with the PwC technical accounting group to confirm that the technical accounting requirements for reversal of impairment had been met;
•
Engaged internal valuation experts to perform the following procedures: o Assessed the reasonableness of the valuation methodology. o Assessed the appropriateness of the valuation multiples and discount required to support the impairment reversal. o Assessed the reasonableness of the AgEq value based on the underlying resource estimates. o Assessed the appropriateness of the cost of disposal assumption.
•
Assessed management's assessment of the eligibility and condition of the exploration assets subject to impairment reversal; and
•
Assessed the reasonableness of the Group’s disclosures against the requirements of Australian Accounting Standards, including disclosures to significant estimates and judgements.
The reversal of the impairment associated with the Nueva Esperanza Project has been identified as a key audit matter. This classification arises from the significant impact of the reversal on the consolidated statement of profit or loss and other comprehensive income, the magnitude of the Nueva Esperanza asset in the consolidated statement of financial position, and the considerable judgements involved in estimating the recoverable amount.
Restoration and rehabilitation provision (Refer to Note 2(t) Restoration and rehabilitation provision and Note 17 Provisions)
Our audit procedures, included but were not limited to the following:
u
continued
92 Independent Auditor’s Report
The Group recognises provisions for restoration and rehabilitation obligations.
•
Developed an understanding of, and evaluated the design and implementation of the key controls associated with the recognition and measurement of the restoration and rehabilitation provision;
•
Evaluated the Group’s rehabilitation and restoration cost forecasts;
•
Checked the mathematical accuracy of the underlying calculations;
•
Assessed the reasonableness of the Group's key assumptions and key data used in the closure plan and associated cost estimates;
•
Evaluated the expected timing of restoration and rehabilitation activities against the life of mine plan;
•
Benchmarked key market related assumptions including inflation and discount rates against external market data; and
•
Assessed the reasonableness of the Group’s disclosures against the requirements of Australian Accounting Standards, including disclosures to significant estimates and judgements.
The calculation of these provisions requires judgement by the Group in estimating: •
the magnitude of possible works required for the removal of the infrastructure and rehabilitation works;
•
the future cost of performing the works;
•
when rehabilitation activities will take place; and
•
the economic assumptions such as inflation and discount rates relevant to such liabilities.
This is a key audit matter given the judgement required by the Group to estimate costs where there has been limited restoration and rehabilitation activity against which to benchmark estimates of future costs.
Other information The directors are responsible for the other information. The other information comprises the information included in the annual report for the year ended 30 June 2026, but does not include the financial report and our auditor’s report thereon. Prior to the date of this auditor’s report, the other information we obtained included the Corporate Information and Directors' Report (including Remuneration Report). We expect the remaining other information to be made available to us after the date of this auditor’s report. Our opinion on the financial report does not cover the other information and we do not and will not express an opinion or any form of assurance conclusion thereon through our opinion on the financial report. We have issued a separate opinion on the remuneration report. In connection with our audit of the financial report, our responsibility is to read the other information and, in doing so, consider whether the other information is materially inconsistent with the financial report or our knowledge obtained in the audit, or otherwise appears to be materially misstated.
www.kingsgate.com.au
93 Independent Auditor’s Report
Independent Auditor's Report
If, based on the work we have performed on the other information that we obtained prior to the date of this auditor’s report, we conclude that there is a material misstatement of this other information, we are required to report that fact. We have nothing to report in this regard. When we read the other information not yet received, if we conclude that there is a material misstatement therein, we are required to communicate the matter to the directors and use our professional judgement to determine the appropriate action to take.
Responsibilities of the directors for the financial report The directors of the Company are responsible for the preparation of the financial report in accordance with Australian Accounting Standards and the Corporations Act 2001, including giving a true and fair view, and for such internal control as the directors determine is necessary to enable the preparation of the financial report that is free from material misstatement, whether due to fraud or error. In preparing the financial report, the directors are responsible for assessing the ability of the Group to continue as a going concern, disclosing, as applicable, matters related to going concern and using the going concern basis of accounting unless the directors either intend to liquidate the Group or to cease operations, or have no realistic alternative but to do so.
Auditor’s responsibilities for the audit of the financial report Our objectives are to obtain reasonable assurance about whether the financial report as a whole is free from material misstatement, whether due to fraud or error, and to issue an auditor’s report that includes our opinion. Reasonable assurance is a high level of assurance, but is not a guarantee that an audit conducted in accordance with the Australian Auditing Standards will always detect a material misstatement when it exists. Misstatements can arise from fraud or error and are considered material if, individually or in the aggregate, they could reasonably be expected to influence the economic decisions of users taken on the basis of the financial report. A further description of our responsibilities for the audit of the financial report is located at the Auditing and Assurance Standards Board website at: https://auasb.gov.au/media/bwvjcgre/ar1_2024.pdf. This description forms part of our auditor’s report.
u
continued
94 Independent Auditor’s Report
Report on the remuneration report Our opinion on the remuneration report We have audited the remuneration report included in the directors’ report for the year ended 30 June 2026. In our opinion, the remuneration report of Kingsgate Consolidated Limited for the year ended 30 June 2026 complies with section 300A of the Corporations Act 2001.
Responsibilities The directors of the Company are responsible for the preparation and presentation of the remuneration report in accordance with section 300A of the Corporations Act 2001. Our responsibility is to express an opinion on the remuneration report, based on our audit conducted in accordance with Australian Auditing Standards.
PricewaterhouseCoopers
Craig Thomason Partner
www.kingsgate.com.au
Sydney 31 August 2026
95 Shareholder Information
Shareholder Information
Shareholder Information as at 15 September 2026
Substantial shareholders Name
Date of Release
Effective
Number of Ordinary Shares
%
State Street Corporation Vanguard Group
13 Aug 2026 26 Mar 2026
11 Aug 2026 20 Mar 2026
14,526,853 15,071,732
5.46 5.64
Number of security holders and securities on issue The Company has issued the following securities: a) 266,409,004 fully paid ordinary share held by 8,364 shareholders b) 1,851,585 unlisted warrants held by 2 holders c) 163,791 FY2025 Performance Rights held by 3 holders and 584,291 FY2026 Performance Rights held by 11 holders
Voting rights a) Ordinary shares On a show of hands every member present at a meeting in person or by proxy shall have one vote and upon a poll each share shall have one vote.
b) Warrants No voting rights
c) Performance Rights No voting rights
Distribution of security holders Fully paid ordinary shares Size of Holding
Holders
Shares
% of shares held
1 – 1,000 1,001 – 5,000 5,001 – 10,000 10,001 – 100,000 100,001 +
4,200 2,341 677 951 195
1,605,943 5,864,872 5,130,746 29,207,807 224,599,636
0.60 2.20 1.93 10.96 84.31
Total
8,364
266,409,004
100.00
u
continued
96 Shareholder Information
Unmarketable parcel of shares The number of shareholders holding less than a marketable parcel of the Company’s ordinary shares (less than $500 in value) is 846 based on the Company’s closing share price of $5.12 on 15 September 2026.
Unlisted warrants The number of warrants on issue:
Name
Unlisted warrants
Exercise price per security
Expiry date
Number of securities
Name of holder
$6.74
04 Jan 2028
1,776,585
Nebari Natural Resources AIV II, LP
75,000
Nebari Gold Fund 1, LP
20 largest shareholders of quoted ordinary shares Shareholder
1 2 3 4 5 6 7 8 9 10 11 12 13 14 15 16 17 18 19 20 20
HSBC CUSTODY NOMINEES (AUSTRALIA) LIMITED CITICORP NOMINEES PTY LIMITED J P MORGAN NOMINEES AUSTRALIA PTY LIMITED BNP PARABIS NOMS PTY LTD BNP PARIBAS NOMINEES PTY LTD <IB AU NOMS RETAIL CLIENT> BNP PARABIS NOMINEES PTY LTD <CLEARSTREAM> BNP PARIBAS NOMINEES PTY LTD <AGENCY LENDING A/C> ARINYA INVESTMENTS PTY LTD MR ANDREW LENOX HEWITT WYONG RUGBY LEAGUE CLUB LTD MR IAN GILLESPIE-JONES <PENSION FUNDS A/C> CLAWSON HOLDINGS PTY LTD <NO 4 A/C> MR JAY EVAN DALE HUGHES <INKESE FAMILY A/C> LEAVER TRADING PTY LTD MR PHILIP STORR ARINYA INVESTMENTS PTY LTD <SUPER FUND A/C> UBS NOMINEES PTY LTD G RITCHIE SF PTY LTD <RITCHIE FAMILY SF A/C> TWISTED CORPORATION PTY LTD FRANK MARKERT PTY LTD YANDAL INVESTMENTS PTY LTD Total Top 20
(21 Investors)
Other Total ordinary shares on issue
(8,343 Investors) (8,364 Investors)
www.kingsgate.com.au
Number of shares
%
57,605,492 31,556,680 29,538,784 18,657,250 6,952,668 6,693,279 3,270,831 2,902,472 2,523,711 2,330,000 2,180,009 2,150,000 2,000,000 1,700,000 1,653,500 1,425,000 1,341,324 1,289,000 1,227,131 1,000,000 1,000,000
21.62 11.85 11.09 7.00 2.61 2.51 1.23 1.09 0.95 0.87 0.82 0.81 0.75 0.64 0.62 0.53 0.50 0.48 0.46 0.38 0.38
178,997,131
67.19
87,411,873 266,409,004
32.81 100.00
97 Corporate Information
Corporate Information
Corporate Information Kingsgate Consolidated Limited ABN 42 000 837 472
Directors Ross Smyth-Kirk OAM Executive Chairman Jamie Gibson Managing Director and Chief Executive Officer Greg Orrell
Non-Executive Director
Kerry Stevenson
Non-Executive Director
Peter Warren
Non-Executive Director
Company Secretary Jade Cook
Stock Exchange Listing Kingsgate Consolidated Limited is a company limited by shares, listed on the Australian Securities Exchange (ASX) under the code KCN.
Registered Office and Principal Business Kingsgate Consolidated Limited Suite 12.02 – Level 12 60 Castlereagh Street Sydney NSW 2000 Australia Tel: +61 2 8256 4800 Email: info@kingsgate.com.au Web: www.kingsgate.com.au
Bangkok Office
Akara Resources Public Company Limited 188 Spring Tower, Unit 6, Level 14 Phaya Thai Road Thung Phaya Thai, Ratchathewi Bangkok 10400 Thailand
Tel: +66 5661 4500 Email: admincgm@akararesources.com Web: www.akararesources.com
Chatree Gold Mine
Share Registry
MUFG Corporate Markets (AU) Limited Liberty Place, Level 41 161 Castlereagh Street Sydney NSW 2000 Australia Postal address: Locked Bag A14 Sydney South NSW 1235 Australia Tel: Fax: Email: Web:
+61 1300 554 474 +61 2 9287 0303 support@cm.mpms.mufg.com au.investorcentre.mpms.mufg.com
Auditor
PricewaterhouseCoopers One International Towers Sydney Watermans Quay Barangaroo NSW 2000 Australia Tel: +61 2 8266 0000 Fax: +61 2 8266 9999 Web: www.pwc.com.au
Akara Resources Public Company Limited
No. 99, Moo 9, Khao Chet Luk Subdistrict Thap Khlo District Phichit Province 66230 Thailand Tel: +66 5661 4500 Email: admincgm@akararesources.com Web: www.akararesources.com
Design & Production > apmgraphics.com.au
Suite 12.02 – Level 12 60 Castlereagh Street Sydney NSW 2000 Australia Tel: +61 2 8256 4800 Email: info@kingsgate.com.au Web: www.kingsgate.com.au ABN:
42 000 837 472