25 minute read
Models and the Questions We Ask

from Intersections + Identities: A Radical Rethinking of Our Transportation Experiences
by APA TPD SoTP

Models and the Questions We Ask
David Wasserman, Cheryl Croshere, and Karel Martens
Advertisement
Travel demand modeling has been used as a tool by transportation professionals for defining travel behavior processes and procedures for close to seventy years. With origins tied to the construction of the interstate highway system, our pursuit to understand the connections between human behavior and infrastructure is an under-examined part of transportation planning’s history. Many of the underlying assumptions in modeling practice influence transportation legislation, development review procedures, impact fee schedules, parking regulations, and environmental impact statements, to name a few. However, as transportation investments are expected to address new goals such as economic development, environmental justice, improving public health, or mitigating/adapting to climate change, the travel demand modeling practice needs to evolve. Our focus on travel demand as a technical exercise carries implicit assumptions and values that should be scrutinized if we wish to avoid reinforcing the perceived disparities of the past. With new challenges, we need new questions centered around who benefits from investments, the role of transport in increasing access to opportunity, transport costs and location affordability, and how the systems and processes of planning can change to meet more multifaceted goals.
THE ORIGINS OF TRAVEL DEMAND MODELING
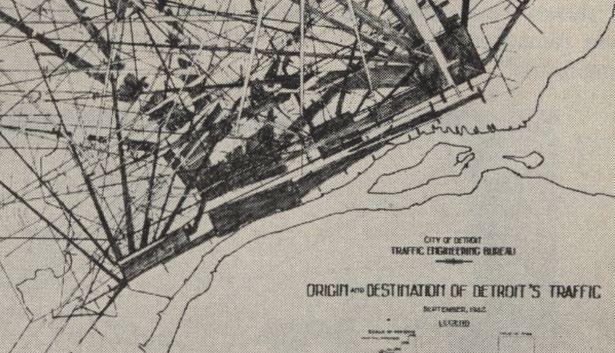
Travel demand models were developed to answer the question: where should interstate highways be routed through urban areas? Before travel demand models, there were desire line maps depicting trip origins and destinations. It’s perhaps not surprising that the first of these desire line maps were developed by engineers in Detroit, the birthplace of so many of America’s automobiles. They were trying to solve the problem of traffic congestion on urban roads by designing new highway routes. In 1942, Detroit traffic engineers surveyed workers in ten industrial areas and the central business district about their trip-making habits to and from work. Using a grid of analysis zones layered onto a map of the city, their desire-line maps connected the workers’ origin zones with destination zones, as shown in Figure 1 below.
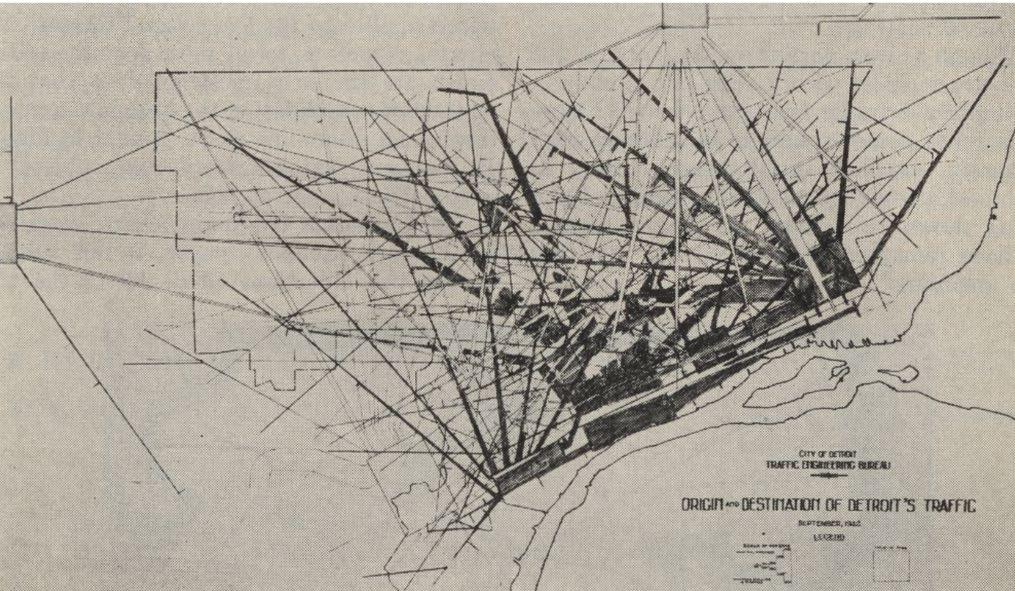
Figure 2: Traffic flow by desirable routes to major industries and central business district (printed in McLachlan & Lynch, 1950, p.365)
These desire lines did not discern the length of workers’ current trips or distinguish how travel behavior may have varied by time of day. They simply connected workers’ homes to their workplaces. The engineers’ next step was to widen the connecting desire lines according to the magnitude of trips between zones, creating “desirable routes,” as shown in Figure 2. These desirable routes became the basis for planning interstate highways through the city (McLachlan & Lynch, 1950).
Soon after, engineers began conducting more comprehensive origin-destination surveys by home interview. This method - adopted in 149 US cities by 1963 - allowed for more nuanced attention to the socioeconomic motivations for travel, including car ownership, shopping and work habits, race, gender, family size, and employment; the how and why trips are made, which became the basis of the four-step model (i.e., trip generation, trip distribution, mode choice, and trip assignment). These surveys and mapping exercises grew into comprehensive urban transportation planning and travel demand modeling, which were synonymous at the time.
The first city to forecast travel in relation to land use generators was San Juan, Puerto Rico in the early 1950s (Weiner, 2009). Many large metropolitan cities followed with their own metropolitan transportation studies. These studies included massive data collection efforts, the use of early computers, and innovation in statistical methods. They were trying to understand travel behavior as a rational problem that could be solved through engineering.
A manual from 1956 entitled “Better Transportation in Your City” introduced politicians and engineers untrained in transportation to the basics of research then being carried out (National Committee, 1956). This included questions such as: Why do people travel? Why do they go to the places they do, and why do they choose the modes of transportation and the routes that they do? How can current travel patterns be simulated and future patterns forecasted? Transportation studies sought not only to understand but predict and plan for urban residents’ travel.
The answers derived from these studies were fairly predictable: highways. Later, in the 1960s and 1970s, commuter transit systems - such as the Washington D.C. Metro and Bay Area Regional Transportation (BART) were also developed using travel demand modeling and offered diversification into other motorized travel modes.
The 1962 Federal-Aid Highway Act made funding for highway and transit projects in metropolitan areas contingent on continuing, comprehensive, and coordinated (3C) planning - a way of describing metropolitan transportation studies that came to be known as the fourstep method of travel demand forecasting (i.e., trip generation, trip distribution, mode choice, and trip assignment).The Act set a deadline of 1965 for such studies to be complete. And with that, experimentation in travel forecasting methods came to a near halt, as cities scrambled to meet the deadline for funding. As one study for the San Francisco Bay Area Transportation Study Commission concluded, “Time cannot be squandered on experimentation. Thus, all experimental work to be done will be back-stopped by established methodology which has proved to be effective, if not conceptually ideal” (1964).
Since then, the four-step model has been used widely in the US and elsewhere. The main purpose of these models has roughly stayed the same over the past fifty years: forecasting future travel patterns and predicting the impact of proposed interventions. The models have improved over time, but the changes in their use are more significant. Where originally used to assess the impacts of road projects, travel demand models are now also used to forecast possible impacts of more modest infrastructure investments like BRT corridors or new subway stations, as well as ‘soft’ measures like zero-emission zones and congestion pricing.
Despite their use for a broader set of policy questions, the fundamentals of travel demand models have not changed. Hence, their assumptions of travel demand models and the role they play in decision-making is still being criticized on numerous grounds. We discuss some of these critiques and subsequently show how the models can be used as a powerful tool to answer an even broader set of questions.
CRITIQUE #1: MODELS REFLECT CONSTRAINTS AS MUCH AS PREFERENCES
The origins of travel demand models are important in context to their contemporary critiques. Transportation demand models have been criticized on numerous grounds. This includes that the forecasts they produce overestimate use and underestimate costs, for example, and are susceptible to manipulation for preconceived political ends (Wachs, 1987, 1990; Flyvberg, 2007; Flyvberg & Molley, 2011; Gordon, 2020). Perhaps one of the most convincing critiques relates to the implicit assumption underlying travel models. This is that travel patterns are a result of choice and, thus, reflect preferences (Sheppard, 1995). When this assumption is accepted, observed travel patterns can be used to forecast future preferred travel patterns using transport models and, subsequently, to identify improvements in the transport system to serve those desired trips.
This typical approach is problematic, once it is understood that travel patterns are as much a result of constraint as of preference (Anciaes et al, 2016). This clearly holds for poorer households and people without access to a private motorized vehicle. The former group is likely to restrict their overall travel as well as their use of specific modes to limit the financial burden on the household. This is reflected in the 2017 U.S. National Household Travel Survey (NHTS) data when we look at low-income households. For example, even though households making less than $25,000 make up 23% of the sampled population, they travel 13% of the nation’s vehicle miles traveled (VMT) (USDOT, 2017).
It is important to realize that the above is a critique of the assumptions underlying the way in which models are used. They do not disvalue the models themselves. Once it is realized that the outputs generated by travel models may reflect constraints as much as preferences, it becomes possible to use these models to answer entirely different questions than those traditionally asked within the context of transportation planning, as we will show below.
CRITIQUE #2: LEGACY OF COMMUNITY SEVERANCE
Connected to the under-examination of constraints is the role of new infrastructure in forming different types of barriers to active modes of travel across communities (Anciaes et al, 2016). The potential barrier effects of new and expanded facilities have inspired entire methodologies to understand the level of comfort of cyclists and pedestrians at the segment and intersection level, some of which are routinely used in practice today (Levinson et al, 2020). However, beyond how transportation professionals conceive these barrier effects on active modes, other disciplines have noted a wider range of impacts on sense of place, resilience, social cohesion, and physical and mental health (Anciaes et al, 2016). They start with potential changes in people’s options and choices, and cascade into wider implications for individual and community well-being as illustrated in Figure 3. These impacts on communities are rarely reported alongside the volumes, segment level delays, origin-destination matrices, or other statistics that accompany a travel demand model’s output (TRB, 2021).
The network suitability methodologies such as bicycle and pedestrian level of traffic stress have been increasingly acknowledged by Departments of Transportation as ways to understand barrier effects as they relate to active transportation (ODOT, 2020). These methods provide a familiar starting place for transportation professionals to expand their traditional focus on (motorized) travel demand to a more cross-disciplinary lens required to address tradeoffs associated with community severance (Anciaes et al, 2016).
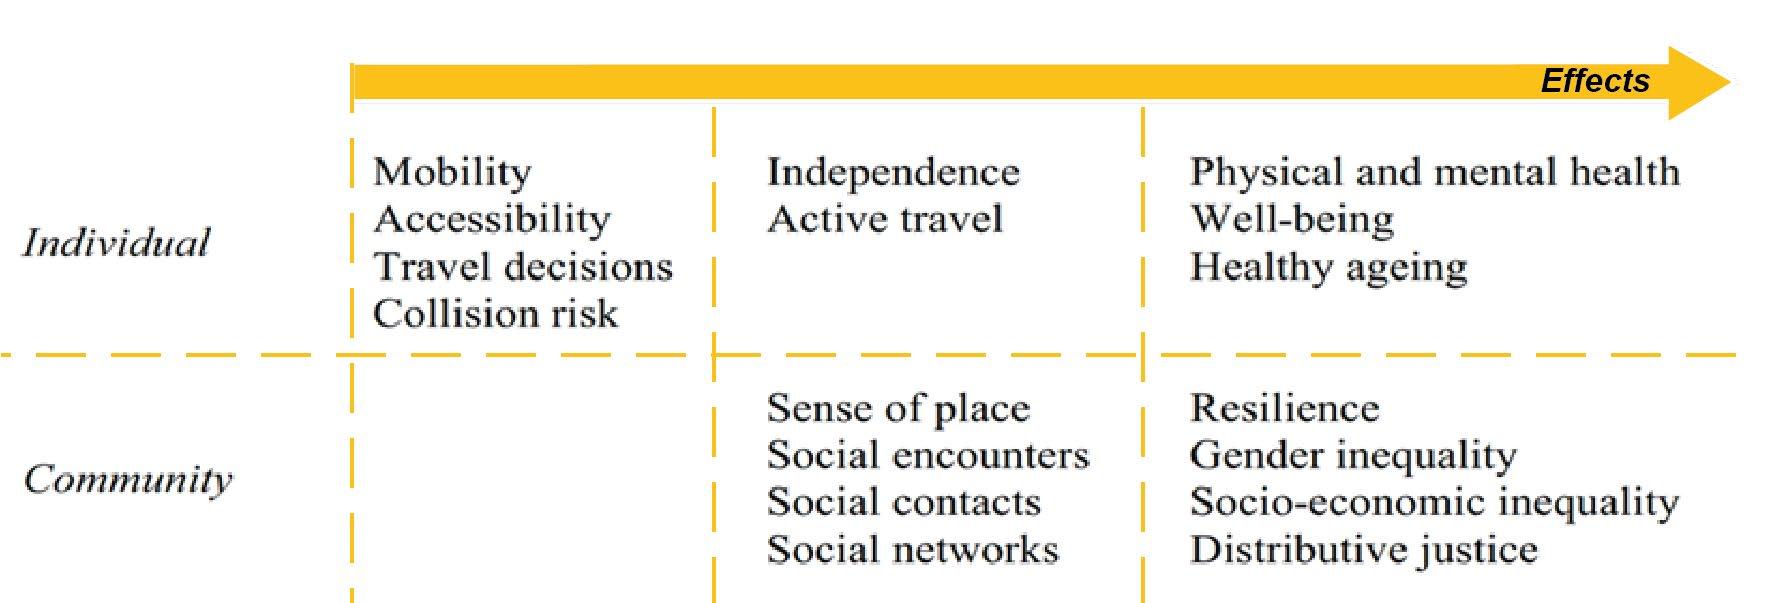
Figure 3: What are the effects of community severance? (Anciaes et al, 2016)
CRITIQUE #3: WHO BENEFITS FROM ADDRESSING CONGESTION?
Additionally, much of modeling’s intellectual framing is oriented around when and how the choice to travel influences congestion (Beimborn, 2006; Castiglione et al, 2015). With so much focus given to peak travel demand in models, understanding who that timeframe benefits is important to understanding the equity implications of modeling practice. Research examining the equity implications of congestion pricing provides an indication that it tends to benefit those with more resources rather than less. For example, as shown in Figure 4, when looking at commuting patterns in Portland, Oregon the rates of driving during the peak period for commuters earning 400% of the poverty line were nearly twice that of those who earned below 200% of the poverty line (FHWA, 2009). Similar findings are reported in surveys on regarding low-income users’ preferences for taxes versus tolls in King County, WA where low-income users vastly preferred tolls to higher income users (FHWA, 2009).
CRITIQUE #4: SHIFTING GOALS & UNCHANGING LENS
Transportation investments are increasingly expected to address a diversity of community goals, such as improved accessibility, economic development, equity and environmental justice, supporting recreation and healthy habits, mitigating climate change, and investing in resilient transportation systems (Brookings, 2020; NAS, 2021; Levinson et al, 2020; Martens and Golub, 2021). Our traditional focus in transportation planning often frames added capacity either around accommodating new growth, enabling high traffic speeds, or mitigating congestion (Beimborn, 2006, TRB, 2021). While models can be used to inform other goals, their typical application on a micro or macro scale is focused on a narrow set of goals (Brookings, 2020). This was publicly excoriated in an article titled “The Broken Algorithm That Poisoned American Transportation” (Gordon, 2020). While much of the article discusses how models have traditionally been applied, some of its critiques target the underlying analytical frames models have inherited. The questions surrounding models and the values they embody has as much to do with their construction as with their application. If models are perceived solely to be “sales tools” for highways, it is a direct challenge to their legitimacy, and we will be left with only politics rather than insight (Gordon, 2020; NAS, 2020).

*Missing data concerning mode of travel were allocated proportionately across five commuter categories. SOV = single-occupancy vehicle
Figure 4: This table presents commuting patterns by income group in the Portland, OR, area. It illustrates the degree to which different income groups commute during peak periods. (FHWA, 2009).
ILLUSTRATING NEW QUESTIONS
Once we think about the goal of transportation policy as not merely serving expected peak demand, but as a way to shape that very demand, it becomes possible to use transportation models to answer entirely new questions. This could potentially include the following.
New Question #1: Which potential projects improve access to opportunities?
The intent of this question is examining how the transportation system connects people to opportunity. Accessibility is increasingly being considered as an emerging metric of success in transportation planning because of its integrated consideration of land use and transportation as connected systems. For example, access to opportunities can be improved not only through improving mobility by adding highway lanes or bus lines, but through changes in land use as well, creating destinations that are closer than they were previously. The value of access is often reflected in the premiums individuals may pay for land, the affordability of their transportation options, and their quality of life (Levinson et al, 2020). Additionally, as a metric measuring the benefit of transportation facilities, it can also help us understand who benefits from improvements through the stratification of different demographic groups relative to accessibility gains associated with a project (Levinson et al., 2020; Martens et al. 2021).
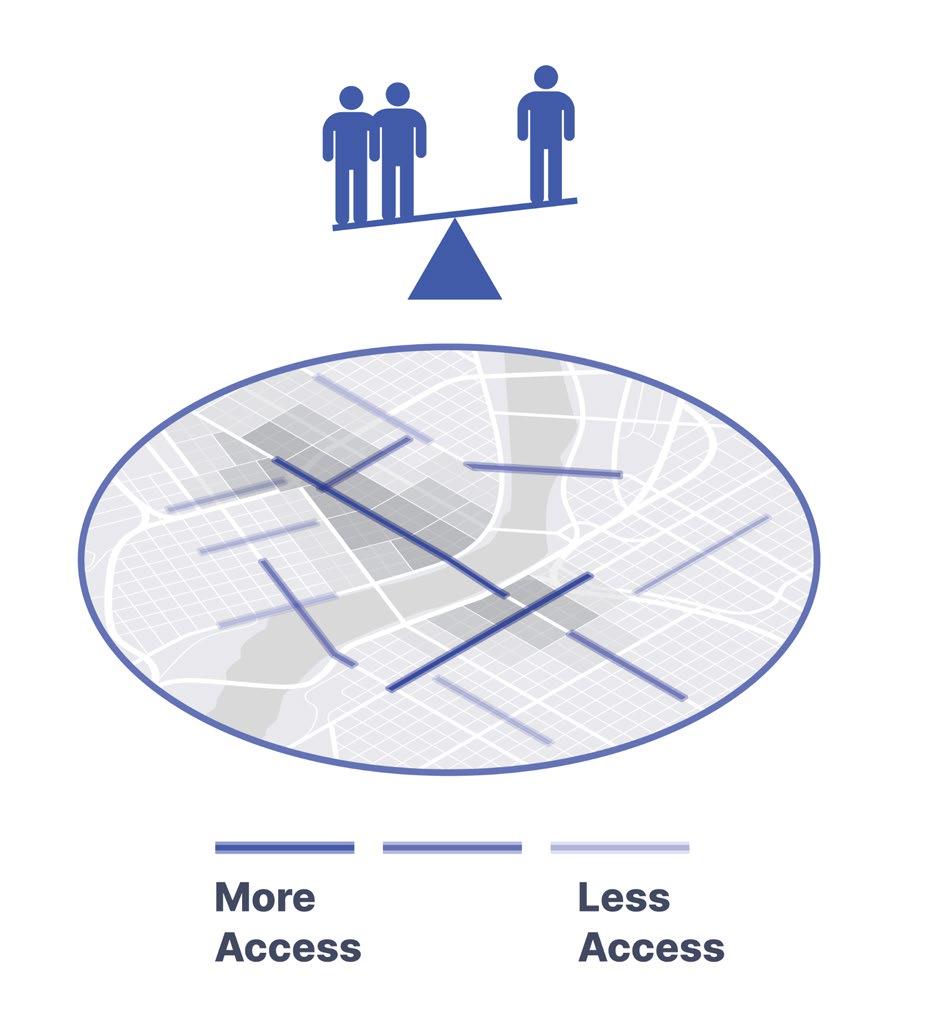
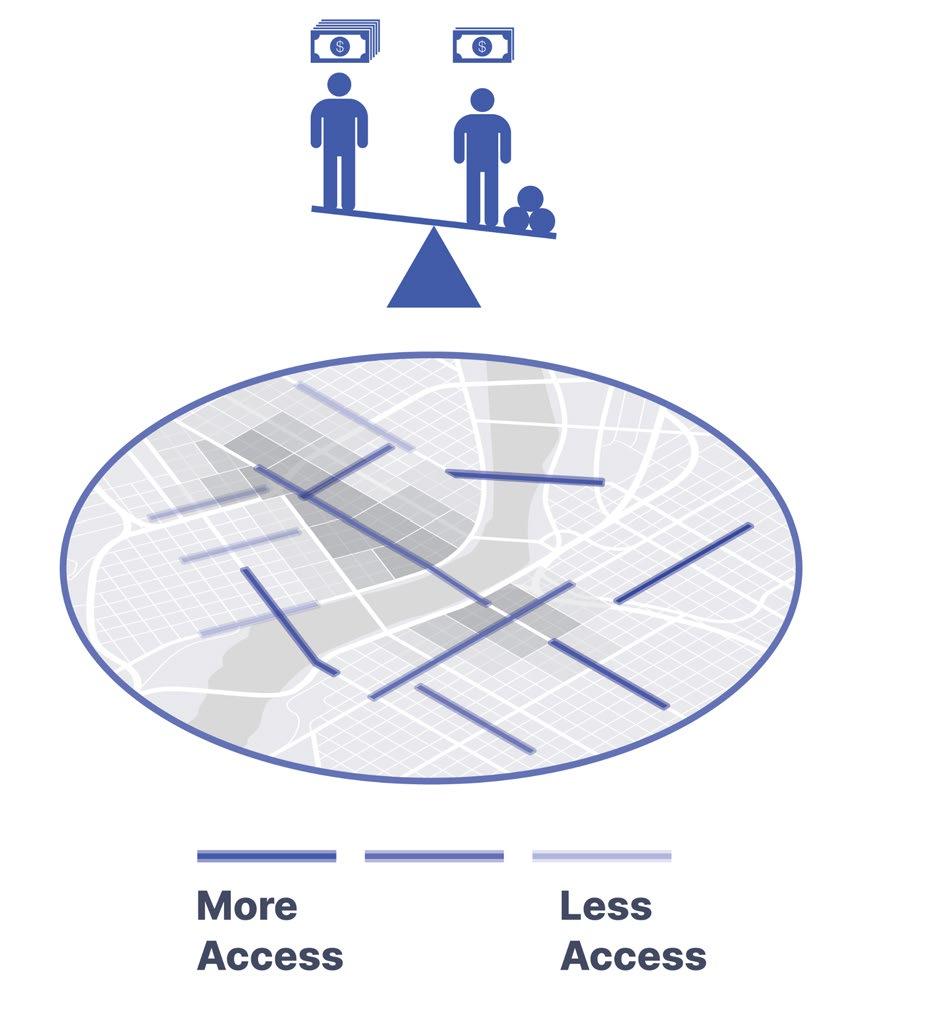
Figure 5: Examining the accessibility gain of projects provides us the opportunity to use weighted averages and other descriptive statistics to understand who benefits from enhanced connectivity. The projects that might rise to the top may differ depending on who we are trying to serve, with this illustration contrasting how the benefit of a project might accrue to the general population vs. to lowincome populations. Conceptual illustration by Elizabeth Bisegna.
This ability to understand the relative benefit of improvements is incredibly important to understanding the equity implications of planning decisions (Levinson et al., 2020). To that end, states and MPOs are increasingly using accessibility measures to evaluate and prioritize projects. One such example is the Salt Lake City MPO the Wasatch Front Regional Council (WFRC), and their work leveraging travel demand modeling to map automobile and transit accessibility through their Access to Opportunity database (WFRC, 2017). This use of the travel demand model to examine changes to access through time sets is an example of how we can leverage models to move us closer to metrics that promote equity of opportunity as well as livability and can help frame conversations surrounding transportation justice.
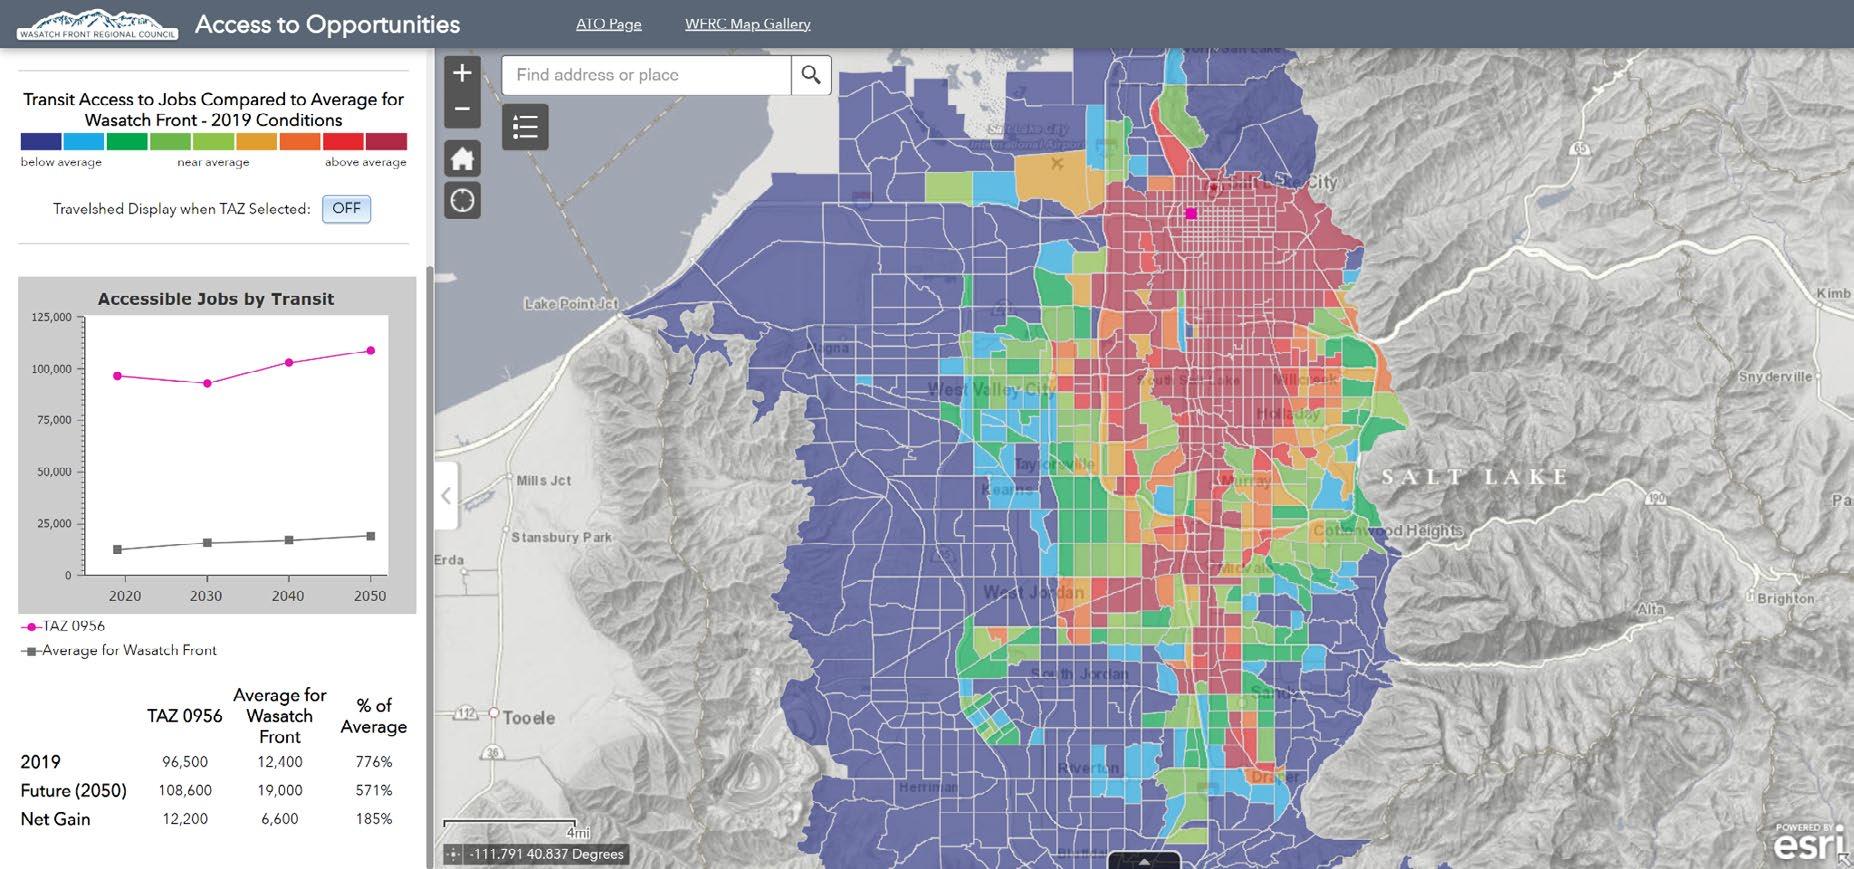
Figure 6: WFRC maintains a web-based dashboard that enables the public to understand the current degrees of access to jobs via driving or using public transit, but also how that access may change in the future given expected changes in land use and transportation infrastructure.
New Question #2: What do the travel patterns of low-income groups tell us about their mobility needs?
The focus on addressing congestion is also heavily focused on the needs of commuters, but with the advent of Activity Based Models (ABMs) there are more opportunities to broaden the application of models to mobility needs beyond the commute trip (Castiglione et al, 2015). One of the most promising aspects of their advancement is the ability to understand the activity patterns of different demographic groups across multiple trip purposes. This ability to stratify trips by income, for example, enables planners to explore the potential travel needs of disadvantaged communities more deeply (Castiglione et al, 2015). This can often mean expanding beyond understanding what important destinations are in these communities but using models to understand the (lack) of transportation options and characteristics of those options such as their affordability and reliability (Castiglione et al, 2015).
This type of analysis is often complex to manage in practice, but new software platforms are enabling the accessible inspection of ABM outputs. These models increasingly rely on big data obtained from mobile location tracking, which provide more detail on trip patterns than traditional travel behavior surveys (even if short trips, such as those made by foot, bicycle or other forms of micro-mobility, may be more difficult to capture). In combination with Census demographic data and land use data, such new models can provide a rich understanding of activity patterns, both at the aggregate level and for specific population groups.
One example of such a software is Replica, which can represent travel patterns of different income groups so that the geography of disadvantage can be better understood (Figures 7 and 8). Where trip patterns of low-income groups typically remain invisible in the aggregate outputs of travel demand models due to their modest share in overall trips, ABM models can make these distinctly different patterns visible because of their abilities to disaggregate for distinct groups.
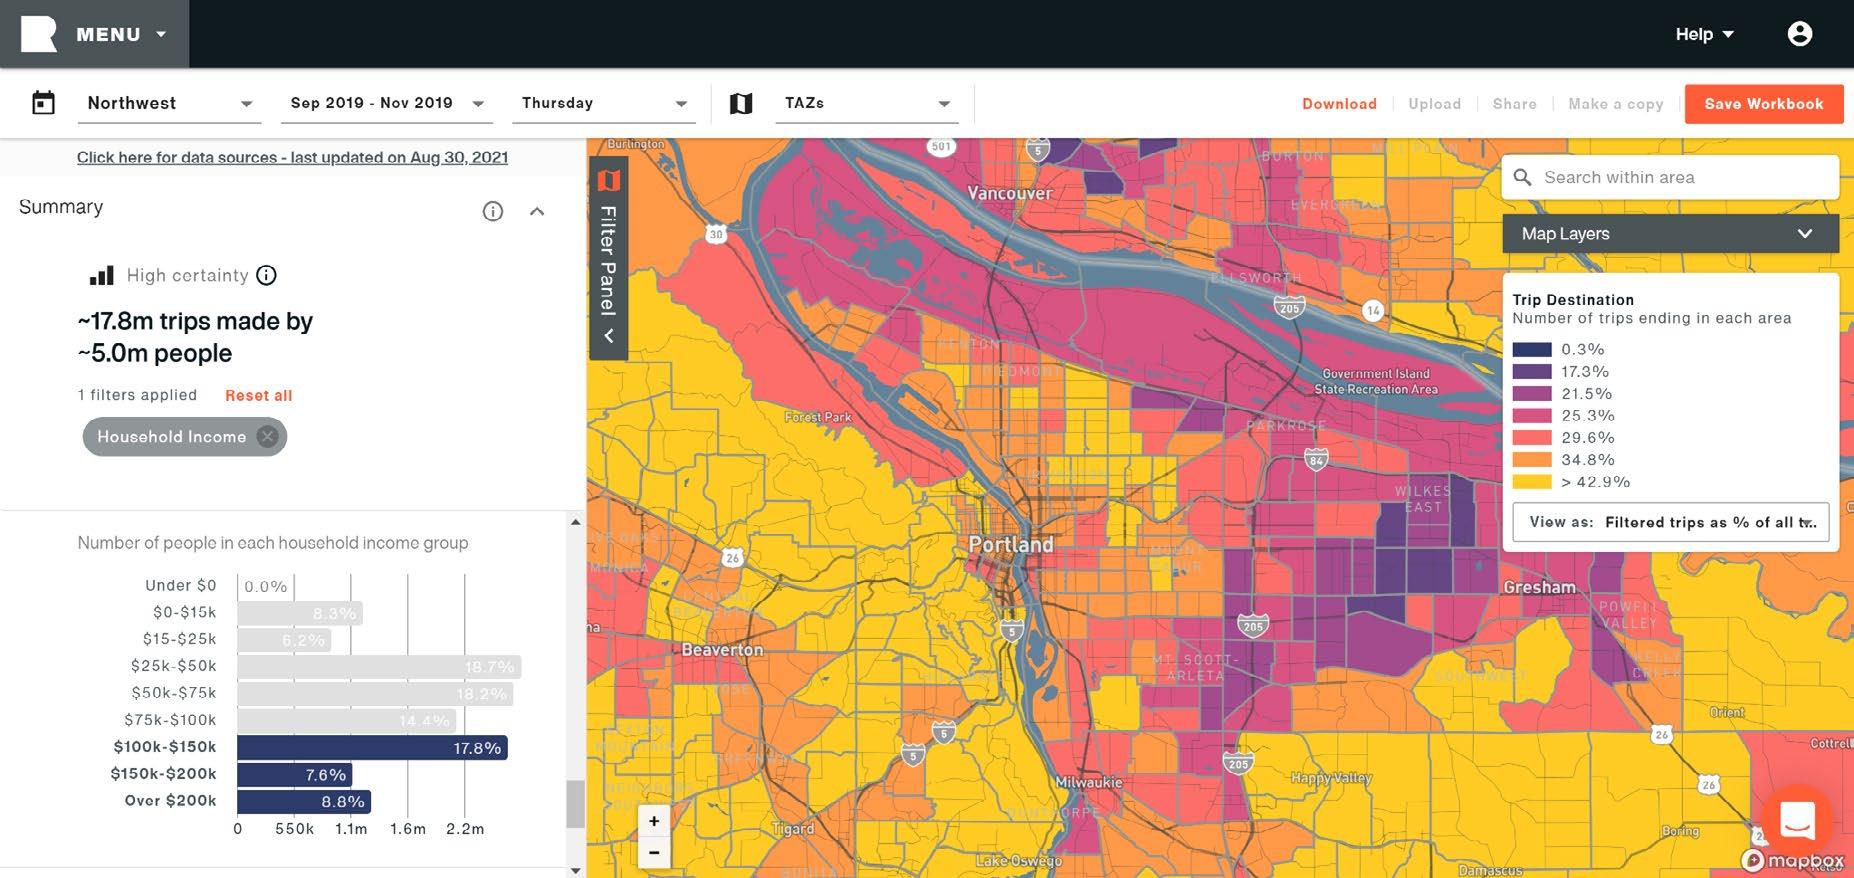
Figure 7: Snapshot from Replica’s Place’s platform, which provides insights from a nationwide activitybased model with a few clicks. This map from the Replica Platform shows the distribution of trip destinations of people with a household income of over $100,000 in Portland, Oregon.
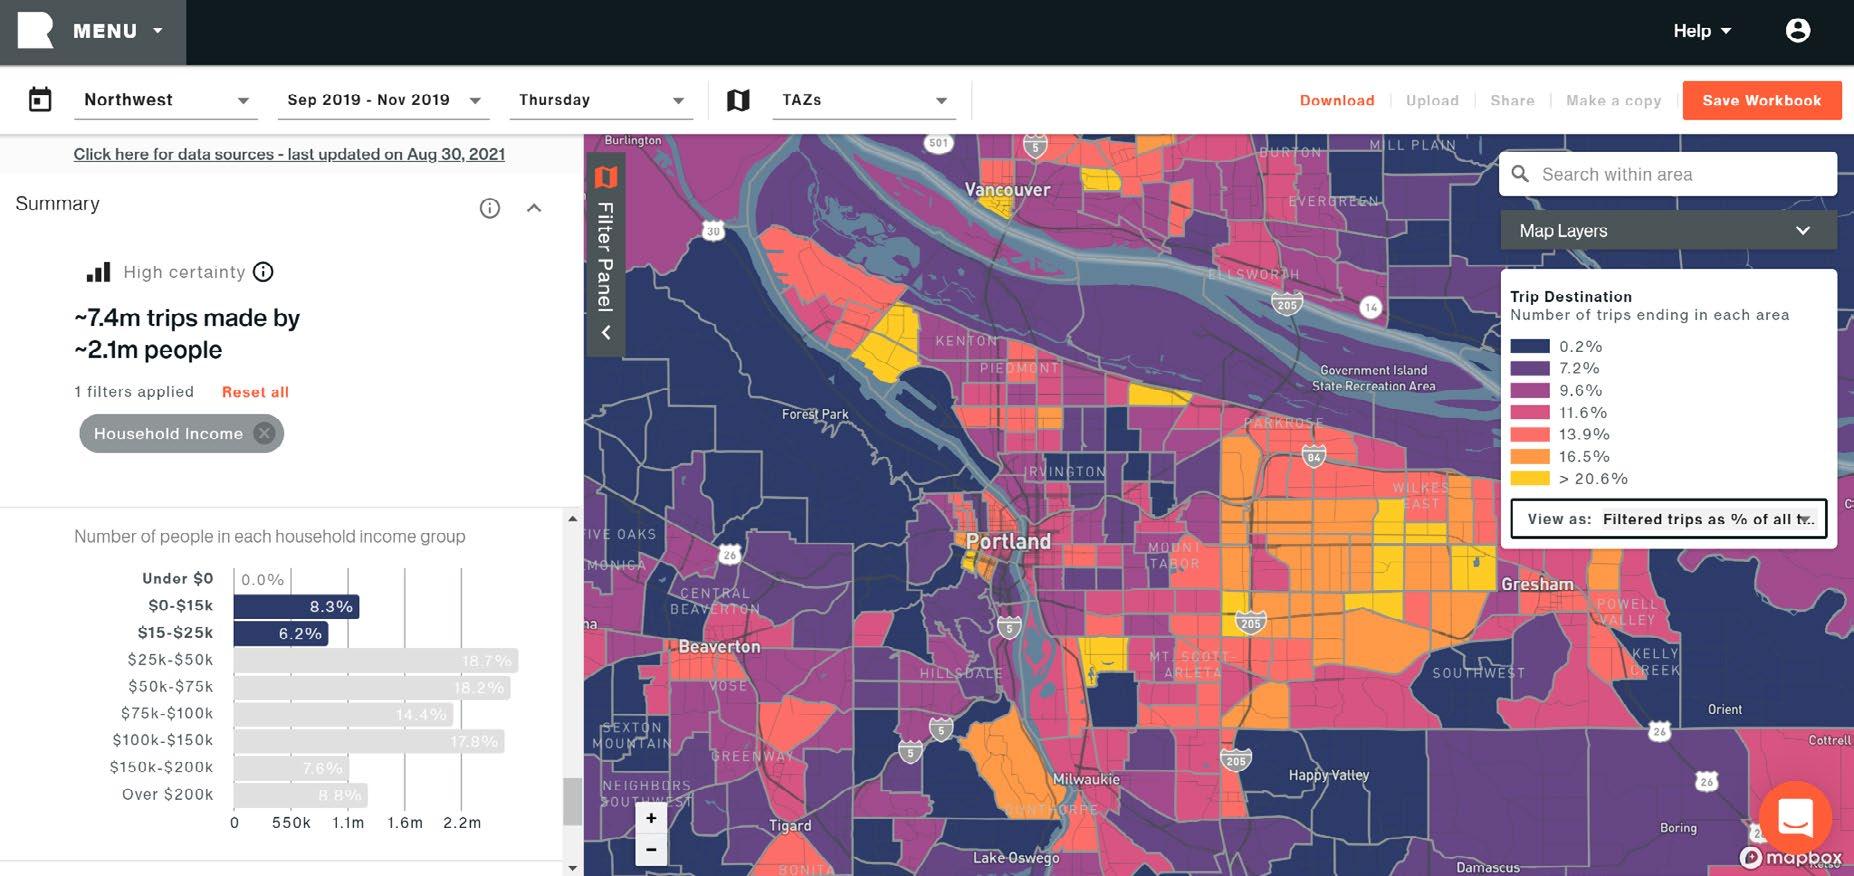
Figure 8: This map from the Replica Platform shows the distribution of trip destinations of people with an annual household income of under $25,000 in Portland, Oregon. Note the large differences in spatial distribution of trips in comparison to the high-income groups.
New Question #3: Can we reframe results to inform where potential for mode shift exists?
Beyond leveraging models to understand the trip patterns and demand of different demographic groups, models can help identify short trips that have the potential to be shifted to other modes of transportation. Mixed-use, compact, and human-scale neighborhood designs lead to shorter distance trips (Guthrie et al, 2015; Brookings, 2020). This can include neighborhoods closer to the historic urban core that are designed with shorter blocks and more intersections per acre, which tend to produce more trips under 3 miles (Brookings, 2020).
A Brookings Institute study looked at the trip lengths across several metropolitan regions. They found that over 50% of all trips in Chicago, Dallas, Portland, and Sacramento fall under 4 miles; in Kansas City, 49% of trips fall below that threshold. Millions of trips don’t even stretch a mile, ranging from 22% of trips in Kansas City to 30% in Chicago (Figure 9).
These insights can also be made geographically specific to understand which locations and links can benefit from better active travel connections. One application example is provided when Alta Planning + Design (Alta) assisted the Orange County Transportation Authority (OCTA) with developing a long-range, comprehensive multimodal approach to address South Orange County’s wider mobility needs and how strategic investments in mobility hubs and network improvements can help meet them. The outputs of the OCTA Model were analyzed using an interactive origin-destination visualization tool, providing insight into short, total, and non-motorized trips in the region. These trip estimates were then used to inform where active travel investments could increase active trips. This possible modal shift was then fed back into the model to understand larger potential changes in VMT and other key metrics of interest to OCTA.
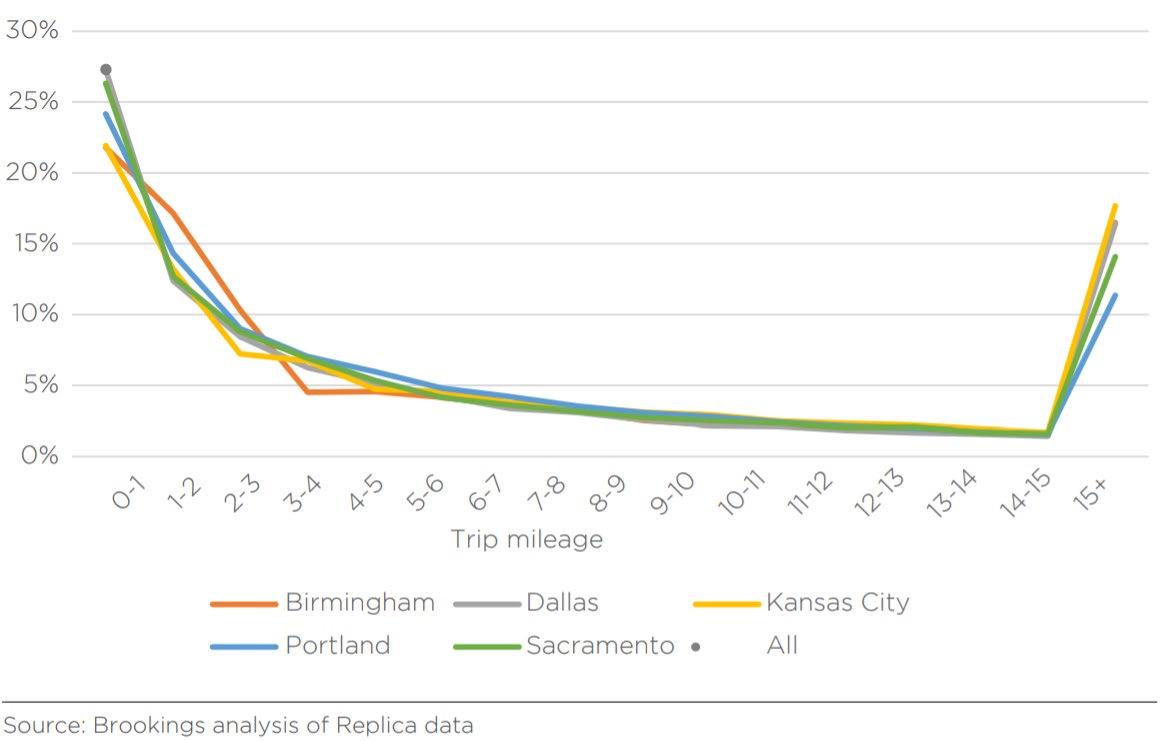
Figure 9: Brooking’s analysis illustrating the share of all trips by trip mileage, for five metropolitan areas. It illustrates that short trips make up a significant proportion of total travel. Travel demand models can help examine the intersection of transportation and land use that can make these insights valuable for planning (Brookings, 2020).
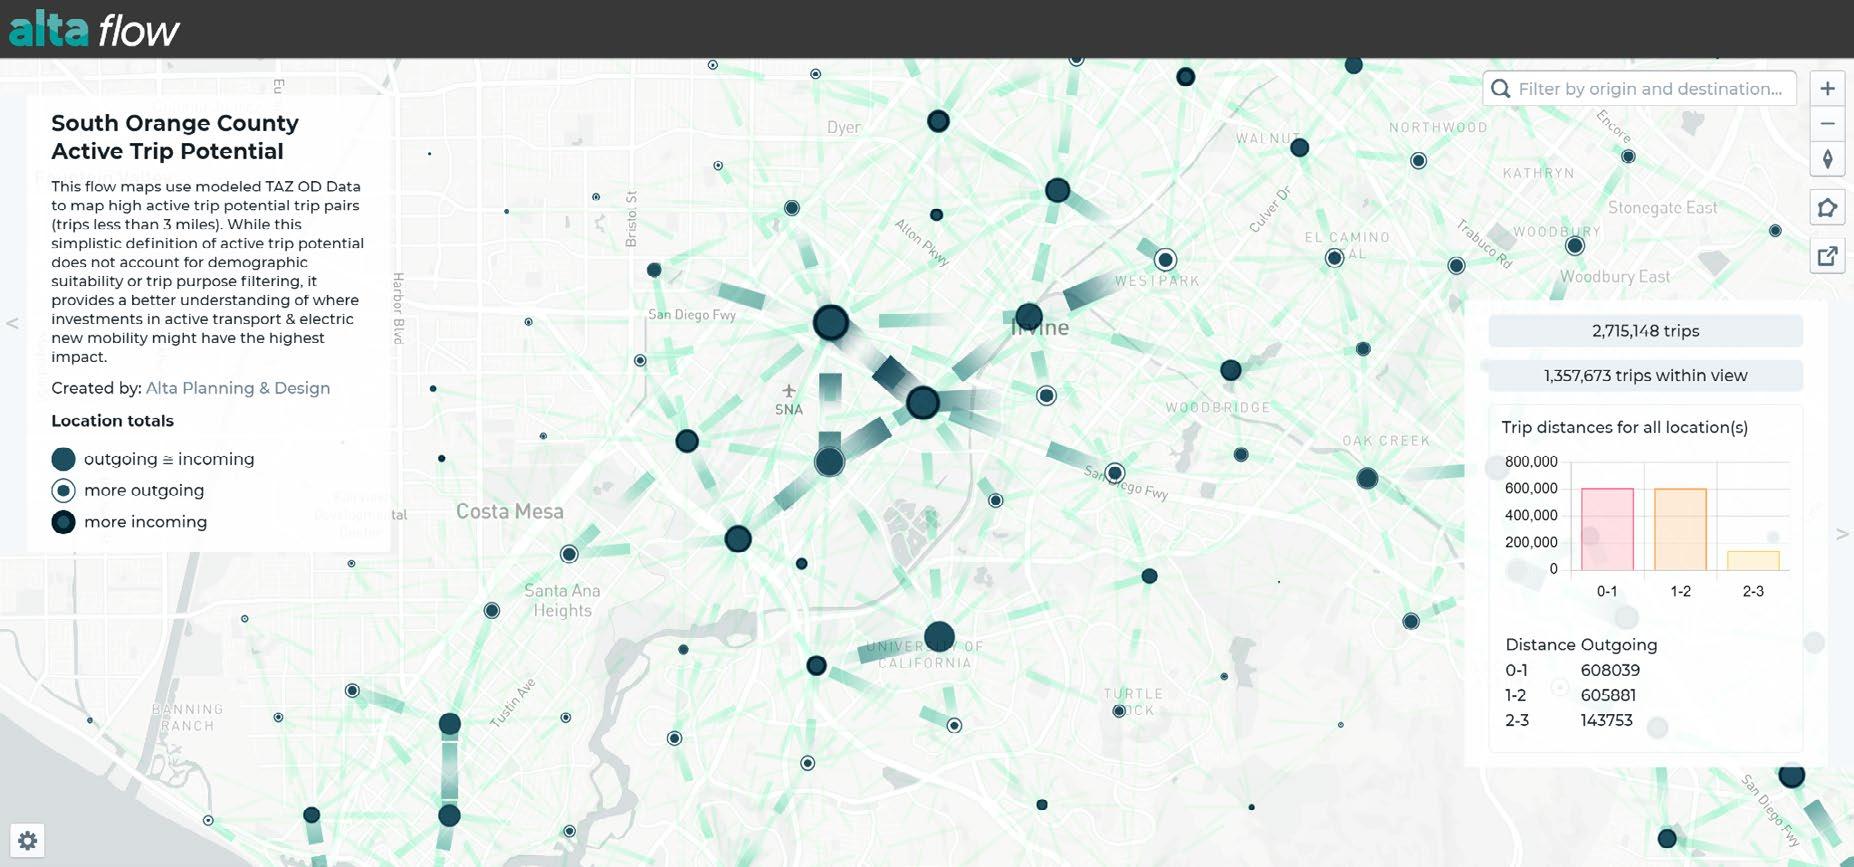
Figure 10: Alta Planning + Design has developed custom interactive visualizations of trips less than 3 miles in South Orange County and other jurisdictions to serve as a tool for understanding where active trip potential (i.e., bicycle and pedestrian activities) indicates potential desire lines for new supportive infrastructure.
Since this analysis, Alta has been using data similar to the Brookings analysis to estimate bicycle and pedestrian trips and understand the gap between potential trips of this nature and existing mode share. This example shows how models, if used in novel ways, can help facilitate more multimodal planning.
New Question #4: Can being more open about models and their results help us reach across the table to other disciplines to find new tools and questions?
Like any other profession, transportation professionals by the nature of their training or experience often engage with challenges and issues with a lens that frames the problems in certain ways. This framing can create blind spots and reinforce a sense of rigidity to our approaches and guide our understanding of the solutions, designs, or plans for civic problems we wish to address. One way to address this is to enable other disciplines to create actionable insights if we can make their methods and results more accessible. MPOs vary in the degree to which they are transparent with the results from modeling activities. The sharing of model data is noteworthy enough, that a federal study looking at the historical forecast accuracy noted that “[a]cknowledging the uncertainty inherent in forecasting and reporting a range is a way for the forecasting agency to protect its own credibility. The agencies that shared data for this study are a model of transparency and should be celebrated for their efforts to learn from past forecasts and engage in a process of continued improvement (NAS, 2020).”
While more MPOs, such as the Puget Sound Regional Council (PSRC) and San Diego Regional Planning Agency (SANDAG), are starting to use open-source architectures such as ActivitySim for the basis of their models, the San Francisco Bay Area Metropolitan Transportation Commission (MTC) goes one step further by hosting the results from different model runs in the open. These results are available for anyone to download to use as part of research or projects in the region.
While the model data can be complicated to understand or analyze, it is an important step to being more transparent and enabling other disciplines to bring their own insights to model outputs. For example, when transportation professionals think about active mode splits, we typically are looking to understand the proportion of trips met by active modes, but an epidemiologist might be more interested in the question of whether modeled active travel matches daily recommended physical activity (Anciaes et al, 2016). This simple reframing enables a model to inform questions related to public health that might not have occurred if the fear of how model results were interpreted in public forums continues to compel us to silo them.
CONCLUSIONS
The regionalist and moralist Lewis Mumford was incredibly concerned about the role of human values in how society applied new technologies. He heavily critiqued the values and methods (political and technical) used to justify megaprojects of the 20th century, often pursued at the expense of vulnerable communities’ quality of life (Mumford, 1970; Critchley, 2012). Now that the goals of transportation policy are both broadening and shifting, it is time to reconsider how we can apply our models to support these developments. This is particularly challenging in this era as defined by social, technological, and climatic change.
Figure 11: The San Francisco Bay Area MTC has open-sourced both their model and key model results for use by planners, researchers, and the public at large. Opening up models and their results enables other disciplines to leverage models for new questions.
The examples of how we can reframe models around new questions are intended to identify how we can meet those challenges. Asking new questions requires transportation planners and engineers to critically examine the analytical frames they bring to problems. This means looking for more opportunities to engage with crossdisciplinary research and thinking about what other disciplines can tell us about our framing of questions (Guthrie et al, 2015; Beimborn, 2006). Being more transparent and open about the methods and outputs of travel demand models can be part of that process.
The investments we make in transportation are intergenerational vehicles of change, and the lens we bring to how we model our common futures needs to change.
About the Authors
David Wasserman is the Data Science Practice Leader at Alta Planning & Design. His work lies at the intersection of urban informatics, 3-D visualization, geospatial analytics, and visual storytelling. His current areas of focus are enabling data-informed scenario planning, incorporating civic data science into planning projects with web-delivery and computer vision derived datasets, and generating accessibility metrics that can identify the possible benefits of projects and who they go to.
Karel Martens is Professor in Transport Planning at the Technion’s Faculty of Architecture and Town Planning. He is an international expert on transport and justice. He has authored numerous publications on the topic, culminating in his book Transport Justice: Designing Fair Transportation Systems, which has been described by colleagues as “ground-breaking”, a “landmark”, and a “revolution”. Martens’ Fair Transport Lab hosts the Accessibility Sufficiency Dashboard, which provides detailed insights into accessibility patterns in 49 US metropolitan areas.
Cheryl Croshere is the Executive Director of the 50 Corridor Transportation Management Association, serving the eastern suburbs of Sacramento, California. She applies expertise in transportation planning, cultural anthropology, and change management to offer innovative transportation demand management strategies for residents and workers, providing “off-model” reductions in trip-making and Vehicle Miles Traveled.
References
Anciaes, P. R., Boniface, S., Dhanani, A., Mindell, J. S., & Groce, N. (2016). Urban Transport and Community Severance: Linking Research and policy to link people and places. Journal of Transport & Health, 3(3), 268–277. https://doi.org/10.1016/j. jth.2016.07.006
Bay Area Transportation Study Commission. (1964). Preliminary design for the Bay Area Transportation Study. Beimborn, E. (2006). A Transportation Modeling Primer. Retrieved from http://www.its.uci. edu/~mmcnally/reports/Primer-Beimborn-Mar09.pdf.
Brookings Institute. (2020) Connecting people and places: Exploring new measures of travel behavior. Retrieved from https://www.brookings.edu/wp-content/ uploads/2020/10/Corridors-of-Demand.pdf
Castiglione, J., Bradley, M. A., & Gliebe, J. (2015). Activity-based travel demand models: A Primer. Transportation Research Board. Retrieved from https://www.nap.edu/ catalog/22357/activity-based-travel-demand-models-a-primer
Critchley, Peter. (2012). Lewis Mumford and the Moral Architectonics of Ecological Civilisation.
Guthrie, D., Carson, B. (2015) Next-Generation Transportation Impact Fees. Planning Advisory Service Memo. American Planning Association. Retrieved from https://www. planning.org/publications/document/9137368/
Federal Highway Administration. (2009). Income-based equity impacts of congestion pricing-A Primer. Income-Based Equity Impacts of Congestion Pricing-A Primer - Review of the Literature - FHWA Operations. Retrieved from https://ops.fhwa.dot.gov/ publications/fhwahop08040/fhwahop08040.pdf
Flyvbjerg, B. (2007). Policy and planning for large infrastructure projects: problems, causes, cures. Environment and Planning B: Planning and Design, 34(4), 578.
Flyvberg, B., & Molloy, E. (2011). Delusion, deception and corruption in major infrastructure projects: Causes, consequences and cures. The International Handbook on the Economics of Corruption, Volume Two (Cheltenham UK: Edward Elgar, 2011) pp, 81107.
Gordon, A. (2020). The broken algorithm that poisoned American Transportation. VICE. Retrieved December 1, 2021, from https://www.vice.com/en/article/v7gxy9/thebroken-algorithm-that-poisoned-american-transportation-v27n3.
Levinson, D., King, D.(2020) Transport Access Manual: A Guide for Measuring Connection between People and Places by The Committee of the Transport Access Manual.
Martens, K. and A. Golub (2021). “A Fair Distribution of Accessibility: Interpreting Civil Rights Regulations for Regional Transportation Plans.” Journal of Planning Education and Research 41(4): 425-444.
McLachlan, K. A., & Lynch, J. T. (1950). The coordinate method of o and d analysis. In Highway Research Board Proceedings.
Metropolitan Transportation Commission (MTC). (2020, December). Bayareametro/travelmodel-one: Travel model one and travel model 1.5. GitHub. Retrieved December 8, 2021, from https://github.com/BayAreaMetro/travel-model-one.
Mumford, L., 1970. The Pentagon of Power: Harcourt Brace Jovanovich. ISBN 0-15163974-4.
National Academies of Sciences, Engineering, and Medicine 2020. Traffic Forecasting Accuracy Assessment Research. Washington, DC: The National Academies Press. https://doi.org/10.17226/25637
National Academies of Sciences, Engineering, and Medicine. 2021. Investing in Transportation Resilience: A Framework for Informed Choices. Washington, DC: The National Academies Press.https://doi.org/10.17226/26292.
National Committee on Urban Transportation. (1956). Better transportation in your city: How to get the basic facts on urban needs and services (proposed draft).
Oregon Department of Transportation. (2020). Multimodal Analysis - Analysis Procedures Manual Version 2. Retrieved January 22, 2022, from https://www.oregon.gov/ODOT/ Planning/Documents/APMv2_Ch14.pdf
TRB - TF Resource. (2021). Travel forecasting resource. The Big Picture. Retrieved December 5, 2021, from https://tfresource.org/topics/Big_Picture.html.
US DOT. (2017). National Household Travel survey. Retrieved from https://nhts.ornl.gov/ vehicle-miles.
Wachs, M. (1987). Forecasts in urban transportation planning: Uses, methods, and dilemmas (pp. 6180). Springer Netherlands.
Wachs, M. (1990). Ethics and advocacy in forecasting for public policy. Business & Professional Ethics Journal, 141157.
Wasatch Front Regional Council. (2017). Access to opportunities. Retrieved December 5, 2021, from https://wfrc.org/maps-data/access-to-opportunities/.
Weiner, Edward (2009). Urban Transportation Planning in the United States: History, Policy, and Practice. Springer Science and Business Media.
Cover image: Detail of Figure 1.