Solution Manual for Essentials of Business Statistics, 3rd Edition Jaggia Chapter 1-14
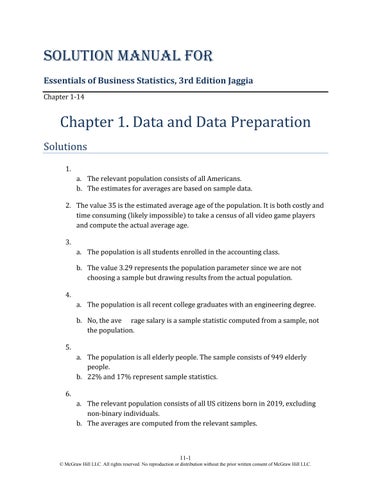
Chapter 1. Data and Data Preparation Solutions 1. a. The relevant population consists of all Americans. b. The estimates for averages are based on sample data. 2. The value 35 is the estimated average age of the population. It is both costly and time consuming (likely impossible) to take a census of all video game players and compute the actual average age. 3. a. The population is all students enrolled in the accounting class. b. The value 3.29 represents the population parameter since we are not choosing a sample but drawing results from the actual population. 4. a. The population is all recent college graduates with an engineering degree. b. No, the ave rage salary is a sample statistic computed from a sample, not the population. 5. a. The population is all elderly people. The sample consists of 949 elderly people. b. 22% and 17% represent sample statistics. 6. a. The relevant population consists of all US citizens born in 2019, excluding non-binary individuals. b. The averages are computed from the relevant samples.
11-1 © McGraw Hill LLC. All rights reserved. No reproduction or distribution without the prior written consent of McGraw Hill LLC.
7. The resulting data about living accommodations and expenses have a welldefined row-column format, and therefore, are structured. The data are crosssectional data.
Note: Data will vary due to the nature of sampling. 8. The data are cross-sectional data.
Note: Data will vary due to the nature of sampling. 9. The data are time series data.
Note: Data will vary depending on the date of retrieval. These data were retrieved July 2019. Date 7/1/2018 8/1/2018 9/1/2018 10/1/2018 11/1/2018 12/1/2018 1/1/2019 2/1/2019 3/1/2019 4/1/2019 5/1/2019 6/1/2019
Adj. Close Price 192.55 195.72 202.97 172.33 176.68 169.36 180.90 182.49 189.15 202.28 188.53 206.52
10. The front page of the New York Times website is likely to be textual (written reports) with multimedia contents (photographs, etc.). The resulting data are unstructured in that they do not conform to a predefined row-column format. 11. Data on price and fuel economy of small hybrid vehicles can be specified in a predefined row-column format, and therefore, are structured.
Note: Data will vary due to the nature of sampling. 12. The data for Under Armour’s annual revenue are structured since they are specified in a well-defined row-column format. The data are time series data.
Note: Data will vary depending on the date of retrieval. These data were retrieved July 2019. Year 2018 2017
Annual Revenue (in $ millions) $5,193 $4,989
11-2 © McGraw Hill LLC. All rights reserved. No reproduction or distribution without the prior written consent of McGraw Hill LLC.
Year 2016 2015 2014 2013 2012 2011 2010 2009
Annual Revenue (in $ millions) $4,833 $3,963 $3,084 $2,332 $1,835 $1,473 $1,064 $856
13. The resulting data about online social media usage have a well-defined rowcolumn format, and therefore, are structured. The data are cross-sectional data.
Note: Data will vary due to the nature of sampling. 14. a. Numerical; discrete b. Categorical c. Numerical; continuous 15. a. Categorical b. Numerical; continuous c. Numerical; discrete 16. a. Nominal b. Interval c. Ordinal 17. a. Ratio b. Ordinal c. Nominal 18. a. Ratio b. Interval c. Ratio 19. a. Nominal scale; the values differ in name. b.
11-3 © McGraw Hill LLC. All rights reserved. No reproduction or distribution without the prior written consent of McGraw Hill LLC.
Major # of Students Accounting 4 Economics 4 Finance 4 History 4 Management 5 Psychology 3 Statistics 3 Undecided 3 c. An inspection of the data shows that Management has the highest number of students whereas Psychology, Statistics, and Undecided have the lowest. 20. a. Nominal b. Interval. The observations for Year can be ranked, categorized and measured when using this kind of scale. However, there is no true zero point so we cannot calculate meaningful ratios between years. c. Ratio. This type of scale is the strongest form of measurement. There is a true zero point which allows for the calculation of meaningful ratios between observations. 21. a. The Purchase variable is categorical whereas Income, Age, and Spending variables are numerical. b. The measurement scale is nominal for Purchase and ratio for Income, Age, and Spending. Recall, that the nominal and ratio scales represent the least and most sophisticated levels of measurement, respectively. 22. a. The variable Year is measured on the interval scale because the observations can be ranked, categorized and measured when using this kind of scale. However, there is no true zero point so we cannot calculate meaningful ratios between years. b. The variable Quarter is measured on the nominal scale, even though it contains numbers. It is the least sophisticated level of measurement because if we are presented with nominal data, all we can do is categorize or group the data. c. The variable Vacation is measured on the ratio scale. It is the strongest level of measurement because it allows us to categorize and rank the data as well as find meaningful differences between observations. Also, with a true zero point, we can interpret the ratios between observations.
11-4 © McGraw Hill LLC. All rights reserved. No reproduction or distribution without the prior written consent of McGraw Hill LLC.
23. a. 50 observations of x 2 are equal to two. b. When sorted in ascending order the first observation is x 1 0 and x 2 1 . c. When sorted in descending order the first observation is x 1 1 and x 2 2 . d. When x 1 is sorted in ascending order and x 2 is sorted in descending order, the first observation is x 1 0 and x 2 1 . e. 0 values are missing for x 1 and x 2 . 24. a. 17 observations of x 1 are greater than 30. b. When sorted in ascending order the first observation is x 1 2 , x 2 540 , and
x 3 201 . c. When x and x are sorted in descending order, and x is sorted in ascending order, the first observation is x 1 52 , x 2 218 , and x 3 154 . d. 1 value is missing for x 1 , 3 values are missing for x 2 , and 5 values are missing for x 3 . 25. a. 85 observations of x 4 are less than 3. b. When sorted in ascending order, the first observation is x 1 0.0121 , x 2 24 ,
x 3 27 , and x 4 3 . c. When sorted in descending order, the first observation is x 1 0.9980 ,
x 2 196 , x 3 13 , and x 4 3 . d. 0 values are missing for x 1 , x 2 , x 3 , and x 4 . e. The categorical variable x 4 has three categories: 1, 2 and 3. Category 1 has 40 observations, category 2 has 45 observations, and category 3 has 33 observations. 26. a. There are 25 observations in the subset.
x1 544 ⋮ 186
x2 616 ⋮ 218
x3
x4
5/14/85 ⋮ 3/8/81
1 ⋮ 1
11-5 © McGraw Hill LLC. All rights reserved. No reproduction or distribution without the prior written consent of McGraw Hill LLC.