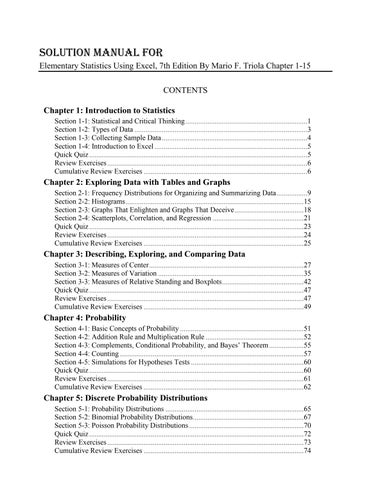
Solution Manual for Elementary Statistics Using Excel, 7th Edition By Mario F. Triola Chapter 1-15 CONTENTS Chapter 1: Introduction to Statistics Section 1-1: Statistical and Critical Thinking ...................................................................1 Section 1-2: Types of Data ...............................................................................................3 Section 1-3: Collecting Sample Data ................................................................................4 Section 1-4: Introduction to Excel ....................................................................................5 Quick Quiz ........................................................................................................................5 Review Exercises ..............................................................................................................6 Cumulative Review Exercises ..........................................................................................6
Chapter 2: Exploring Data with Tables and Graphs Section 2-1: Frequency Distributions for Organizing and Summarizing Data .................9 Section 2-2: Histograms ..................................................................................................15 Section 2-3: Graphs That Enlighten and Graphs That Deceive ......................................18 Section 2-4: Scatterplots, Correlation, and Regression ..................................................21 Quick Quiz ......................................................................................................................23 Review Exercises ............................................................................................................24 Cumulative Review Exercises ........................................................................................25
Chapter 3: Describing, Exploring, and Comparing Data Section 3-1: Measures of Center .....................................................................................27 Section 3-2: Measures of Variation ................................................................................35 Section 3-3: Measures of Relative Standing and Boxplots .............................................42 Quick Quiz ......................................................................................................................47 Review Exercises ............................................................................................................47 Cumulative Review Exercises ........................................................................................49
Chapter 4: Probability Section 4-1: Basic Concepts of Probability ....................................................................51 Section 4-2: Addition Rule and Multiplication Rule ......................................................52 Section 4-3: Complements, Conditional Probability, and Bayes’ Theorem ...................55 Section 4-4: Counting .....................................................................................................57 Section 4-5: Simulations for Hypotheses Tests ..............................................................60 Quick Quiz ......................................................................................................................60 Review Exercises ............................................................................................................61 Cumulative Review Exercises ........................................................................................62
Chapter 5: Discrete Probability Distributions Section 5-1: Probability Distributions ............................................................................65 Section 5-2: Binomial Probability Distributions.............................................................67 Section 5-3: Poisson Probability Distributions ...............................................................70 Quick Quiz ......................................................................................................................72 Review Exercises ............................................................................................................73 Cumulative Review Exercises ........................................................................................74
Chapter 6: Normal Probability Distributions Section 6-1: The Standard Normal Distribution .............................................................77 Section 6-2: Real Applications of Normal Distributions ................................................79 Section 6-3: Sampling Distributions and Estimators ......................................................83 Section 6-4: The Central Limit Theorem ........................................................................87 Section 6-5: Assessing Normality ...................................................................................91 Section 6-6: Normal as Approximation to Binomial (Download Only) .........................94 Quick Quiz ......................................................................................................................97 Review Exercises ............................................................................................................98 Cumulative Review Exercises ........................................................................................99
Chapter 7: Estimating Parameters and Determining Sample Sizes Section 7-1: Estimating a Population Proportion ..........................................................101 Section 7-2: Estimating a Population Mean ..................................................................106 Section 7-3: Estimating a Population Standard Deviation or Variance ........................111 Section 7-4: Bootstrapping: Using Excel for Estimates................................................115 Quick Quiz ....................................................................................................................117 Review Exercises ..........................................................................................................117 Cumulative Review Exercises ......................................................................................119
Chapter 8: Hypothesis Testing Section 8-1: Basics of Hypothesis Testing ...................................................................121 Section 8-2: Testing a Claim About a Proportion .........................................................123 Section 8-3: Testing a Claim About a Mean .................................................................131 Section 8-4: Testing a Claim About a Standard Deviation or Variance .......................136 Section 8-5: Resampling: Using Excel for Hypothesis Testing ....................................140 Quick Quiz ....................................................................................................................141 Review Exercises ..........................................................................................................142 Cumulative Review Exercises ......................................................................................143
Chapter 9: Inferences from Two Samples Section 9-1: Two Proportions .......................................................................................147 Section 9-2: Two Means: Independent Samples ...........................................................158 Section 9-3: Matched Pairs ...........................................................................................168 Section 9-4: Two Variances or Standard Deviations ....................................................176 Section 9-5: Resampling: Using Technology for Inferences ........................................179 Quick Quiz ....................................................................................................................181 Review Exercises ..........................................................................................................182 Cumulative Review Exercises ......................................................................................185
Chapter 10: Correlation and Regression Section 10-1: Correlation ..............................................................................................189 Section 10-2: Regression ..............................................................................................198 Section 10-3: Prediction Intervals and Variation ..........................................................210 Section 10-4: Multiple Regression ................................................................................213 Section 10-5: Nonlinear Regression .............................................................................217 Quick Quiz ....................................................................................................................222 Review Exercises ..........................................................................................................223 Cumulative Review Exercises ......................................................................................224
Chapter 11: Goodness-of-Fit and Contingency Tables Section 11-1: Goodness-of-Fit ......................................................................................229 Section 11-2: Contingency Tables ................................................................................235 Quick Quiz ....................................................................................................................241 Review Exercises ..........................................................................................................242 Cumulative Review Exercises ......................................................................................243
Chapter 12: Analysis of Variance Section 12-1: One-Way ANOVA .................................................................................247 Section 12-2: Two-Way ANOVA ................................................................................249 Quick Quiz ....................................................................................................................251 Review Exercises ..........................................................................................................251 Cumulative Review Exercises ......................................................................................252
Chapter 13: Nonparametric Tests Section 13-2: Sign Test .................................................................................................255 Section 13-3: Wilcoxon Signed-Ranks Test for Matched Pairs....................................257 Section 13-4: Wilcoxon Rank-Sum Test for Two Independent Samples .....................259 Section 13-5: Kruskal-Wallis Test for Three or More Samples ...................................263 Section 13-6: Rank Correlation.....................................................................................266 Section 13-7: Runs Test for Randomness .....................................................................270 Quick Quiz ....................................................................................................................271 Review Exercises ..........................................................................................................272 Cumulative Review Exercises ......................................................................................274
Chapter 14: Statistical Process Control Section 14-1: Control Charts for Variation and Mean ..................................................277 Section 14-2: Control Charts for Attributes ..................................................................279 Quick Quiz ....................................................................................................................284 Review Exercises ..........................................................................................................284 Cumulative Review Exercises ......................................................................................286
Chapter 15: Holistic Statistics Holistic Statistics Exercises ..........................................................................................289
Section 1-1: Statistical and Critical Thinking 1
Chapter 1: Introduction to Statistics Section 1-1: Statistical and Critical Thinking 1. The respondents are a voluntary response sample or a self-selected sample. Because those with strong interests in the topic are more likely to respond, it is very possible that their responses do not reflect the opinions or behavior of the general population. 2. a. The sample consists of the 1046 adults who were surveyed. The population consists of all adults. b. When asked, respondents might be inclined to avoid the shame of the unhealthy habit of not washing their hands, so the reported rate of 70% might well be much higher than it is in reality. It is generally better to observe or measure human behavior than to ask subjects about it. 3. Statistical significance is indicated when methods of statistics are used to reach a conclusion that a treatment is effective, but common sense might suggest that the treatment does not make enough of a difference to justify its use or to be practical. Yes, it is possible for a study to have statistical significance, but not practical significance. 4. No. Correlation does not imply causation. The example illustrates a correlation that is clearly not the result of any interaction or cause effect relationship between per capita consumption of margarine and the divorce rate in Maine. 5. Yes, there does appear to be a potential to create a bias. 6. No, there does not appear to be a potential to create a bias. 7. No, there does not appear to be a potential to create a bias. 8. Yes, there does appear to be a potential to create a bias. 9. The sample is a voluntary response sample and has strong potential to be flawed. 10. The samples are voluntary response samples and have potential for being flawed, but this approach might be necessary due to ethical considerations involved in randomly selecting subjects and somehow imposing treatments on them. 11. The sampling method appears to be sound. 12. The sampling method appears to be sound. 13. The Ornish weight loss program has statistical significance, because the results are so unlikely (3 chances in 1000) to occur by chance. It does not have practical significance because the amount of lost weight (3.3 lb) is so small. 14. Because there is only one chance in a thousand of getting such success rates by chance, the difference does appear to have statistical significance. The 92% success rate for surgery appears to be substantially better than the 72% success rate for splints, so the difference does appear to have practical significance. 15. The difference between Mendel’s 25% rate and the result of 26% is not statistically significant. According to Mendel’s theory, 145 of the 580 peas would have yellow pods, but the results consisted of 152 peas with yellow pods. The difference of 7 peas with yellow pods among the 580 offspring does not appear to be statistically significant. The difference does not appear to have practical significance. 16. Because there is a 25% chance of getting such results with a program that has no effect, the program does not appear to have statistical significance. Because the average increase is only 3 IQ points, the program does not appear to have practical significance. 17. With 40 out of 41 ballots having the Democrat first, it appears that the result is statistically significant. Because of the great advantage enjoyed by Democrats, the results also have practical significance. 18. Because it is so unlikely (0.3%) to get these results by chance, the results have statistical significance. With about 57% (from 235/414) of the coin toss winners going on to win the game, the result appears to have practical significance. 19. There appears to be statistical significance given the large discrepancy between 79.1% and 39%. Because the results are so far from yielding a jury of peers, it appears that the results have practical significance. 20. With only a 0.0000006% chance of getting such results, it appears that the results are statistically significant. The discrepancy between the 61% rate for voters who actually did vote and the 70% rate of those who said that they voted is a fairly large discrepancy, and the results appear to have practical significance.
Copyright © 2022 Pearson Education, Inc.
2
Chapter 1: Introduction to Statistics
21. Yes. Each column of 8 AM and 12 AM temperatures is recorded from the same subject, so each pair is matched. 22. No. The source is from university researchers who do not appear to gain from distorting the data. 23. The data can be used to address the issue of whether there is a correlation between body temperatures at 8 AM and at 12 AM. Also, the data can be used to determine whether there are differences between body temperatures at 8 AM and at 12 AM. 24. Because the differences could easily occur by chance (with a 64% chance), the differences do not appear to have statistical significance. 25. No. The lemon imports are weights in metric tons and the crash fatality rates are fatalities per 100,000 population, so their differences are meaningless. 26. The issue that can be addressed is whether there is a correlation, or association, between lemon imports and crash fatality rates. 27. No. The author of an article for the Journal of Chemical Information and Modeling has no reason to collect or present the data in a way that is biased. 28. No. Correlation does not imply causation, so a statistical correlation between lemon imports and crash fatality rates should not be used to conclude that lemon imports are the cause of fatal crashes. 29. It is questionable that the sponsor is the Idaho Potato Commission and the favorite vegetable is potatoes. 30. The sample is a voluntary response sample, so there is a good chance that the results do not reflect the larger population of people who have a water preference. 31. The correlation, or association, between two variables does not mean that one of the variables is the cause of the other. Correlation does not imply causation. Clearly, sour cream consumption is not directly related in any way to motorcycle fatalities. 32. The sponsor of the poll is an electronic cigarette maker, so the sponsor does have an interest in the poll results. The source is questionable. 33. The correlation, or association, between two variables does not mean that one of the variables is the cause of the other. Correlation does not imply causation. 34. The correlation, or association, between two variables does not mean that one of the variables is the cause of the other. Correlation does not imply causation. 35. The sample is a voluntary response sample, so there is a good chance that the results do not accurately reflect the larger population. 36. Because the nutritionists are paid such large amounts of money, they might be more inclined to find favorable results. It is very possible that the results represent desired outcomes instead of actual outcomes. 37. a. 700 adults b. 55% 38. a. 253.31 subjects b. No. Because the result is a count of people among the 347 who were surveyed, the result must be a whole number. c. 253 subjects d. 32% 39. a. 559.2 respondents b. No. Because the result is a count of respondents among the 1165 engaged or married women who were surveyed, the result must be a whole number. c. 559 respondents d. 8% 40. a. 847.56 drivers b. No. Because the result is a count of respondents saying that they text while driving, the result must be a whole number. c. 848 drivers d. Given that texting while driving is extremely dangerous, the result of 42% of drivers who text while driving is far too high. The result suggests that steps should be taken to substantially lower that rate.
Copyright © 2022 Pearson Education, Inc.