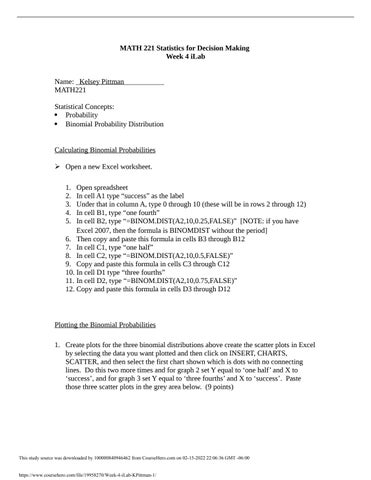
MATH 221 Statistics for Decision Making Week 4 iLab Name: _Kelsey Pittman___________ MATH221 Statistical Concepts: Probability Binomial Probability Distribution Calculating Binomial Probabilities Open a new Excel worksheet. 1. 2. 3. 4. 5.
Open spreadsheet In cell A1 type “success” as the label Under that in column A, type 0 through 10 (these will be in rows 2 through 12) In cell B1, type “one fourth” In cell B2, type “=BINOM.DIST(A2,10,0.25,FALSE)” [NOTE: if you have Excel 2007, then the formula is BINOMDIST without the period] 6. Then copy and paste this formula in cells B3 through B12 7. In cell C1, type “one half” 8. In cell C2, type “=BINOM.DIST(A2,10,0.5,FALSE)” 9. Copy and paste this formula in cells C3 through C12 10. In cell D1 type “three fourths” 11. In cell D2, type “=BINOM.DIST(A2,10,0.75,FALSE)” 12. Copy and paste this formula in cells D3 through D12
Plotting the Binomial Probabilities 1. Create plots for the three binomial distributions above create the scatter plots in Excel by selecting the data you want plotted and then click on INSERT, CHARTS, SCATTER, and then select the first chart shown which is dots with no connecting lines. Do this two more times and for graph 2 set Y equal to ‘one half’ and X to ‘success’, and for graph 3 set Y equal to ‘three fourths’ and X to ‘success’. Paste those three scatter plots in the grey area below. (9 points)
This study source was downloaded by 100000840946462 from CourseHero.com on 02-15-2022 22:06:36 GMT -06:00
https://www.coursehero.com/file/19958270/Week-4-iLab-KPittman-1/
12 10 8 6
one fourth
4 2 0
0
2
4
6
8
10
12
8
10
12
success 12 10 8 one half
6 4 2 0
0
2
4
6 success
This study source was downloaded by 100000840946462 from CourseHero.com on 02-15-2022 22:06:36 GMT -06:00
https://www.coursehero.com/file/19958270/Week-4-iLab-KPittman-1/
12 10 8 one fourth
6 4 2 0
0
2
4
6
8
10
12
success
Calculating Descriptive Statistics You will use the same class survey results that were entered into the worksheet for the Week 2 iLab Assignment for question 2. 2. Calculate descriptive statistics for the variable (Coin) where each of the thirty-five students flipped a coin 10 times. Round your answers to three decimal places and type the mean and the standard deviation in the grey area below. (5 points) Mean: 4.600 Standard deviation: 1.429 Short Answer Writing Assignment – Both the calculated binomial probabilities and the descriptive statistics from the class database will be used to answer the following questions. 3. List the probability value for each possibility in the binomial experiment calculated at the beginning of this lab, which was calculated with the probability of a success being ½. (Complete sentence not necessary; round your answers to three decimal places) (8 points) P(x=0) P(x=1)
0.001 0.010
P(x=6) P(x=7)
0.205 0.117
This study source was downloaded by 100000840946462 from CourseHero.com on 02-15-2022 22:06:36 GMT -06:00
https://www.coursehero.com/file/19958270/Week-4-iLab-KPittman-1/
P(x=2) P(x=3) P(x=4) P(x=5)
0.044 0.117 0.205 0.246
P(x=8) P(x=9) P(x=10)
0.044 0.010 0.001
4. Give the probability for the following based on the calculations in question 3 above, with the probability of a success being ½. (Complete sentence not necessary; round your answers to three decimal places) (8 points) P(x≥1) P(x>1) P(4<x ≤7)
0.999 0.989 0.568
P(x<0) 0 P(x≤4) 0.377 P(x<4 or x≥7) 0.344
5. Calculate (by hand) the mean and standard deviation for the binomial distribution with the probability of a success being ½ and n = 10. Either show work or explain how your answer was calculated. Use these formulas to do the hand calculations: Mean = np, Standard Deviation = (4 points) npq Mean = np: np = (10)(0.5) = 5 MEAN = 5 Standard Deviation =
: q = 1-0.5 = 0.5 (10)(0.5)(0.5) = 2.5 square root of 2.5 =
npq 1.581 STANDARD DEVIATION = 1.581
6. Calculate (by hand) the mean and standard deviation for the binomial distribution with the probability of a success being ¼ and n = 10. Write a comparison of these statistics to those from question 5 in a short paragraph of several complete sentences. Use these formulas to do the hand calculations: Mean = np, Standard Deviation = (4 points)
npq Mean = np: np = (10)(0.25) = 2.5 MEAN = 2.5 Standard Deviation =
: q = 1-0.25 = 0.75 npq = (10)(0.25)(0.75) = 1.875 square npq root 1.875 = 1.369 STANDARD DEVIATION = 1.369 Comparison: The mean, when the probability of success is ½, is higher than the mean with a probability of success of ¼. The standard deviation is also higher when the probability of success is ½, compared to when the probability of success is ¼. This means that when the probability of success is ½ there is a higher average probability of success
This study source was downloaded by 100000840946462 from CourseHero.com on 02-15-2022 22:06:36 GMT -06:00
https://www.coursehero.com/file/19958270/Week-4-iLab-KPittman-1/
but there is also a greater variation than when the probability of success is ¼.
7. Calculate (by hand) the mean and standard deviation for the binomial distribution with the probability of a success being ¾ and n = 10. Write a comparison of these statistics to those from question 6 in a short paragraph of several complete sentences. Use these formulas to do the hand calculations: Mean = np, Standard Deviation = (4 points) npq
Mean = np: np = (10)(0.75) = 7.5 MEAN = 7.5 Standard Deviation =
: q = 1-0.75 = 0.25 npq = (10)(0.75)(0.25) = 1.875 square
npq root 1.875 = 1.369 STANDARD DEVIATION = 1.369 Comparison: The mean, when the probability of success is ¾, is higher than the mean with a probability of success of ¼ as shown in question 6. The standard deviation however is the same when the probability of success is ¾ and ¼. This means the average probability of success is higher when the probability of success is ¾ versus ¼, but the variation is the same.
8. Using all four of the properties of a Binomial experiment (see page 201 in the textbook) explain in a short paragraph of several complete sentences why the Coin variable from the class survey represents a binomial distribution from a binomial experiment. (4 points)
We have a given number of trials (n=10), with a probability of success (p) and can find the probability of failure (q=1-p) from the probability of success. In this experiment there are a fixed number of trials (10), and each trial is independent of the other trials, meaning what the coin flips (heads or tails) will not affect the outcome of the next coin flip. There are only two possible outcomes when flipping the coin, heads or tails and the probability for success is the same for each trial, meaning there is the same probability of flipping heads on the first flip as there is on the second coin flip and so on.
This study source was downloaded by 100000840946462 from CourseHero.com on 02-15-2022 22:06:36 GMT -06:00
https://www.coursehero.com/file/19958270/Week-4-iLab-KPittman-1/