Student: Adam Smith Date: 12/13/16
Instructor: Isaac Raymond Course: MAT-240-Q1653-16EW1
Assignment: 1-3 MyStatLab: Module One Problem Set
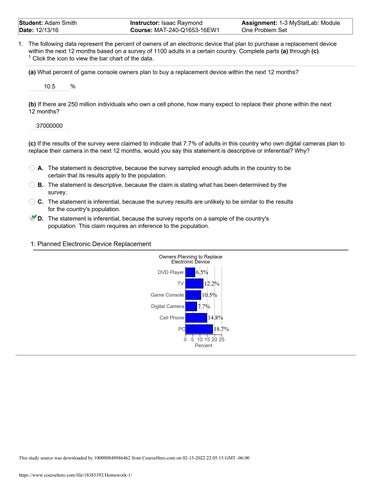
1. The following data represent the percent of owners of an electronic device that plan to purchase a replacement device within the next 12 months based on a survey of 1100 adults in a certain country. Complete parts (a) through (c). 1 Click the icon to view the bar chart of the data. (a) What percent of game console owners plan to buy a replacement device within the next 12 months? 10.5
%
(b) If there are 250 million individuals who own a cell phone, how many expect to replace their phone within the next 12 months? 37000000 (c) If the results of the survey were claimed to indicate that 7.7% of adults in this country who own digital cameras plan to replace their camera in the next 12 months, would you say this statement is descriptive or inferential? Why? A. The statement is descriptive, because the survey sampled enough adults in the country to be certain that its results apply to the population. B. The statement is descriptive, because the claim is stating what has been determined by the survey. C. The statement is inferential, because the survey results are unlikely to be similar to the results for the country's population. D. The statement is inferential, because the survey reports on a sample of the country's population. This claim requires an inference to the population.
1: Planned Electronic Device Replacement Owners Planning to Replace Electronic Device DVD Player
6.5%
TV
12.2%
Game Console
10.5%
Digital Camera Cell Phone PC
7.7% 14.8% 18.7%
0 5 10 15 20 25 Percent
This study source was downloaded by 100000840946462 from CourseHero.com on 02-15-2022 22:05:15 GMT -06:00
https://www.coursehero.com/file/18385392/Homework-1/
2. A library took a survey to find the age distribution of 50 randomly selected new youth members. The results are shown in the table below.
(a) Construct a relative frequency distribution of the data. Age Group
Relative Frequency
Age Group
Number of New Members
3-5
.14
3-5
7
6-8
.24
6-8
12
9-11
.18
9-11
9
12-14
12-14
15
15-17
7
15-17
.3 .14
(b) What percentage of new youth members are in the 6-8 age group? 24
%
(c) What percentage of the new youth members are age 8 or younger? 38
%
This study source was downloaded by 100000840946462 from CourseHero.com on 02-15-2022 22:05:15 GMT -06:00
https://www.coursehero.com/file/18385392/Homework-1/
3. The data to the right represent the number of people from a certain county, aged 5 to 64, who visited an optometrist over the course of last year.
Age
Patients
5-19
2484
20-34
3208
35-49
5798
50-64
6910
(a) Create a relative frequency distribution. (Round to three decimal places as needed.) Age
Relative Frequency
5-19
.135
20-34
.174
35-49
.315 .376
50-64
(b) Create a frequency histogram. Choose the correct answer below. B.
4000 2000 0
20-34
Age
4000 2000
5-19
0
50-64
D.
8000 35-49
6000
20-34
Age
Frequency
8000 35-49
6000 5-19
Frequency
Frequency
8000
C.
8000 35-49
6000 5-19 4000 2000 0
50-64
20-34
Age
Frequency
A.
6000 4000 2000
35-49 5-19
0
50-64
20-34
Age
50-64
(c) Create a relative frequency histogram. Choose the correct answer below.
5-19 20-34
Age
50-64
35-49 5-19
20-34
Age
50-64
0.5 0.4 0.3 0.2 0.1 0
D.
5-19 35-49 20-34
Age
50-64
Relative Frequency
35-49
0.5 0.4 0.3 0.2 0.1 0
C. Relative Frequency
0.5 0.4 0.3 0.2 0.1 0
B. Relative Frequency
Relative Frequency
A.
0.5 0.4 0.3 0.2 0.1 0
(d) What percentage of patients were between 35 and 49? 31.5 % (Round to the nearest tenth as needed.) (e) What percentage of patients were 34 or younger? 30.9 % (Round to the nearest tenth as needed.)
This study source was downloaded by 100000840946462 from CourseHero.com on 02-15-2022 22:05:15 GMT -06:00
https://www.coursehero.com/file/18385392/Homework-1/
5-19
35-49
20-34
Age
50-64
4. The accompanying data represent the percentage of recent high school graduates (graduated within 12 months before the given year-end) who enrolled in college in the fall. Construct a time-series plot and comment on any trends. 2 Click the icon to view the data table. Choose the correct time-series plot below. A.
B. College Enrollment
College Enrollment
64
58 1989
1997
70 Percent Enrolled
70 Percent Enrolled
70 Percent Enrolled
C. College Enrollment
64
58 1989
2005
Year
1997
64
58 1989
2005
Year
1997
2005
Year
Comment on any trends. Choose the correct comment below. A. The percentage of high school graduates who enrolled in college has generally decreased, though there have been some up years. B. There are not any trends. C. The percentage of high school graduates who enrolled in college has generally increased, though there have been some down years.
2: College Enrollment Full data set Year
Percent Enrolled
Year
Percent Enrolled
1989
59.6
1998
65.6
1990
60.1
1999
62.9
1991
62.3
2000
63.3
1992
61.7
2001
61.5
1993
62.5
2002
65.2
1994
61.7
2003
63.9
1995
61.7
2004
66.7
1996
65.5
2005
68.4
1997
67.5
5. For a large sporting event the broadcasters sold 62 ad slots for a total revenue of $144 million. What was the mean price per ad slot? The mean price per ad slot was $ 2.3 (Round to one decimal place as needed.)
million.
This study source was downloaded by 100000840946462 from CourseHero.com on 02-15-2022 22:05:15 GMT -06:00
https://www.coursehero.com/file/18385392/Homework-1/
6. The following data represent the monthly cell phone bill for a person's phone for six randomly selected months. $35.34, $42.09, $39.47, $38.99, $43.39, $49.26 Compute the mean, median, and mode phone bill. The mean phone bill is $ The median phone bill is $
41.42
. (Round to the nearest cent as needed.)
40.78
. (Round to the nearest cent as needed.)
Compute the mode phone bill. Choose the correct answer below. A. The mode phone bill is $43.39. B. The mode phone bill is $35.34. C. The mode phone bill is $39.47. D. There is no mode phone bill. 7. A random sample of 15 college students were asked "How many hours per week typically do you work outside the home?" Their responses are shown on the right. Determine the shape of the distribution of hours worked by drawing a frequency histogram and computing the mean and median. Which measure of central tendency better describes hours worked?
7
33
1
7
9
13
18
14
19
15
10
27
12
8
12
Choose the correct frequency histogram below. B.
4 2 0
Hours Worked per Week Frequency
Frequency
Hours Worked per Week
0
10
20 30
hours
C.
4 2 0
Hours Worked per Week Frequency
A.
0
10
20 30
4 2 0
0
10
hours
20 30
hours
Is the histogram for the data set skewed right, skewed left, or symmetric? skewed right skewed left symmetric The mean number of hours worked by college students outside the home is approximately (Type an integer or decimal rounded to three decimal places as needed.)
13.667
The median number of hours worked by college students outside the home is
hours.
Which measure of central tendency better describes hours worked? median mode mean
This study source was downloaded by 100000840946462 from CourseHero.com on 02-15-2022 22:05:15 GMT -06:00
https://www.coursehero.com/file/18385392/Homework-1/
12
hours.