9/12/2018
hw03
Homework 3: Table Manipulation and Visualization Reading: Visualization (https://www.inferentialthinking.com/chapters/07/visualization.html)
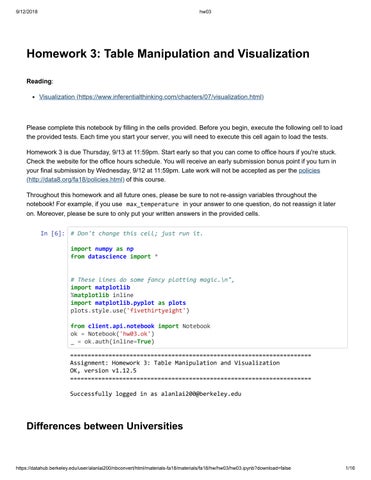
Please complete this notebook by filling in the cells provided. Before you begin, execute the following cell to load the provided tests. Each time you start your server, you will need to execute this cell again to load the tests. Homework 3 is due Thursday, 9/13 at 11:59pm. Start early so that you can come to office hours if you're stuck. Check the website for the office hours schedule. You will receive an early submission bonus point if you turn in your final submission by Wednesday, 9/12 at 11:59pm. Late work will not be accepted as per the policies (http://data8.org/fa18/policies.html) of this course. Throughout this homework and all future ones, please be sure to not re-assign variables throughout the notebook! For example, if you use max_temperature in your answer to one question, do not reassign it later on. Moreover, please be sure to only put your written answers in the provided cells. In [6]: # Don't change this cell; just run it. import numpy as np from datascience import * # These lines do some fancy plotting magic.\n", import matplotlib %matplotlib inline import matplotlib.pyplot as plots plots.style.use('fivethirtyeight') from client.api.notebook import Notebook ok = Notebook('hw03.ok') _ = ok.auth(inline=True) ===================================================================== Assignment: Homework 3: Table Manipulation and Visualization OK, version v1.12.5 ===================================================================== Successfully logged in as alanlai200@berkeley.edu
Differences between Universities
https://datahub.berkeley.edu/user/alanlai200/nbconvert/html/materials-fa18/materials/fa18/hw/hw03/hw03.ipynb?download=false
1/16
9/12/2018
hw03
Question 1. Suppose you're choosing a university to attend, and you'd like to quantify how dissimilar any two universities are. You rate each university you're considering on several numerical traits. You decide on a very detailed list of 1000 traits, and you measure all of them! Some examples: The cost to attend (per year). The average Yelp review of nearby Thai restaurants. The USA Today ranking of the Medical school. The USA Today ranking of the Engineering school. You decide that the dissimilarity between two universities is the total of the differences in their traits. That is, the dissimilarity is: the sum of the absolute values of the 1000 differences in their trait values. In the next cell, we've loaded arrays containing the 1000 trait values for Stanford and Berkeley. Compute the dissimilarity (according to the above technique) between Stanford and Berkeley. Call your answer dissimilarity . Use a single line of code to compute the answer. Note: The data we're using aren't real -- we made them up for this exercise, except for the cost-of-attendance numbers, which were found online.
In [7]: stanford = Table.read_table("stanford.csv").column("Trait value") berkeley = Table.read_table("berkeley.csv").column("Trait value") dissimilarity = sum(abs(stanford-berkeley)) dissimilarity Out[7]: 14060.558701067917 In [8]: _ = ok.grade('q1_1') ~~~~~~~~~~~~~~~~~~~~~~~~~~~~~~~~~~~~~~~~~~~~~~~~~~~~~~~~~~~~~~~~~~~~~ Running tests --------------------------------------------------------------------Test summary Passed: 1 Failed: 0 [ooooooooook] 100.0% passed
Question 2. Why do we sum up the absolute values of the differences in trait values, rather than just summing up the differences?
https://datahub.berkeley.edu/user/alanlai200/nbconvert/html/materials-fa18/materials/fa18/hw/hw03/hw03.ipynb?download=false
2/16
9/12/2018
hw03
When subtracting the differences in trait value, the value can be either positive or negative. But our goal is to determine the dissimilarity so a -4 trait means that Berkeley is higher for that item and +4 trait value means that Standford is higher for that item but both value show the same value for dissimilarity.
Weighing the traits After computing dissimilarities between several schools, you notice a problem with your method: the scale of the traits matters a lot. Since schools cost tens of thousands of dollars to attend, the cost-to-attend trait is always a much bigger number than most other traits. That makes it affect the dissimilarity a lot more than other traits. Two schools that differ in cost-to-attend by $900 , but are otherwise identical, get a dissimilarity of 900. But two schools that differ in graduation rate by 0.9 (a huge difference!), but are otherwise identical, get a dissimilarity of only 0.9. One way to fix this problem is to assign different "weights" to different traits. For example, we could fix the problem above by multiplying the difference in the cost-to-attend traits by .001, so that a difference of $900 in the attendance cost results in a dissimilarity of $900 × .001, or 0.9. Here's a revised method that does that for every trait: 1. For each trait, subtract the two schools' trait values. 2. Then take the absolute value of that difference. 3. Now multiply that absolute value by a trait-specific number, like .001 or 2 . 4. Now, sum the 1000 resulting numbers. Question 3. Suppose you've already decided on a weight for each trait. These are loaded into an array called weights in the cell below. weights.item(0) is the weight for the first trait, weights.item(1) is the weight for the second trait, and so on. Use the revised method to compute a revised dissimilarity between Berkeley and Stanford. Hint: Using array arithmetic, your answer should be almost as short as in question 1. In [9]: weights = Table.read_table("weights.csv").column("Weight") revised_dissimilarity = sum(abs(stanford-berkeley) * weights) revised_dissimilarity Out[9]: 505.98313211458805 In [10]: _ = ok.grade('q1_3') ~~~~~~~~~~~~~~~~~~~~~~~~~~~~~~~~~~~~~~~~~~~~~~~~~~~~~~~~~~~~~~~~~~~~~ Running tests --------------------------------------------------------------------Test summary Passed: 1 Failed: 0 [ooooooooook] 100.0% passed
https://datahub.berkeley.edu/user/alanlai200/nbconvert/html/materials-fa18/materials/fa18/hw/hw03/hw03.ipynb?download=false
3/16
9/12/2018
hw03
2. Unemployment The Federal Reserve Bank of St. Louis publishes data about jobs in the US. Below, we've loaded data on unemployment in the United States. There are many ways of defining unemployment, and our dataset includes two notions of the unemployment rate: 1. Among people who are able to work and are looking for a full-time job, the percentage who can't find a job. This is called the Non-Employment Index, or NEI. 2. Among people who are able to work and are looking for a full-time job, the percentage who can't find any job or are only working at a part-time job. The latter group is called "Part-Time for Economic Reasons", so the acronym for this index is NEI-PTER. (Economists are great at marketing.) The source of the data is here (https://fred.stlouisfed.org/categories/33509).
Question 1. The data are in a CSV file called unemployment.csv . Load that file into a table called unemployment . In [11]: unemployment = Table.read_table("unemployment.csv") unemployment Out[11]:
Date
NEI
NEI-PTER
1994-01-01
10.0974
11.172
1994-04-01
9.6239
10.7883
1994-07-01
9.3276
10.4831
1994-10-01
9.1071
10.2361
1995-01-01
8.9693
10.1832
1995-04-01
9.0314
10.1071
1995-07-01
8.9802
10.1084
1995-10-01
8.9932
10.1046
1996-01-01
9.0002
10.0531
1996-04-01
8.9038
9.9782
... (80 rows omitted)
https://datahub.berkeley.edu/user/alanlai200/nbconvert/html/materials-fa18/materials/fa18/hw/hw03/hw03.ipynb?download=false
4/16
9/12/2018
hw03
In [12]: _ = ok.grade('q2_1') ~~~~~~~~~~~~~~~~~~~~~~~~~~~~~~~~~~~~~~~~~~~~~~~~~~~~~~~~~~~~~~~~~~~~~ Running tests --------------------------------------------------------------------Test summary Passed: 1 Failed: 0 [ooooooooook] 100.0% passed
Question 2. Sort the data in descending order by NEI, naming the sorted table by_nei . Create another table called by_nei_pter that's sorted in descending order by NEI-PTER instead. In [13]: by_nei = unemployment.sort("NEI", descending=True) by_nei_pter = unemployment.sort("NEI-PTER", descending=True) In [14]: _ = ok.grade('q2_2') ~~~~~~~~~~~~~~~~~~~~~~~~~~~~~~~~~~~~~~~~~~~~~~~~~~~~~~~~~~~~~~~~~~~~~ Running tests --------------------------------------------------------------------Test summary Passed: 1 Failed: 0 [ooooooooook] 100.0% passed
Question 3. Use take to make a table containing the data for the 10 quarters when NEI was greatest. Call that table greatest_nei .
https://datahub.berkeley.edu/user/alanlai200/nbconvert/html/materials-fa18/materials/fa18/hw/hw03/hw03.ipynb?download=false
5/16