Cases For Foundations Of Financial Management 12th Edition Stanley B Block, Geoffrey A Hirt Case 1-19 All Cases In one document Case 1 Harrod's Sporting Goods Ratio Analysis Purpose: The case allows the student to examine ratio analysis within the context of a customer-banking arrangement. The firm has a disagreement with the bank over how much it should be paying in relation to prime (no prior knowledge of banking is required for the case). An item of particular interest is the impact of an extraordinary loss on the firm's income statement. It has a major effect on the analysis of the company. Industry comparisons also are utilized. Relation to Text: The case should follow Chapter 3. Complexity: The case is moderately complex. It should require 1 to 1½ hours.
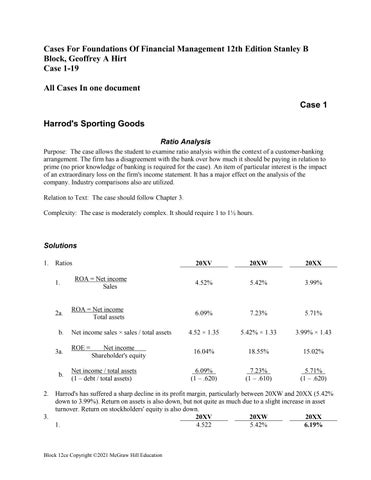
Solutions 1. Ratios
20XV
20XW
20XX
1.
ROA = Net income Sales
4.52%
5.42%
3.99%
2a.
ROA = Net income Total assets
6.09%
7.23%
5.71%
b.
Net income sales × sales / total assets
4.52 × 1.35
5.42% × 1.33
3.99% × 1.43
16.04%
18.55%
15.02%
6.09% (1 – .620)
7.23% (1 – .610)
5.71% (1 – .620)
3a.
b.
ROE =
Net income Shareholder's equity
Net income / total assets (1 – debt / total assets)
2. Harrod's has suffered a sharp decline in its profit margin, particularly between 20XW and 20XX (5.42% down to 3.99%). Return on assets is also down, but not quite as much due to a slight increase in asset turnover. Return on stockholders' equity is also down. 3. 20XV 20XW 20XX 1. 4.522 5.42% 6.19%
Block 12ce Copyright ©2021 McGraw Hill Education
ROA = Net income Sales 2a.
Net income Total assets
b.
Net income sales x sales / total assets
3a.
b.
6.09%
7.23%
8.85%
4.52 × 1.35
5.42% × 1.33
6.19% × 1.43
Net income Shareholder's equity
16.04%
18.55%
23.30%
Net income / total assets (1 – debt / total assets)
6.09% (1 – .620)
7.23% (1 – .610)
8.85% (1 – .620)
4. After eliminating the effect of the nonrecurring extraordinary loss, the trend is clearly up over all three years. Particularly impressive is the increase in return on shareholders' equity from 16.04% in 20XV to 23.30% in 20XX. 5. Harrod has a clear superiority in the profit margin (6.19% vs. 4.51%). This is further enhanced by a more rapid asset turnover (1.43 vs. 1.13) to give an even more superior return on total assets (8.85% vs. 5.1%). Finally, return on shareholders' equity greatly benefits from a higher debt ratio (62% vs. 48%) to provide an even larger gap between the firm and the industry (23.30% vs. 9.80%). While debt is not necessarily good, it has hiked up the return on equity to well over twice the industry figure.
6. Ratios
20XX
Industry
1.
Sales Receivables
6.31
5.75
2.
Sales Inventory
4.75
3.01
3.
Sales Capital assets
2.77
3.20
Harrod's is clearly superior to the industry in receivables turnover (6.31 vs. 5.75) and inventory turnover (4.75 vs. 3.01) and this more than compensates for a lower sales to fixed assets ratio (2.77 vs. 3.20). 7. Becky would appear to have strong grounds for a complaint. It appears that the banker was using unadjusted income statement numbers to arrive at the conclusion that Harrod's was on a downward trend in terms of the profitability ratios. Also, using unadjusted data the profit margin was below the industry average. However, the inferior performance was due to an extraordinary, nonrecurring loss. In terms of normal operating performance, the company is clearly on an upward trend and well above the industry averages on all counts. One percent over prime appears to be much more reasonable than 2½ percent over prime.
Block 12ce Copyright ©2021 McGraw Hill Education
Genuine Motor Products
Case 2 Combined Leverage
Purpose: The case illustrates the potential impact on a company when it goes from dependence on labour intensive variable costs to fixed cost automation. The effects are further highlighted when the new equipment is heavily financed by debt. The upside is emphasized through increased earnings per share, while the downside is related to a higher break-even level (an expanded definition of cash flow breakeven is introduced and very carefully explained). Not only are earnings per share and break-even covered, but so are all the various measures of degree of leverage. In addition to numerous calculations, the student is called upon to make judgmental decisions as an aggressive industrial engineer comes into conflict with a conservative chief financial officer. Relation to Text: The case should follow Chapter 5. Complexity: The case is moderately complex. It should require 1 – 1½ hours.
Solutions 1. Figure 4 Sales (1,000,000 units @ $30 per unit) .................................................................................... $30,000,000 Total variable costs (1,000,000 units @ $18.80 per unit) .....................................................18,800,000 Contribution margin 11,200,000 Fixed costs* .......................................................................................................................... 5,800,000 Operating income (EBIT) ......................................................................................................... 5,400,000 Interest (10.75% x $12,000,000) .......................................................................................... 1,290,000 Earnings before taxes (EBT) .................................................................................................... 4,110,000 Taxes (35%) ......................................................................................................................... 1,438,500 Earnings after taxes .................................................................................................................. 2,671,500 Shares ....................................................................................................................................... 2,320,000 Earnings per share .................................................................................................................... $1.15 *Fixed costs include $2,800,000 in amortization. 2. The first reason earnings per share has increased from $0.91 to $1.15 relates to automation. That is even though fixed costs have gone up, total variable costs have gone down by even more. Thus, automation has produced an increase in operating income from $3,000,000 to $5,400,000. This first reason relates to the use of operating leverage. A second reason is that the $14 million increase in fixed assets was heavily financed by debt rather than equity. Out of $14 million of new financing, $10 million was in debt and only $4 million in new shares. The second reason relates to the use of financial leverage.
Block 12ce Copyright ©2021 McGraw Hill Education
Before (Figure 2)
After (Figure 4)
Before (Figure 2)
After (Figure 4)
Before (Figure 2)
After (Figure 4)
Before (Figure 2)
After (Figure 4)
$2,000 ,000 $30 $25
$5,800 ,000 $30 $18.80
$2,000 ,000 400 ,000 units $5
$5,800 ,000 517 ,857 units $11.20
Financial BE = Interest rate % × Assets financed Before BE = 10.75% ($24,000,000) = $2,580,000 EBIT
Block 12ce Copyright ©2021 McGraw Hill Education
After new assets purchased = 10.75% ($38,000,000) = $4,085,000 EBIT
Block 12ce Copyright ©2021 McGraw Hill Education