02/Case 1 - Pelican Stores/BSTAT_02_Case1_PelicanStores.xlsx Sheet: &UnStack; Sheet: &DataIndices; Sheet: &DataCopy; Sheet: &GraphData; Sheet: &WorkArea; Sheet: &Miscel;_Area Sheet: Data
d of Payment
Items
Gender
Marital Status
Age
an Express
7
Female
Married
50
an Express
3
Female
Married
46
er
1
Male
Married
32
er
3
Female
Married
40
er
1
Female
Single
78
er
2
Female
Married
54
American Expr
Card
2
Female
Married
34
Discover
Card
1
Female
Married
44
MasterCard
Card
2
Female
Married
32
Proprietary Ca
Card
2
Female
Married
28
Visa
Card
5
Female
Married
56
Card
1
Male
Single
36
Card
1
Female
Married
46
Number of Item
Card
9
Female
Married
46
Bin
Card
2
Female
Married
32
1-3
3
Card
4
Female
Married
46
4-6
6
Card
4
Female
Married
32
7-9
9
Card
2
Female
Married
68
10 - 12
12
Card
6
Female
Single
48
13 - 15
15
Card
1
Female
Married
44
16 - 18
18
tary Card
1
Female
Married
36
tary Card
1
Female
Married
32
tary Card
5
Female
Married
28
tary Card
2
Female
Married
30
1. Percent frequency distribution for key variables
Method of pay
Type of custom
tary Card
2
Female
Married
46
Promotional
tary Card
1
Female
Married
36
Regular
tary Card
1
Female
Married
48
tary Card
1
Female
Married
40
tary Card
2
Male
Single
36
tary Card
3
Female
Single
22
American Expr
tary Card
6
Female
Married
56
Discover
s
2. Bar chart of customer purchases by method of payment
Sheet: Crosstab
Column Labels Promotional
Regular
Grand Total
39.5
39.5
Type of Customer
Net Sa
102.4
Promotional
5900.3
22.5
Regular
1859.7
102.4 22.5 100.4
100.4 54
54
44.5
44.5
78
78 22.5
56.52
22.5 56.52
44.5
44.5
29.5
29.5
31.6
31.6
160.4
160.4
64.5
64.5 49.5
49.5
71.4
71.4
94
94 54.5
54.5
38.5
38.5
44.8
44.8
31.6
31.6
70.82
70.82
266
266 74
74
3. Crosstabulation of Type of Customer vs Net Sales
7760.0
39.5
39.5
30.02
30.02 44.5
192.8
44.5 192.8
Sheet: ScatterDiagram Age
Net Sales
50
266
46
66
32
39.5
40
54.5
78
58
54
89
34
54
44
44.5
32
38.5
28
63.2
56
105.5
36
29.5
46
25
46
145.2
32
49.5
46
65.2
32
58
68
78
48
144
44
39.5
36
102.4
32
22.5
28
100.4
30
78
46
56.52
36
44.5
48
29.5
40
31.6
36
71.4
22
94
4. Scatter Diagram
56
44.8
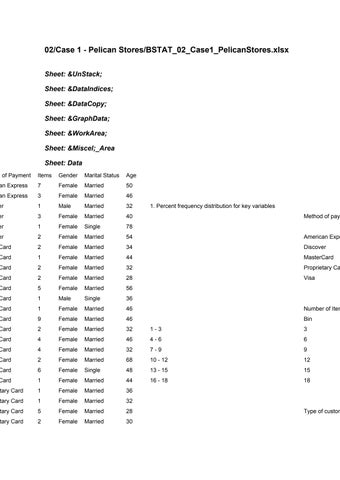
02/Case 1 - Pelican Stores/BSTAT_02_Case1_PelicanStores_Report.docx Pelican Stores Pelican Stores, a division of National Clothing is a chain of women’s apparel stores operating throughout the country. The chain ran a promotion offering discounts to customers of other National Clothing stores. The discount coupons were not offered to regular customers. Sales made to people presenting the promotional coupons were considered sales that would not have otherwise been made. Percent Frequency Distributions for Key Variables Table 1 presents a frequency distribution for method of payment. The proprietary card was used 70% of the time indicating purchases were made by regular customers. Figure 1 presents the method of payment as a histogram. Table 2 presents a frequency distribution for number of items purchased. The majority of customers purchased 1 to 3 items (66%). Since 70% of customers were regular customers, they tended to purchase fewer items as there was no discount. Twenty-six percent (26%) of customers purchased between 4 and 6 items. The promotional discount may have encouraged these customers to purchase additional items they would not normally purchase. Only 8% of customers purchased 7 or more items. These 8 customers took full advantage of the promotional discount. Table 3 presents a frequency distribution for type of customer. Seventy percent (70%) of customers were customers with the promotional discount. Since (as indicated in Table 1) 70% of customers used the proprietary card, some of the regular customers made purchases using a promotional discount. Crosstabulation of Type of Customer versus Net Sales Examination of a cross tabulation of type of customer versus net sales (see Appendix A) reveals that promotional customers in general spent more on purchases than regular customers. In fact, 5900 of the 7760 (76%) of the total sales were made by customers with promotional discounts. Scatter Diagram of Relationship Between Customer Age and Net Sales Figure 2 presents a scatter diagram of the relationship between customer age and net sales. Customers range in age from 20 to approximately 80. There are more customers in the 25 to 45 age range. There does not appear to be a relationship between age and net sales. This report presents results based on a preliminary investigation of customer purchases at Pelican Stores when a promotional discount was offered. Where appropriate suggestions have been made that could indicate the value of the promotional discount to sales. In summary, customers with promotional discounts spent more on purchases than regular customers. However, based on the number of proprietary card purchases there were regular customers also using the promotional discount. Appendix A – Crosstabulation of Type of Customer versus Net Sales