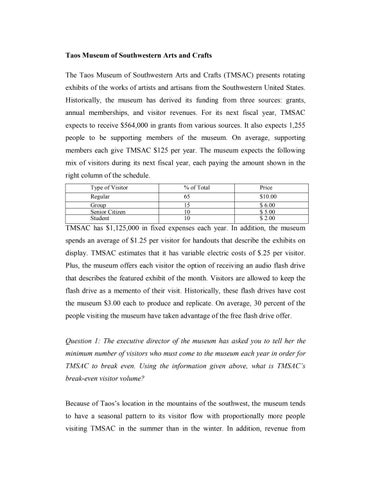
Taos Museum of Southwestern Arts and Crafts The Taos Museum of Southwestern Arts and Crafts (TMSAC) presents rotating exhibits of the works of artists and artisans from the Southwestern United States. Historically, the museum has derived its funding from three sources: grants, annual memberships, and visitor revenues. For its next fiscal year, TMSAC expects to receive $564,000 in grants from various sources. It also expects 1,255 people to be supporting members of the museum. On average, supporting members each give TMSAC $125 per year. The museum expects the following mix of visitors during its next fiscal year, each paying the amount shown in the right column of the schedule. Type of Visitor Regular Group Senior Citizen Student
% of Total 65 15 10 10
Price $10.00 $ 6.00 $ 5.00 $ 2.00
TMSAC has $1,125,000 in fixed expenses each year. In addition, the museum spends an average of $1.25 per visitor for handouts that describe the exhibits on display. TMSAC estimates that it has variable electric costs of $.25 per visitor. Plus, the museum offers each visitor the option of receiving an audio flash drive that describes the featured exhibit of the month. Visitors are allowed to keep the flash drive as a memento of their visit. Historically, these flash drives have cost the museum $3.00 each to produce and replicate. On average, 30 percent of the people visiting the museum have taken advantage of the free flash drive offer.
Question 1: The executive director of the museum has asked you to tell her the minimum number of visitors who must come to the museum each year in order for TMSAC to break even. Using the information given above, what is TMSAC’s break-even visitor volume? Because of Taos’s location in the mountains of the southwest, the museum tends to have a seasonal pattern to its visitor flow with proportionally more people visiting TMSAC in the summer than in the winter. In addition, revenue from
grants and memberships tends to flow into the museum unevenly throughout the year. The seasonal flow of visitor, grants, and membership revenues is distributed throughout the year as follows:
Visitor Revenue Membership
Quarter 15% 1 40%
Quarter 25% 2 20%
Quarter 45% 3 20%
Quarter 15% 4 20%
25%
50%
10%
15%
Revenue Grant Revenue
Fixed expenses are distributed evenly throughout the year, that is, 25 percent per quarter. The museum’s marketing director forecasts that 80,000 people will visit the museum during the coming fiscal year. TMSAC’s director of marketing has convinced the executive director that a museum shop can be operated profitably in a small space just off the main entrance. She agrees, and the shop is scheduled to open on the first day of the second quarter. The marketing director estimates that 5 percent of the people who visit the museum will make purchases from the shop. Based on his experience, he expects the average purchase to be $40. TMSAC’s business manager estimates that the cost of goods sold will be 75 percent of the museum shop’s sales revenue. The shop will be staffed by volunteers at no cost to TMSAC for the upcoming fiscal year.
Question 2. Using the information above, including the gift shop, prepare a budget of revenues, support, and expenses for TMSAC for each of the four quarters of the fiscal year, and summarize the budget for the full year. Question 3. What impact would the inclusion of the gift shop have on TMSAC’s expected break-even volume during a normal full year of operation? You may assume that all other costs remain the same.
At the end of the third quarter, the executive director learned that the museum
hosted 42,000 visitors for the quarter, as shown in the table below.
Type of Regular Visitor Group Senior Student Citizen Total
Actual Visitor 17,640 Mix 7,560 9,660 7,140 42,000
Her expense report showed that TMSAC spent $45,570 on flash drives for the period and that 14,700 flash drives were distributed. She knows that some unexpected things must have happened during the quarter because the numbers on the budget you prepared for her and the actual results that she sees on her thirdquarter financial statements don’t match. She wants you to tell her why these differences have occurred.
Question 4. Using the information above and the TMSAC budget that you prepared for the third quarter, prepare two variance analyses. Be sure to indicate whether each of the variances was favorable or unfavorable. a.
In the first variance analysis, look into the differences between budgeted and actual visitor revenues during the third quarter. You may assume that each type of visitor paid the amount they were expected to pay.
b.
Focus the second analysis on the variance in flash drive expenses.
c.
Explain to the executive director what has caused each of these third-quarter differences between the budgeted and actual revenues and expenses. Provide her with as much detail as you can given the available information; that is, calculate the volume, price, and quantity variances for both visitor revenues and flash drive expenses.
d.
Are these variances large enough to have a significant impact on TSMAC’s operations?
TMSAC has just been approached by the curator of special exhibits at the Smithsonian Museum. The Smithsonian has offered to lend TMSAC a rare collection of nineteenth- century Navaho crafts. The collection would remain at
the museum for a five-year period after which it would be returned to the Navaho nation. To house the exhibit, TMSAC will have to upgrade its environmental and security systems at a one-time cost of $300,000. Since this may be the last time that this collection will be exhibited in its entirety, the executive director is enthusiastic about the impact that it will have on visitor volume and the reputation of the museum. The marketing director forecasts that 700 incremental visitors are likely to be drawn to the museum each month that the exhibit is at TMSAC. The executive director wants you to tell her if the exhibit is financially selfsufficient or if she will need to get a grant to support it. You know that TMSAC’s cost of capital is 9 percent. You also know the marginal contribution generated by each incremental visitor to the museum from your work on the break-even analysis. Do not count on any gift shop purchases from the incremental visitors.
Question 5: What do you tell her? Can TMSAC afford to show the exhibit based solely on the marginal contribution from incremental visitors? If the exhibit is not financially self-sufficient, how large a grant will TMSAC need to get to meet the projected shortfall? Support your recommendation and present your findings in a way that the executive director will understand.
Taos Museum of Southwestern Arts and Crafts Input: When building spreadsheet models, it is good modeling practice to identify all of the data that you will be inputting into the model and isolate it in a separate worksheet or at the top of the worksheet where you intend to build your analytical model. The inputs for the Taos Museum case are shown in the Excel excerpts below. To tie the inputs to each of the questions in the case, the input data for each question is in a separate spreadsheet excerpt and labeled to show the problems the data relates to.
Type of Visitor Regular Group Senior Citizen Student
% of Total 65% 15% 10% 10%
Price $ $ $ $
10.00 6.00 5.00 2.00
Inputs Grant Revenue Memberships - Number Average Member Donation Membership Revenue Fixed Expenses Cost per Handout Utility Cost per visitor Cost per Tour Tape % of people who take Tour Tapes Cost per Handout % of Visitors Who Will Buy at Gift Shop Average Gift-Shop Purchase Cost of Goods Sold as % of revenue Total Annual Visitors
Seasonal Distribution of Revenues, Expenses & Visitors Visitors as % of Total Number of Visitors Membership Revenue Grant Revenue Fixed Costs
$
564,000 1,255 $125 $ 156,875 $ 1,125,000 $ 0.75 $ 0.25 $ 3.00 30% $ 1.25 5% $ 40.00 75% 80,000
Quarter 1
Quarter 2
15% 12,000 40% 25% 25%
25% 20,000 20% 50% 25%
Quarter 3
Variance Inputs Actual Third Quarter Visitors Total Tapes Distributed Percent of People Taking Tapes Total Tape Expenses Average Cost per Tape
$ $
Regular Group Senior Citizen Student Total
Actual Visitor Mix 17,640 7,560 9,660 7,140 42,000
45% 36,000 20% 10% 25%
Quarter 4 15% 12,000 20% 15% 25%
42,000 14,700 35% 45,570 3.10
Question 1 asks you to find the number of visitors TMSAC will need to attract in the coming fiscal year to break even (Chapter 4). This is another variation on a standard break-even problem. Here, fixed costs are partially offset by $156,875 in fixed revenues from members (1,255 members x $125 each) and expected grant revenue of $564,000. The formula for Break-Even Quantity net of fixed revenues is as follows: Fixed Cost - Fixed Revenues