The purpose of this commentary is to share insights on global demand, supply from Marlborough, forecasted Sauvignon Blanc carryover inventory levels, and Marlborough Sauvignon Blanc grape price trends.
There are two key components of the NZ wine industry: consumers enjoy the unique taste of the wine and nature provides Marlborough with growing conditions to produce grapes that create the taste. A clear strategy, flexibility, and laser focus in execution of plans will determine how value is created from the two key components.
Global wine consumption has been trending to white wines and lighter styles like the unique taste of Sauvignon Blanc. The volume decline in global wine consumption is due to red wine as white wine has been in steady growth for two decades. Moderation trends due to lifestyle and affordability continue be a challenge however, some consumers seek to “drink less, but better” consuming wine less frequently but purchasing at higher price points. This is an encouraging trend to grow revenues from consumers trading up into higher retail price points.
Due to the two key components, the NZ wine industry has a robust foundation however within the current cycle to sell profitably has become the biggest challenge (despite favourable currency movements).
The post inflationary period (2021-2024) has resulted in higher input costs and alcohol taxes, placing pressure on margins and operating cashflow. The ability to recover margin through price appreciation has been limited due to global customers facing similar commercial challenges combined with the NZ wine oversupply position. This position has increased risk to revenue streams due to competitor discounting, making it difficult to maintain sales volumes at current pricing levels or to implement and hold price increases to improve profit margin.
As wine businesses calibrate their future inventory levels the revenue risk flows to grape growers through lower grape pricing combined with supply caps from vintage 2026.
KEY INSIGHTS:
1. Marlborough grape supply for vintage 2025 was 410k tonnes, 31% or 97k tonnes above vintage 2024 and 20% or 68k tonnes above our target of 342k T (the target was set to improve demand supply equilibrium).
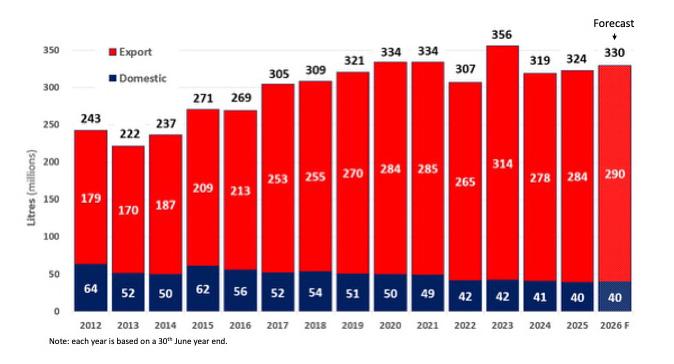
2. Global demand for New Zealand wine has plateaued in recent years, since financial year 2019-2025 global sales volumes at 324ML have grown 0.1% per year. FY26-27 is forecast to grow 2% to 330ML, this forecast is conservative acknowledging risk within the current trading environment and incremental export volumes of bulk wine (above forecast) will be dispatched at lower prices.
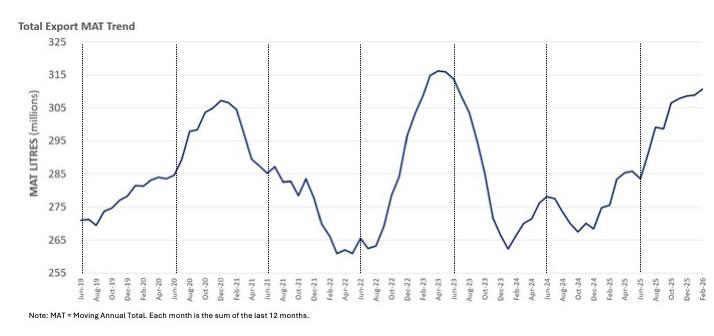
3. NZ Wine export February 2026 MAT is $2.14 billion, this has increased 4% (+$74m) year on year. Resulting from a 13% increase in volume and an 8% decline in the $ per litre $6.85 LT (from both packaged and non-packaged exports).
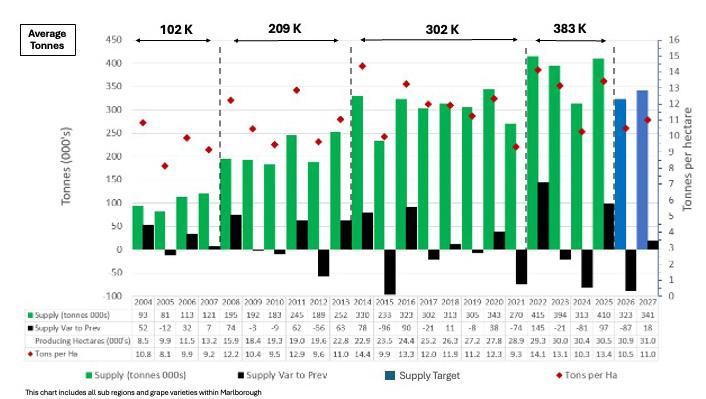
4. A step change in supply (all varieties) from Marlborough began in vintage 2022. The average tonnes between vintage 2022-2025 is 383k tonnes, a 27% or 81k tonne increase above the vintage 2014-2021 average. This step change in supply is primarily from growth in producing hectares which is forecast to grow between 2026-2028.
5. There is a direct correlation between demand, supply and the Marlborough Sauvignon Blanc grape pricing. After three record harvests in 2022, 2023 and 2025 combined with a levelling in demand volume the oversupply position increased. The directional decline in grape pricing is forecast to continue and will be dependent on individual wine businesses deciding their supply strategies as they the work towards aligning supply with demand.
6. Sauvignon Blanc carryover inventory levels increase to 58ML arising from the V25 Marlborough harvest. To achieve manageable carryover inventory levels export volume would need to increase by 18ML above the current export MAT (February Export MAT 313ML) or 42ML above our FY26 forecast. Note: the focus is on Sauvignon Blanc as it is 80% of total wine production, 90% of total export sales volume.
MARLBOROUGH SUPPLY TRENDS
Marlborough grape supply is in the 4th phase of growth. This latest phase from the last four vintages (V22-25) averaged 383k tonnes. This step change in supply is a result of producing hectares increasing to 30.5k. Since V19 producing hectares have increased 3,293 ha (+12%).
We have introduced a vintage target for vintage 26 and 27, this includes all sub regions and grape varieties from Marlborough. It is demand led calculating the Marlborough supply required to achieve a New Zealand wine global demand volume of 330ML per annum in FY26 and FY27. The balancing of supply with demand is important for price stability, improved operating cashflow, inventory levels, and profit delivery.
As a historic marker the V26 target is marginally above V24 and inline V16. The V26 target is lower than the V27 as it accounts for digesting the V25 carryover inventory in FY27. If actual global demand volume exceeds the FY26 forecast, then the V26 supply target would increase. The V27 target is inline with V20 which was a record at the time.
The immediate challenge is to ensure supply alignment with demand which will be managed by nature (V12, V15, V21 and V24) or through operational management by reducing yield per hectare or from the longer-term impact of a reduction in producing hectares. Compounding this challenge is that Marlborough producing hectares are forecast to grow 4% from 30.5k (2025) to 32.1k in 2028*.
KEY POINTS:
• The last four vintages have step changed Marlborough supply to new levels of producing hectares and yields. Since V23 this step change has placed the wine industry in an oversupply position resulting in downward pressure on grape prices.
• The V26 supply target of 323k T is perceived to be low relative to recent harvests however it is only 8% below the 7-year supply average from Marlborough.
• This chart includes all sub regions and grape varieties within Marlborough.
• Climate change, water availability, bud initiation, labour supply, trunk disease, time lag of new planted and producing hectares and nursery supply are all recognised as impacting on harvest yields.
* NZ Winegrowers Vineyard Report 2026
Source: Vintage 2004 – 2025 statistics from New Zealand Winegrowers Annual Report and 2025 Vintage Survey Report. Supply Target tonnes are from JPEW Advisory Ltd and are indicative only.
NZ WINE GLOBAL SALES TRENDS
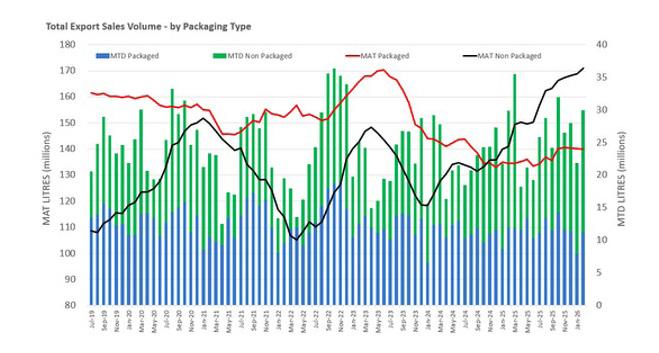
New Zealand wine global demand over the long-term has plateaued, since financial year 2019-2025 global sales volumes of 324ML have grown 0.1% per year, ranging between 307 to 356ML. Even though global sales volumes have plateaued the longer-term pattern of export demand illustrates volatility arising from multiple factors. This is reflected in the Total Export MAT trend chart (below).
The FY26 forecast of 330ML assumes a domestic market at 40ML and 2% (6ML) of export growth. This forecast is conservative acknowledging risk within the current trading environment and assumes June 2025 pricing levels are maintained. It also acknowledges that incremental export volumes of bulk wine (above forecast) will be dispatched ex New Zealand at lower prices.
Future success will be based on understanding what resonates with the wine consumer, strong customer relationships, innovation, access to new export markets, greater penetration into existing markets.
The headwinds impacting revenue streams persist with consumer moderation, government regulation (tariffs, excise tax, recycling taxes), inflationary impact on costs, and economic uncertainty set to continue. These headwinds also impact our domestic and export customers confronted by declining demand, regulation, and narrowing margins. This tension between sales volume, price, and margin is expected to continue and will be alleviated when demand and supply is in balance.
EXPORT MARKET MIX CONTINUES TO EVOLVE
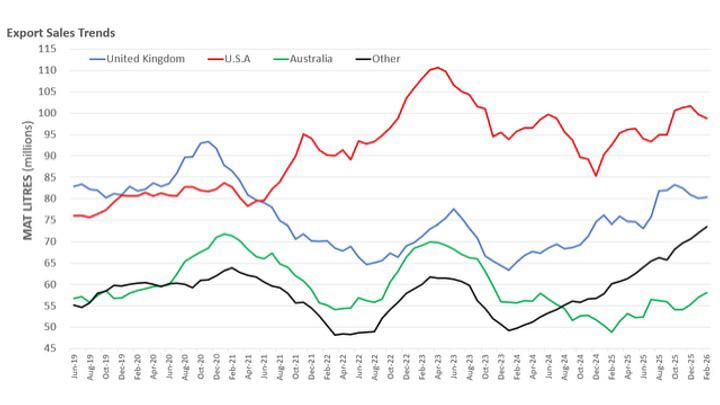
The US is the lead export market resulting in the February 2026 MAT 99ML. Since the step change in demand from September 2021 the US market MAT has ranged between 85-110ML.
Ranked # 2: United Kingdom February 2026 MAT 80ML is in line with levels achieved in October 2019.
Ranked # 3: Australia February 2026 MAT 58ML is in line with levels achieved in February 2020.
Despite the volatility the United Kingdom and Australia have not grown in the last 5 years, what has changed significantly in these markets is the way exports are dispatched with 75% (AU) and 76% (UK) of the volume shipped as bulk wine and held as inventory until packaged in-market under branded or private label.
The Other markets include Canada, Germany, Ireland, Denmark, Netherlands, Sweden, South Korea, China, Japan, Singapore, and Hong Kong where growth is driven from access to new channels combined with the growing white wine consumer trend.
Since February 2024, the Other market MAT export growth (+24ML) occurred in Asia +7.5ML, Europe +6.3ML, and Canada +4.7ML.
The performance in Asia illustrates the benefits of developing distribution into existing markets, primarily South Korea and China. The growth in Canada has been consistent over the past 24 months. Within the past 12 months opportunities have arisen from the removal of US wines from store shelves (due to the US tariffs). This has seen US wine exports to Canada fall 78% between 2024 and 2025.
The way NZ Wine is exported has changed in the past year where most of the export growth is exported as non-packaged (bulk) wine to be held as inventory and eventually packaged in market under branded or private labels.
THE CORRELATION
OF DEMAND & SUPPLY WITH GRAPE PRICING TRENDS
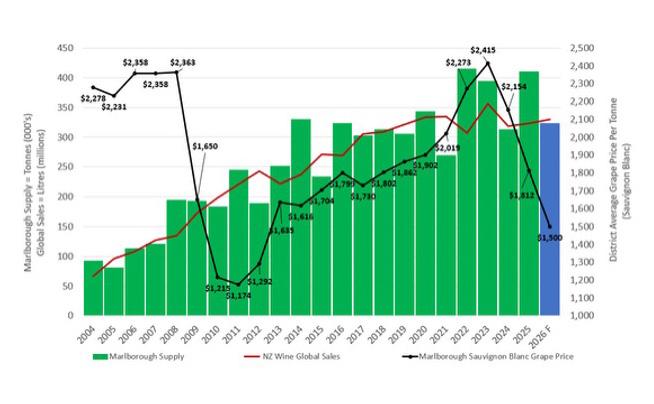
This chart illustrates the historic relationship between total Marlborough supply with the New Zealand wine global sales volume; we then overlay the Marlborough Sauvignon Blanc grape price trend to identify a correlation and lag in timing. Supply constraints (decline in vintage supply) adversely impacts global sales volume the following financial year (July to June) highlighted with V12, V15, and V21. The F24 decline in global demand is different as it is not due to a supply constraint but the challenging trading landscape which has continued into F25.
We have introduced a vintage target for V26, this includes all sub regions and grape varieties from Marlborough. It is demand led calculating the Marlborough supply required to achieve a New Zealand wine global demand forecast of 330ML per annum in FY26. Any incremental demand sold above the FY26 forecast will increase the V26 supply target, The balancing of supply with demand is important for price stability and improved operating cashflow.
The vintage 2026 grape price forecast for Marlborough Sauvignon Blanc is $1,500 per tonne; this is indicative only as this price will be influenced by many variables. The impact of the V25 supply intake has adversely impacted future grape pricing.
The chart above illustrates a correlation between levels of supply, demand, and the movement in grape prices. After three record harvests in 2022, 2023 and 2025 combined with a plateauing of global demand the oversupply position will continue until the V25 supply is sold.
Grape pricing beyond V26 may improve however any future movement in grape price will be dependent on the performance of global demand in FY26-27 and how supply is managed in V26-27.
Source: New Zealand Winegrowers Final Annual Grape Prices per tonne: Marlborough Sauvignon Blanc. All the demand and supply volumes are sourced from New Zealand Winegrower reports. The 2026 forecast for demand, supply, and grape pricing are from JPEW Advisory Ltd.
WE PROVIDE SPECIALIST WINE INDUSTRY SERVICES, ADVICE, AND INSIGHTS TO IMPROVE YOUR BUSINESS PERFORMANCE.
REQUEST A FREE NO OBLIGATION CONSULTATION.
DISCLAIMER This document is published solely for informational purposes. It has been prepared without taking account of your objectives, financial situation, or needs. Before acting on the information in this document, you should consider the appropriateness and suitability of the information , having regard to your objectives, financial situation and needs, and, if necessary seek appropriate professional or financial advice. We believe that the information in this document is correct and any opinions, conclusions or recommendations are reasonably held or made, based on the information available at the time of its compilation, but no representation or warranty, either expressed or implied, is made or provided as to accuracy, reliability or completeness of any statement made in this document. Any opinions, conclusions or recommendations set forth in this document are subject to change without notice and may differ or be contrary to the opinions, conclusions or recommendations expressed. Neither JPEW Advisory Limited nor any person in volved in the preparation of this document accepts any liability for any loss or damage arising out of the use of all or any part of this document. Any projections and forecasts contained in this document are based on a number of assumptions and estimates and are subject to contingencies and uncertainties. Different assumptions and estimates could result in materially different results. JPEW Advisory Limited does not represent or warrant t hat any of these valuations, projections or forecasts, or any of the underlying assumptions or estimates, will be met.