1 minute read
OUR CARBON STORY


For 35 years, American Seafoods has pushed the envelope on operational efficiency to produce the highest quality sustainable seafood with the lowest-possible environmental footprint.
This is evident in every area, from the design of our nets to the priority placed on fuel efficient equipment upgrades to propellers, auxiliary engines, boilers, and winches (just to name a few).
Our supply chains reflect this philosophy as well. Our products are frozen within hours of catch, and kept at -20 degrees C all the way to our customers. We transport most of our goods by refrigerated cargo vessel, which is the most fuel efficient way to move large amounts of product long distances. On our busiest route we even complete the return trip with packaging materials and other supplies onboard.
For decades we have been producing fish oil biodiesel from our processing byproducts, and using it to power secondary systems like boilers on board. We are even exploring the feasibility of a more advanced biorefinery that would create B100 (the purest grade possible), which could power our main engines!
Key 2022 Progress
Produced 289,076 gallons of fish oil biodiesel, replacing 268,841 gallons of diesel and avoiding 2737 MT of CO 2 -e emissions

In aggregate, this translates into a well-defined carbon footprint that we have been measuring and refining for the last decade.
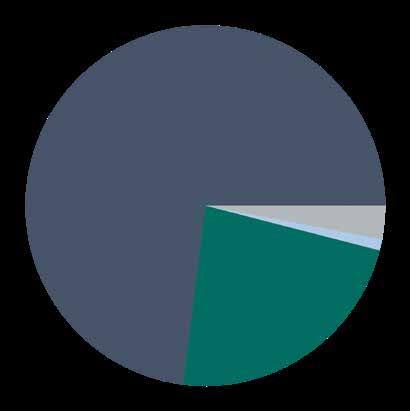
Not surprisingly, our six fishing vessels and product distribution network account for the vast majority of American Seafoods’ emissions. The greatest fluctuation year to year usually stems from changes in catch quotas and fish density - and hence our fishing effort and the volume of cargo transported. We are able to track improvements from new equipment as well.
Fishing Vessels 73% (Scope 1)
Corporate Travel, Commuting, Waste and Packaging - 3 % (Scope 3)
Purchased Electricity - 1 % (Scope 2)
Distribution 23% (Scope 1)
When this is calculated across our average annual production, we are proud to report one of the lowest carbon footprints for any mainstream protein (plant or animal) in the world.
X HIGHER*
Greenhouse Gas Emissions (kg of CO2-e/kg of product)
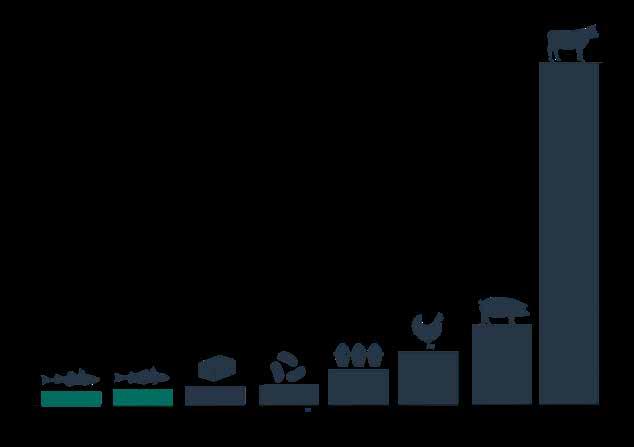
X
X
* Sustainable Business Consulting, American Seafoods Greenhouse Gas and Protein Comparison, 2022. This report followed the Product Life Cycle Accounting and Reporting Standard developed by the World Resources Institute and the World Business Council for Sustainable Development.