Understanding the Pattern of Development in an Urban Village
Akanksha S Rao
Understanding the Pattern of Development in an
Submission in partial fulfilment of requirements for Writing the City
Akanksha S Rao (Unit 6, PUD21023)
Writing the City, Monsoon Semester 2021 CEPT University, Ahmedabad
01 Evolution of Ghodasar : The Varying Tempos of Transformation 13 Overview
First Phase of Evolution (2005 - 2012)
Second Phase of Evolution (2012 - Present)
02 Walkability in Ghodasar : Reading Between the Lines 19
Ahmedabad City’s Rings and Radials
Street Heirarchy and Connectivity
Block Size and Walkability
Canal and Cadila Road
Streets Along NH8
The report focuses on understanding the delayed pace of development in Ghodasar through the lens of the two significant aspects - evolution and street networks. It centers around a 1 sq. km area in Ghodasar, bound by the NH8, Canal roads and railway line.
This chapter aims to follow the evolution of Ghodasar to the present day and establish the numerous factors that influence its pattern of development. Its evolution can be divided into two phases - the first phase from 2005 to 2012, bursting with constant progress and a second, relatively stagnant phase, from 2012 onwards. In the first phase of evolution, increased migration and footfall drove several infrastructural developments in Ghodasar and provided it a commercial boost. Widening and relaying of the roads by AMC (Ahmedabad Municipal Corporation) was the starting point of several infrastructural developments that helped transform this area. As the BRTS project was implemented along the NH8 as a transit oriented development (TOD), it triggered a sudden transformation in the area, with redevelopment of canal gardens and lakes, and new high-rise constructions on vacant lands.
This rapid pace of development, however, began to dwindle around 2012-2013, and growth became relatively stagnant, indicating the start of the second phase of evolution. This phase of limited growth can be linked to the settlement’s already high density and existing developmental constraints, which limit the utilisation of the enhanced FAR granted by TOD. It thus highlights the need to address the issues of handling existing high densities before further development can be proposed.
This chapter intends to study the street hierarchy and network pattern of Ghodasar to understand the underlying layer of public realm in this area. A two-fold approach, involving quantitative and qualitative parameters, was taken to bring to light the significance of streets and the associated social character of the area.
Quantitative analysis of Ghodasar through parameters of connected-node ratio, link-node ratio, street density, amongst others, reveals that the higher number of dead-end streets add to the density without doing much for connectivity of the area, pointing towards the relatively poor interconnectivity of streets within the area.
In addition to the numerical data, interactions with local people also highlighted certain qualitative factors that impact how people perceive the streets. This is explored through a comparative analysis of two prominent streets namely - Canal Road, Cadila road and NH8., that form interesting cases to study the street interfaces and characteristics. While the Canal and Cadila road behave as ‘activating edges’, the NH8, ring road and railway line form ‘isolating edges’. Each of these transit edges have varying but significant impacts on the walkability and perception of streets in the area.
Based on the observations and analysis made in the above chapters, the report discusses the pace of development of Ghodasar and presents the argument that infrastructure investment and development has the potential to be the driver of growth in this area, as it has been in the past.
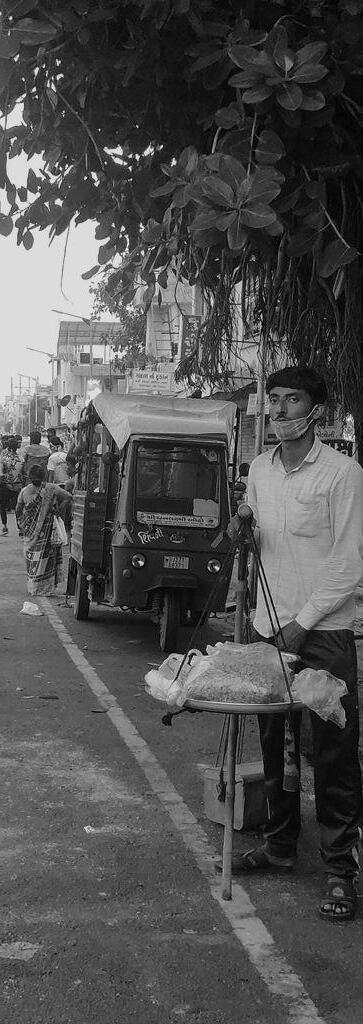
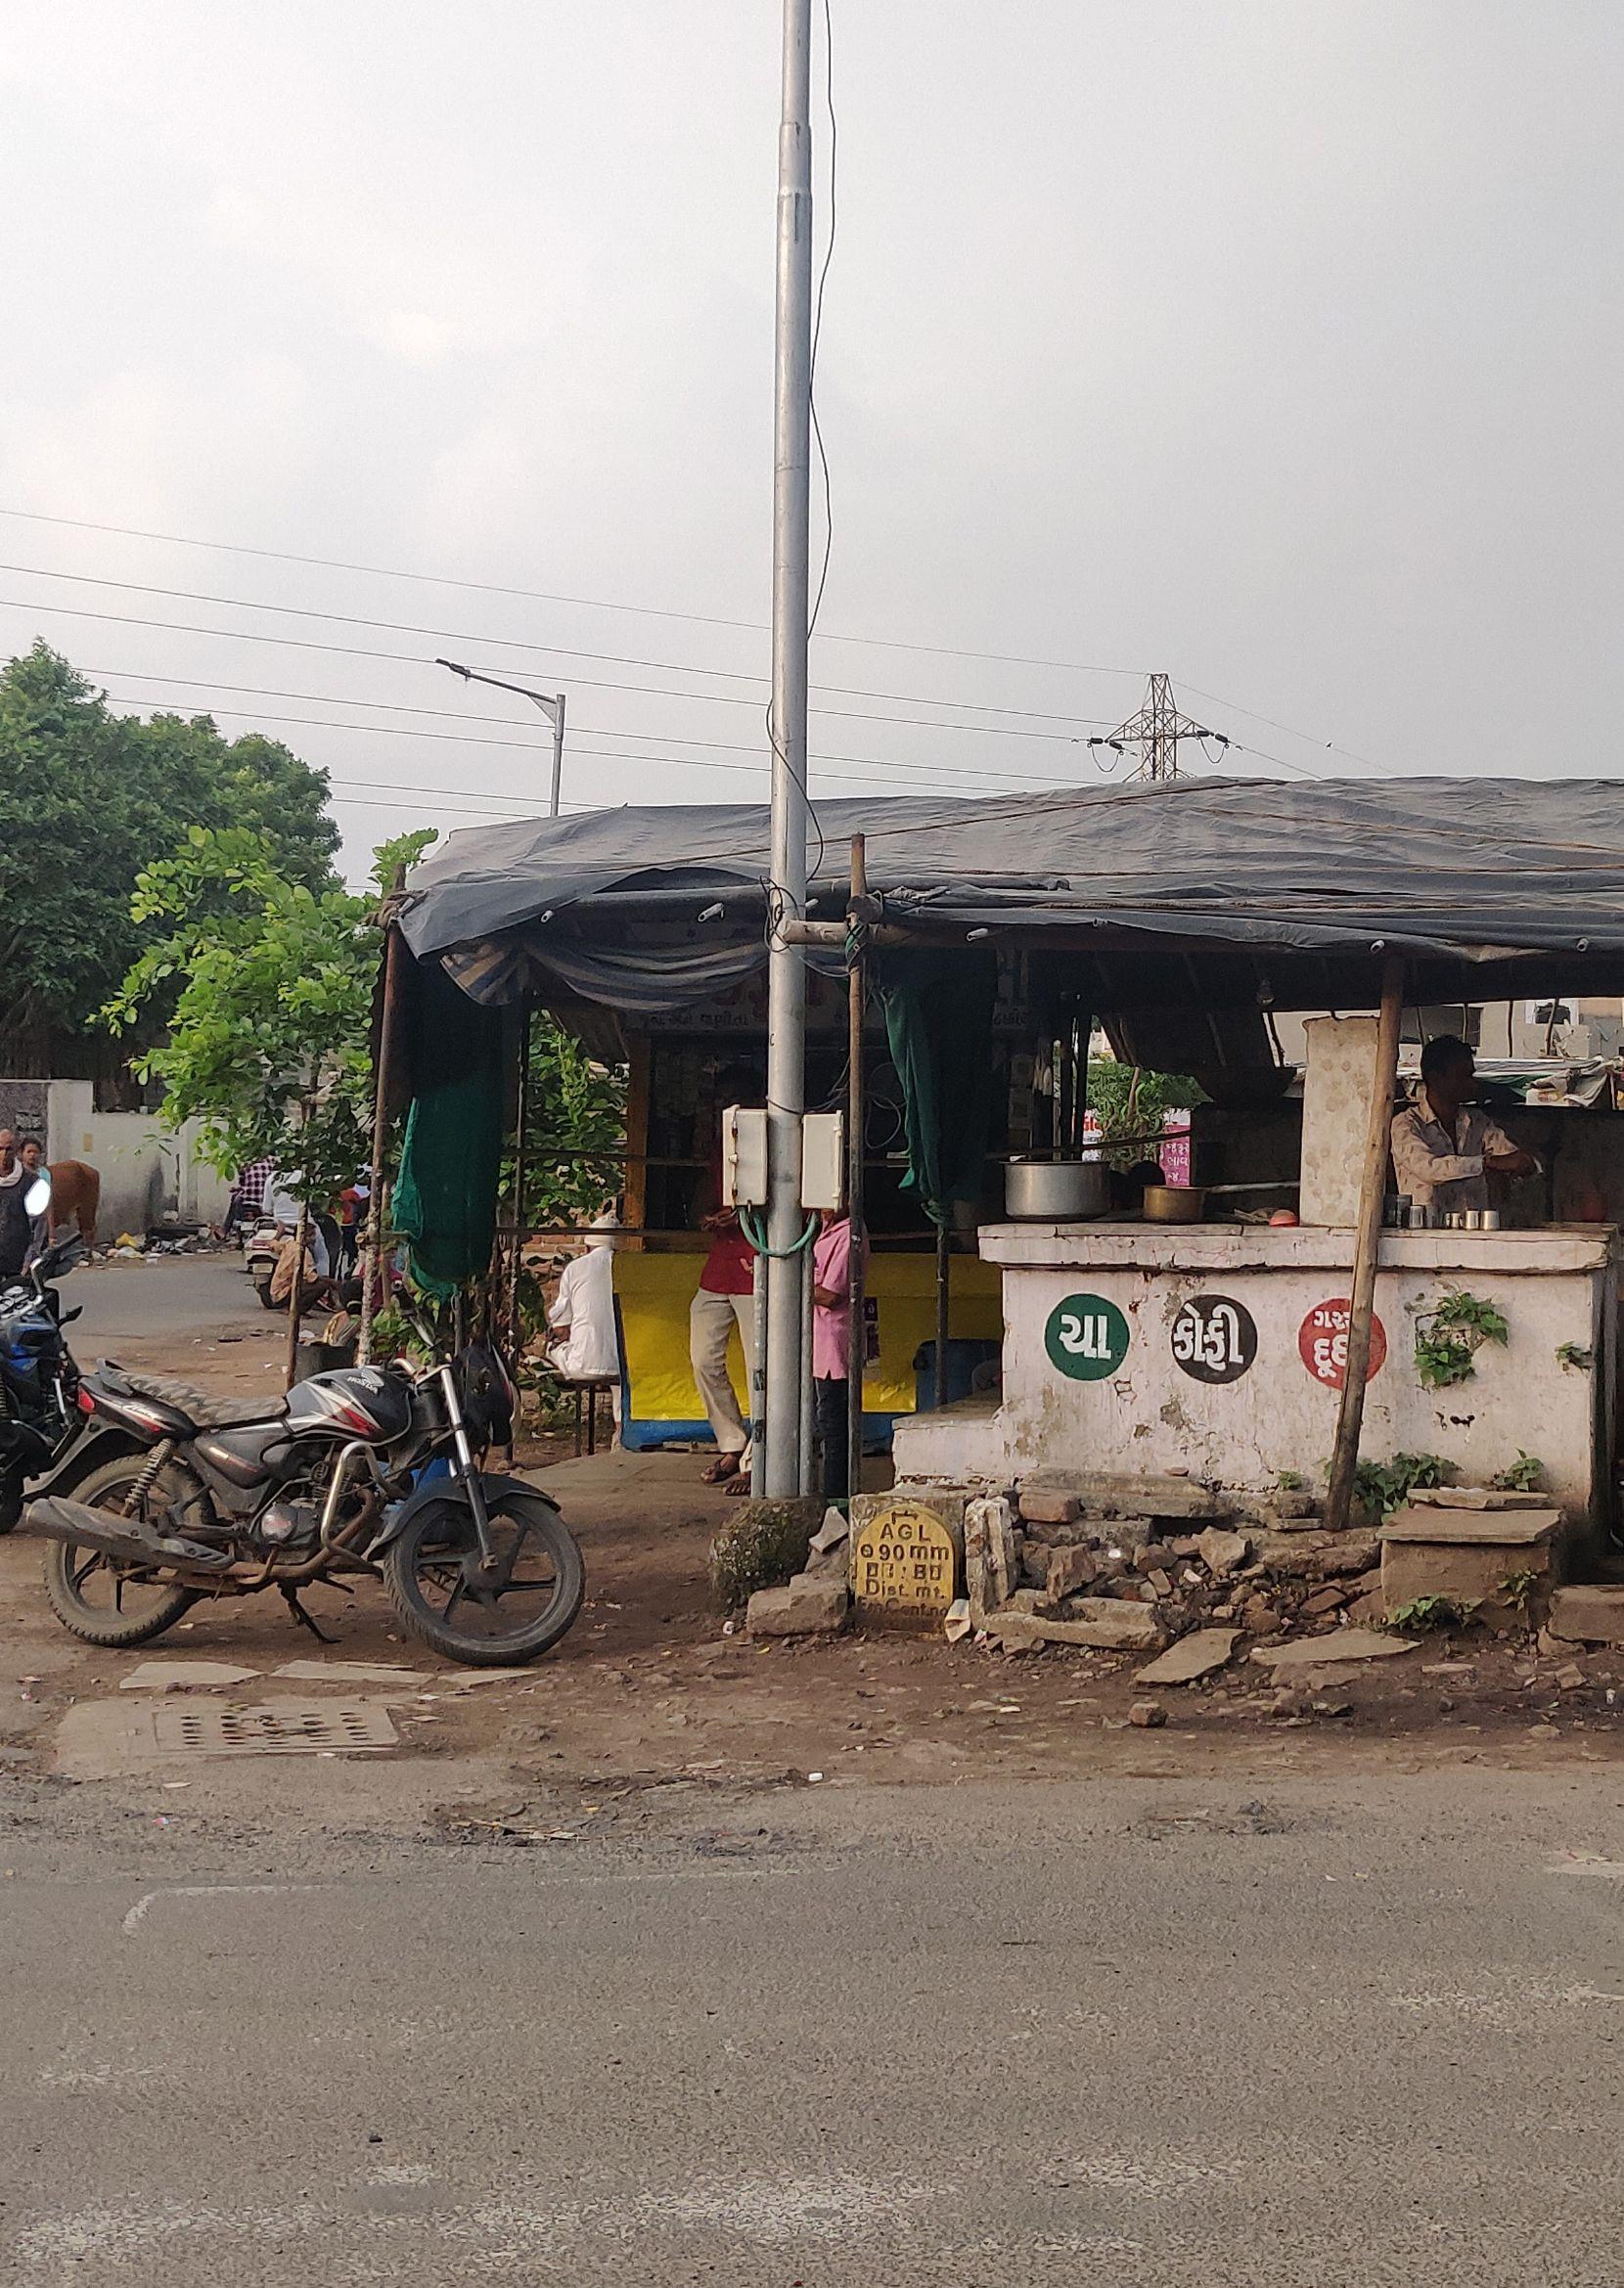
Ahmedabad has seen substantial diversification and expansion in terms of land development and economy, owing to the growth of the industrial sector, especially in the eastern parts of the city. The three GIDC estates namely, Vatva, Naroda, Odhav have been major drivers of growth in the surrounding regions. Ghodasar is one such example of an urban village that has transformed morphologically and socially, as a response to the growth of these industrial estates. It is a small neighborhood in south-eastern Ahmedabad, nestled between the walled city and the industrial estates. It has a relatively low-rise and dense urban fabric that is predominantly residential in nature with semi-detached, row housing, bungalows, and a few apartment complexes. For the intent of this report, a 1 sq. km area in Ghodasar has been studied as an illustrative example of the district.
The report focuses on understanding the delayed pace of development of the study area and the
determinants that influence it. This is analysed through the lens of its physical transformation from 2000 to 2020, as well as its street network and connectivity patterns. The focus of this report is twofold. The first objective is to trace the evolution of the area to its present-day situation and determine the various factors influencing its development pattern. This is followed by the second objective which is to investigate the street network in the area and how its evolution has led to a physical transformation within the neighbourhood.
The report is an outcome of reading satellite imagery, on-site surveys, and secondary research. The area was mapped using GIS (Geographic Information System) which is the primary tool to support the analyses.
To understand the present-day structure of Ghodasar, it is essential to examine its historical evolution, especially in the years from 2000 to 2020, which has seen very contrasting tempos of development. The evolution of Ghodasar can be divided into two phases - the first phase from 2005 to 2012, bursting with constant progress and a second, relatively stagnant phase, from 2012 onwards. The aim is to follow the evolution of the area to its present day situation and determine the various factors influencing its development pattern. This report is the outcome of a series of on-site surveys, personal interviews with locals, reading satellite imagery and secondary research.
Ahmedabad is a city where the development has been strongly related to the rise of the industrial sector, especially in the eastern part of the city. The industrial estates have been strong urban generators
of how the areas around have developed by changing the land-use, from agriculture to developed land, thus also affecting the physical morphology of the urban areas. As the industrial areas developed, people from the old city, Rampura, Navpura and other towns started migrating to the outskirts in search of job opportunities. They settled around the industrial areas, resulting in the development of several urban villages. Ghodasar, an outcome of this process, is situated between the old city walled area and the GIDC (Gujarat Industrial Development Corporation) estates like Vatva, Odhav and Naroda (Asri, A., Damayanti, R., Wijayanto T., 2009).
“Unlike Bombay, Calcutta, Madras and Kanpur, Ahmedabad was not a creation of the British but a city which while remaining true to itself successfully adapted to the new industrial age carrying over commercial and industrial skills and patterns of traditional social organization. In no great city of
India can the continuity of past and present be seen as clearly as in Ahmedabad.’’ (Gillian, 1968) A reflection of this cohesive progression of the urban fabric can be seen as Ghodasar transformed through its two phases of evolution.
In the first phase of evolution, increased migration and footfall prompted a series of infrastructural developments in Ghodasar and gave it a commercial boost. During the years of 2004-2005, the Ahmedabad Municipal Corporation (AMC) widened
and re-laid roads - specifically, the Cadila road that runs across the area in the centre. This was done to accommodate the increased traffic flow from the industrial areas towards Maninagar. Ghodasar lay between two prominent areas, namely the old city and the GIDC estate, and often witnessed a growth within the area as a response to changes around it. Since the year 2008-2009, there has been a gradual shift towards more mixed-use developments, especially along the arterial and sub-arterial roads. The BRTS project was introduced and implemented along the NH8 (arterial road), causing a sudden
BeginningsofInfrastructureDevelopmentinGhodasar BRTSPhase1OperationsBegin
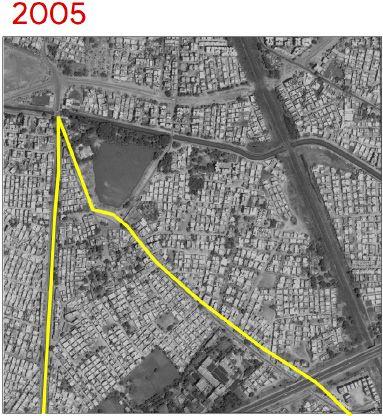

Note. Investment in the rebuilding of Cadila road was the starting point of infrastructural improvements that helped transform this area. Residents with shops projecting onto the thoroughfare, had to pull back into the boundary limits to allow for road widening, thus bringing a change to the built edge along the road as well. Adapted from “Understanding the City,” (Unpublished portfolio for Masters of Urban Design) by A. Rao, 2021, CEPT University. Copyright 2021 by A. Rao.
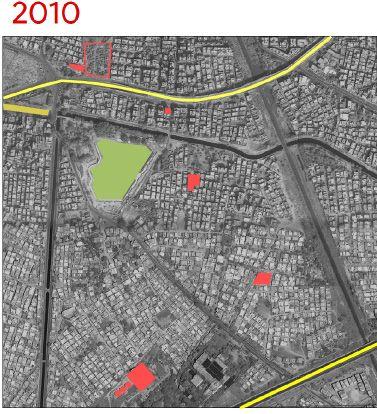
Note. Phase 1 of the BRTS project was implemented along the Narol-Naroda highway or NH8. Consequently, due to the increase in population and demand, open or vacant lands were taken over by new construction (marked in red). Adapted from “Understanding the City,” (Unpublished portfolio for Masters of Urban Design) by A. Rao, 2021, CEPT University. Copyright 2021 by A. Rao.
transformation in the area (Centre of Excellence in Urban Transport, 2014).
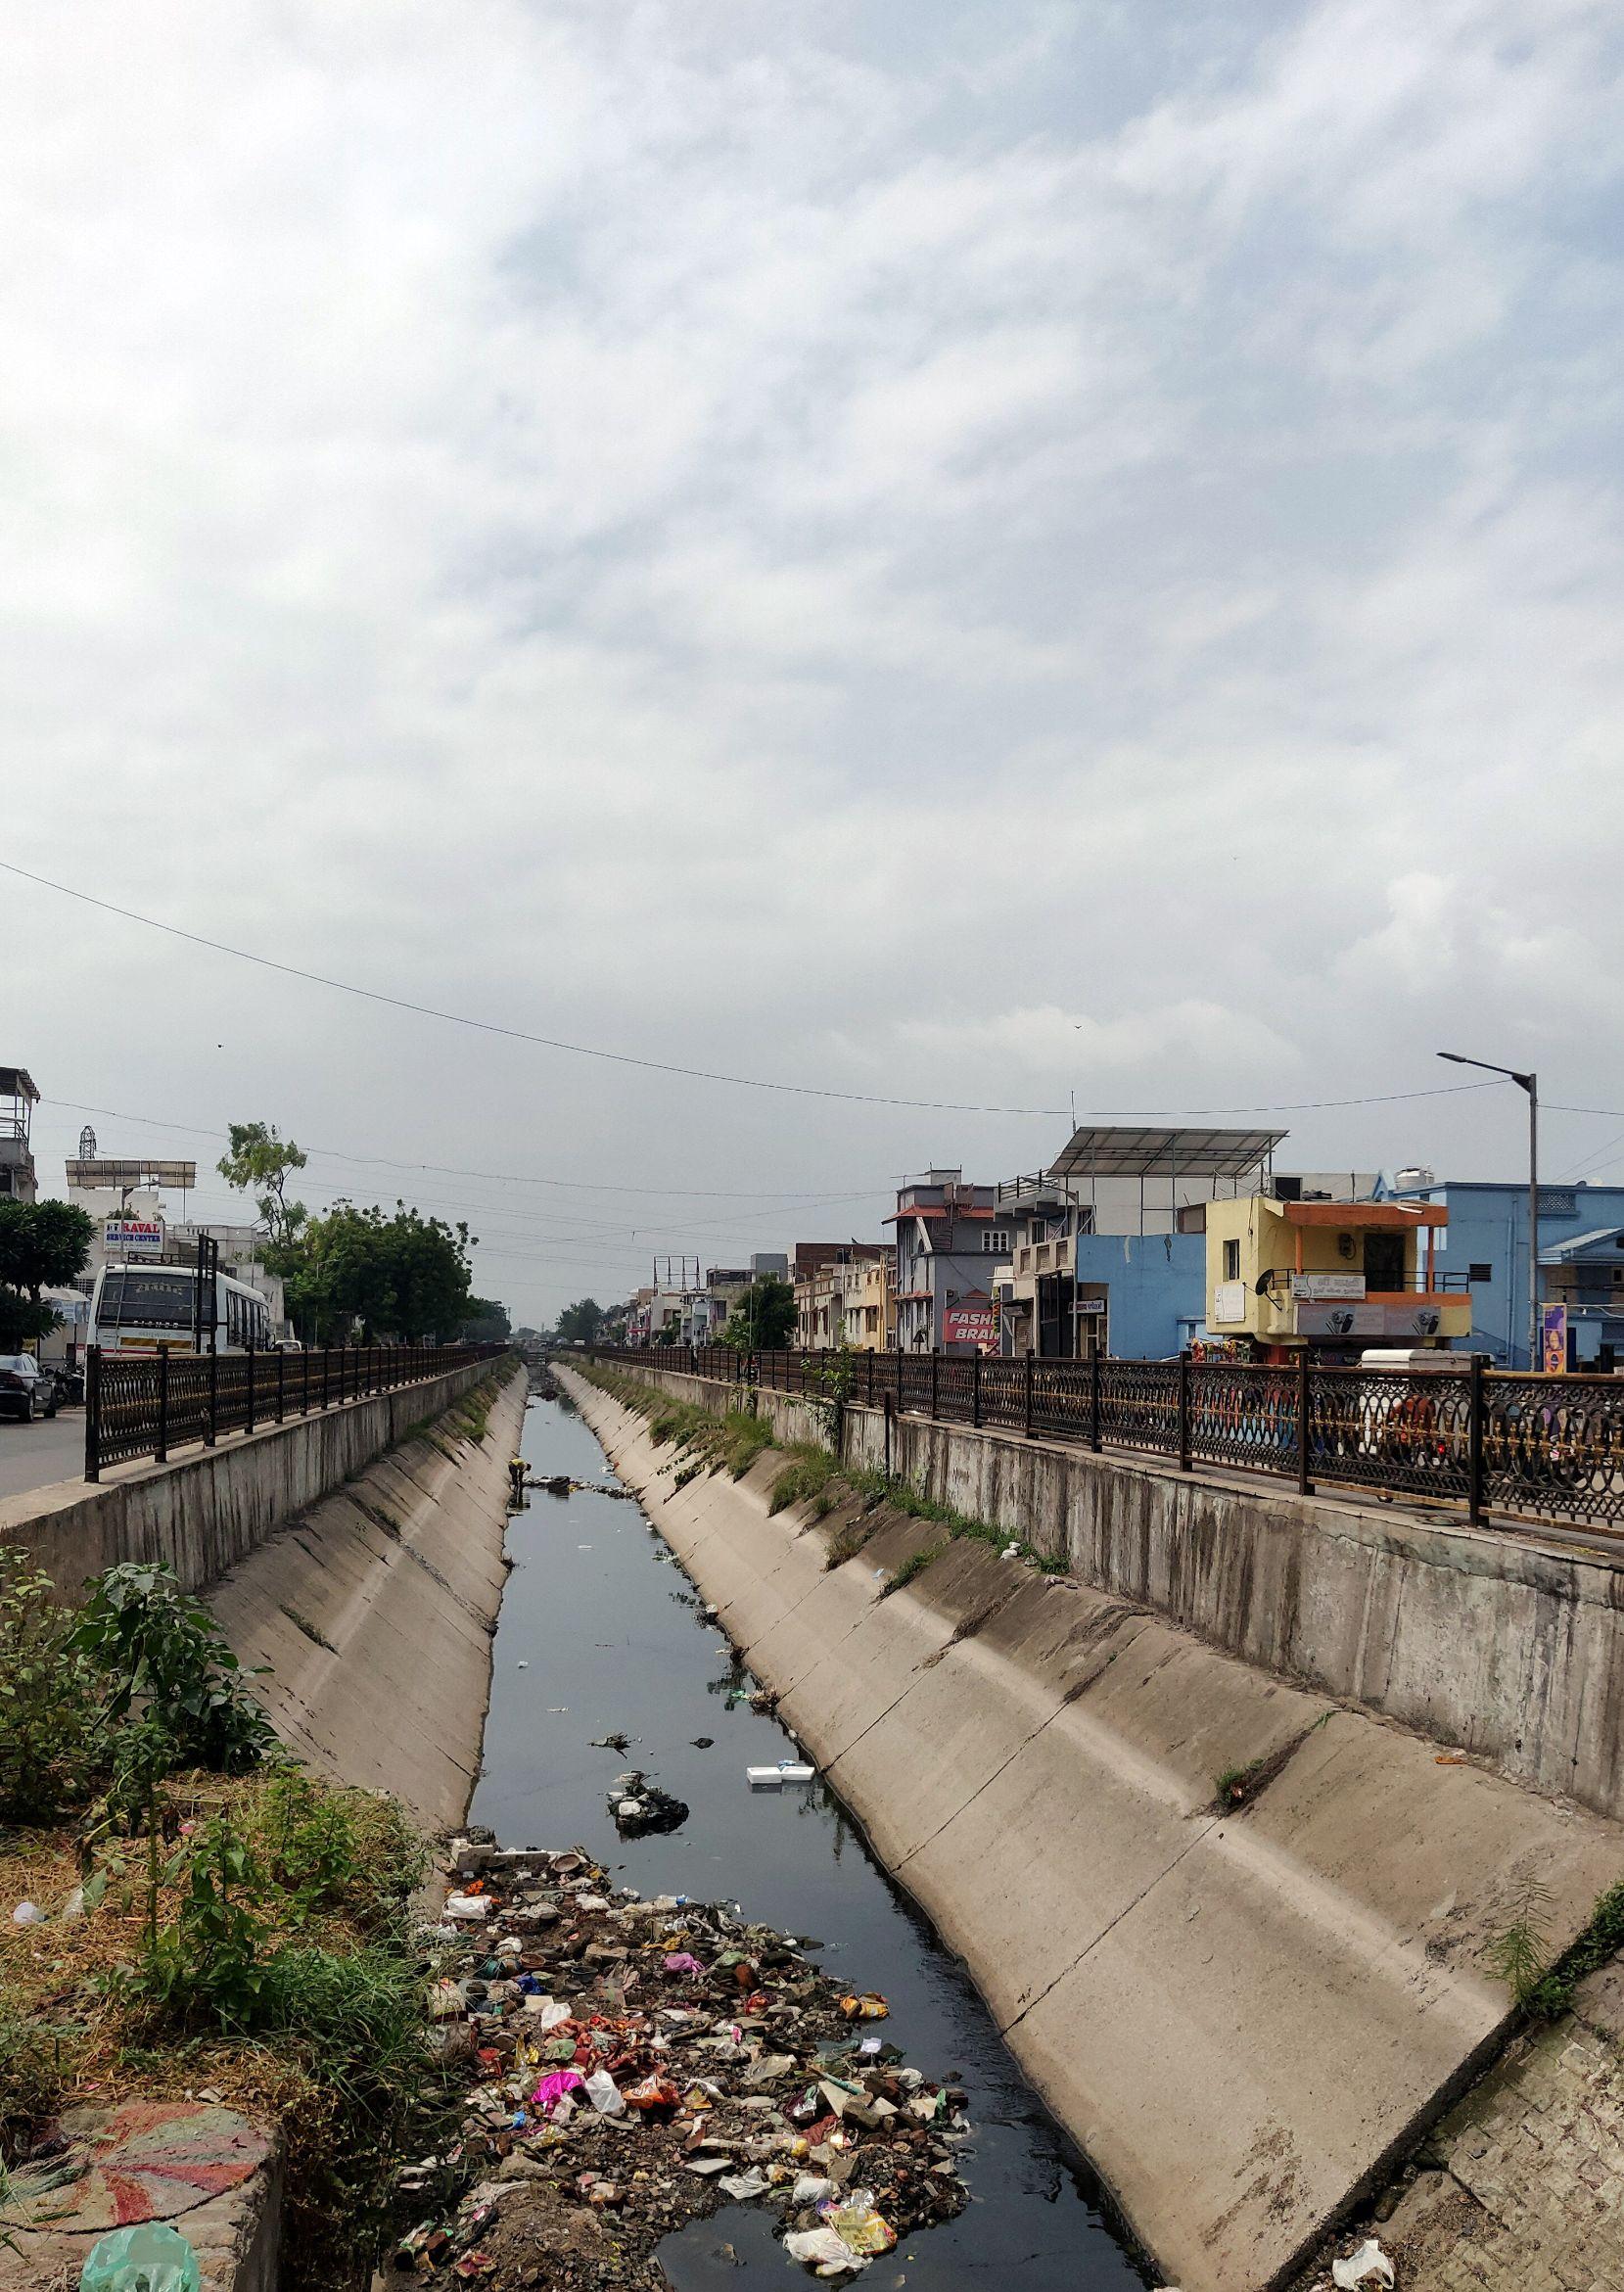
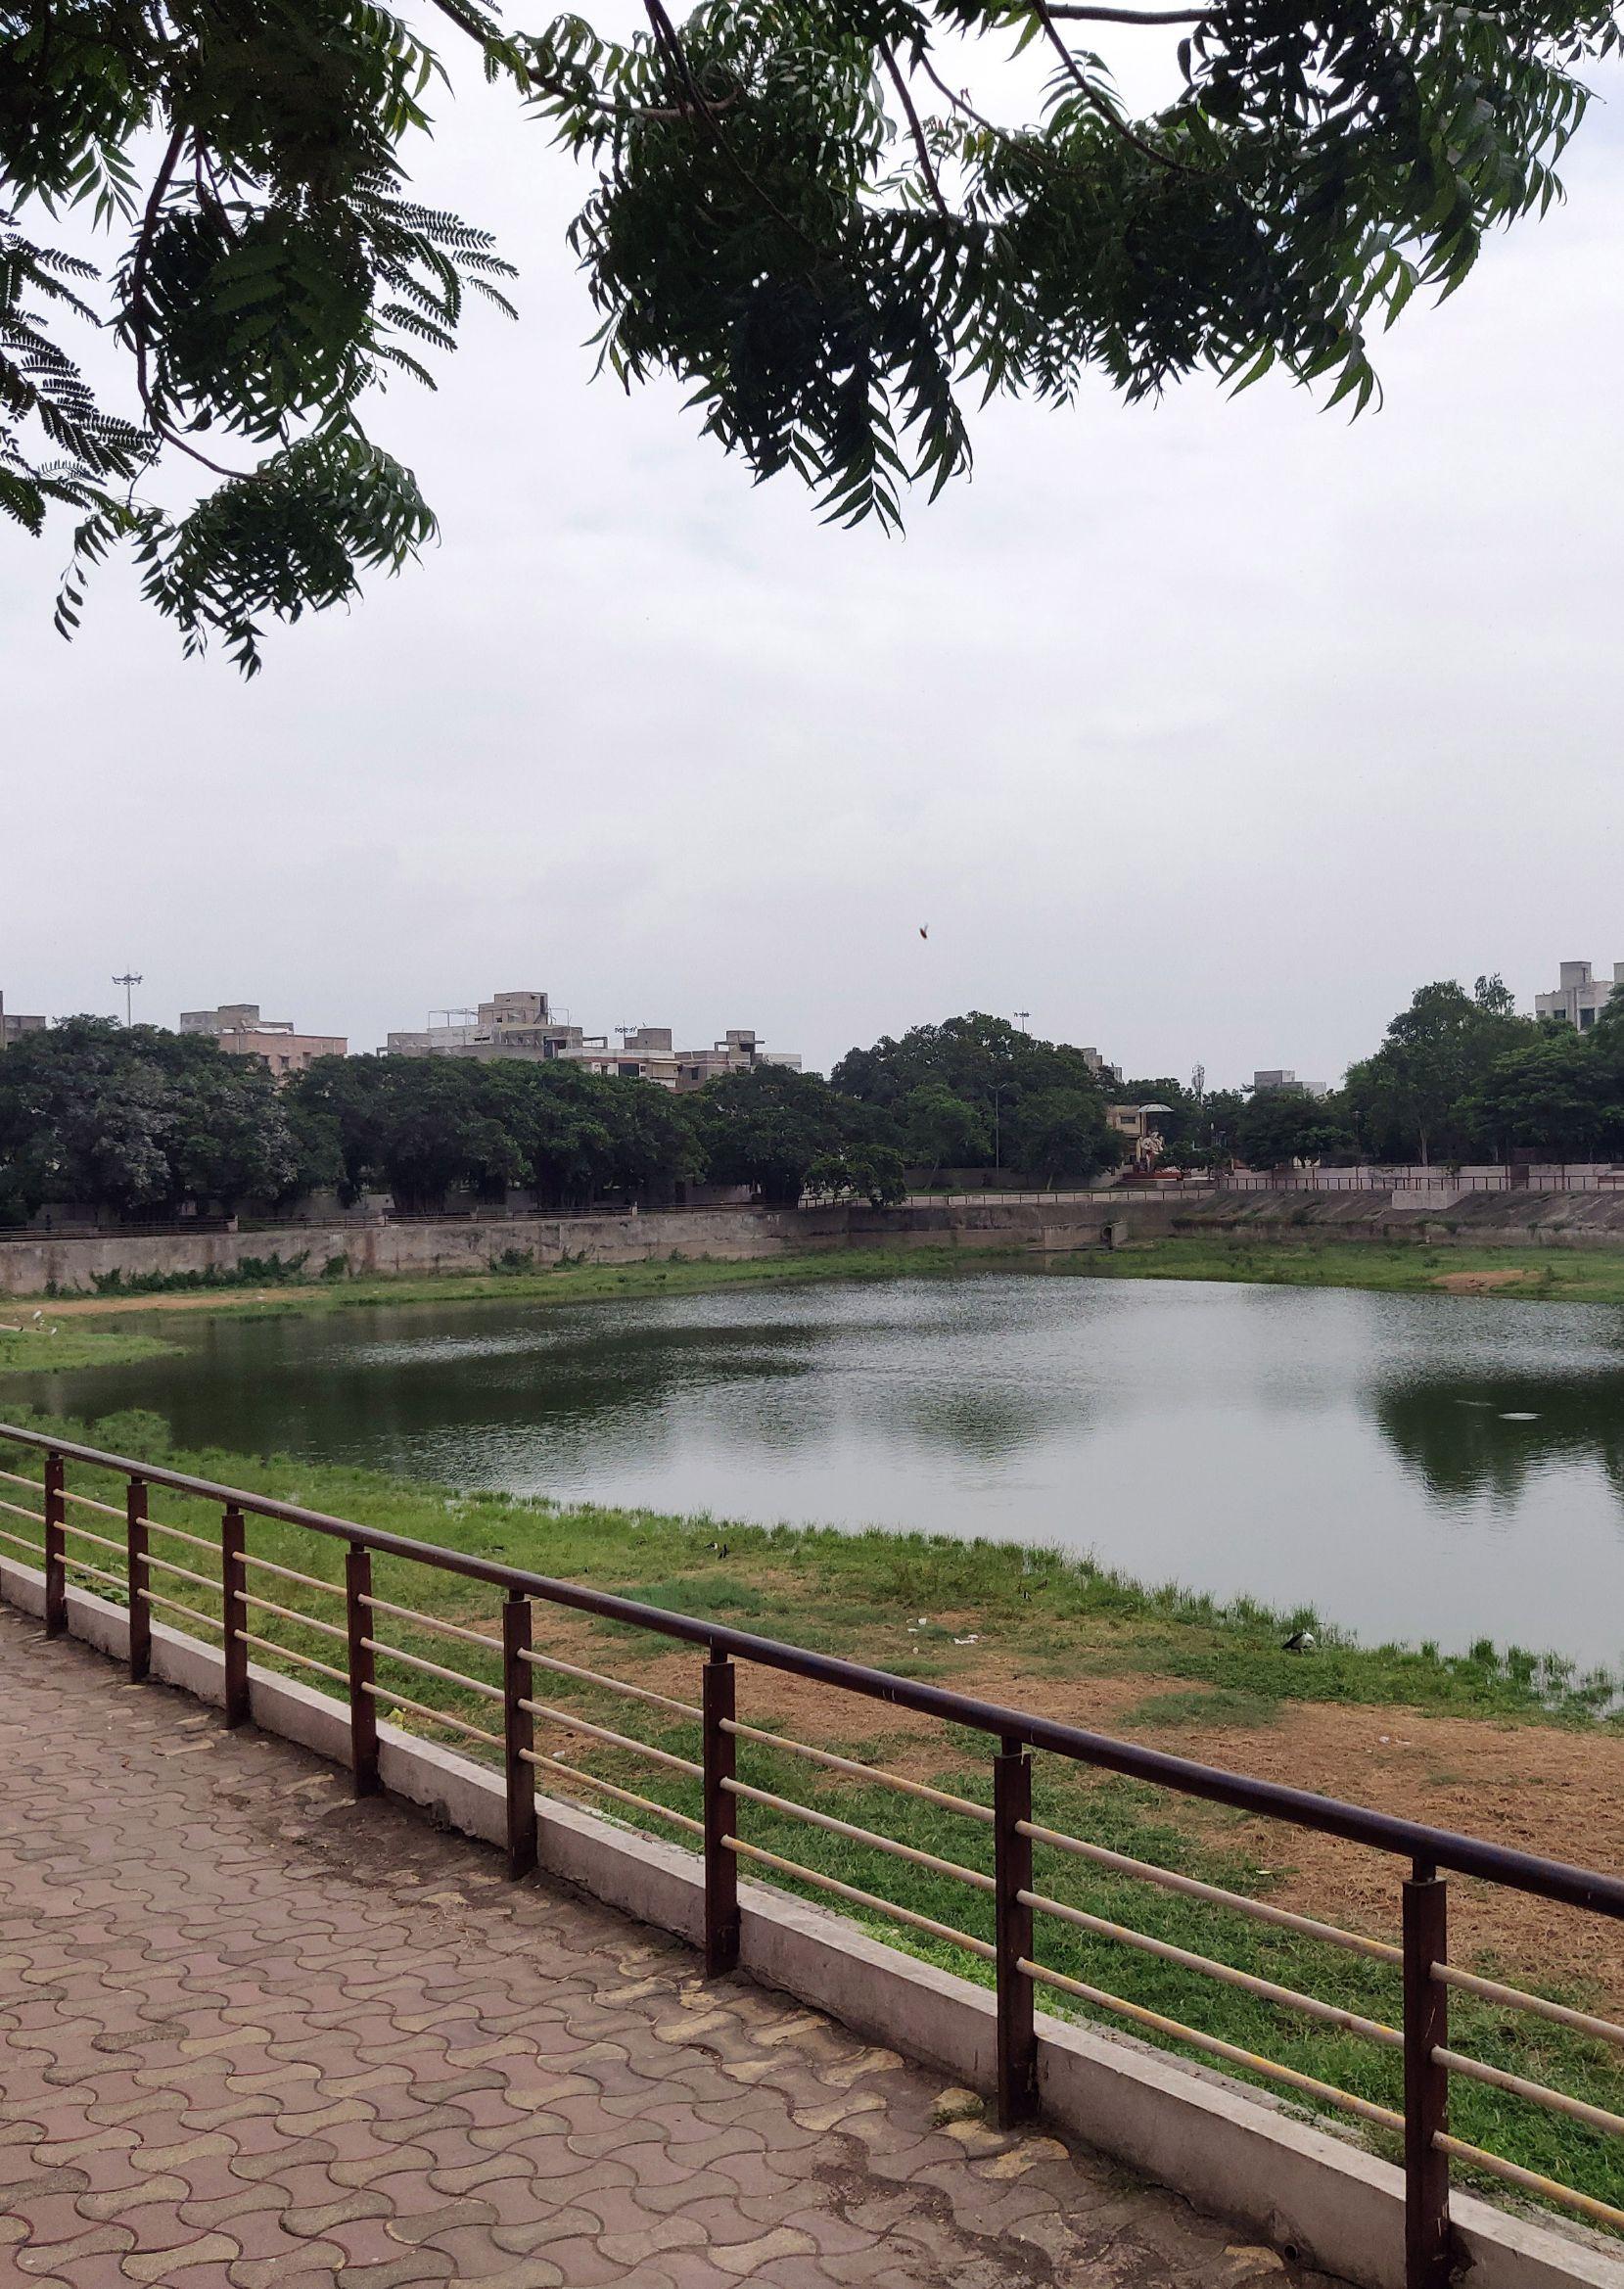
While on one hand, the vacant lands were gradually being built over (See Figure 2), significant investments were also made in the redevelopment of public amenities such as the Ghodasar lake and the Canal garden, to develop them as public amenities for the people. The Ghodasar feeder canal running in the middle of the Canal road, was redeveloped by the irrigation department of the government. In addition to this, in the year 2009, as
Figure 3
ComprehensiveDevelopmentPlan(CDP)2021Introduced
part of the AMC scheme to redevelop water bodies across the city, the Ghodasar lake was redeveloped as a large-scale public space with landscaped plazas and walking track around the lake (Amdavad Municipal Corporation, 2009). These infrastructural projects significantly transformed the socio-cultural atmosphere of the area. One of the most prominent transformations in this period was the construction of the first high-rise apartment complex, in an otherwise low-rise settlement. This complex, called the Avalon Courtyard, was developed along the NH8, indicating the high value and potential that
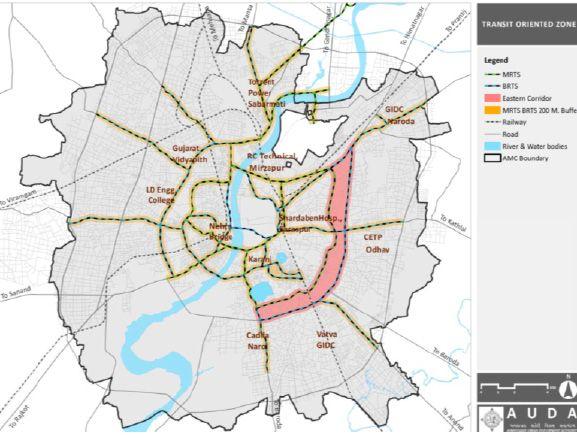
Note.Ahmedabad Urban Development Authority (AUDA) introduced the Comprehensive Development Plan for 2021 in the year 2013, which defines several procedures for promoting compact, higher-density urban city structures in areas with good public transport connectivity. It demarcates the Eastern corridor (marked in red) as a Transit Oriented Development (TOD) zone (AUDA, 2015). Adapted from “Understanding the City,” (Unpublished portfolio for Masters of Urban Design) by A. Rao, 2021, CEPT University. Copyright 2021 by A. Rao.
BRTS created for this area. This had been in large part due to the area being declared a transit oriented development zone.
Transit Oriented Development (TOD) is a planning and design strategy that promotes urban development that is compact, mixed-use, pedestrian- and bicycle-friendly, and closely integrated with mass transit. Proximity to mass transit improves access to TOD neighborhoods, boosting their attractiveness and increasing real estate value. (The World Bank website)
Figure 4
TODInducedDevelopment
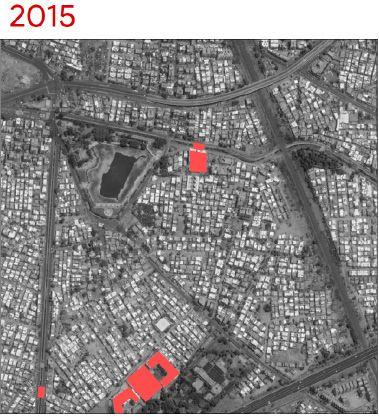
Note. The Ghodasar area falls entirely within the TOD zone which led to an increase in the maximum permissible built on any plot. This is evidently seen in the increase in construction of high rise buildings along NH8. Adapted from “Understanding the City,” (Unpublished portfolio for Masters of Urban Design) by A. Rao, 2021, CEPT University. Copyright 2021 by A. Rao.
Around 2012-2013, this expeditious pace of development began to slow down and growth became relatively stagnant, as can be seen from the following satellite imagery. This marked the beginning of the second phase of evolution. High developments became few and far apart, which is evident as they are restricted only to the edges with no further construction happening in the interior areas of Ghodasar (See Figure 5).
Figure 5
StagnantDevelopmentWithintheNeighborhood
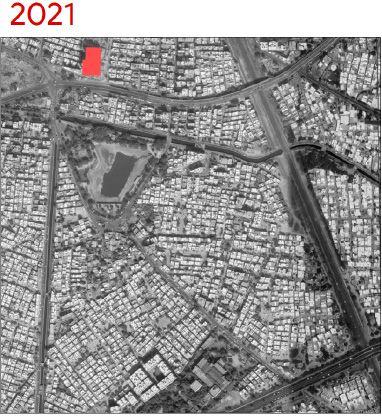
Note.The block shown is a mixed-use building with three floors of retail and multi-storey apartments above. It is the only high-density mixed-use development along that edge that is utilising the full potential (increased FAR) as per TOD. Adapted from “Understanding the City,” (Unpublished portfolio for Masters of Urban Design) by A. Rao, 2021, CEPT University. Copyright 2021 by A. Rao.
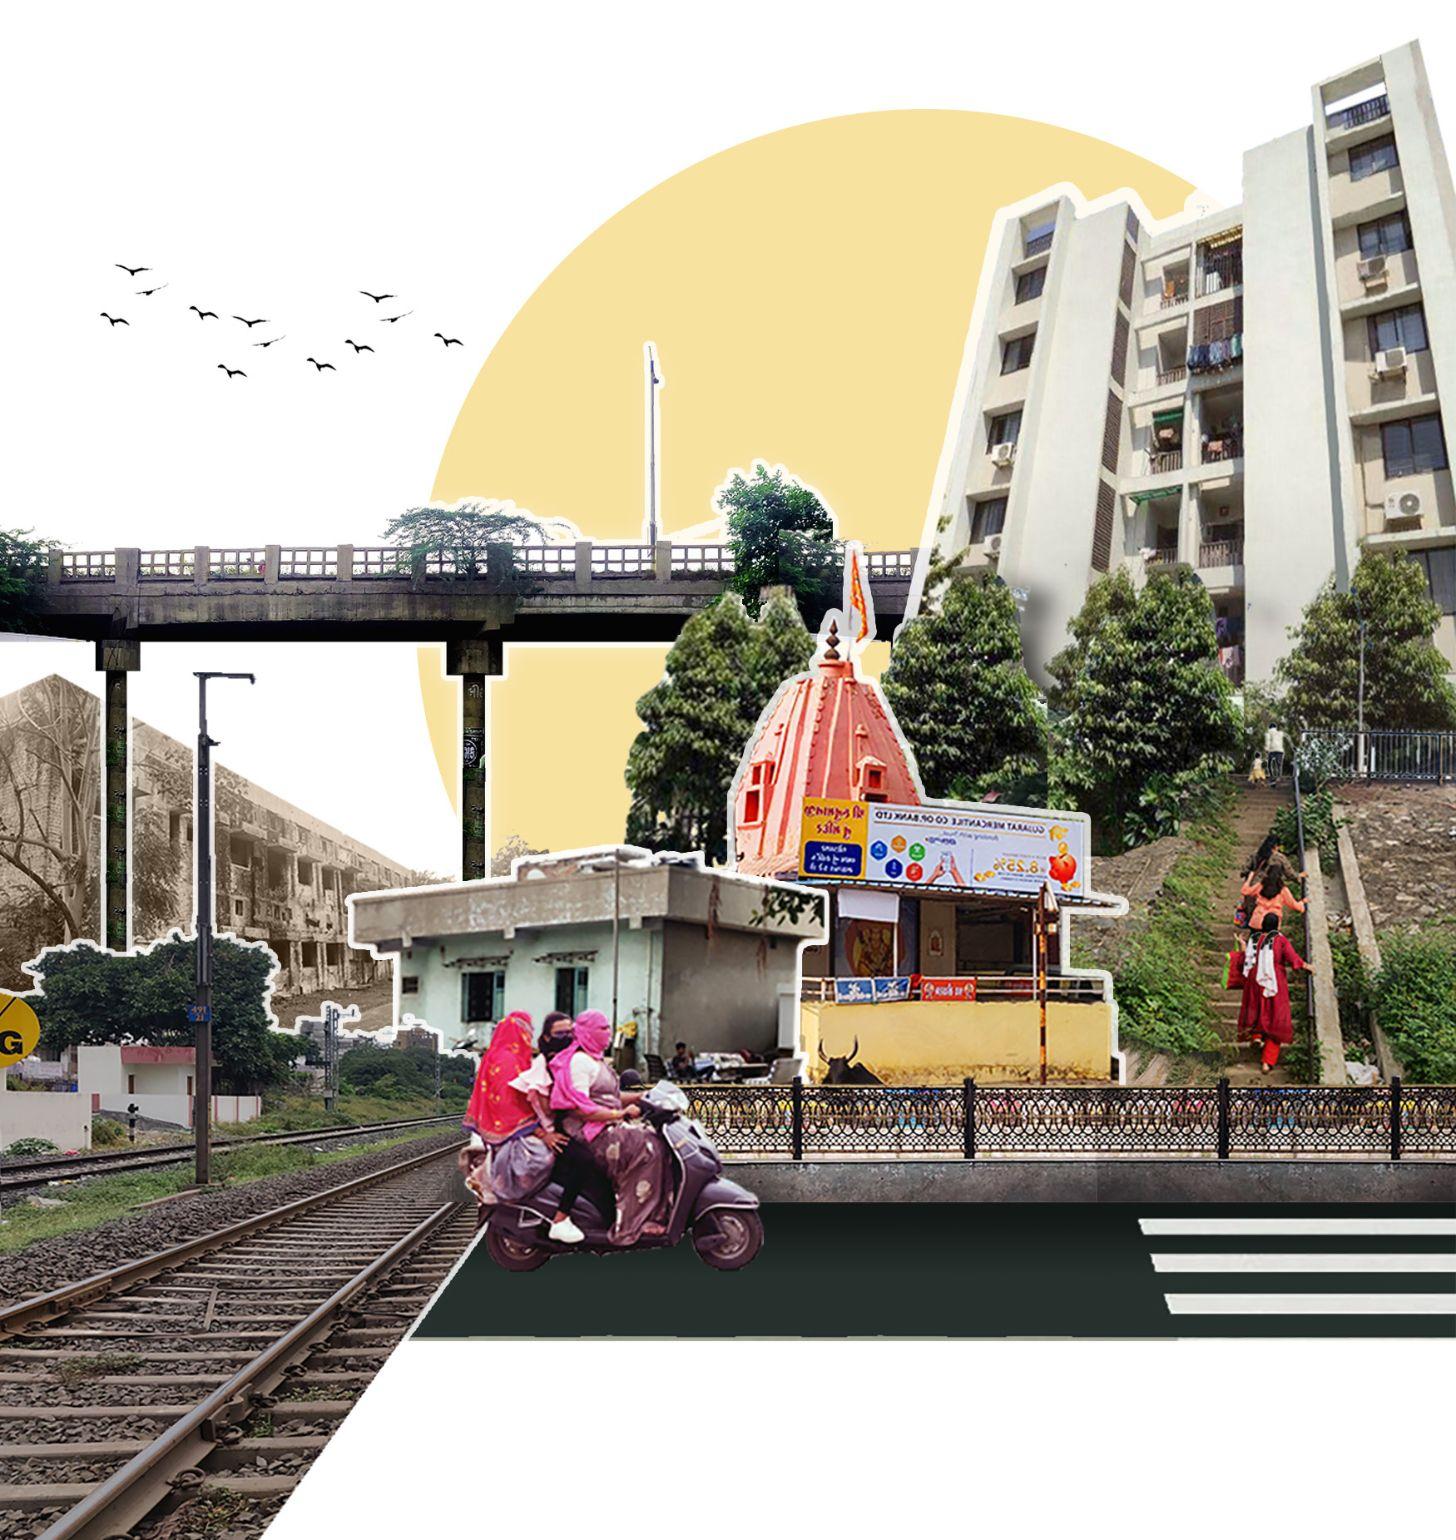
Note.Various determinants have contributed to the change in character of Ghodasar, some of which such as the highway, BRTS and its associated developments have been highlighted in the figure. Adapted from “Understanding the City,” (Unpublished portfolio for Masters of Urban Design) by A. Rao, 2021, CEPT University. Copyright 2021 by A. Rao.
This phase of limited growth can be attributed to the already high density of the settlement and the existing developmental controls that are restricting the utilisation of the increased FAR, bestowed by TOD. The FAR (floor area ratio) determines the extent of built form on a plot.
“While increased density has the potential to increase ridership, scholars argue that it may result in negative implications on the twin fronts of social equity and quality of living. As a result, a balance between these factors is important for a successful TOD.“ (Lin and Gau 2006). It is always a challenge to decongest and manage the existing high density in the area, while also accommodating future growth.
A number of determinants, ranging from ecological to policy decisions, have impacted the development process over the years. It can be observed that infrastructure development has been the major stimulus for the development of this area, giving it the much needed impetus for growth.
However, the area of Ghodasar is currently in a phase of stagnation and it is imperative to address the issues of handling existing high densities before further development can be proposed. It has seen periods of both sudden and stagnant developments in the last two decades. It presents a unique case as the area zoned for TOD is the very same area that is not able to manifest as a TOD zone, thus creating a redundancy.
Streets are the backbone of any built environment, the armature over which the urban fabric is woven. They are not just mere passageways for vehicular movement but also function as places, allowing people to identify different kinds of activities with it.
After learning the fundamentals of reading satellite images and the history and evolution of Ghodasar, this chapter will begin by locating the area within the road network of Ahmedabad city and then zooming in to analyse the physical form of three streets within Ghodasar, namely - Cadila road, Canal road and the street along NH8. This study into the physical form will also bring forth the associated social character of the area which will help give a complete perspective on how the streets are an integral part of the lives of the people in .
The analysis is a result of the primary survey of the area and maps prepared using GIS.
Ahmedabad has grown in the form of circular rings around the walled city area. The street network evolved historically as a ring-radial form, comprising 5 rings and 19 well defined radials; 11 in the west and 8 in the east. This is an indication of the importance of a well-developed street network (Service Level Benchmark - Urban Transport, 2021).
Ghodasar is situated between the 132ft ring road to the north and the NH8 to the south. It is flanked by the Canal road to the left and Maninagar railway line to the right. These transit corridors form strong edges around the area (see Figure 7) and contribute to the physical and social character of the region.
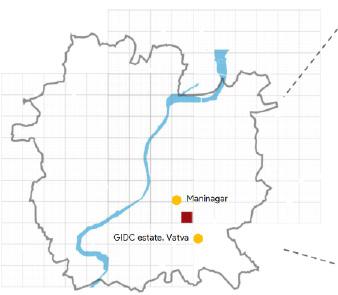
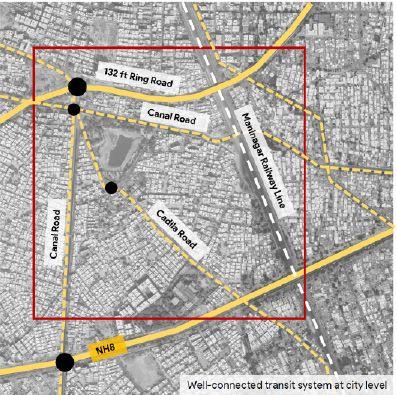
Note. At the city level, the Ghodasar area is very well connected via NH8, BRTS and the 132ft ring road. The city traffic passes through the area, especially the vehicular flow from the GIDC estate area towards Maninagar and other residential areas. Adapted from “Understanding the City,” (Unpublished portfolio for Masters of Urban Design) by A. Rao, 2021, CEPT University. Copyright 2021 by A. Rao.
To understand the street connectivity within the area, it is necessary to study the hierarchy of streets that exists, as it explains the multiple layers of connectivity to the region. The hierarchy of roads is dependent upon the function that the street is required to perform, and the kind of movement and the way users present. For instance, the national highway is a major thoroughfare with vehicular connection being its sole purpose. On the other hand, the Cadila road is a neighborhood level road with utilitarian retail shops along the edges, pedestrian activity all along and relatively slow-moving traffic. This highlights the need to study the different layers of streets to get a more comprehensive outlook.
Looking closely into the area, a certain street hierarchy can be identified within Ghodasar - the highway functioning as the arterial and the ring road serving as a sub-arterial road. These roads carry the biggest volumes of traffic and are often context-specific. On the other hand, the Canal road and Cadila road function as collector roads, conveying moderate volumes of traffic and are often context-specific. On the other hand, the Canal road and Cadila road function as collector roads, conveying moderate volumes of traffic and circulating the activity from the local roads to ring road and highway. The access roads are utilised predominantly for accessing the surrounding plots (Planning Tank, 2021).
Figure 8
ConnectivitywithinGhodasar
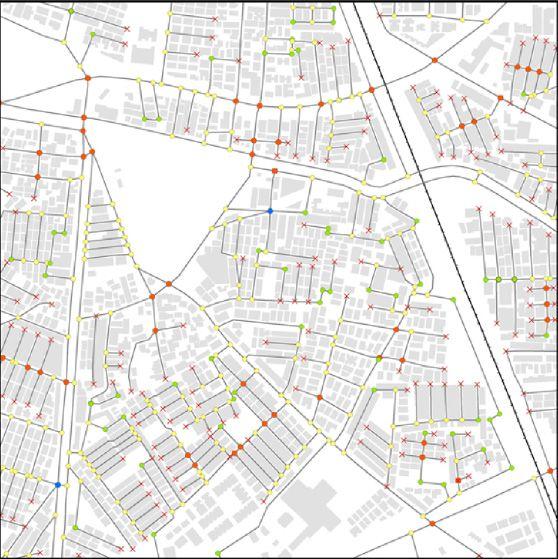
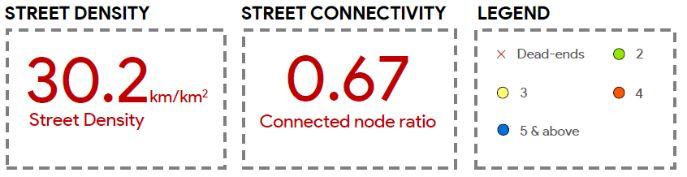
Note.A high street density of 30.2km/km2 would generally imply better connectivity. However, the higher number of dead - ends add to the density without doing much for connectivity of the area, pointing towards the relatively poor inter-connectivity of streets within the area. Adapted from “Understanding the City,” (Unpublished portfolio for Masters of Urban Design) by A. Rao, 2021, CEPT University. Copyright 2021 by A. Rao.
To understand the street network of a particular area, certain metrics such as street density, connected node ratio, link node ratio, etc can be good measures of connectivity. The connected-node ratio is the number of street intersections divided by the total number of intersections (including the dead ends). Higher these values, stronger is the indication of street connectivity (Dill, 2004).
As shown in Figure 8, the Cadila Road has more number of street intersections (shown as colored dots) as compared to the street along the highway,
thus ensuring more accessibility and connectivity from the neighbouring areas.
As can be observed from the adjoining figure, a large number of link lengths have dead-ends (one-third of the total nodes), which indicates lesser route options and longer travel distances, thus, increasing the dependency on private vehicles. Consequently, it can be inferred that while Ghodasar is well connected at the city level, there is poor connectivity within the area. This often results in congestion on the roads and increased travel time.
While ‘connectivity’ describes how well an area is interconnected, ‘walkability’ is a measure of how conducive it is to walk the streets and the factors influencing this ability. One such quantitative factor is the block perimeter and area. Nodes and links in a street network form closed loops to define an enclosed area called blocks. It is imperative to study the block size as a factor of walkability, as it represents the extent to which pedestrians have to walk to reach another block, as illustrated in Figure 9.
Pedestrians can only walk a certain distance around their neighborhood comfortably. A standard, observed from best practices, is a walkable distance of 180-200m. Thus, an average block perimeter of 535m in Ghodasar is on the higher end and reduces the walkability and accessibility for pedestrians and cyclists. The block sizes are relatively smaller and more accessible along the Canal road as it is flanked by residential societies whose internal streets are accessed from the Canal road.
As we move towards the highway and railway line, the block sizes become much larger, making it difficult to walk along the block perimeter that reduces the walkability of the precinct. In addition to this numerical data, on-ground observations
Figure 9
EffectofBlockSizeonWalkability
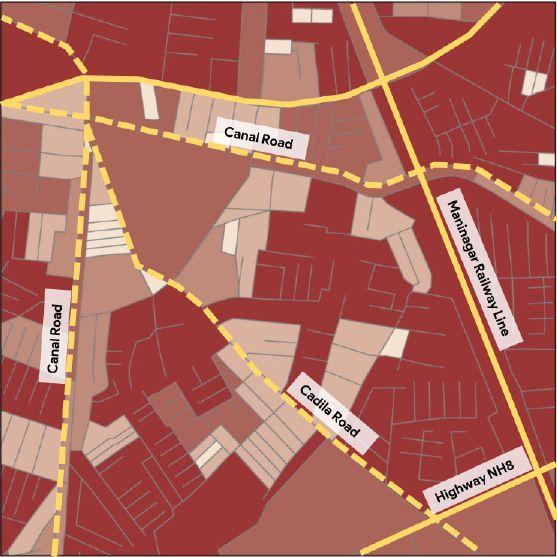
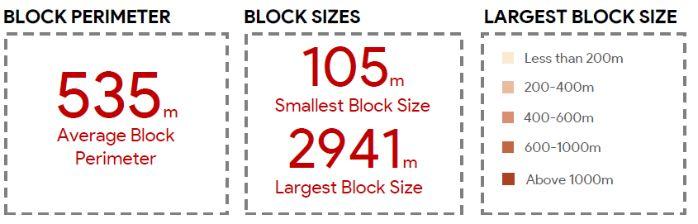
Note. The color gradation across the map indicates how the blocks size and consequently, the pedestrian walkability varies across the area. Smaller, multiple shades of highlight represent the mixture of smaller blocks along Canal and Cadila roads, while the larger, red highlights are evidence of the bigger and relatively unwalkable streets along the highway and railway line. Adapted from “Understanding the City,” (Unpublished portfolio for Masters of Urban Design) by A. Rao, 2021, CEPT University. Copyright 2021 by A. Rao.
and interactions with local people also highlighted certain qualitative factors that impact how people perceive the streets. Figure 10 delves into these factors and how the presence (or absence thereof) can impact the way people use these streets.
Figure 10
QualitativeDeterminantsforAnalysisofStreets




The variation in the building height, street width and street tree canopy creates a feeling of a contained space within the street.
The interface between building frontage or private property boundary and the street. The way a building, space or wall meets the street affects the character of the street.
Lines of clear, uninterrupted sight from a viewer’s location that overlook a street or public space providing informal surveillance of the urban environment.
Community usage of public spaces, reducing antisocial behaviour, and creating connected and integrated streets
The variation in the height of buildings and distance between buildings creates varying volumes and thus, a varying sense of enclosure.
Note. Factors such as street edges, visual connectivity and sense of enclosure contribute to the feeling of safety in any particular street or neighbourhood. As mentioned by Jane Jacobs in her ‘Eyes on the street’ concept, streets that have a lot of activity going on, and custodians who care about what goes on in them, will be safe and secure streets. Adapted from “Understanding the City,” (Unpublished portfolio for Masters of Urban Design) by A. Rao, 2021, CEPT University. Copyright 2021 by A. Rao.
Using the above mentioned factors, a comparative analysis of two prominent streets brought out the similarities and differences in how the streets are perceived and used. The streets chosen for the study, namely - Canal road, Cadila road and NH8, present interesting cases to study the street interfaces and characteristics.
Figure 11
AnalysisofCanalroadandCadilaRoad
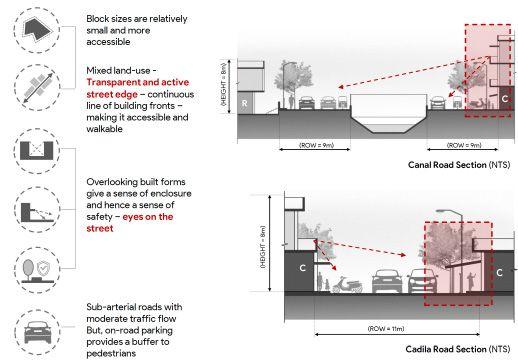
Note. Through the lens of the determinants identified, it can be observed that mixed-use activities along the Canal road such as commercial retail shops and residences, create a porous edge interspersed with activities, making it more accessible and walkable.. Adapted from “Understanding the City,” (Unpublished portfolio for Masters of Urban Design) by A. Rao, 2021, CEPT University. Copyright 2021 by A. Rao.
Canal and Cadila Road
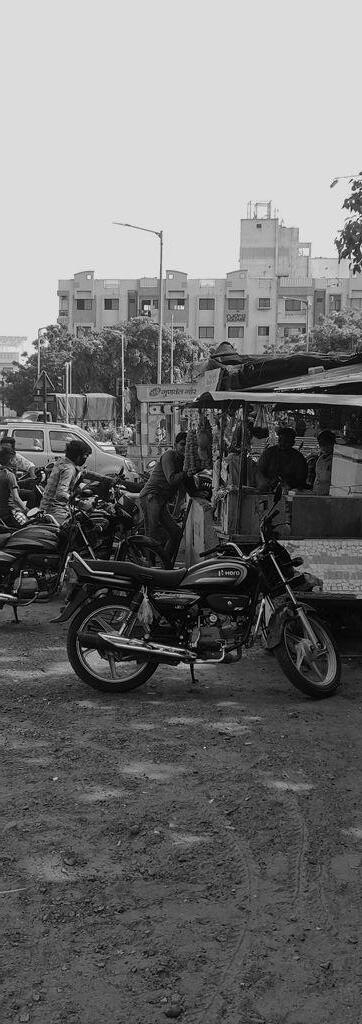
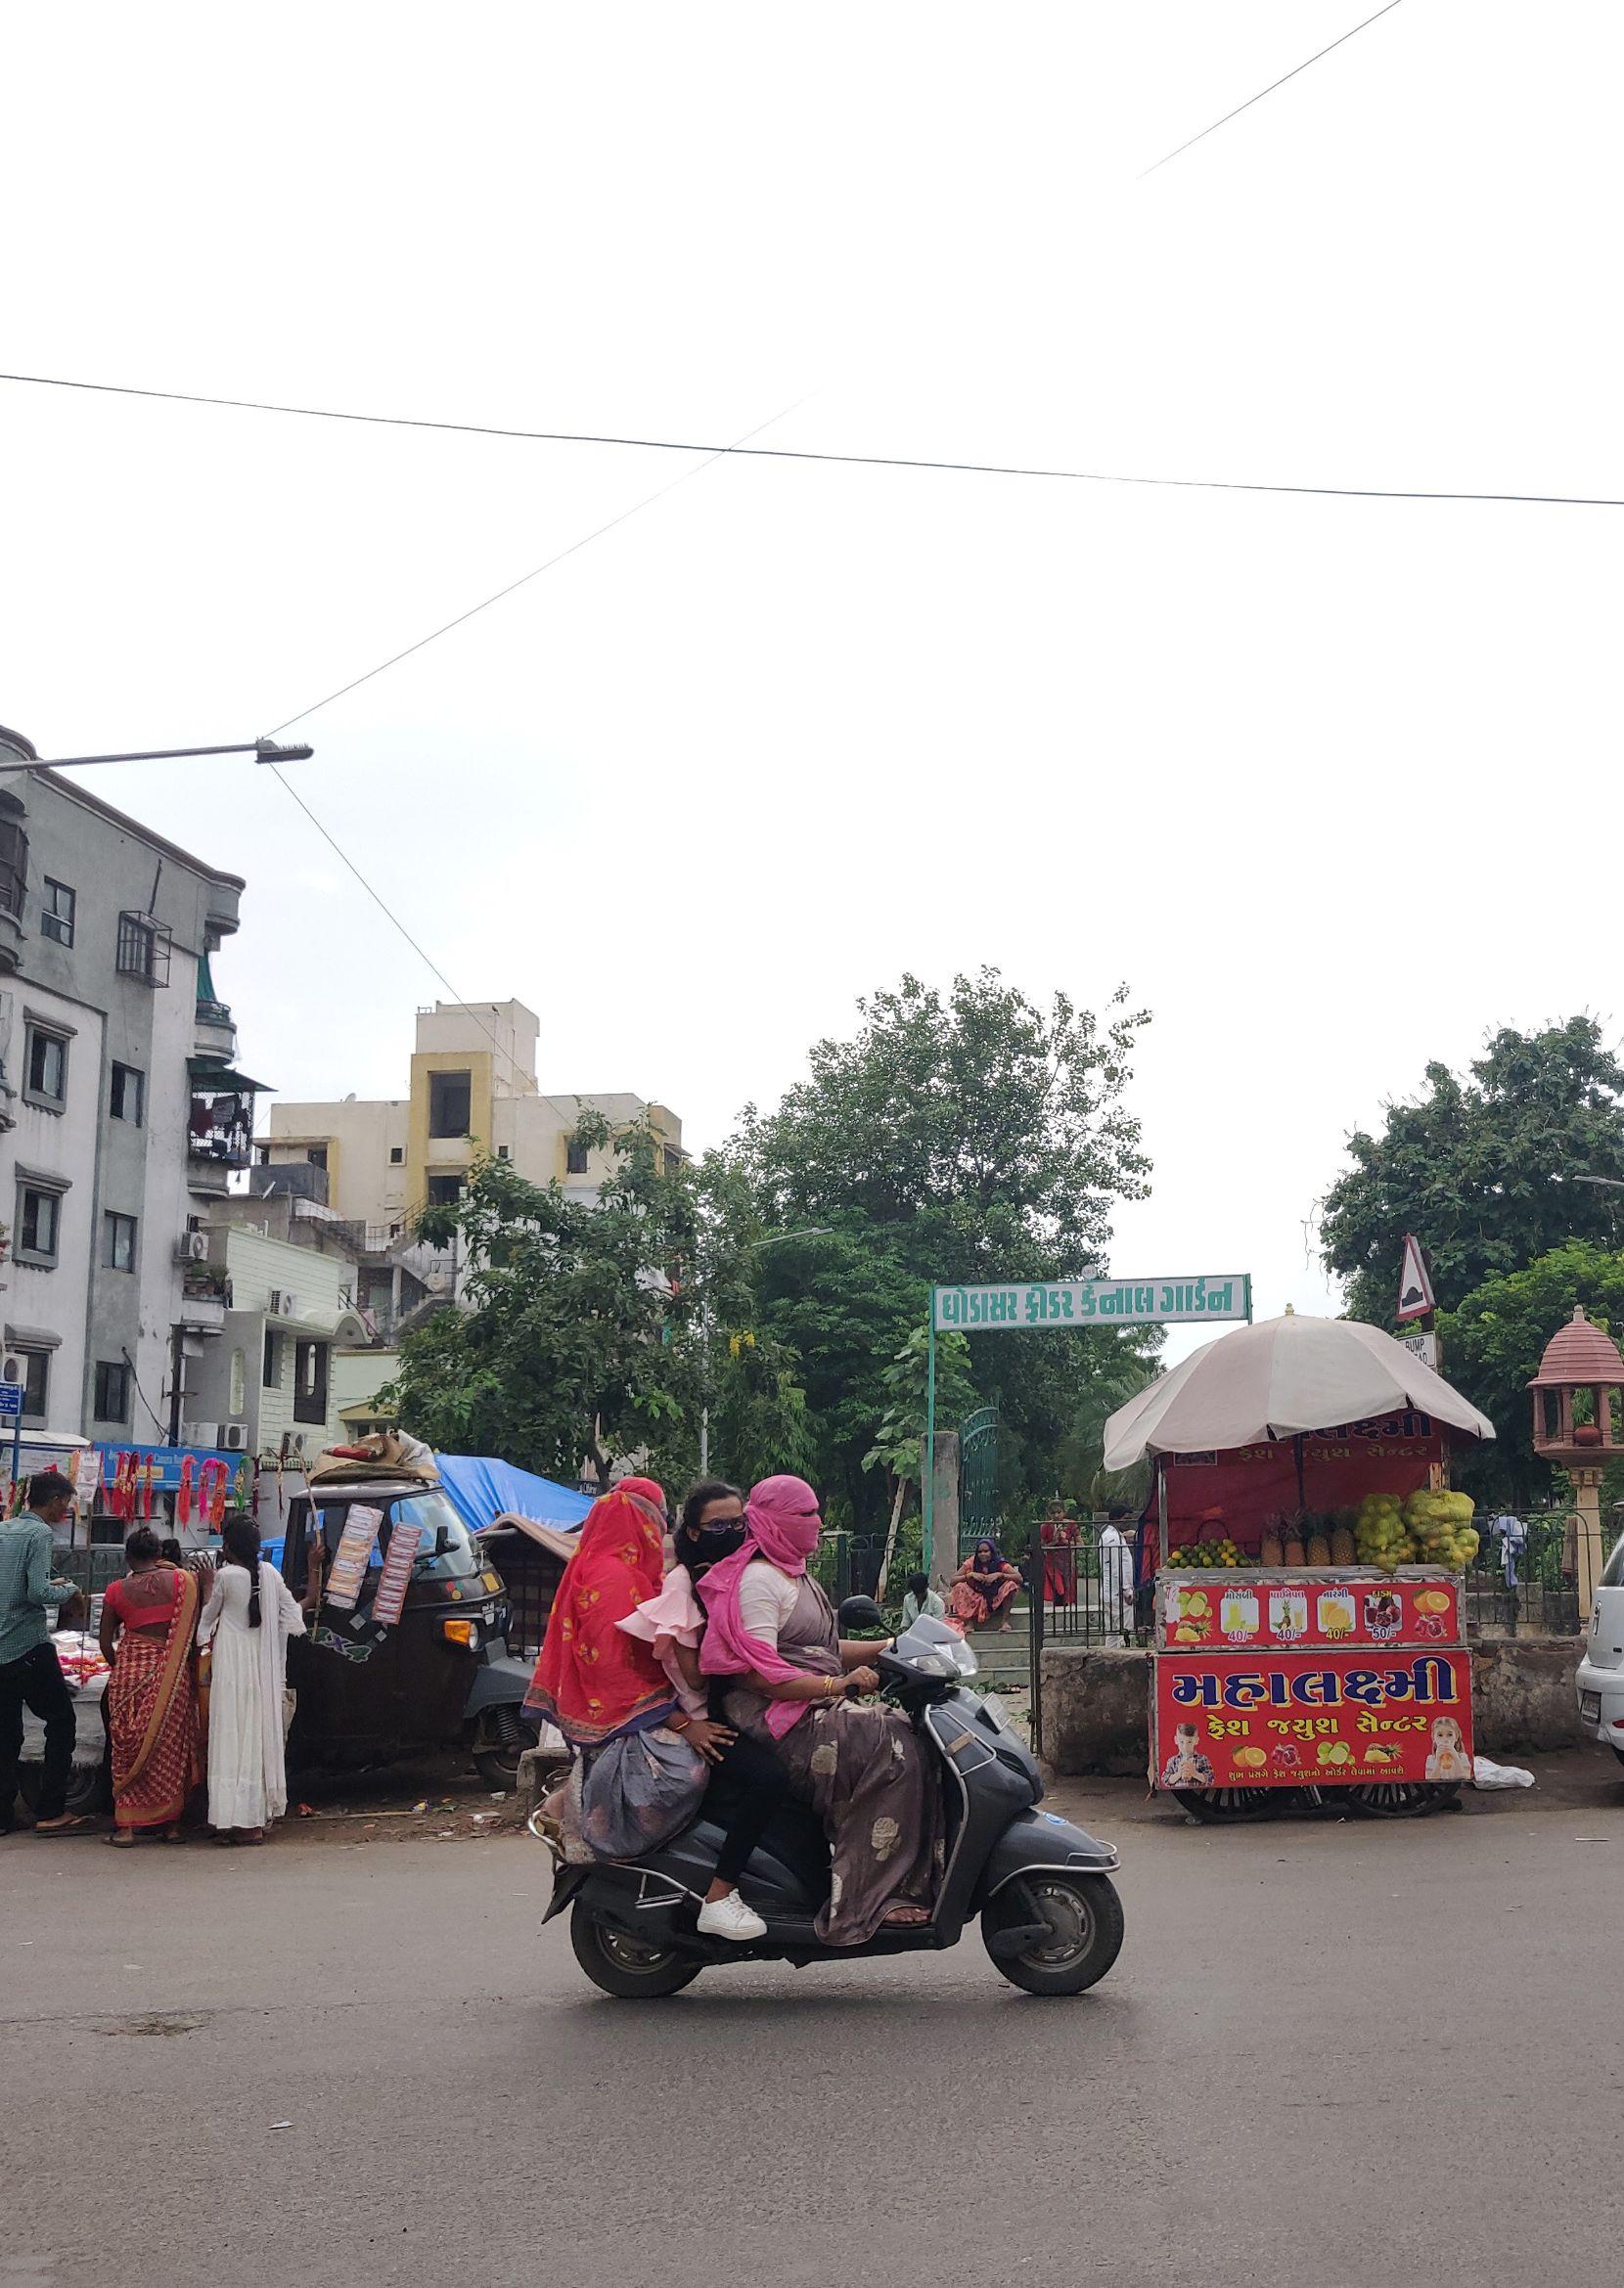
As observed in the figure above, Cadila road and Canal road show a mixture of uses along a street that can create an interactive street edge. In addition to this, the adjoining built forms with their terraces, doors and windows overlooking the street, provide a spatial experience and a sense of safety, as elucidated by Jane Jacobs’ ‘eyes on the street’ concept (see Figure 12).
Considerable on-street parking can be observed on both sides of the street with predominantly twowheelers. Even though parking encroaches into parts of the available footpath space, this on-street parking creates an artificial buffer between the pedestrians and the moving traffic, thus providing a sense of security.
Figure 12
ActivityAlongtheCanalRoadandCadilaRoad
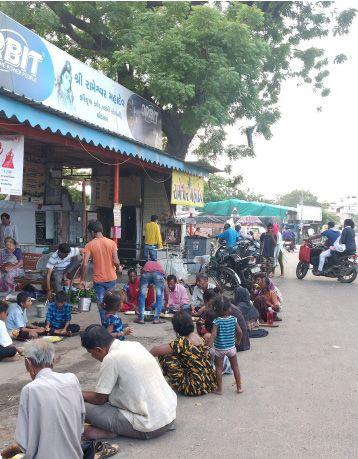
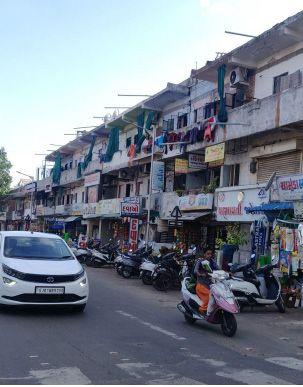
Note. Constant activity and the hustle-bustle of pedestrians and vehicles along these two streets. Studying these roads using determinants such as sense of enclosure, street edges, visual connectivity and sense of safety, bring out the character and justify the inherent nature of these streets. Adapted from “Understanding the City,” (Unpublished portfolio for Masters of Urban Design) by A. Rao, 2021, CEPT University. Copyright 2021 by A. Rao.
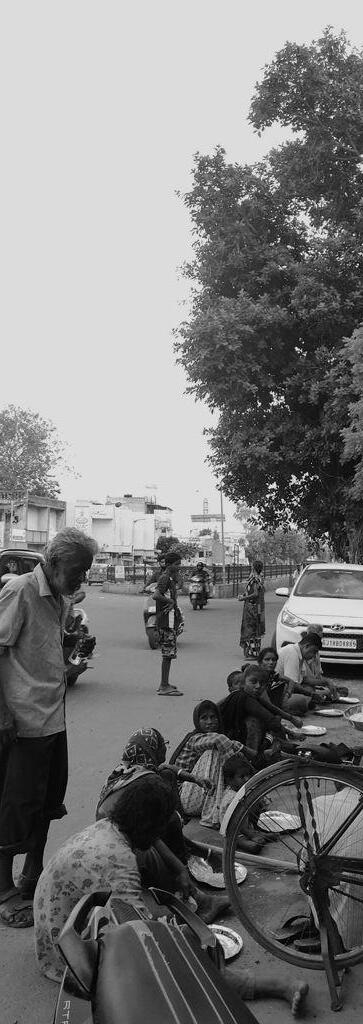
Activities such as the temple Annadanam along the Cadila road lend themselves to form activating edges. . Homeless people, especially young children from the surrounding areas, flock to this place and line up in front of the temple in the hopes of getting one good meal for the day.
With shops, commercial outlets, schools, banks and a number of other service-oriented stores, Cadila road is a vibrant mixed-use street that connects two major thoroughfares. This is in stark contrast to the street along the NH8, as can be seen in Figure 13.
13
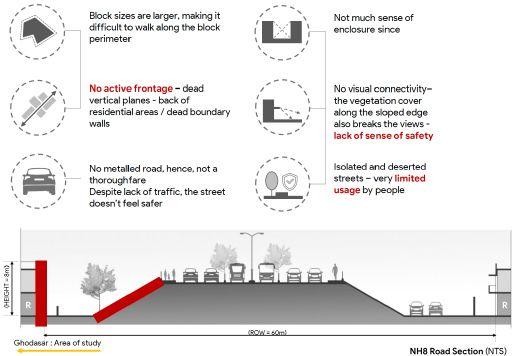
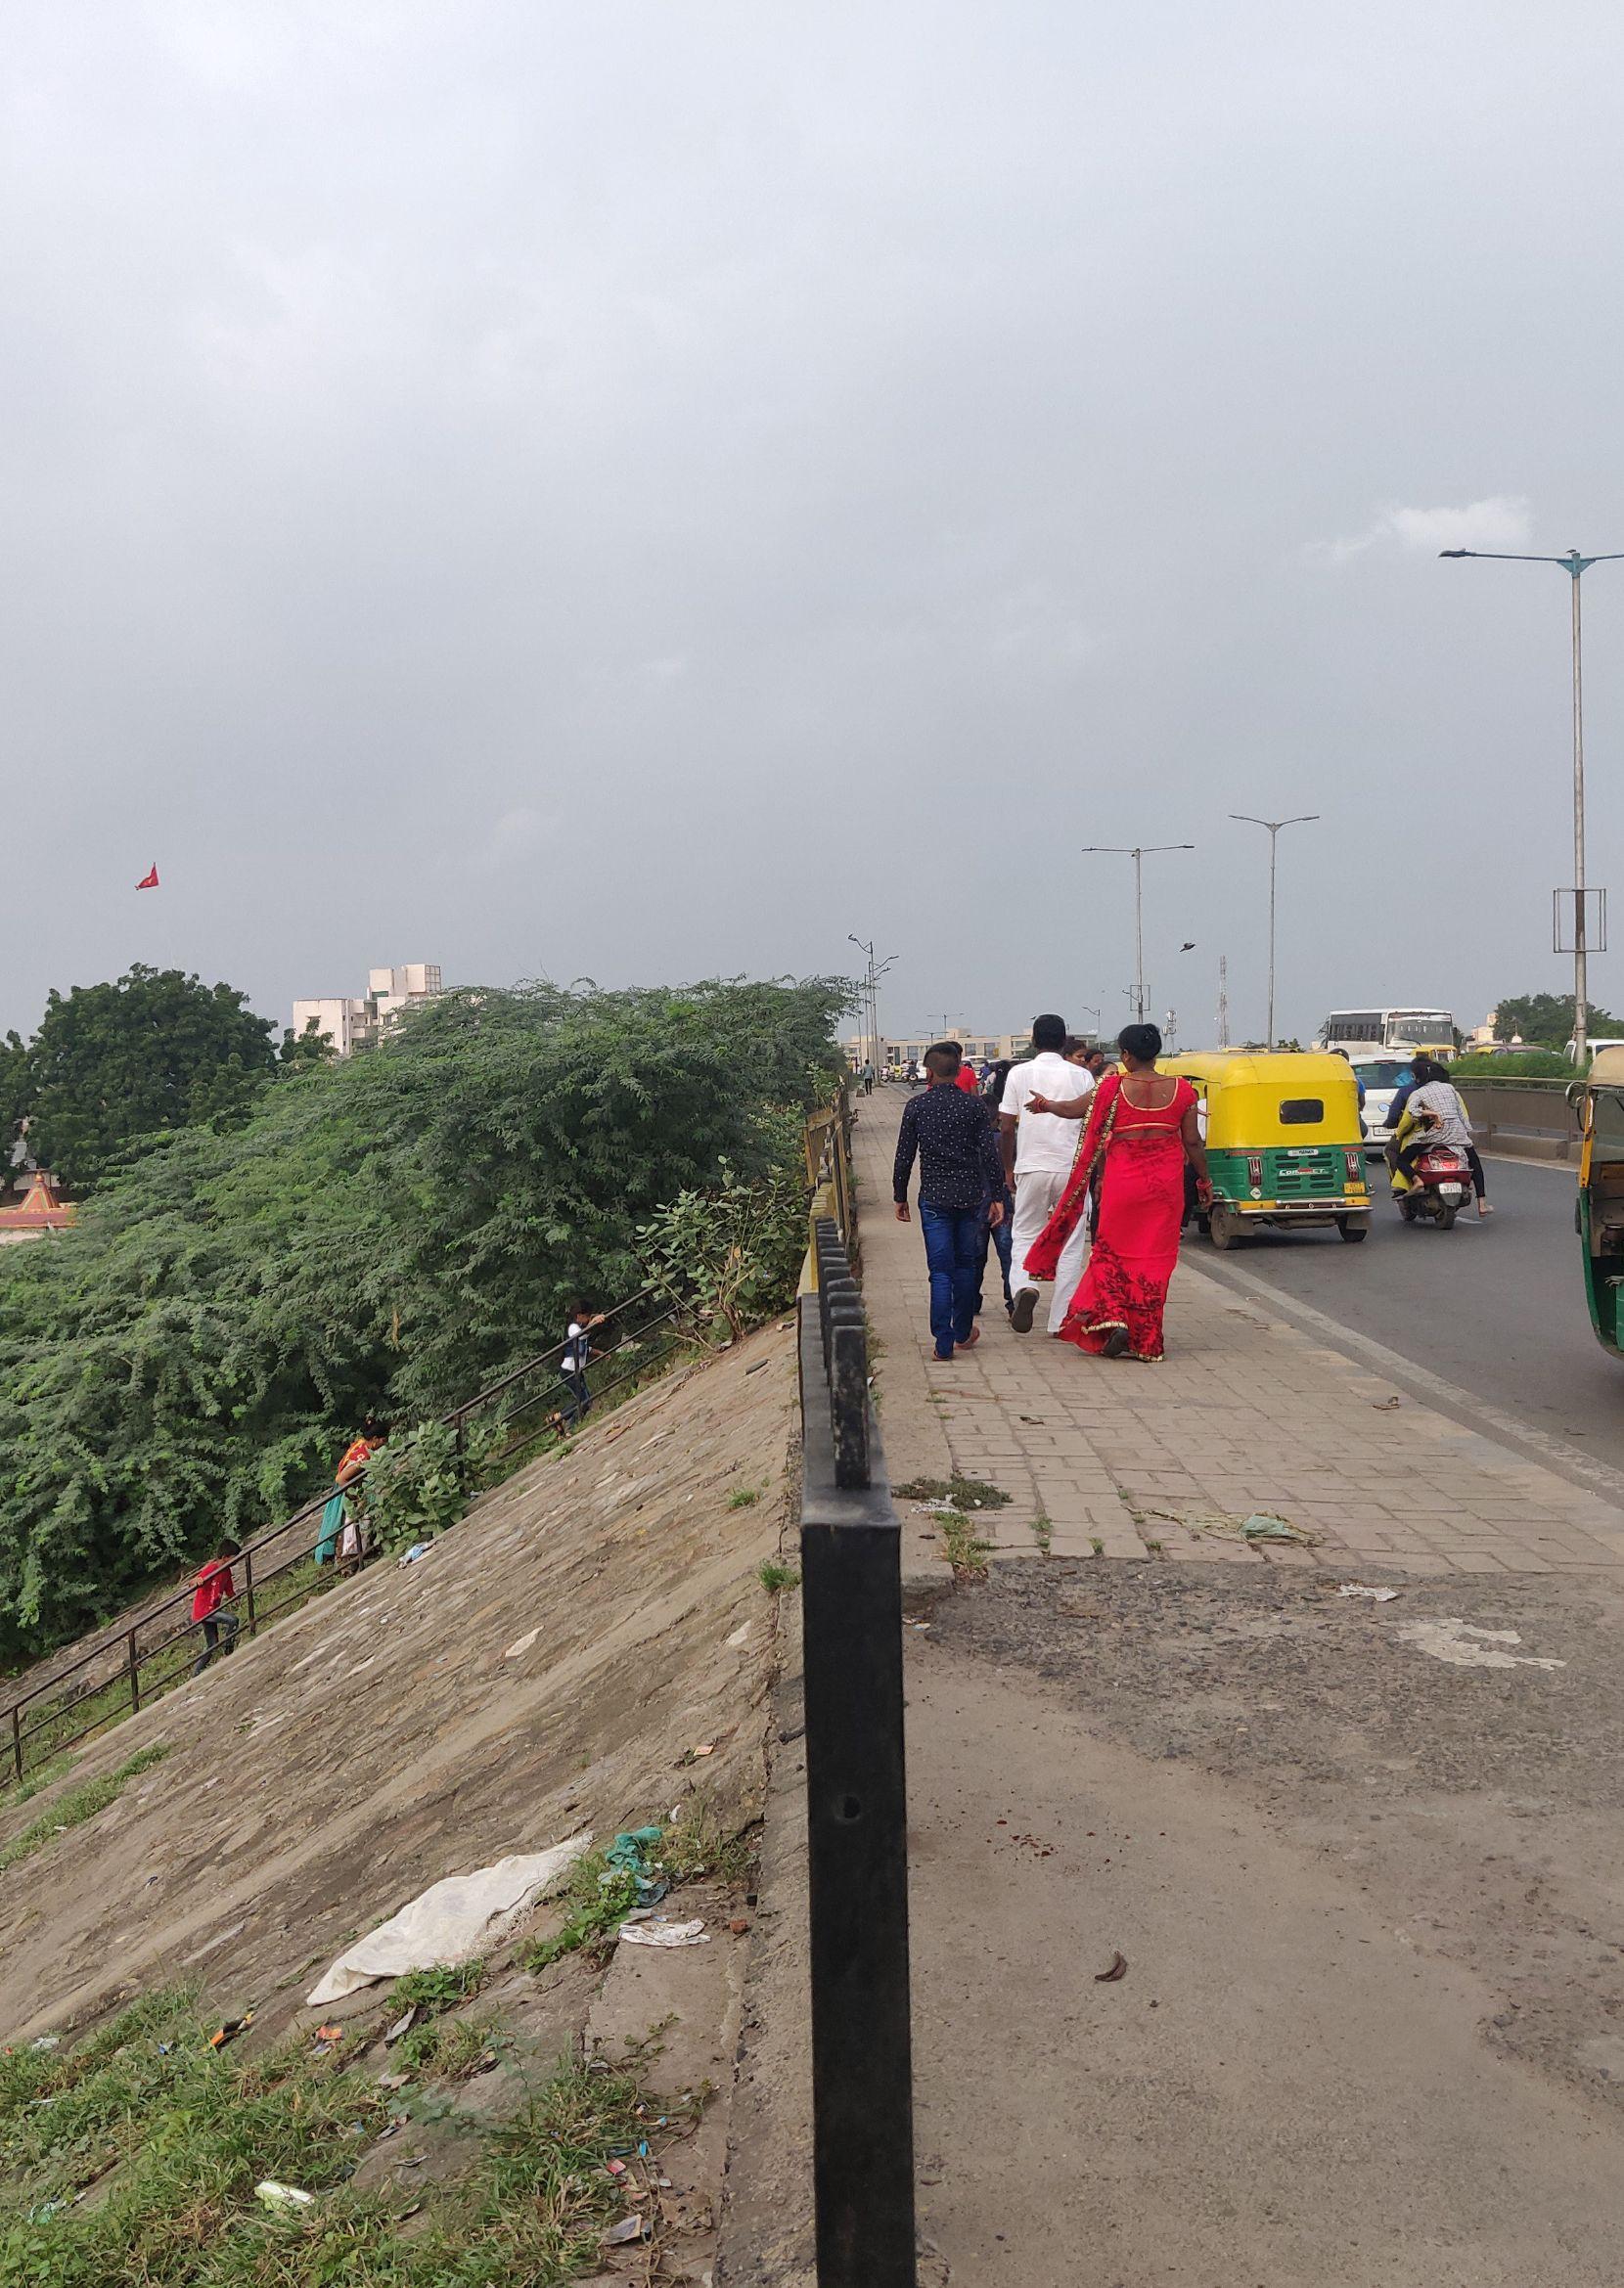
Note. Dead street edges and natural topography of the land create an inhospitable spatial experience, thus discouraging activity. This forms an isolating edge, disconnecting the people and activity on one side from the other.. Adapted from “Understanding the City,” (Unpublished portfolio for Masters of Urban Design) by A. Rao, 2021, CEPT University. Copyright 2021 by A. Rao.
As observed in Figure 3, since the block sizes are much larger along the highway, it considerably reduces the walkability and hence, the level of activity on this street.
By virtue of the topography in this stretch, the highway is elevated with filled earth below, which results in a lack of adequate street frontage for these
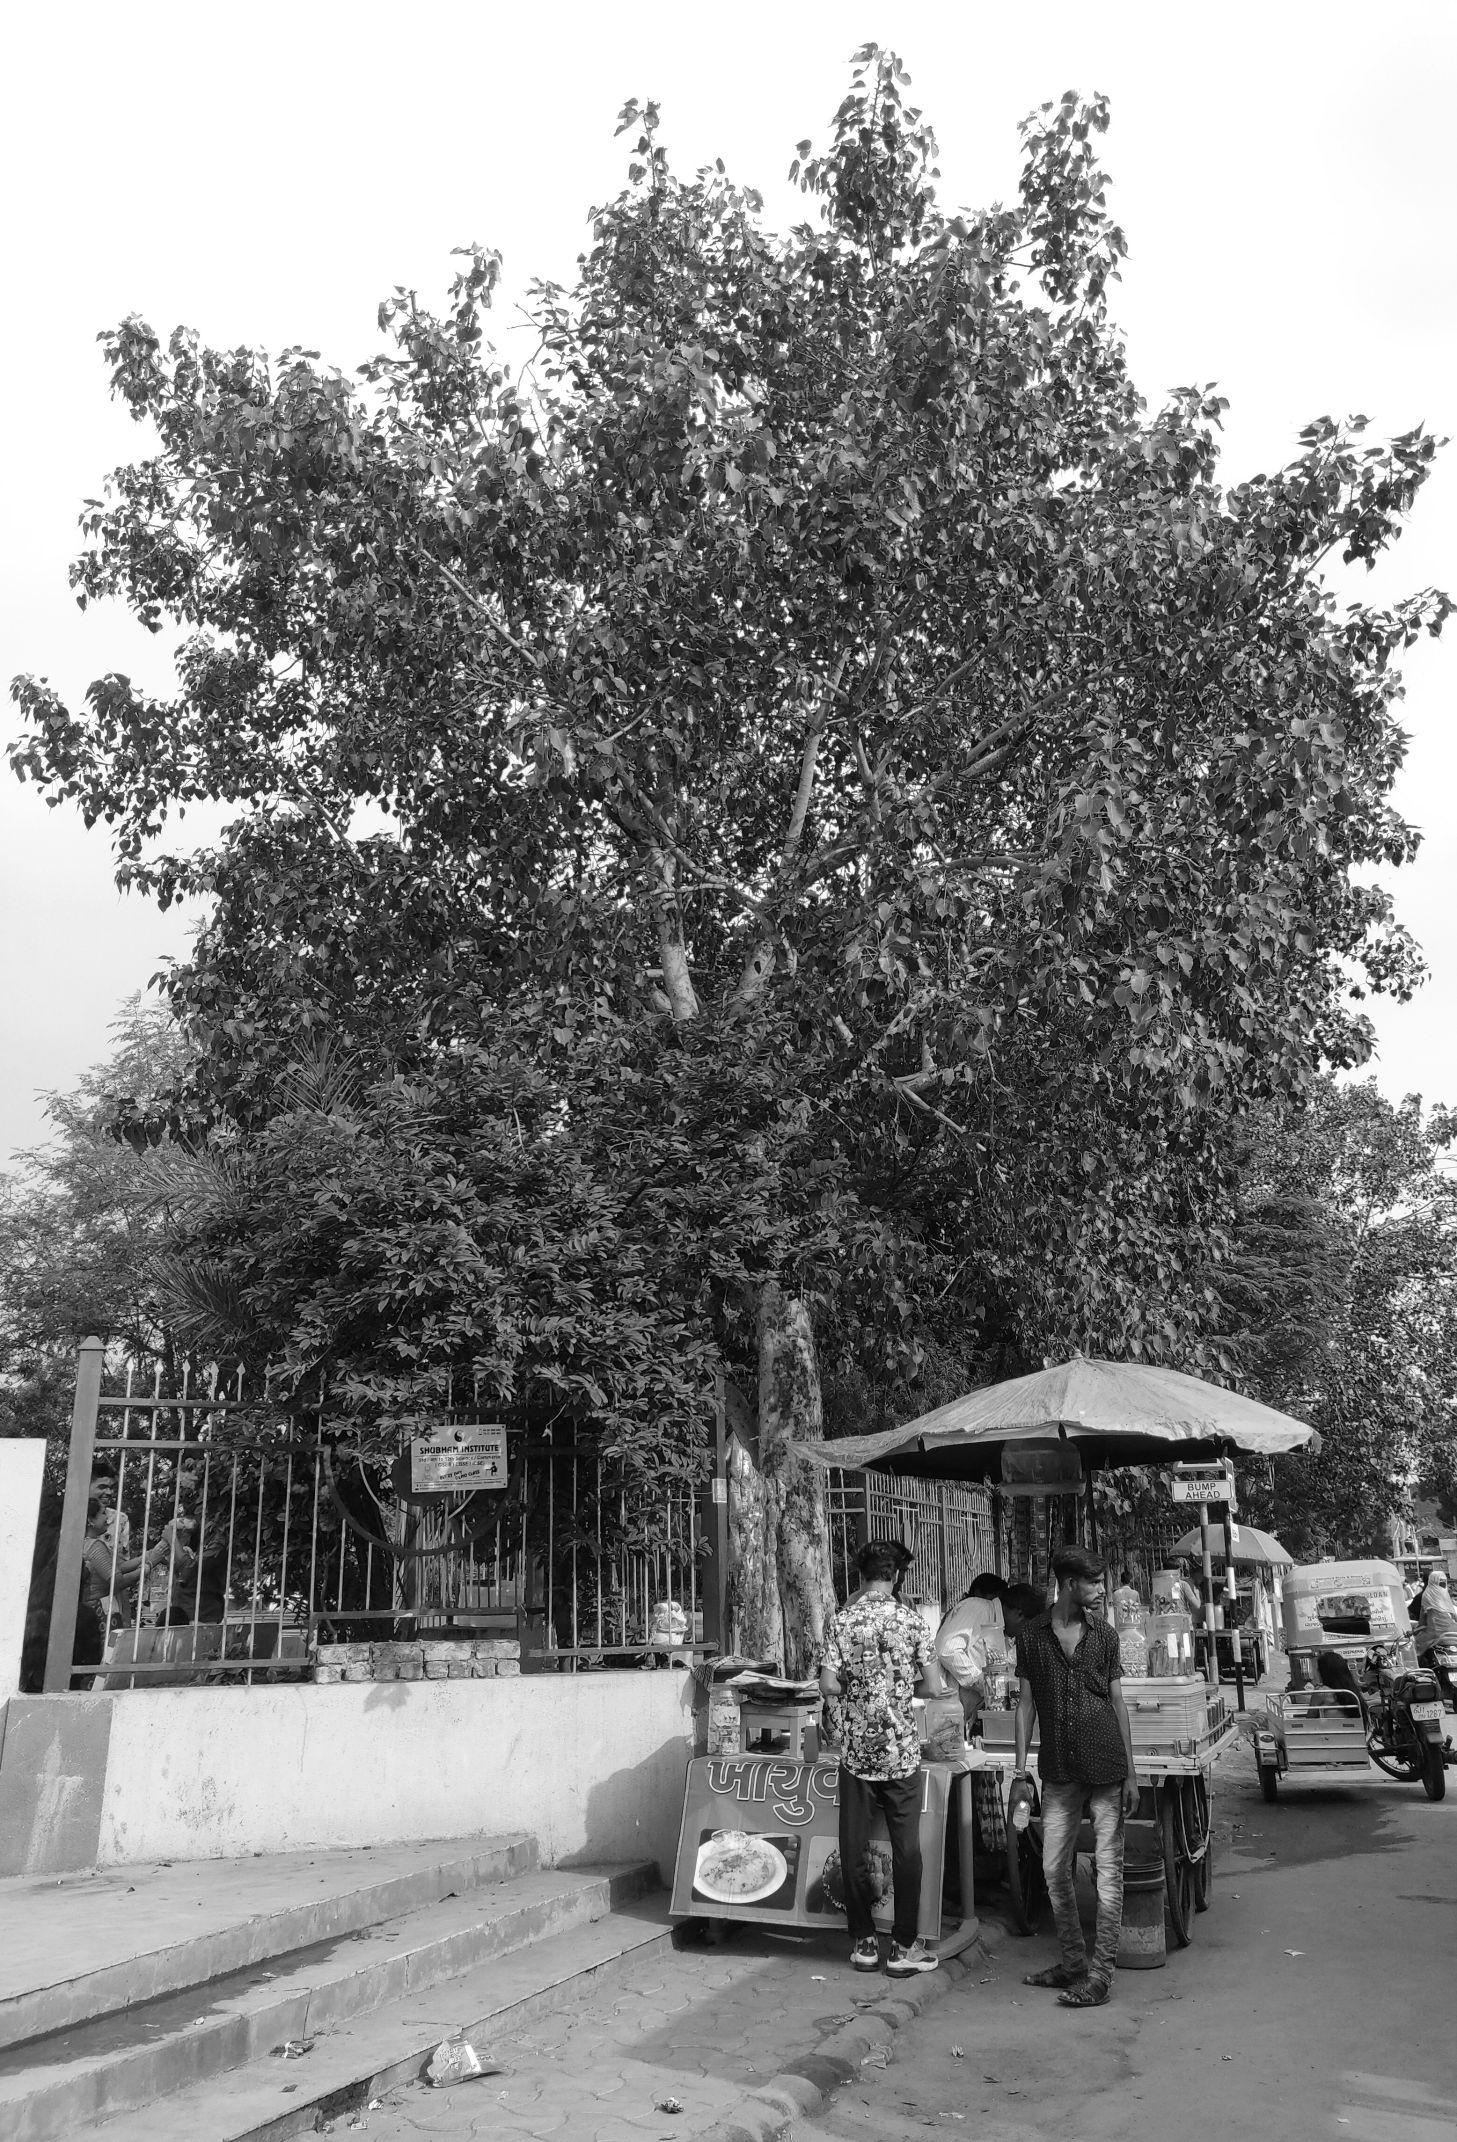
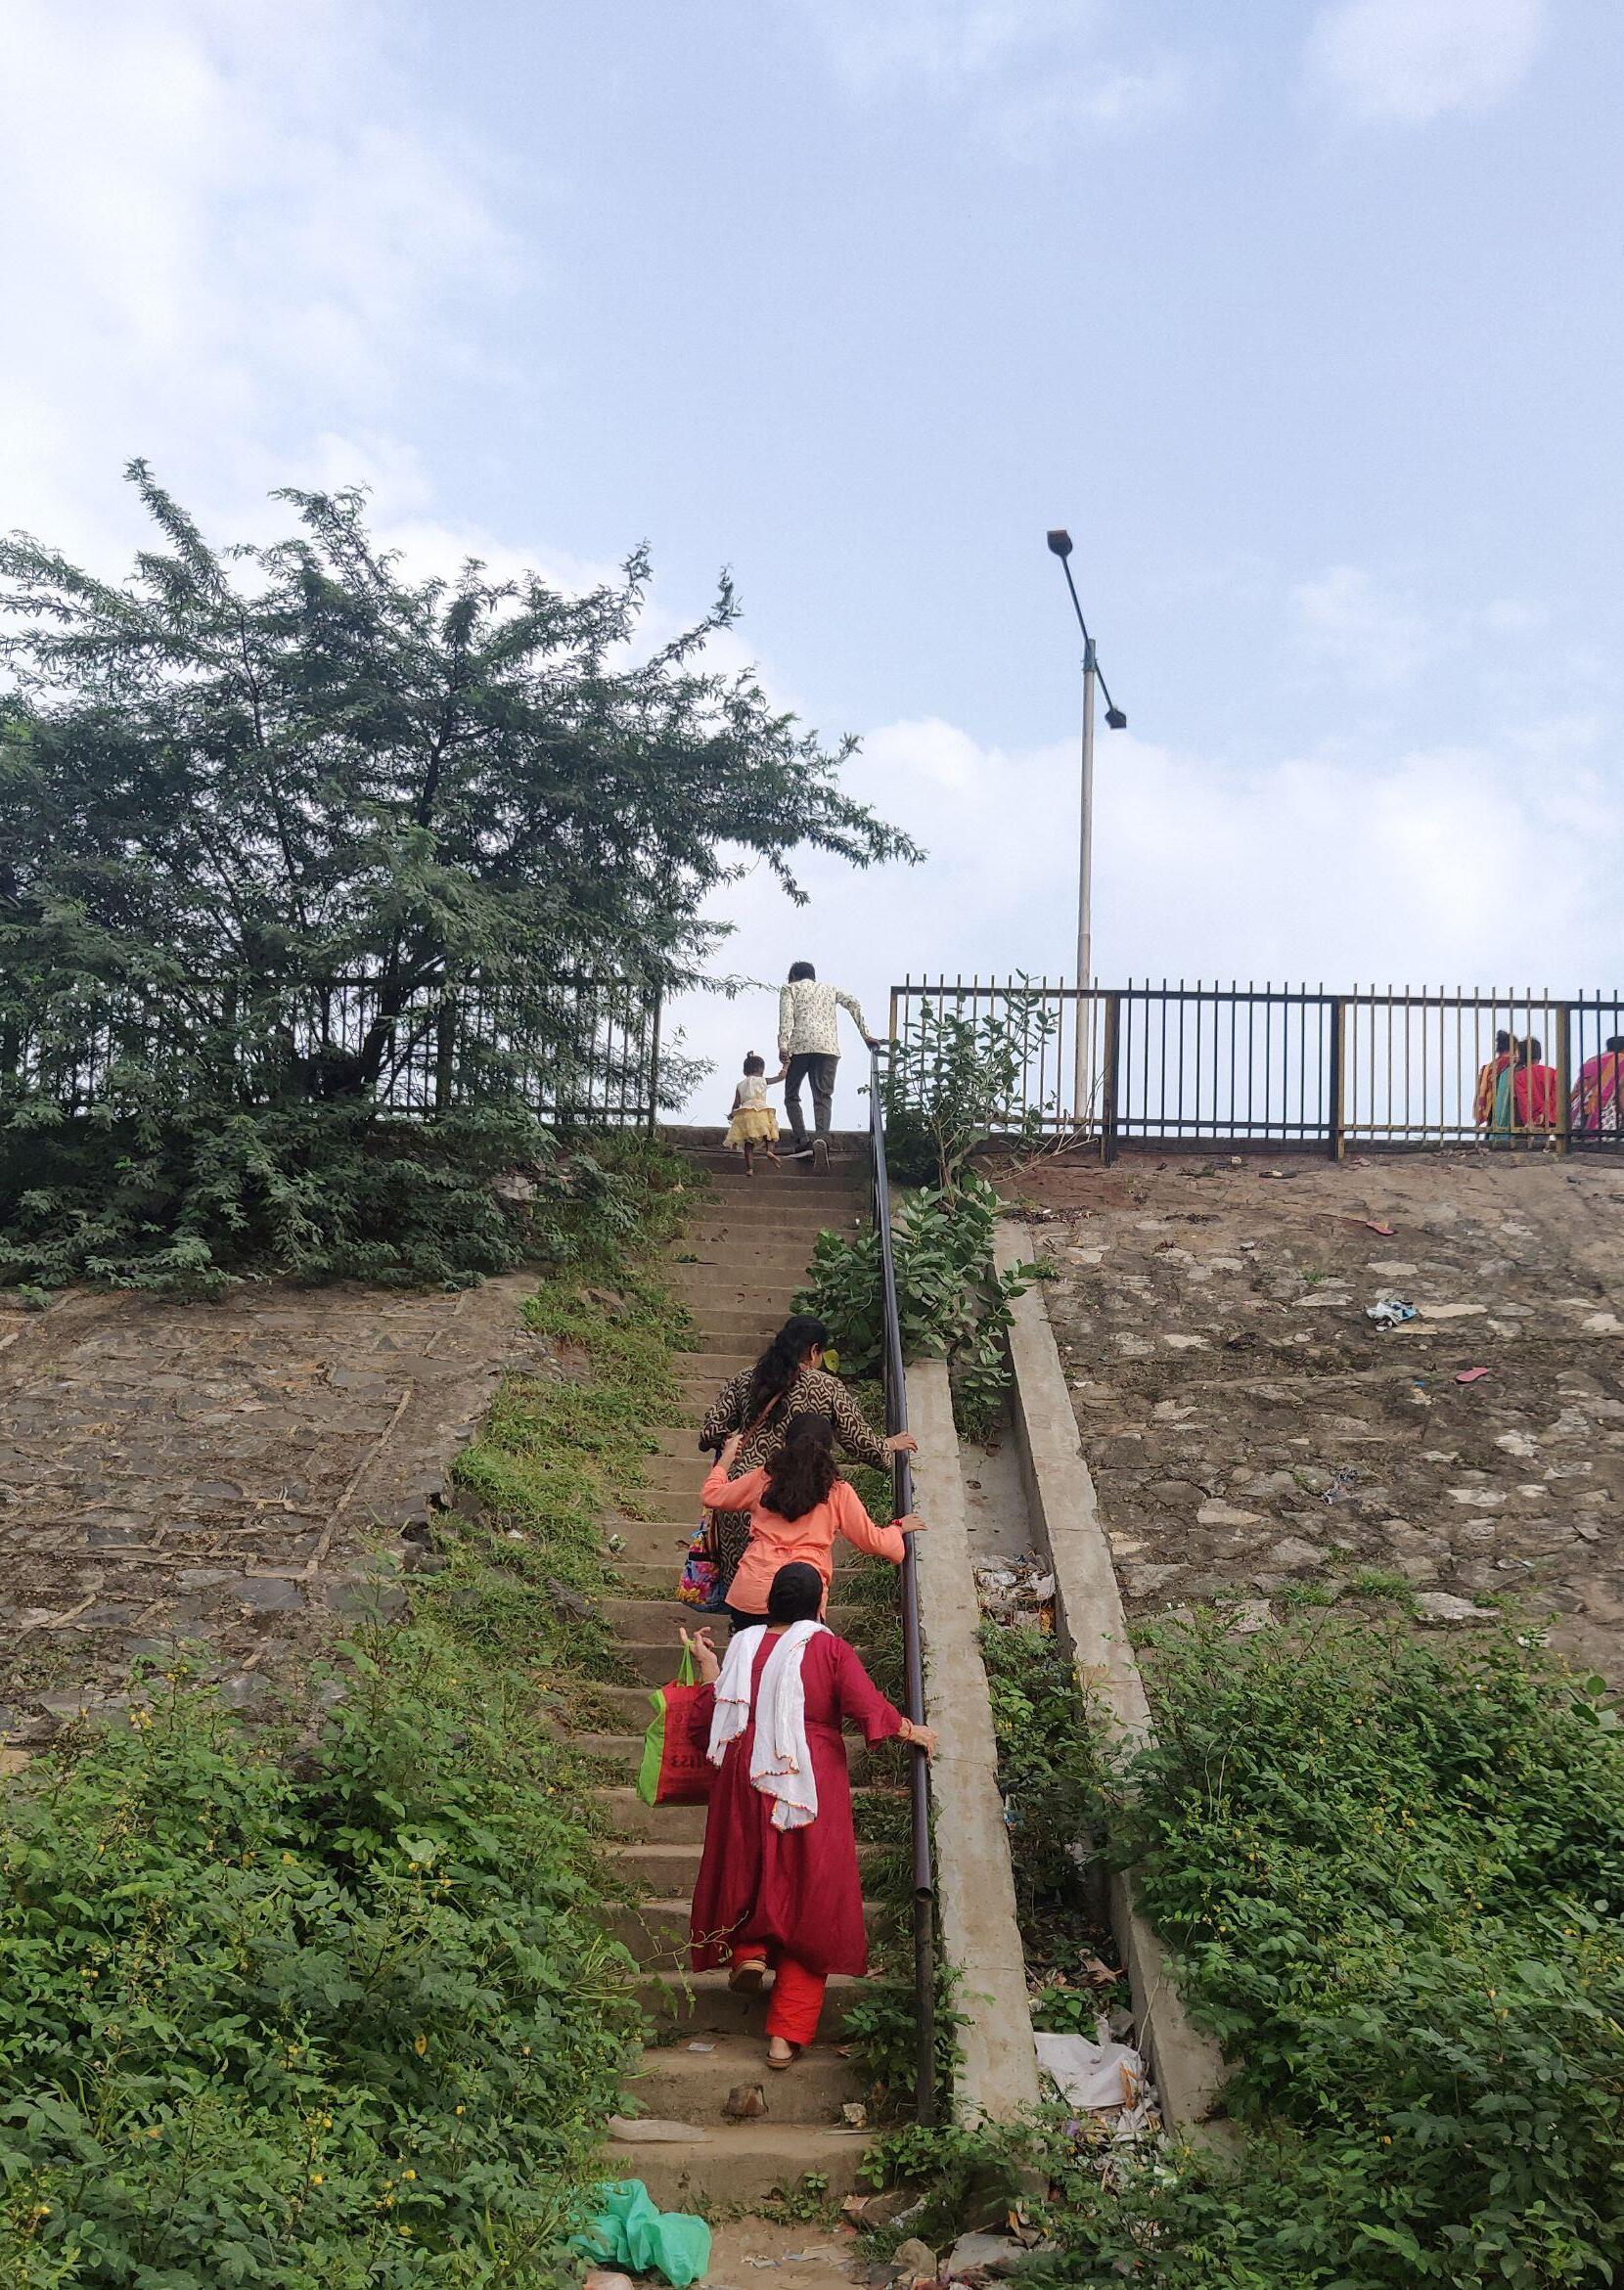
plots. Most of the built form along this street is formed by dead boundary walls or the back of residences. Compounding this effect is the sloped elevated edge of the highway creates a sense of visual disconnect. In addition to this, the vegetation cover along the sloped edge also creates a barrier and breaks the line of sight, making the area feel unsafe (see Figure 14).
Figure 14 LackofActivityAlongNH8
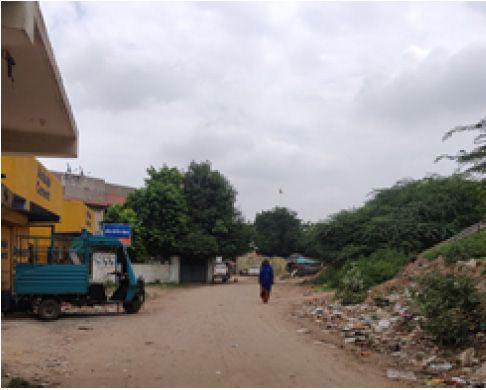
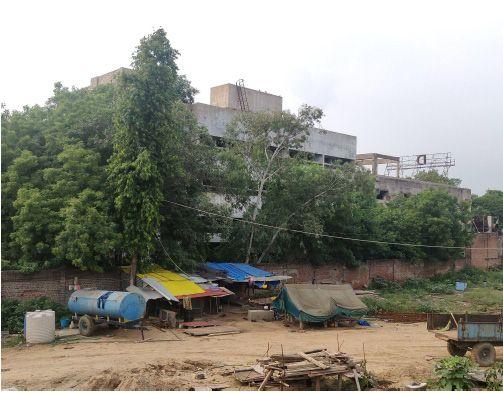
Note. Lack of an active street frontage, unmetalled roads, wild vegetation and the dead sloping edge of the highway, give this street a neglected and abandoned characteristic, causing it to be perceived as deserted and unwalkable by pedestrians. Adapted from “Understanding the City,” (Unpublished portfolio for Masters of Urban Design) by A. Rao, 2021, CEPT University. Copyright 2021 by A. Rao.
Each of the transit edges, namely the Cadila road, Canal road and highway street have varying but significant impacts on the walkability and perception of streets in the area. As seen from the block map and on-site observations, the Canal road and Cadila road behave as ‘activating edges’, creating safer and walkable streets. On the other hand, the NH8, Ring
road and Railway line form ‘isolating edges’ that are perceived as deserted and unsafe. They create an invisible extent of walkability in the neighborhood. Beyond these edges, the block perimeters become too large, making it difficult to walk. It can thus be concluded that the transit edges in the Ghodasar area act as strong ordering elements of walkability.
The neighbourhood of Ghodasar has seen periods of both sudden and stagnant developments in the last two decades. Several determinants, ranging from ecological, physical, infrastructural to policy decisions, have impacted the development process over the years. The implementation of BRTS along the NH8 facilitated the growing demand for more residential and commercial developments, albeit for a short period of time. The area has, since then, been in a phase of stagnation. It is imperative to address the issues of handling existing high densities before further development can be proposed.
Ghodasar has a dense and complex network of street hierarchy, with the major thoroughfares forming strong edges around it. The individual characters of these streets and their impact on the neighborhood, subtly but surely influence the growth and developmental pace, as can be seen through the examples of the Canal roads and the highway street.
As was discernible from the past, infrastructure development had been one of the major determinants of the evolution process in Ghodasar in the 2000s. The growing demand for better services and infrastructure suggests the scope and possibilities for appropriate investment in infrastructure. This would provide a major stimulus for the development of this area, giving it the much-needed impetus for growth.
Asri, A., Damayanti, R., Wijayanto, T. (2009). Urban shape of Ahmedabad city triggered by industrial activity; Case study of industrial estates of GIDC.
AUDA (2015). Comprehensive Development Plan 2021 (Second Revised).
Centre of Excellence in Urban Transport (CoE) (2014). AhmedabadJanmarg. UNESCAP Regional Expert Meeting & 2nd Asia BRTS Conference
Citizen Facilities, Municipal Parks, Amdavad Municipal Corporation https://ahmedabadcity.gov.in/portal/jsp/Static_pages/citizen_Municipal%20Parks.jsp
Damayanti, R. Effects of industrial activities on land occupation in Ahmedabad - India, case study of GIDC industrial estates
Dill, Jennifer. (2004). Measuringnetworkconnectivityforbicyclingandwalking. School of Urban Studies and Planning, Portland State University
Gillion, Kenneth L. (1968). Ahmedabad: A study in Indian urban history, University of California Press.
HierarchyofroadsinIndia(2021, September 10). Planning Tank. https://planningtank.com/transportation/hierarchy-of-roads-india
Jacobs, A. (1993). Greatstreets. MIT Press
Jacobs, J. (1961). ThedeathandlifeofgreatAmericancities. Random House, New York
Joshi, R., Joseph, Y., Patel, K., Darji, V. (2017). Transit-oriented development: Lessons from Indian experiences. CentreforUrbanEquity,CEPTUniversity.
Lin, J.J., Gau, C.G. (2006). A TOD planning model to review the regulation of allowable development densities around subway stations. Land Use Policy, 23( 3 ), https://doi.org/10.1016/j.landusepol.2004.11.003
Lynch, K. (1960). Theimageofthecity. MIT Press Ltd.
Rao, Akanksha. (2021). Understandingthecity. Unpublished portfolio for Masters of Urban Design. CEPT University.
Servicelevelbenchmark:UrbanTransport(2021, September 9). Ministry of Urban Development http://utbenchmark.in/UsersidePages/CityProfile.aspx?City=1
Transformingtheurbanspacethroughtransit-orienteddevelopment:The3Vapproach.The World Bank https://www.worldbank.org/en/topic/transport/publication/transforming-the-urban-spacethrough-transit-oriented-development-the-3v-approach