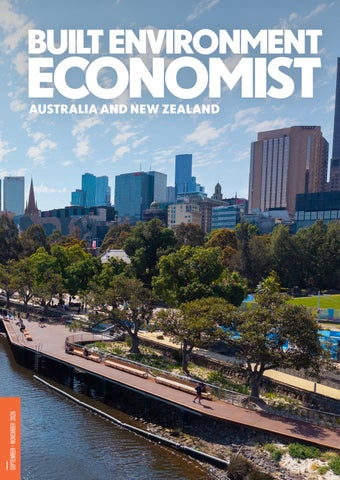
SEPTEMBER – NOVEMBER 2026
The pages used in this publication have been printed with Sustainable Green Print industry certification.
28 THE GREENLINE PROJECT
32 ROEBOURNE DISTRICT HIGH SCHOOL REDEVELOPMENT CASE STUDY
40 THE HIDDEN CYBER RISKS FACING QUANTITY SURVEYORS IN 2026
54 HUMAN ROBOT TEAMING FOR SUSTAINABLE AND RESILIENT CONSTRUCTION
CONTENTS 2
CEO Letter
4
Creating a world-class venue, guided by Function Analysis
36 The quiet battle: navigation depression and imposter syndrome in my professional career 39 Q&A
10 Can You Trust Your BIM Takeoff? A Quantity Surveyor's Guide to Model Validation
40 The Hidden Cyber Risks Facing Quantity Surveyors in 2026
16 Building boom in South East Queensland
42 Latent Conditions
20 Lessons for Expert Quantity Surveyors
45 Rethinking Failure in Construction and Building Resilient Firms
22 From Quantity Surveyor to Decision Intelligence 24 Beyond Reform: Building a New Delivery Mindset for Construction 28 The Greenline Project: Birrarung Marr Site One 32 Roebourne District High School: Building More Than a School
ABOUT The Built Environment Economist is the flagship publication of The Australian Institute of Quantity Surveyors (AIQS). Produced quarterly, the Built Environment Economist seeks to provide information that is relevant for quantity surveying and construction professionals, as well as asset owners.
SUBSCRIBE At aiqs.com.au/shop you can purchase a copy of this edition or subscribe for 12 months. ADVERTISE Contact AIQS to discuss available opportunities: Katie Freeman Brand Engagement Specialist T: +61 2 8234 4000 E: marketing@aiqs.com.au
49 Environmental Product Declarations (EPDs) Simplified 54 Human Robot Teaming for Sustainable and Resilient Construction: A new era dawns 60 Building Cost Index
CONTRIBUTE AIQS encourages readers to submit articles relating to quantity surveying, the built environment and associated industries including: construction economics, cost estimating, cost planning, contract administration, project engineering. If you would like to contribute, email marketing@aiqs.com.au.
DISCLAIMER AIQS does not take any responsibility for the opinions expressed by any third parties involved in the writing of the Built Environment Economist. ISSN 2652–4023
PROFESSIONAL COLLEGIALITY: A FOUNDATION FOR A STRONGER BUILT ENVIRONMENT In early July, AIQS President Fiona Doherty FAIQS CQS and I attended the NZIQS conference in Auckland. Held at Auckland's impressive International Convention Centre under the inspiring theme "Rise Together", the conference provided an outstanding opportunity to hear from industry leaders, share knowledge, explore emerging trends and connect with colleagues from across New Zealand. The event concluded with a fun gala dinner recognising excellence within the profession through a series of awards. Attending the events made me reflect on how much members of NZIQS enjoyed coming together and the critical role that AIQS and NZIQS play in bringing members of the quantity surveying profession together to socialise and build and strengthen bonds and professional knowledge.
CEO LETTER By Dr James Cameron
2
BUILT ENVIRONMENT ECONOMIST: SEPTEMBER – NOVEMBER 2026
As the built environment becomes more complex, interconnected and fast-moving, the role of the quantity surveyor continues to evolve. Quantity surveying professionals are navigating increasingly sophisticated projects, rising stakeholder expectations, technological transformation, sustainability imperatives and economic uncertainty. In this environment, one quality stands out as essential to the continued success of our profession: professional collegiality. At its core, collegiality is about more than professional courtesy. It is about fostering a culture of collaboration, knowledge sharing and mutual support that enables practitioners to collectively tackle challenges that no individual, organisation or discipline can solve alone. For quantity surveyors, it is both a professional responsibility and a strategic advantage.
CEO LETTER
The complexity of our profession has expanded significantly in recent years. Quantity surveying professionals are now expected to provide insight across the entire project lifecycle, from feasibility and procurement through to delivery, asset management and sustainability outcomes. Quantity surveying professionals are working with increasingly sophisticated data, emerging technologies and evolving regulatory frameworks. At the same time, clients expect greater certainty, transparency and value from every project. No one practitioner can possess all the answers. The ability to learn from peers, share experiences and exchange ideas has never been more important. Every project presents unique challenges, and some of the most valuable professional insights come not from journal articles or technical manuals, but from conversations with colleagues who have faced similar situations. A profession that actively shares knowledge becomes stronger, more resilient and better equipped to adapt to change. Collaboration is equally important beyond our immediate professional community. The built environment is shaped by the collective efforts of designers, engineers, project managers, contractors, asset owners, government agencies and many others. Quantity surveying professionals occupy a unique position within this ecosystem, helping stakeholders balance cost, risk, value and performance. Achieving successful project outcomes increasingly depends on effective collaboration across organisations and disciplines. By building strong professional relationships and fostering open communication, we can help break down silos and create a more integrated approach to project
delivery. When diverse expertise is brought together, better decisions are made, risks are identified earlier and opportunities for innovation emerge. In an increasingly global industry, collegiality also extends beyond national borders. Quantity surveying professionals have much to gain from engaging with international peers and learning from experiences in other markets. Whether addressing housing affordability, infrastructure investment, decarbonisation or digital transformation, many of the challenges we face are shared worldwide. International collaboration enables the exchange of ideas, best practices and lessons learned, enriching the profession and helping local practitioners remain at the forefront of industry developments. Professional institutions play a critical role in fostering this culture of collegiality. They provide trusted platforms where practitioners can connect, learn and contribute to the advancement of the profession. Through professional development programs, industry events, technical guidance, mentoring initiatives and research, institutions help create an environment where knowledge is shared and professional standards continue to rise. Mentoring is particularly important. The future strength of the profession depends on our willingness to support and develop the next generation of quantity surveyors. Experienced professionals have an invaluable opportunity to pass on technical expertise, practical wisdom and professional values. Equally, emerging professionals bring fresh perspectives, new skills and innovative thinking that benefit the broader industry. Collegiality thrives when knowledge flows in both directions.
Ultimately, professional relationships are not only beneficial for individual practitioners; they generate tangible value for the entire built environment sector. Strong networks create opportunities for collaboration, innovation and continuous improvement. They help build trust between stakeholders, improve problem-solving and strengthen the profession’s collective voice on issues that matter to industry and society. The beneficiaries extend far beyond our profession. Better collaboration leads to better project outcomes, more informed clients and stronger, more sustainable communities. Quantity surveying professionals have an important role to play in shaping the future of the built environment. By embracing collegiality and investing in our professional relationships, we strengthen not only our own profession but also the industry and communities we serve. In a world defined by complexity, collaboration is no longer optional. Professional collegiality is one of the most important foundations of professional excellence and a key driver of a stronger, more resilient built environment.
With best wishes, DR JAMES CAMERON AIQS CHIEF EXECUTIVE OFFICER
BUILT ENVIRONMENT ECONOMIST: SEPTEMBER – NOVEMBER 2026
3
CASE STUDY
CREATING A WORLD-CLASS VENUE, GUIDED BY FUNCTION ANALYSIS BNZ THEATRE
4
BUILT ENVIRONMENT ECONOMIST: SEPTEMBER – NOVEMBER 2026
CASE STUDY
Described by NZ Herald arts commentator Dionne Christian as “New Zealand’s most beautiful theatre,” the world-class facility is a massive economic and cultural catalyst for the Waikato region.
The wider precinct includes four commercial tenancies, two function spaces and a revitalised public realm, featuring a multi-level riverside foyer, outdoor ātea and the renewed Embassy Park.
need to raise funding from the Waikato region in a recessionary environment and aspiring to deliver excellence, developing a brief that optimises each of the drivers without compromising the others is a vital starting point.
The old Hamilton Founders Theatre was closed for safety reasons in 2016; this project was developed for Waikato Regional Property Trust and key funding partners.
THE OBJECTIVE
Early in the project, RDT Pacific initiated a Value Enhancement process that included Function Analysis, facilitated through two workshops in September 2018 that set the objectives for the project.
The multi-purpose performing arts centre, situated on the banks of the Waikato River at the old Victoria Street site, opened its doors to a sold-out gala performance in January 2026, marking the end of a seven-year briefing, design, procurement and construction journey. The 8,700sqm development comprises a 1,300-seat spectacular auditorium capable of operating in modes including theatrical, orchestral and concert, supported by back-of-house facilities including change rooms, administration areas and advanced stage engineering systems. The project also integrates the restored 1923 Hamilton Hotel façade and significant heritage elements, including original timber features and historic joinery.
The objective was to create a flexible, future-focused theatre integrating worldclass amenity. Continuing the legacy of the beloved Founders Theatre, the venue was designed to support international touring acts while remaining accessible to regional performers, schools, and community groups. Equally important was revitalising a prominent but underutilised CBD site, celebrating the historic significance of the site and reconnecting the city to the Waikato River.
FUNCTION ANALYSIS RDT Pacific brought an understanding of what is required for a successful community project.
The process ensured that owners, funders, operators, consultants and contractors were clear on the project’s purpose, objectives and strategies (and why they mattered). It assisted stakeholders to define intended outcomes and reduced the risk of late-stage design shifts, consequential delays and cost pressure as what was envisaged in the study was built within the project budget. It also helped strengthen the working relationship between the design team and stakeholders through clarity of objectives.
Conscious of the multiple constituents, each advocating to optimise their part of the project, constrained by the
Figure 1 - Function diagram: linking core purpose to objectives and delivery strategies
BUILT ENVIRONMENT ECONOMIST: SEPTEMBER – NOVEMBER 2026
5
CASE STUDY
“A key factor in the success of this project was the project management role being underpinned by a thorough Function Analysis study involving all stakeholders. Stakeholders often assume shared understanding, but this process tests that hypothesis” In practice, the Function Analysis work focused on four simple steps: 1.
Confirm the full stakeholder map and ensure good representation in decision making.
2.
Separate function requirements from aspirational objectives and agree priorities.
3.
Translate agreed outcomes into a structured brief and decision criteria (the function diagram).
4.
Use the outputs as a live reference point as conditions change.
RISK CLARITY Participants in the Value Enhancement workshops identified risk clarity as a desirable adjunct to Function Analysis. So in a similar vein, with all stakeholders present and objectives fully identified, risk at each stage (planning, construction and operating) was quantified and used to inform the planning priorities employed.
6
As a consequence, provisioning was appropriate and the project managers were enabled to better identify and manage potential points of failure. This approach to risk also informed the choice of the contracting model adopted and the transfer of risk to the party thought best able to manage it.
THE CHALLENGES A central challenge was building community support for a new theatre
BUILT ENVIRONMENT ECONOMIST: SEPTEMBER – NOVEMBER 2026
(rather than refurbishing the former Founders Theatre, which could no longer meet modern needs), while also raising funding during the economic downturn after Covid. On site, delivery was complex. The footprint was tight and in the heart of the city, and the team had to connect a new build with protected heritage elements while delivering specialist theatre requirements for acoustics, structure and stage systems.
CASE STUDY
Retaining the 1923 Hamilton Hotel façade was a major task. A steel retention structure was required to support the façade during demolition and reconstruction behind it, before it was tied back and restored. At the same time, global shortages and shipping delays affected materials and equipment. Prices rose, and the project required careful coordination across specialist designers, consultants and subcontractors. Delivered over a seven-year programme, the project required disciplined cost control, programme management and risk mitigation in a challenging market. The mixed funding model - balancing government, philanthropic and community investment - added further complexity and demanded transparency and accountability throughout delivery.
THE OUTCOME 12 months of demolition, a fiveyear construction programme, 536 companies involved in the project - the BNZ Theatre build story is one of community, local capability, and regional pride in delivering a worldclass theatre for the Waikato. BNZ Theatre opened in January 2026 as a flexible, multi-mode performing arts venue and civic destination for Kirikiriroa Hamilton and the wider Waikato region. Operational settings include a long term venue management agreement with Live Nation, alongside community access measures such as discounted hire for eligible non-profit organisations, community bookings bundled with inhouse equipment to reduce production costs, and a dedicated contribution to a community fund to subsidise local use from every commercial ticket sold.
BUILT ENVIRONMENT ECONOMIST: SEPTEMBER – NOVEMBER 2026
7
CASE STUDY
The completion of the project saw the realisation of the objectives identified during the Function Analysis process and ultimately the project’s core purpose and confirms the benefit of this process on complex community projects.
New Zealand Institute of Architects Waikato & Bay of Plenty Architecture Awards 2026, and took out the Civic category and the Premier Award at the inaugural New Zealand Interior Awards.
BNZ Theatre's quality has since been recognised industry-wide. At the Property Council New Zealand Property Industry Awards 2026, the venue received Excellence and Best in Category for Heritage & Adaptive Reuse, along with an Excellence award in Civic, Health & Arts.
Equally rewarding has been the response from performers themselves. Following recent concerts, the New Zealand Symphony Orchestra Te Tira Pūoro o Aotearoa spoke highly of the venue's sound and feel, with James Judd describing it as one of the best orchestral venues in New Zealand.
It was also named a winner in both the Heritage and Public Architecture categories at the Te Kāhui Whaihanga
8
BUILT ENVIRONMENT ECONOMIST: SEPTEMBER – NOVEMBER 2026
FAST FACTS Client: Waikato Regional Property Trust Location: 198 Victoria Street, Hamilton Central Value: >$110m Completion: 28 November 2025 Project Manager: RDT Pacific Quantity Surveyor: Kingston Partners Design Team: Jasmax; Charcoalblue Building Contractor: Foster Construction This case study has been written and supplied by RDT Pacific. Photos supplied by RDT Pacific, with image credit to BNZ Theatre / Live Nation New Zealand.
Build Smarter Estimates with
CostX Cloud Takeoff, estimate and collaborate in one connected cloud environment. CostX Cloud gives quantity surveyors and greater flexibility, accessibility and team collaboration while maintaining the trusted capabilities of CostX.
Contact Us Today
BIM
CAN YOU TRUST YOUR BIM TAKEOFF? A QUANTITY SURVEYOR'S GUIDE TO MODEL VALIDATION By Amirul Izzat, RIB Software
10 BUILT ENVIRONMENT ECONOMIST: SEPTEMBER – NOVEMBER 2026
BIM
As the adoption of building information modeling (BIM) grows across the AEC industry, it presents an opportunity to transform our approach to measurement, estimation, and project planning. But can you trust your BIM model? With quantities extracted directly from digital building models, BIM quantity takeoff workflows are faster, more efficient and consistent than traditional measurement methods. However, as any experienced quantity surveying professional will know, model-based quantities are only as reliable as the data they originate from. If left unchecked, missing elements, incorrect classifications, and incomplete modeling can affect estimating accuracy. This makes BIM quality matter even more than BIM adoption. This blog explores whether the quantities coming from BIM models are indeed trustworthy. And, drawing on the experience of RIB Software's Amirul Izzat as a junior quantity surveyor (QS), we unpack the view that with the right quantity takeoff workflows, you can build trust through verification.
WHAT IS BIM TAKEOFF? The BIM takeoff process is a departure from the traditional method of manually measuring from 2D drawings. It is the process of extracting quantities directly from a building information model to support cost estimating, budgeting, and project planning. In the process, QS can leverage intelligent 3D model data to calculate elements like area, counts, volume, and length more efficiently. Supported by a well-structured model, BIM quantity takeoff can significantly improve productivity and create a clearer link between design information and cost planning in construction.
The speed, accuracy, and quality of quantity takeoffs depend on the quality of the model, which makes model validation a critical part of quantity takeoff methods. QS must validate the quality and completeness of model data before relying on it for estimating, cost management, and procurement decisions. This is how to build confidence in BIM data.
TRUST, BUT VERIFY: A MODERN QS APPROACH TO BIM TAKEOFFS Around 2010, Amirul Izzat was a junior quantity surveyor on a commercial building project. At the time, BIM was still new and few people had much experience with it. Izzat's team worked under a simple assumption: once they had the 3D model, they could measure everything – the model would do all the work for them. It didn't quite turn out that way.
A LESSON FROM PAST EXPERIENCE They were working on a commercial building with a significant interior fitout. Yet, deeper into the takeoff, they discovered entire parts of the job were missing from the model – and not minor things either.
“The more we looked, the less we trusted what we were seeing.” What still haunts him to this day is that the real damage wasn't the missing quantities so much as how this impacted his team's confidence – it disappeared through the gaps in the model. Once trust is gone, it's gone for good.
BUILT ENVIRONMENT ECONOMIST: SEPTEMBER – NOVEMBER 2026 11
BIM
When they reviewed the quantities already measured from the model, they decided they couldn't rely on any of them. They went back and measured everything once more from the 2D drawings. The good data got thrown out along with the bad. It was an expensive lesson that taught him not to question whether BIM is good or bad, but rather to question whether to trust the BIM model blindly. By the same token, blindly rejecting a model wasted perfectly good information. The answer sat somewhere in the middle – it came down to the old trust but verify principle.
WHAT A QUALITY CHECK ACTUALLY FINDS Izzat concluded that the modern quantity surveying workflow starts with checking, not measuring. When a BIM model arrives, it should be assessed for quality, completeness, and usability – that is, before any BIM quantity takeoff even begins.
“On that project, excavation, formwork, and finishes were not modeled at all. Missing elements are only the beginning.” A proper quality check surfaces problems that are far less obvious – the way elements get classified incorrectly, and modeled without parameters or metadata, for example, or inconsistent modeling practices across disciplines. It creates generic objects with limited quantity information, while elements are grouped together in ways that quietly under-report their true counts.
These are problems that often remain hidden if a QS immediately begins measuring from the model. This is why quality checking tools exist. There are several validation platforms around, but Izzat stresses it's not about which tool you use, but rather that you run the check before quantity extraction starts.
“If I had checked that model back in 2010, I would have started the job with my eyes open instead of discovering the problems halfway through.” THE VERIFICATION WORKFLOW IN EIGHT STEPS QS should follow a structured BIM takeoff workflow to help them move confidently from model review to final estimate, while maintaining quality control every step of the way.
1 2 3 4 5 6 7 8
reliably extracted from the BIM model, and which must be measured from 2D drawings instead. But sidestepping the data matrix leaves QS teams working without a plan. They often discover gaps midway through the takeoff process, forcing them into reactive decision-making. A clear data matrix turns uncertainty into a specific, documented plan. It establishes where each quantity will come from before the estimating process begins and provides transparency for both construction estimators and project stakeholders.
THREE BIM CHECKS WORTH DOING Izzat cautions against assuming that a quantity is automatically correct when the element exists in the model. He recommends three key elements to check that catch the costliest and most common errors. •
Floors: Compare floor areas against calculated volumes to confirm that the model geometry is behaving as expected.
•
Walls and Facades: Review how openings are deducted and verify that quantities correctly reflect doors, windows, and penetrations.
•
Doors and Windows: Cross-check model counts against schedules and make sure that the information aligns.
Receive Modal Quality Check Data Matrix Sample Validation 3D Takeoff 2D Supplement Apply Rates FInal Estimate
There's one step that most professionals skip that hurts most. Step three deals with the data matrix: a clear roadmap of which quantities can be
12 BUILT ENVIRONMENT ECONOMIST: SEPTEMBER – NOVEMBER 2026
The goal is to earn confidence in the model through validation. These checks don't take a lot of time but do offer clear indication as to whether the BIM model can be trusted for wider quantity extraction. It also serves as early warning while a problem is still relatively cheap to fix.
BIM
“You are not remeasuring everything, which would defeat the purpose of BIM. You are checking to earn your trust in the model rather than assuming [things].” MAXIMIZING 3D, MINIMIZING 2D Izzat asserts that from this stage – once the validation process is complete the quantity takeoff becomes more confident, and quantity extraction becomes far more efficient. This is when quantities that can be reliably measured from the model should be extracted using BIM-capable takeoff software. Tools that translate model parameters into measurable quantities can handle this part of the process. Meanwhile, any missing or insufficiently modeled elements can be supplemented using 2D measurement techniques.
Here's a useful way to think about it: 3D Takeoff + 2D Supplement = 100% Quantity Coverage
A good workflow maximizes the reliable 3D percentage and minimizes the manual 2D percentage. Izzat recalls how they ended up with 0% BIM and 100% manual measurement on that project back in 2010, simply because they'd lost confidence in the model. A proper validation workflow would have allowed them to retain the trustworthy information and focus only on the genuine gaps.
WHERE AI ACTUALLY BELONGS Asked whether artificial intelligence (AI) can perform quantity takeoffs automatically, Izzat espouses a slightly different view: the more pertinent question for him is where AI should be applied. Its greatest value lies in the early part of the project lifecycle, not so much in the takeoff stage.
“By then, you are dealing with whatever the model already contains – good or bad. AI is far more valuable earlier, when the model is being developed.” He recommends fixing the source, not the problem. AI should help improve model quality, classification, and completeness before information reaches the QS. In other words, industry professionals should focus on improving the source data rather than trying to compensate for poorquality inputs later.
BIM CHANGES WHERE JUDGMENT IS APPLIED There's a common belief that BIM removes the need for professional judgment, that the technology does the thinking now. In fact, the final steps in the verification process may seem increasingly automated. Be that as it may, judgment does not disappear – it remains central to the process.
BUILT ENVIRONMENT ECONOMIST: SEPTEMBER – NOVEMBER 2026 13
BIM
The QS must still determine: •
Whether a model is sufficiently reliable
•
Which quantities should be validated
•
Which items require supplementation
•
How takeoff information should be interpreted
This is the productivity payoff: quantity surveying teams spend less time manually measuring every element and more time validating, reviewing, and making informed decisions about data quality. Far from removing professional expertise from the estimating process, BIM invites its application and changes where the quantity surveyor skills and judgment are applied.
FINAL THOUGHTS So, can you trust your BIM takeoff? The answer is neither a simple yes nor no. Ultimately, BIM is not about blindly trusting technology – it is about giving quantity surveyors better information
“You check it, you map it, you validate it, and you decide, as a professional, exactly how far that trust should go” and the tools to verify it before turning model data into reliable estimates. Drawing on real project experience, Izzat has determined that the modern
14 BUILT ENVIRONMENT ECONOMIST: SEPTEMBER – NOVEMBER 2026
QS approach to BIM quantity takeoffs should be built on the principle of trust but verify. Before extracting quantities, model quality should be validated, gaps should be identified, data reliability should be assessed, and a clear strategy for handling missing information should be established. By performing quality checks, creating a data matrix, and validating key model quantities, BIM can be leveraged with confidence while maintaining the accuracy and professional rigor that estimating demands. Combining model-based takeoff, 2D measurement, and estimating workflows within a single environment like RIB CostX supports the quantity surveyor's role in validating BIM. A robust validation process enables QS teams to transform BIM into something greater than only a source of quantities: a trusted foundation for cost planning and project delivery.
2024 STEVIE
GROWTH
BUILDING BOOM IN SOUTH EAST QUEENSLAND By Dr. Alan Patching
16 BUILT ENVIRONMENT ECONOMIST: SEPTEMBER – NOVEMBER 2026
GROWTH
Read in context of industry studies I have conducted over the past year or so an interesting question prompted by the Australian Institute of Quantity Surveyors’ (AIQS) recent Building Cost Index (BCI) figures is “What impact is SEQ’s construction pipeline likely to have on southern States?” For any southern states’ readers who might usually switch off at any hint of Queensland news, apart from AFLrelated, of course (you know AFL -that game for which Brisbane won the premiership for the last two years) you might be well advised to read on. The way I see things, what’s happening in SEQ might well have a much larger impact on Sydney and Melbourne than many might expect.
BUILDING COST INDEX INSIGHTS Before proceeding, let’s take a look at the general lie of the land from a BCI perspective, the following points being most relevant: •
From January 1974 until mid 2021 Brisbane’s BCI lay between the lower to mid region of the BCI graph for capital cities;
•
It then headed north at a rate substantially greater than for other capitals, and by 2023 was higher than other capital cities;
•
By November 2025, Brisbane’s BCI was some 100 points higher than the next city’s, Canberra, and 150 points higher than Sydney’s and Melbourne’s;
•
That indicates expectations of higher and rapidly increasing construction prices for greater Brisbane, including the Sunshine Coast and Gold Coast areas.
There are potentially strong consequences for southern construction markets - Sydney in particular, from what is expected in Brisbane.
The following data was extracted from the AIQS March 2026 BCI report: CITY
APRIL 2026 INDEX
APRIL 2027 PROJECTED
APRIL 2028 PROJECTED
2026-27 DIFFERENCE
2027-28 DIFFERENCE
Sydney
431
451
473
4.64%
9.74%
Brisbane
518
566
619
9.26%
19.50%
Melbourne
425
440
456
3.53%
7.29%
Many rationalise the Brisbane figures being double that of its nearest eastern seaboard capital city neighbour to be the consequence of the massive construction works required for the 2032 Olympic and Paralympic Games, but that might be a shortsighted perspective on the economic drivers. The Games will have a substantial impact on the industry, but of far greater significance is the forecast and on-track doubling of the SEQ population between 2022 and 2050. Australian Bureau of Statistics (ABS) data reveals SEQ’s population grew by 2.03% in the year ending June 2022, with annual growth of 2.97%, 2.51%, and 1.98% respectively in the following three years – a total of 375,211 new residents. In June 2025, the Queensland population was 5,669,764. It is projected to be between 7.5 million and 7.6 million people by 2050, with 5.9 million (79%) living in SEQ. Some 74% of the current Queensland population live in SEQ. In June 2022 the SEQ population was 3,893,533. The anticipated SEQ population increase - around 1.8m to 2m people - means Queensland has less than 25 years to effectively build housing and services - schools, hospitals, medical clinics, shopping centres etc., all with associated transport and utilities infrastructure, and in the process it has to deal with the challenge of a projected dire shortfall of required construction and infrastructure human resources.
And therein lies the explanation of the difference between Brisbane BCI figures and those for other capital cities.
CONSTRUCTION HUMAN RESOURCES The projected BCI for Brisbane reflects a lack of industry confidence that the resourcing situation is likely to improve any time soon – a position endorsed by the November 2025 Infrastructure Australia report. That report indicated a shortage of some 147,0000 construction and infrastructure workers towards the end of 2025, and raised concern by predicting that would extend to a 300,000 shortfall late in 2027. In mid 2025, when a reporter asked the Queensland Deputy Premier, the Honourable Jarrod Bleijie, how the anticipated 47,000 resources shortfall for Queensland would be managed, he confidently stated they would come from southern states and from overseas. From my experience as the CEO of the owning entity of the Sydney Olympic Stadium and as owners’ Project Director in charge of its delivery, I believe that statement will largely hold true … for Olympic projects. However, surely the main point is missed when the conversation is strictly Games focused, and omits consideration of infrastructure and development required to service the doubling of the SEQ population?
BUILT ENVIRONMENT ECONOMIST: SEPTEMBER – NOVEMBER 2026 17
GROWTH
Sydney’s late 1990s’ resources shortage attracted interstate and overseas people to fill the gap, and the main stadium finished on original completion date and not a dollar over budget. However, there were other key factors at play, including: •
Sydney having a governmentindustry-union agreement for no strikes on Olympic projects. In contrast, Queensland has an inquiry in progress into the CFMEU, and there’s no indication the productivity-restricting Enterprise Bargaining Agreements in place are likely to be scaled back;
•
Sydney was not being prepared for the 2000 Games in economic circumstances of the like currently faced by Queensland;
•
Sydney didn’t have to rely on overseas resources at a time the Federal government was under intense pressure to reduce immigration numbers.
CONSTRUCTION LOGISTICS During a recent project management panel session in Brisbane, a senior project manager involved with delivery of the London Games facilities emphasised the value to London of having the majority of facilities relatively closely located to one another. He saw the statewide “Brisbane” Games spread of facilities as a potential complexity to an already challenging task of efficiently achieving Games readiness, and several senior construction leaders concurred with his opinion. The general consensus was that, while distributing venues along the coast might constitute an inclusive Games approach and a brilliant Queensland tourism marketing strategy, it raises
18 BUILT ENVIRONMENT ECONOMIST: SEPTEMBER – NOVEMBER 2026
GROWTH
questions regarding minimising cost of athletes’ accommodation and optimising Games infrastructure logistics and delivery. Perhaps the most-questioned Games decision was to hold Olympic rowing in Rockhampton. As a former Fitzroy River experienced oarsman, I comprehend those concerns, but that decision appears to have had more to do with politics than with sport. When Mrs. Donna Kirkland MP won Rockhampton for the Liberal National Party (LNP) in 2024 it was the only time the seat had left Labor control, apart from for three years when it was held by and independent, in its 112 year history. If you don’t think that might have something to do with the Rockhampton decision, a check up from the neck up might be in order.
the attraction of moving to be part of any construction boom in SEQ might well attract significant numbers of workers from southern cities, and from Sydney in particular, thereby putting upwards pressure on construction prices in southern cities as they then experience impact from resources shortages.
WHERE TO FROM HERE FOR QUANTITY SURVEYORS?
•
WILL THE SEQ CIRCUMSTANCES IMPACT SYDNEY AND MELBOURNE?
The potential problem for southern capitals is the reality that prices inflation will be driven by supply and demand dynamics and at some point
Advising clients to be mindful of likely impacts of any substantial exodus of construction people from southern capitals to SEQ, for reasons provided earlier herein, and if that occurs, to quickly adopt and follow the advice provided in the previous points above.
One thing’s for sure, preparation for the Games will reflect one clear aspect of the Games…the spoils will go to those who get in first.
Even the remote possibility of the outcomes discussed herein should inform quantity surveying professionals regarding advice to provide their clients, and I’d suggest that might at least include:
Which brings us to potential impact on southern cities of the SEQ situation.
The Sydney 2000 experience proved that construction-involved people have a strong compulsion to be involved with Games projects above all others and, for that reason, I understand the Deputy Premier’s articulated comfort regarding resourcing Brisbane’s Games projects, especially major venues. However, I believe many projects undertaken to service population growth will feel the resources shortages, and that will inevitably bring to fruition the prices escalation in the Brisbane region forecast by the BCI projections, and possibly even higher escalation.
•
•
Advising SEQ-based owner or developer clients to bring forward their projects intended for the coming five years or so, and negotiating Design and Construct arrangements with a trusted, experienced and proven contractor so the work can get committed and underway within what I consider to be a limited window of opportunity to miss the major price hikes expected in the near future. Even if project documentation is well advanced now, the time spent in a formal tender process might result in missing that window of opportunity, especially in the expected upcoming SEQ market conditions; Advising clients to be wary of appointing contractors who seek to exploit the SEQ conditions by taking on projects of complexity and scale well beyond what they have historically delivered. Never has it been a better time for clients to trust their QS;
Dr. Alan Patching is a former Fellow of AIQS and retired professor of Construction Management and Quantity Surveying at Bond University. He has followed two distinct career paths, one in construction project management and the other in psychotherapy and counselling, and brought them together in his PhD on attitudes to mental health among construction professionals. He received the AIQS President’s Medal in 2001, and is a frequent media commentator on progress of the Brisbane Games preparation and on workplace psychosocial hazards and mental health.
BUILT ENVIRONMENT ECONOMIST: SEPTEMBER – NOVEMBER 2026 19
VALUATION
A.M.O. RIFAT HOLDINGS PTY LTD V DIB
LESSONS FOR EXPERT QUANTITY SURVEYORS By Paul McArd FAIQS CQS
The Victorian Court of Appeal's decision in A.M.O. Rifat Holdings Pty Ltd v Dib [2026] VSCA 124 is likely to become an important authority on quantum meruit. Most commentary will focus on the legal principles. What stood out to me was something else entirely: the Court's treatment of the evidence. Read from the perspective of an expert quantity surveyor, the judgment says a great deal about what good valuation evidence looks like, and where it falls short.
LESSON 1 – INVOICES ARE NOT AN EXPERT OPINION At [32], the Court noted that the builder's schedule identified invoice recipients and invoice amounts, but did not identify the contractual stage to which the invoices related or whether the work had already been paid for. Invoices are source documents. They are not expert evidence.
The task of an expert quantity surveyor is not to gather project records and place them before the Court. It is to examine those records, draw conclusions from them and explain the reasoning behind those conclusions.
LESSON 2 – RECONCILE THE EVIDENCE TO THE WORK The owners described the builder's material as "an unsorted and unexplained list of trade invoices" ([42]). The Court reached much the same view. At [54], it found there was no proper factual basis on which the Tribunal could have "disentangled from the undifferentiated mass of invoices put in evidence" the amount attributable to the incomplete stages. That observation goes to the heart of expert quantity surveying. Project records need to be reconciled to the contractual scope, the relevant contractual stage, the work actually completed, any defective or incomplete
20 BUILT ENVIRONMENT ECONOMIST: SEPTEMBER – NOVEMBER 2026
work, payments already made, and the valuation ultimately expressed. Without that process, invoices remain accounting records. They do not become valuation evidence. That reconciliation is not an administrative exercise. It is the analysis that turns project documents into evidence capable of supporting an independent valuation opinion.
LESSON 3 – COST IS NOT VALUE At [53], the Court recognised that quantum meruit claims are commonly assessed by reference to "the charges commonly made for like services", with the contract price operating as a cap on recovery. Even so, the Court concluded that the builder's evidence "was simply incapable of establishing the value to the owners of the work that the builder had performed, but to which it did not have a contractual right to payment" ([75]).
VALUATION
That distinction matters. An invoice may show that money was spent. It does not establish what work was carried out, whether it fell within the contractual scope, whether it formed part of the permanent works, whether it was complete or defective, whether it had already been paid for, or what it was reasonably worth. Those are valuation questions. They require analysis, not simply documentation.
LESSON 4 – EXPERT EVIDENCE IS MORE THAN MEASUREMENT An expert quantity surveyor's role extends well beyond measurement or preparing schedules of invoices. It involves analysing the project records, reconciling the evidence, applying an appropriate valuation methodology and expressing an independent opinion that assists the Court.
That demands more than quantity surveying expertise. It also requires an understanding of the standards expected of expert evidence. Ultimately, an opinion carries weight because of the quality of the evidence supporting it and the reasoning that links the two.
FINAL OBSERVATIONS This decision should not be read as suggesting that different evidence would necessarily have produced a different result. The Court also relied on the way the case had been run. It found the Tribunal's error had been induced by the builder's own approach, concluded it would not be in the interests of justice to allow the builder to present its case again on a different evidentiary basis, and left the findings on defective work undisturbed.
Even so, the judgment offers useful guidance on the preparation of expert valuation evidence. For me, the enduring point is the distinction between project records and expert evidence. Project records tell the Court what exists. Expert evidence explains what those records demonstrate and why they matter. That is the role of an expert quantity surveyor. It is not to collate invoices, measure quantities or assemble schedules. It is to analyse the evidence, reconcile it with the facts and explain the conclusions so the Court can determine what work was undertaken, what benefit was conferred and what that work was reasonably worth. That, in my view, is one of the defining characteristics of expert quantity surveying.
BUILT ENVIRONMENT ECONOMIST: SEPTEMBER – NOVEMBER 2026 21
VISIONARIES
FROM QUANTITY SURVEYOR TO DECISION INTELLIGENCE 22 BUILT ENVIRONMENT ECONOMIST: SEPTEMBER – NOVEMBER 2026
VISIONARIES
ISIK BOZDAG FAIQS CQS
B. Build (Construction Economics), Quantum QS Managing Director | NSW Chapter President For most of its history, quantity surveying has looked backwards. We measure what has been designed, tender what has been documented, and report on what has already happened. That skillset built the profession - but it is no longer what clients are actually asking for. AI is now moving fast into professional workflows, and it will change what a QS is expected to deliver. It won't replace quantity surveyors. But it will make yesterday's service - a static cost plan, a monthly report already weeks out of date - look increasingly thin. Australia's construction productivity problem hasn't been solved by more technology; it will be solved by better decisions, made earlier, with better information behind them.
This shift is already reshaping the role of the quantity surveyor. The discipline of core QS services remains essential, but increasingly, clients are looking for insights that go beyond reporting what has already happened. The opportunity is to use project data to anticipate what comes next, identify emerging risks and support better-informed decisions. The real differentiator will not be who can produce a cost plan fastest, but who can turn complex information into clear, defensible advice before critical decisions are made. The QS of the future isn't measuring less. They're mattering more.
That's the opportunity in front of us. AI changes the economics of information - interrogating contracts, programmes, variations and historical data far faster than any team could manually. But judgement doesn't become less valuable; it becomes the differentiator. AI can surface a pattern. It cannot own the professional accountability of a recommendation or tell a client an assumption is unrealistic before it becomes an expensive mistake.
BUILT ENVIRONMENT ECONOMIST: SEPTEMBER – NOVEMBER 2026 23
VISIONARIES
BEYOND REFORM: BUILDING A NEW DELIVERY MINDSET FOR CONSTRUCTION KHOO SZE BOON FAIQS FSISV FRICS FSIARB MSPROJM APQS (TIER1) BBUILD(CONSTECONS)(1STCLASSHON), MSC PROJ MGMT, GRAD CERT INT ARB, ADJUNCT ASSOCIATE PROFESSOR, Managing Director, Singapore Turner & Townsend
Why collaboration, fairer risk-sharing and new delivery models are essential to building a more productive, resilient and sustainable construction industry. For decades, the construction industry has been asked to deliver more: more infrastructure, more housing, more resilience, more sustainability and more certainty. Yet the way projects are planned, procured and delivered has not always kept pace with society's expectations. As complexity rises and resources tighten, incremental improvement is no longer enough. The next phase of industry transformation must go beyond reform programmes and isolated initiatives; it must reshape the culture, commercial models and collaborative behaviours that determine how projects are delivered.
THE PERENNIAL CHALLENGES OF THE CONSTRUCTION INDUSTRY The construction industry remains one of the foundational pillars of major economies such as the United Kingdom, Hong Kong and Singapore, contributing significantly to GDP, employment and national development. Yet, despite its economic importance, the sector has long been constrained by persistent structural challenges: fragmented supply chains, labourintensive delivery models, low productivity, limited innovation and, at times, an adversarial operating culture. Over the past few decades, these issues have prompted successive waves of industry reform. From the Latham and Egan Reports in the United Kingdom, to the Tang Report in Hong Kong in the
24 BUILT ENVIRONMENT ECONOMIST: SEPTEMBER – NOVEMBER 2026
2000s, and more recent transformation agendas such as Construction 2.0 in Hong Kong and the Built Environment Industry Transformation Map in Singapore, governments and industry leaders have consistently recognised the need to modernise how the built environment is planned, procured and delivered.
DRIVERS FOR CHANGE Recent industry studies continue to highlight a familiar set of pressures: rising costs, inconsistent mega-project performance, safety concerns, low productivity, limited creativity and innovation, inequitable risk allocation, and fragmentation across the value chain. Collectively, these challenges have reinforced the case for a genuine step-change in industry performance.
VISIONARIES
The response, however, cannot rest on isolated initiatives alone. The most effective levers for transformation are mutually reinforcing and must be pursued as part of a more integrated industry agenda.
•
Four priorities are increasingly shaping the next phase of industry development. •
Integrated planning and design — strengthening collaboration across the value chain from the outset, enabling better planning, more buildable designs and improved downstream construction outcomes. This includes procurement approaches such as Early Contractor Involvement for more complex projects, as well as collaborative contracting frameworks such as NEC4.
•
Technology adoption — accelerating the use of advanced manufacturing and assembly methods, including Design for Manufacturing and Assembly (DfMA), automated factory-based fabrication, off-site construction and construction robotics to improve quality, productivity and delivery certainty. The adoption of Artificial Intelligence (AI) will be an enabler to transform project lifecycles, moving the industry away from traditional, fragmented workflows into data-driven operations – such as generative design, automated quantification and estimating, progress monitoring, predictive safety and maintenance. Digitalisation — adopting data-rich Building Information Modelling (BIM) and other digital solutions
to enhance collaboration, improve decision-making and strengthen project management across the full project lifecycle. •
Sustainability — embedding decarbonisation and resource efficiency into the way assets are designed, built and operated, in support of net-zero aspirations and a more sustainable, resilient and liveable built environment.
Taken together, these priorities show that transformation is not simply a matter of adopting new tools or techniques. It requires the industry to connect policy intent, procurement strategy, delivery capability and commercial behaviour in a more coherent way.
BUILT ENVIRONMENT ECONOMIST: SEPTEMBER – NOVEMBER 2026 25
VISIONARIES
Yet technology and process improvements alone will not solve the industry's underlying challenges. Equally important is how risk, responsibility and incentives are shared across the project ecosystem.
FROM RISK TRANSFER TO SHARED OUTCOMES While the industry has long recognised the need for change, the post-COVID environment has made that imperative even more urgent. Construction costs have escalated to a new baseline, resources remain constrained at both workforce and professional levels, and the cost of doing business has increased. At the same time, many market participants have become more risk-conscious, seeking fairer risk allocation and more balanced contract terms. Major projects are also becoming larger, more complex and more interdependent. Together, these forces are reshaping market behaviour and expectations. This points to a fundamental paradigm shift: from transactional, risk-transfer models towards more collaborative approaches among clients, contractors, consultants and the wider supply chain. It requires a fresh look at market engagement, procurement strategies, contract structures and the commercial models needed to support more equitable risk-sharing amongst stakeholders. In practice, this means greater emphasis on partnering, collaborative contracting and a shared commitment to common project outcomes. Such approaches seek to align interests, promote dispute avoidance and early resolution, and introduce commercial mechanisms that encourage positive behaviours. These may include pain-
26 BUILT ENVIRONMENT ECONOMIST: SEPTEMBER – NOVEMBER 2026
share/gain-share arrangements, performance-based incentives and other models that reward collaboration, innovation and delivery excellence. Over the longer term, this shift has the potential to create a more sustainable, resilient and equitable industry ecosystem. By moving beyond traditional silos and adversarial behaviours, the construction sector can build a stronger foundation for productivity, innovation and trust. This cultural transformation will be critical if the industry is to deliver not only better projects, but also a better built environment for future generations. The question, therefore, is no longer whether the construction industry needs to change, but whether all stakeholders are prepared to act with the urgency, openness and collective purpose that meaningful transformation demands. Clients, consultants, contractors, and suppliers each have a role to play in resetting expectations, embracing new delivery models and building the trust required for genuine collaboration. If the industry is to meet the demands of the future, it must move decisively from reform as aspiration to transformation as practice — turning shared intent into sustained action, and project-by-project progress into lasting industry-wide change.
Trusted guidance for assessing timber in construction Everything you need to work confidently with timber
✓ Timber product and system information
For early-stage planning and project assessment
✓ EPD database
Environmental performance data in one location
✓ Technical guidance
Fire performance, durability, sustainability, buildability and compliance
✓ NCC-aligned resources
Supporting informed project decisions with greater confidence
Explore free resources: WoodSolutions.com.au
VISUAL FEATURE
THE GREENLINE PROJECT BIRRARUNG MARR SITE ONE By PCMG
28 BUILT ENVIRONMENT ECONOMIST: SEPTEMBER – NOVEMBER 2026
VISUAL FEATURE
Project Cost Management Group (PCMG) was proud to act as the quantity surveying and cost management partner for the City of Melbourne on Birrarung Marr Site One. The precinct marks the first completed stage of the landmark 4-kilometre Greenline master plan, serving as an important initial step in the city’s vision to transform Melbourne into a "swimmable city" by restoring the ecological health of the Yarra River (Birrarung). Delivered via a Design and Construct (D&C) procurement framework, the project was successfully completed on time and handed over in readiness for major city milestones—ensuring the precinct was open in time for the New Year’s Eve fireworks celebrations, the Australian Open tennis tournament, and the annual Moomba Festival. Recently honored as Park of the Year at the Parks and Leisure Australia VIC/TAS Regional Awards of Excellence, Site One stands as a prominent example of strong commercial advisory, rigorous risk mitigation, and strict cost control within a highly dynamic public marine ecosystem.
KEY FEATURES •
A 450-metre-long continuous promenade, acting as an expansive 6-metre-wide civic connection from Batman Avenue to Federation Square.
•
A 200+ linear metre suspended boardwalk, meticulously engineered to curve along the dynamic tidal edge of the Birrarung.
•
The Fig Tree Boardwalk, an elevated pathway designed to safely clear and preserve the root networks of mature heritage trees.
•
The Lookout, a dedicated cantilevered public viewing platform offering stunning, uninterrupted views across the active river current.
•
Massive urban greening, introducing over 25,000 indigenous plants and 70 new native trees across 88 distinct species.
•
A 900-square-metre riverside lawn, which integrates advanced bioretention infrastructure to pre-filter city stormwater runoff before it discharges into the river.
The Greenline Project – Birrarung Marr Site One faced two significant construction and logistics challenges that required highly innovative solutions to ensure delivery: A major late-stage civil hurdle involved executing marine-grade piling operations directly within a highly dynamic tidal environment. To construct the sweeping subframe of the boardwalk without disrupting the riverbed's delicate ecosystems, structural works had to be split between land-based rigs and floating marine barges. The project team successfully fabricated and treated 83 tonnes of structural steel with specialized anti-corrosion marine coatings, overlaying it with 1,165 square metres of open-mesh steel grating. This open grating allows natural sunlight and airflow to reach the water below, fostering a healthier aquatic environment for local marine life. Additionally, managing construction operations within one of Melbourne’s most active public parklands required absolute scheduling agility. Works had to be dynamically phased around the city’s world-famous major events economy, requiring temporary site demobilizations and remobilizations to
BUILT ENVIRONMENT ECONOMIST: SEPTEMBER – NOVEMBER 2026 29
VISUAL FEATURE
accommodate the massive crowds of the Australian Open tennis tournament and the annual Moomba Festival. These compressed windows demanded rigorous procurement management and multi-agency alignment to prevent cost blowouts while keeping the surrounding civic pathways operational. With the precinct officially open, Site One establishes a highly scalable benchmark for the remaining four stages of the overarching Greenline initiative. The project stands as a clear blueprint for how forward-thinking public realm investment can seamlessly weave environmental resilience into the fabric of a growing city.
FAST FACTS Quantity Surveyors: Project Cost Management Group (PCMG) Client: City of Melbourne Builder: Symal Indigenous Construction Partner: Wamarra Status: Completed Timeframe: 2023 - 2025 Location: Birrarung Marr (Yarra River), Melbourne, Victoria Images: City of Melbourne & Symal
30 BUILT ENVIRONMENT ECONOMIST: SEPTEMBER – NOVEMBER 2026
VISUAL FEATURE
BUILT ENVIRONMENT ECONOMIST: SEPTEMBER – NOVEMBER 2026 31
CASE STUDY
ROEBOURNE DISTRICT HIGH SCHOOL: BUILDING MORE THAN A SCHOOL Winner of the Outstanding Regional Project Award at the Built Environment Awards 2026
32 BUILT ENVIRONMENT ECONOMIST: SEPTEMBER – NOVEMBER 2026
CASE STUDY
When the new Roebourne District High School welcomed students for the 2026 school year, it marked the completion of far more than a construction project. It represented the successful delivery of a modern education precinct designed with, and for, the local community—one that balances value for money, cultural identity and long-term social outcomes. Located on Ngarluma Country in Western Australia's Pilbara region, the $94 million redevelopment transformed the school into a contemporary learning environment featuring new primary and secondary school facilities, science and library buildings, a multipurpose hall, cultural and language hubs, student services, and welcoming outdoor spaces, including yarning circles and community gathering areas. For a project of this scale and complexity in a remote location, success depended on much more than meeting programme milestones. It required disciplined cost management, innovative construction methodologies and genuine collaboration between the WA Government, the project team, designers and the Roebourne community.
DELIVERING VALUE FROM DAY ONE Delivering value for money remained a central focus throughout the project. Early engagement with the Department of Education established a clear understanding of project scope and priorities, enabling rigorous cost planning, transparent reporting and proactive forecasting throughout design and construction. This disciplined approach ensured potential cost pressures were identified and addressed early, helping the project remain within agreed budget tolerances, excluding approved client variations.
BUILT ENVIRONMENT ECONOMIST: SEPTEMBER – NOVEMBER 2026 33
CASE STUDY
As the project evolved, additional investment from Woodside Energy enabled the construction of the new high school facilities. By treating this funding as a clearly defined clientdriven scope variation, the integrity of the original project budget and valuefor-money assessment was maintained. The collaborative approach extended to the delivery of the landscaping works. When design documentation was delayed, the project team worked closely with the client and consultants to develop an alternative delivery strategy. Constructability reviews, value engineering workshops and the preparation of an independent bill of quantities helped streamline pricing and maintain programme certainty without compromising quality.
INNOVATION DRIVING PROGRAMME CERTAINTY Constructing major infrastructure in regional Western Australia presents unique challenges, from long supply chains to workforce availability and changing site conditions. Rather than allowing these factors to dictate delivery, the project team looked for opportunities to work smarter. An alternative construction sequence proposed during tender enabled multiple buildings to be delivered concurrently, reducing the overall programme by approximately six months. Across the project, several key facilities, including the primary school, science and library building, and high school, were completed ahead of their contractual completion dates, allowing students and staff to access new learning spaces earlier than planned. Off-site manufacturing also played an important role in improving efficiency. Aluminium windows were fully assembled and glazed in Perth before
being transported to site, allowing installation within just a few days of arrival. A Design for Manufacture and Assembly (DfMA) approach to joinery similarly reduced on-site installation time by around 50 per cent while minimising waste and improving quality. Together, these initiatives demonstrate how construction methodology can contribute not only to programme performance but also to better value outcomes.
MANAGING COMPLEXITY THROUGH COLLABORATION Despite careful planning, unexpected challenges inevitably emerged throughout delivery. When latent ground conditions were encountered during sewer works, the project team worked collaboratively with the Superintendent and consultants to investigate alternative alignments before delays could occur. Early identification, rapid decision-making and open communication ensured the issue was resolved with minimal impact on the overall programme. This collaborative approach became a defining characteristic of the project enabling risks to be managed proactively while maintaining delivery momentum.
CREATING LASTING COMMUNITY VALUE While the physical transformation of the school is significant, perhaps its greatest achievement lies in the way it reflects the aspirations of the Roebourne community. Extensive consultation with Ngarluma, Yindjibarndi and Banyjima language groups informed the design, ensuring the completed campus celebrates Aboriginal culture, language and connection to Country.
34 BUILT ENVIRONMENT ECONOMIST: SEPTEMBER – NOVEMBER 2026
Dedicated cultural learning spaces and community gathering areas provide places for education, storytelling and cultural exchange fostering a strong sense of identity and belonging. The project also delivered significant economic benefits across the Pilbara, with more than $18 million spent with local businesses and suppliers. Local employment opportunities and skills development formed an important part of delivery, including site visits for construction students from Karratha Senior High School, giving them valuable exposure to careers in the industry. Beyond the construction site, project teams volunteered with the Ngarluma Yindjibarndi Foundation, undertaking maintenance works and community activities that strengthened relationships and demonstrated a genuine commitment to leaving a positive legacy.
LOOKING BEYOND PRACTICAL COMPLETION The redevelopment also achieved strong outcomes in safety, sustainability and inclusion. Across almost 127,000 hours worked, the project recorded zero lost time injuries, reflecting a proactive safety culture supported by strong leadership and planning. Sustainability initiatives included energy and water monitoring during construction, waste minimisation strategies and the incorporation of efficient building systems. Rainwater harvesting, drought-tolerant landscaping and water-efficient fixtures are expected to reduce mains water consumption by around 36 per cent over the life of the school.
CASE STUDY
The project also demonstrated a commitment to diversity and Indigenous participation, engaging Supply Nation businesses, supporting First Nations organisations and embedding cultural awareness throughout delivery. In recognition of its outstanding delivery and stakeholder satisfaction, the project achieved a 100 per cent score on the WA Government Supplier Referee Report – Contractor.
A BLUEPRINT FOR FUTURE REGIONAL PROJECTS The Roebourne District High School redevelopment demonstrates that successful infrastructure delivery is measured by more than cost and programme performance alone.
It also depends on how effectively a project responds to its cultural, social and environmental context—and the lasting benefits it creates for the community. For quantity surveyors and other built environment professionals, the project reinforces the importance of early stakeholder engagement, disciplined cost management, transparent reporting and proactive risk management, particularly when delivering complex infrastructure in culturally significant and remote locations. Equally important is embedding cultural responsiveness throughout planning, procurement and construction, rather than treating it solely as a design consideration.
Innovative construction methodologies, collaborative problem-solving and robust project controls enabled the team to manage regional delivery challenges, maintain programme certainty and respond effectively to changes in scope and unforeseen site conditions. The result is a project that has delivered enduring educational, economic and social outcomes for Roebourne and the wider Pilbara region. It provides a compelling blueprint for future regional infrastructure projects and a reminder that success is defined not only by what is delivered, but by how it is delivered and the legacy it leaves behind.
This case study has been approved by ADCO Construct
BUILT ENVIRONMENT ECONOMIST: SEPTEMBER – NOVEMBER 2026 35
WELLBEING
THE QUIET BATTLE: NAVIGATING DEPRESSION AND IMPOSTER SYNDROME IN MY PROFESSIONAL CAREER
REFLECTIONS ON IMPOSTER SYNDROME IN PROFESSIONAL ENVIRONMENTS 36 BUILT ENVIRONMENT ECONOMIST: SEPTEMBER – NOVEMBER 2026
WELLBEING
BAO TRAM TRUONG
Graduate member of AIQS, MBMpl Pty Ltd
“For a long time, I felt like a fraud in my own career.” This International Women’s Day, I reflected on my journey as a woman in the construction industry - the imposter syndrome, the mental health struggles, and the quiet self-doubt that followed me for years while building my career. On paper, things seemed to be moving forward. I was gaining experience, expanding my network, joining mentoring programs, and getting involved in industry initiatives. From the outside, it probably looked like confidence. But behind the scenes, I was fighting a battle many professionals rarely talk about.
DEPRESSION AND IMPOSTER SYNDROME Working in a professional field comes with constant expectations - to perform, deliver results, and demonstrate competence. In an industry where women are still underrepresented, the pressure to prove yourself can feel even heavier. Early in my career, I often felt surrounded by people who seemed more knowledgeable, more confident, and more experienced. I constantly questioned myself. Do I actually belong
here? What if people realise i don't know enough? Am I just pretending to be competent? Even when things were going well, I felt like I was “one mistake away” from being exposed as not good enough. Looking back now, I realise the seed of that doubt was planted much earlier than my career - when I first arrived in Australia as an international student. I’ll be sharing a series about personal experiences that shaped my career journey - from arriving in Australia as an international student, to navigating early career rejection, burnout, and eventually rebuilding confidence and finding belonging in the construction industry.
WHY I'M SHARING THIS In professional spaces we often celebrate achievements - promotions, successful projects, leadership roles, and milestones. What we talk about far less is the internal battle that sometimes sits quietly behind those achievements. Mental health awareness has grown in recent years, yet conversations about it are still rare in professional environments. I’m sharing this story because growth is not only about success. It’s also about the moments when we quietly question whether we belong.
BUILT ENVIRONMENT ECONOMIST: SEPTEMBER – NOVEMBER 2026 37
WELLBEING
If that resonates with you, I want you to know something important: You are not alone. Feeling like an imposter does not mean you are one. Sometimes it simply means you care deeply about doing meaningful work. And sometimes, the people who doubt themselves the most are the ones who push themselves to grow the most.
EARLY EXPERIENCES AS AN INTERNATIONAL STUDENT AND THE FOUNDATION OF SELF-DOUBT. My struggle with belonging started long before my career. When I first arrived in Australia as an international student, everything felt unfamiliar — the environment, the education system, and most of all, the language. At school, communicating in English was difficult, especially in a classroom setting. Making local friends wasn’t easy either. The language barrie and cultural differences often made it hard to connect. Even among my peers, I sometimes felt caught between two worlds — not fully confident speaking English, and discouraged when my mistakes were met with laughter instead of encouragement.
38 BUILT ENVIRONMENT ECONOMIST: SEPTEMBER – NOVEMBER 2026
Those moments slowly chipped away at my confidence. The only subjects where I truly felt capable were maths and physics — areas where language mattered less. Over time, I became quieter. I spoke as little as possible in class and stayed within a small circle of Vietnamese and international student friends. I moved through high school by keeping a low profile and staying safely within my comfort zone. I didn’t fully understand what I was experiencing back then. I simply told myself I was just shy. Only later did I realise it was something deeper —a quiet sense that I didn’t fully belong. Then came my final year. For the first time, I thought maybe I had proven something to myself. I graduated with an ATAR of 91.1. But I didn’t celebrate. Instead, I felt like I had failed. One English score — 29 instead of the required VCE study score of 30 — meant I didn’t meet the prerequisite for the course I had hoped to enter. What seemed like a small academic setback then became, in hindsight, the moment a deeper belief quietly took hold: that I wasn't good enough. Without realising it, that moment planted the first seed of imposter syndrome. And that feeling followed me into my career.
Q&A
WHAT IS THE BIGGEST ECONOMIC TREND CURRENTLY SHAPING AUSTRALIA'S BUILT ENVIRONMENT, AND WHAT DOES IT MEAN FOR QUANTITY SURVEYORS OVER THE NEXT 12 MONTHS?
DANIEL WORCESTER Director, Q Estimating “The single biggest economic trend hammering Australia’s built environment is the collision between strong population growth and a planning system that has struggled to keep pace. High net overseas migration has significantly boosted housing demand at a time when the sector is already under strain. Compounding this, Australians prefer larger homes – we have one of the largest average house sizes in the world which continues to shape expectations and add to the supply challenge.
For quantity surveyors over the next 12 months, this creates plenty of opportunities but also heightened commercial risk. With interest rates elevated and economic headwinds building, the margin for error is slim. QS professionals will be critical in delivering cost certainty through cost planning, analysis, value management, and risk management on residential, medium-density, and major infrastructure projects. The profession has a real chance to demonstrate its value in navigating these complex pressures.”
We’re seeing major pushes to deliver new housing targets alongside Olympic related infrastructure in South East Queensland, which is drawing skilled labour toward larger tier 1 contractors and away from smaller builders. This is intensifying existing skills shortages and pushing costs higher across the board.
BUILT ENVIRONMENT ECONOMIST: SEPTEMBER – NOVEMBER 2026 39
CYBER RISKS
THE HIDDEN CYBER RISKS FACING QUANTITY SURVEYORS IN 2026 By Roy Chen
40 BUILT ENVIRONMENT ECONOMIST: SEPTEMBER – NOVEMBER 2026
CYBER RISKS
For many quantity surveying businesses, cyber risk is still viewed primarily as an IT issue — something managed through antivirus software, passwords, and outsourced technology providers. In reality, cyber risk has evolved into a significant business continuity, financial, and professional liability exposure. As quantity surveyors increasingly rely on digital estimating software, cloud-based project management tools, and interconnected digital supply chains, the profession is becoming more exposed to sophisticated cyber threats that can disrupt operations, compromise sensitive information, and damage client trust. Quantity surveyors sit on a treasure chest of highly valuable and sensitive data. To a cybercriminal, this data is leverage. It is highly profitable on the dark web and is actively targeted to: •
Commit financial fraud through intercepted payments and sophisticated impersonation.
•
Steal intellectual property to be sold to competitors or on the black market.
•
Encrypt critical systems to extort a significant financial ransom.
Your interconnected supply chain creates numerous digital entry points for these attackers. A single compromised password or a vulnerability in a third-party software system can act as a backdoor, compromising your entire operation. Furthermore, the widespread availability of artificial intelligence has lowered the barrier of entry for criminals, fuelling faster and more sophisticated attacks. While preventative measures like firewalls and multi-factor authentication are essential, attackers can bypass them. The true test of your firm's resilience is determined by what happens after your digital perimeter is breached.
Surviving an attack relies on three critical capabilities: •
The Resources to Respond: Managing an incident requires immediate financial resources and people to manage a crisis without halting standard business functions.
•
The Experts to Identify and Isolate: Survival starts with having forensic cyber experts available the second an incident is detected. They know how to trace the attacker's movements and safely isolate systems without destroying crucial evidence.
•
The Roadmap to Recovery: Once the threat is isolated, the focus shifts to restoring clean data without re-infecting the network.
In addition, you may also need to navigate the complex legal and administrative steps to formally notify clients and report the breach to the OAIC to salvage your reputation. The most practical way to secure this readiness is by integrating a cyber response framework directly into your risk management strategy. This ensures that the moment a breach occurs, the financial resources and expert personnel are already allocated and pre-arranged to keep operations afloat. However, maintaining this level of internal resources on standby is often uncommercial, and exploring cyber insurance that supports your IT systems and people offers a more sustainable path to business resilience. By transferring this risk to a Cyber Insurance Policy, you secure more than just financial indemnity. Cyber Insurance can provide the expert support and financial protection required to allow you to recover from a cyber incident.
Below highlights the core insurance coverage components of a Cyber Insurance policy: •
Financial Coverage: Insurance protection for the costs of data recovery, legal fees, customer notification, and system repairs.
•
24/7 Incident Response: Access to experts for legal advice, PR, and Digital Forensics.
•
Business Interruption: Insurance coverage for lost income and expenses if your business operation and reputation is impacted.
•
Cyber Extortion: Costs related to ransomware incidents, including reporting obligations.
•
Third Party Liability: Legal costs to assist with lawsuits and regulatory investigations that may arise from a cyber incident.
•
Regulatory Compliance: Costs and expertise associated with mandatory notifications following a breach
Cyber Insurance can also cover Social Engineering Fraud. This specific part of a cyber insurance policy covers the theft of money where cybercriminals compromise a system and change EFT details on an invoice by impersonating a business to divert payments. Understanding how to transfer this risk is easy. The team at Austbrokers Countrywide can help you review your specific exposures to ensure that if an attack happens, your path back to business as usual is taken care of.
This article was written by Roy Chen, Cyber Insurance & Risk Advisor from AustBrokers Counrtywide - AQIS Corporate Partner.
BUILT ENVIRONMENT ECONOMIST: SEPTEMBER – NOVEMBER 2026 41
RISK
LATENT CONDITIONS
WHO PAYS WHEN THE SITE ISN’T WHAT YOU EXPECTED? By Doyles Construction
42 BUILT ENVIRONMENT ECONOMIST: SEPTEMBER – NOVEMBER 2026
RISK
A practical look at latent conditions clauses, who carries the risk, and what contractors, subcontractors and developers across Australia need to know before signing.
means all parties should take special care to ensure the contract protects their position and where latent conditions do arise, they are handled according to the provisions of the contract.
WHAT IS A LATENT CONDITION?
Whether the contractor, principal or owner bears the cost usually depends on:
A latent condition is usually an unexpected physical condition affecting the site that differs from what a reasonably competent contractor could have anticipated before the contract was signed, or which was known but not adequately addressed by the contract’s allocation of risk.
•
The construction contract
•
The risk allocation clause
•
Site information provided before contract
•
Whether the condition was reasonably foreseeable
•
Whether notice was given correctly and on time
In simple terms: the site looked one way on paper – but the reality on site was different.
COMMON EXAMPLES Latent conditions may include: •
Unexpected rock or unstable ground
•
Hidden underground services
•
Contamination
•
Unforeseen groundwater
•
Unknown fill or buried obstructions
•
Conditions that require redesign or extra excavation
•
Compromised access arrangements
WHO PAYS? While the traditional common law position is that for lump sum contracts risk lies with the contractor (Walker v Council of Municipality of Randwick (1929) 30 SR (NSW) there is no single answer. Rather than a single rule governing claims, relief is largely dependent on the construction of the contract. This
WHY THE CONTRACT MATTERS A contract may make provisions which wholly allocate latent condition risk to the contractor. Others have detailed provisions governing how contractors can make claims for extra time, costs or both. Stronger contracts define what will be considered a latent condition, how they should be handled and what (if any) time bars operate. A welldrafted contract will allow parties to understand their position should latent conditions arise thereby minimising disputes and promoting continuing commercial relationships that support project delivery. Contracts should always explicitly allocate risk relating to latent conditions, as express provisions rather than implied terms typically govern relief for latent conditions. (Dillingham Constructions v Downs (1972) NSWLR 49).
WHEN A CLAIM MAY ARISE A contractor’s position in a dispute is stronger where all necessary pre-
BUILT ENVIRONMENT ECONOMIST: SEPTEMBER – NOVEMBER 2026 43
RISK
contractual enquiries were made and reliance on any principal provided data was reasonable. Additionally, once the latent condition arises how it is handled is pivotal to recovery. The contractor should adhere to notice requirements, provide documentation which outlines the condition and support claims with records that clearly show the impact of the condition on time and costs.
MISLEADING OR DECEPTIVE CONDUCT CLAIMS Misleading and deceptive conduct in trade or commerce is prohibited by s 18 of the Australian Consumer Law (ACL). A contravention of this provision may occur where a principal has misled a party as to site conditions or risk allocation. Commonly this may happen in a precontractual representation, incomplete disclosures or site condition statement. Relevant factors in establishing a misleading or deceptive conduct claim include: •
If a statement or omission was objectively misleading
•
If a statement actually did or had the potential to mislead or deceive
•
If a statement or omission was material
•
If reliance on the misleading statement or conduct was reasonable
•
If loss flowed from that reasonable reliance
•
What level of access the contractor had to the information known by the principal
Where a principal has misled, concealed, or failed to correct a false statement relating to a latent condition this can amount to a breach of s 18 of the ACL.
WHY CLAIMS OFTEN FAIL Claims are often weakened by parties failing to adhere to the contractually defined procedure for handling latent conditions or an inability to adequately establish the nature and effects of the latent condition. To promote the recovery for latent claims all diligent enquiries (both reasonable and contractually obligated) should be performed by the contractor before the contract is signed. Contractors should be careful to take detailed and timely documentation of any latent conditions that arise on site including through photos, videos, diary notes and supporting expert reports. Written notice of the latent condition and supporting documentation should be provided promptly to the principal in order to avoid time bar issues. Work should only re-commence after the claim position is preserved.
IT IS NOT ONLY ABOUT COST A strong claim considers not only the costs of a latent condition but how project delivery will be impacted. Extensions of time, effects of varied program sequencing, flow on impacts to subcontractors, and any changes to site access should also be accounted for. These wider considerations are why latent conditions often become broader construction disputes, not just pricing issues.
44 BUILT ENVIRONMENT ECONOMIST: SEPTEMBER – NOVEMBER 2026
PRACTICAL TAKEAWAY Before signing a contract: •
Review the latent conditions and notice clauses
•
Check who carries the site risk
•
Conduct thorough site inspections and review available reports
•
Be clear on what site conditions are assumed in design
If a latent condition does arise do not assume the cost will automatically be recoverable before responding on site. Thoroughly document all latent conditions and strictly follow contractual guidelines for handling on-site issues and claiming relief.
RESILIENCE
RETHINKING FAILURE IN CONSTRUCTION AND BUILDING RESILIENT FIRMS By Sam Hillian Neave & Leslie Chung
BUILT ENVIRONMENT ECONOMIST: SEPTEMBER – NOVEMBER 2026 45
RESILIENCE
INTRODUCTION Construction has consistently ranked amongst the worst performing sectors of the Australian economy when measured by insolvency, representing an average of ~21% of all failures annually, see Figure 1 (Australian Securities and Investment Commission, 2026). Given the interconnected nature of
construction firms and the projects they deliver, the impact of insolvency is not isolated; instead, insolvency has a ripple effect on other firms, including clients, subcontractors, suppliers, and the taxpayer. In this article, we explore the nominated causes of failure of construction firms between 2009 – 2025 and raise important questions on how the sector can build more resilient firms.
Figure 1: Comparison of the Number of External Administrator or Controller Reports FY 2013/14 and 2025/26 in the Construction, Mining, Manufacturing, Accommodation & Food Service, and Retail Trade Industries (Source: ASIC, 2026)
NOMINATED CAUSES OF FAILURE The Australian Securities and Investment Commission (ASIC) not only track the number of firms that fail each year but also their nominated cause of failure as reported in administrator or controller reports, which are partitioned into 14 categories (see Table 1). While these causes are reported separately, in practice, most insolvencies involve a combination of factors leading to failure. Construction firms are particularly susceptible to cash flow and paymentrelated factors, as shown in Figure 2, which illustrates the six most
46 BUILT ENVIRONMENT ECONOMIST: SEPTEMBER – NOVEMBER 2026
predominant causes of failure in the sector. As explored in the following section, this suggests that the structure of construction firms disproportionately exposes them to significant and interrelated issues, such as contractual hierarchy, low profit bids, and price escalation under fixed priced contracts.
FACTORS THAT EXPOSE CONSTRUCTION FIRMS Construction does not fail in a vacuum. The 2022–2026 insolvency wave, maps directly to a macroeconomic regime that exposed three structural
RESILIENCE
NOMINATED CAUSE OF FAILURE
INTERPRETATIVE DEFINITION
Under capitalisation
The business started or expanded without enough financial buffer to absorb losses or delays
Poor financial control including lack of records
Management lacks accurate, timely financial data to make informed decisions
Poor management of accounts receivable
Slow collection of payments or weak credit control leads to cash flow shortages
Poor strategic management
Wrong high-level decisions on markets, projects, pricing, or growth
of business
direction
Inadequate cash flow or high
Cash inflows don’t match outflows, creating an inability to pay
cash use
suppliers, wages, or debt
Poor economic conditions
External environment (e.g. downturns, inflation, rising costs) reduces profitability and demand
Natural disaster
Unexpected events disrupt operations, projects, or supply chains
Fraud
Internal or external dishonesty results in financial loss or misrepresentation
DOCA failed
A Deed of Company Arrangement was attempted but ultimately unsuccessful in saving the business
Dispute among directors
Internal conflict at leadership level delays decisions or destabilises the business
Trading losses
Projects or operations consistently generate losses, eroding equity
Industry restructuring
Structural changes in the sector (e.g. consolidation, reduced demand) make the business model unviable
Business restructuring
Internal restructuring efforts fail to restore profitability or stability
Other
Contributing factors not captured in standard categories
Table 1: Nominated Causes of Failure (ASIC, 2026)
vulnerabilities the sector has long carried but rarely been forced to confront simultaneously. First, serial black swan shocks. COVID-19 ruptured supply chains and inflated input costs; the Russia-Ukraine war drove energy and steel volatility; the ongoing Middle East conflict — explicitly cited in the RBA's May 2026 decision — has reignited fuel-led inflation. The RBA cash rate has moved from 0.10% (November 2020) to a peak of 4.35% (November 2023), retraced to 3.60%, and on 5 May 2026 returned to 4.35%. That 4.25-percentagepoint cumulative cycle will impact the working capital of construction
firms, which may be squeezed up to approximately 50% of net profit. Second, material price escalation inside fixed-price contracts. ABS data shows Inputs to House Construction rose ~37% between March 2020 and late 2025 — a step-change with no contractual recovery mechanism in typical standard form contracts, such as AS4000 and AS2124. Third, the low-profit bid culture. Tier 1 commercial builders operate on 2–4% net margins, volume residential on 3–5%, with productivity growth of just 1% over the past decade. This leaves no balance sheet to absorb compounding macro shocks.
PATHWAYS TO FAILURE The macroeconomic pressures don't show up on ASIC reports as "interest rate hikes" or "global conflict." Rather, they show up further down the chain, as the nominated causes identified in Section 1. The translation is direct. A 4.25-percentage-point cash rate cycle becomes "inadequate cash flow" once the cost of carrying retentions, progress claims, and subcontractor payments eats into what's left of the project margin. A 37% rise in material input costs becomes "trading losses" the moment a fixed-price contract signed in 2021 must be delivered in today's cost environment, with no contractual mechanism to recover the difference. Three black swan events in five years become "poor strategic management" only because the industry's bid culture still rewards the lowest tender — which, in practice, is usually the firm that most underestimated its true risk. This is a bleak reminder, the actual cause sits further upstream: thin margins set during the bid, locked in by the contract, and then exposed to costs and conditions no one priced for.
STRATEGIC CONSIDERATIONS TO BUILD RESILIENCE FIRMS So, what is the sector to do in such an adverse financial environment? There are, of course, several strategic considerations that both firms and government may undertake based on size, sub-sector, and ambition. The first of these considerations is embracing a national standard on safety, productivity, ethical behaviour, and the payment of the supply chain. More specifically, engaging in the consultation
BUILT ENVIRONMENT ECONOMIST: SEPTEMBER – NOVEMBER 2026 47
RESILIENCE
POOR POOR FINANCIAL FINANCIAL CONTROL CONTROL
POOR POOR STRATEGIC STRATEGIC MANAGEMENT MANAGEMENT 1,240 1,240 944 944
INADEQUATE INADEQUATE CASH CASH FLOW FLOW
POOR POOR ECONOMIC ECONOMIC CONDITIONS CONDITIONS 1,328 1,328
604 604
TRADING TRADING LOSSES LOSSES
OTHER OTHER 1,122 1,122
2009-10 2009-10
2024-25 2024-25
931 931
2009-10 2009-10
2024-25 2024-25
Figure 2: Top 6 Nominated Causes of Failure Between 2009 and 2025 in the Construction Common scale 0–1,400 across all Pale shows the causes for Common scale 0–1,4002026) acrossCommon all panels. panels. scale Pale grey grey showsacross the other other five causesPale for comparison. comparison. Industry (ASIC, 0-1,400 allfive panels. grey shows the other
five causes for comparison.
process and the subsequent recommendations made by the Commonwealth Government’s National Industry Forum would go a long way in improving trust, culture, and long-term sustainability of the sector. The second strategic consideration contemplates the implementation of a payment trust framework, which ringfences project funds if a contractor becomes insolvent. There are several forms that this could take, depending on the ambition of the government in enacting building reform; options include, for example, the Project Trust Account system currently in use in QLD, or the cascading model proposed in the
Murray Review, which the Labor National committed to implementing in full. The third and fourth considerations are perhaps the most structurally significant, and both are supported by a growing body of research and practice. Collaborative contracting, from Early Contractor Involvement (ECI) to full project alliancing, brings the contractor into the design and procurement phase before costs are locked, replacing adversarial risk transfer with sharedoutcome incentives. The evidence is compelling: ECI has demonstrated cost savings of 7–32% and construction time savings of approximately 10% by resolving buildability and procurement
48 BUILT ENVIRONMENT ECONOMIST: SEPTEMBER – NOVEMBER 2026
risks before they become variations (Mosey, 2009). Australia has been a world leader in project alliancing since the late 1990s, deploying the model across AU$32 billion in complex infrastructure between 2004 and 2009. For an industry facing serial macro shocks and paper-thin margins, the question is no longer whether these models are worth the effort; it is whether the sector can afford to keep defaulting to fixed price. Whilst not all project levels may afford a full “alliancing” model, it’s values certainly can be imitated. This could be aligning incentives through shared painshare and gainshare, commitment to transparency, open-book costing, and best-for-project outcome decision making. Finally, rise-and-fall clauses, set to ABS Producer Price Indices, allow the contract price to move in step with real input costs. These clauses were common in the inflationary 1970s and 1980s before being abandoned during two decades of relative price stability. It is acknowledged that clients and principals may resist such amendments in clauses of contracts, however we opine the industry needs a mature discussion on the pragmatism of such strategies, especially as clients receive escalated prices due to the current fuel crisis.
FINAL REMARKS As Bob Dylan said ‘money doesn’t speak, it swears’; a sentiment the Australian construction sector can attest. This article laid plain the dire challenges causing high levels of insolvency and tied these to the structural and behavioural choices made in our sector. The authors conclude with four of many strategic considerations that government and industry leaders should contemplate.
EPDs
ENVIRONMENTAL PRODUCT DECLARATIONS (EPDs) SIMPLIFIED By Samudaya Nanayakkara, Kasuni Vidanagamachchi, Srinath Perera, Marini Samarathunga, Sepani Senaratne Centre for Smart Modern Construction (c4SMC), School of Engineering, Design and Built Environment, Western Sydney University
BUILT ENVIRONMENT ECONOMIST: SEPTEMBER – NOVEMBER 2026 49
EPDs
I 1. WHAT IS AN EPD? The Environmental Product Declaration (EPD) is the single most important document for communicating a construction product’s environmental footprint. An EPD is a standardised, thirdparty-verified document that provides transparent, quantitative data about a product's environmental impact throughout its lifecycle (including manufacturing, use, and disposal). It is based on a rigorous scientific method called a Life Cycle Assessment (LCA), which quantifies multiple environmental impacts such as carbon footprint (global warming potential), water use, energy consumption, resource depletion, waste generation, ozone layer depletion, acidification, and provides a transparent basis for comparing products and supporting sustainable decision-making.
ORIGIN AND INTERNATIONAL PRESENCE The EPD process was globally formalised under the ISO 14025 and EN 15804 standards. It gained rapid prominence in Europe following the publication of the core construction standard EN 15804 in 2012, which provided harmonised rules for construction products. The EPD concept emerged in the 1990s to address the growing demand for standardised, reliable environmental information, moving beyond simple marketing claims. The concept was formalised in 1998 in Sweden with the establishment of the International EPD System and initially focused on measuring the performance of products (Del Borghi, 2013). While Europe remains the global leader in Environmental Product Declarations (EPDs), several regions are rapidly
advancing. The United States is next in prominence, driven by federal “Buy Clean” policies and large-scale EPA (Environmental Protection Agency) funding that promote EPD adoption across industries. Following closely is Australia, via EPD Australasia, alongside Japan, with South Korea experiencing rapid growth. China and India are strengthening their initiatives. China is building national programs and digital tools, while India is collaborating with the International EPD System to align with global transparency and verification standards.
EPDs are increasingly used across multiple sectors to support sustainable design, procurement, and carbon reporting THE IMPORTANCE OF CREDIBILITY: EPDS AS TYPE III ENVIRONMENTAL LABELS Environmental Product Declarations (EPDs) belong to the Type III category of environmental labels, as defined by the ISO 14025 standard. Type III labels represent the highest level of credibility and transparency because they are based on verified quantitative data from a Life Cycle Assessment (LCA) and require independent thirdparty verification before publication. Unlike Type I ecolabels (e.g., Energy Star, EU Ecolabel), which are designed for easy consumer recognition, or Type II self-declared claims (e.g., “Recyclable,” “Compostable”), Type III labels provide objective, comparable, and standardised data on a product’s environmental performance.
50 BUILT ENVIRONMENT ECONOMIST: SEPTEMBER – NOVEMBER 2026
EPDs, as Type III environmental labels, are essential tools for architects, engineers, and procurement professionals who need reliable data to assess and compare materials within green building rating systems such as Green Star, LEED, or BREEAM. Because they are quantitative, transparent, and verified, EPDs are increasingly used across multiple sectors to support sustainable design, procurement, and carbon reporting. •
Core Sector: Construction and building materials (used by architects, engineers, and procurement teams for material specification and calculating total embodied carbon).
•
Other Industries: Furniture and interiors, electrical and mechanical equipment, chemicals and paints, industrial manufacturing, automotive and transportation, packaging, apparel and footwear, and the dairy sector.
I 2. COMMON EPD TYPES AND SPECIFICITY The type and specificity of an Environmental Product Declaration (EPD) determine its applicability, data precision, and level of credibility. Table 1 summarises their distinctions in terms of standards, verification methods, publication procedures, and credibility. Overall, third-party verification is mandatory for all EPD types to ensure transparency, comparability, and compliance with ISO 14025.
I 2.2 EPD SPECIFICITY LEVELS AND TECHNOLOGICAL PROGRESSION EPDs vary in how specific they are to the product’s physical source and
EPDs
PRODUCT EPDS
VERIFIED SYSTEM EPDS
PROJECT EPDS
Standards
ISO 14025
ISO 14025
ISO 14025
Verification
Third-party verified by accredited verifier/
The system that generates the EPDs has
Third-party verified using project-specific
Programme Operator
been third-party verified, rather than each
data
individual EPD, Publishing
Published through approved EPD programs
Published under an EPD operator’s system
Some program operators allow Project
(e.g., EPD International, Australasian EPD
with consistent methods
EPDs to be registered or listed, but often
Program)
they are submitted only for the project owner, client, or certification purpose
Applications
Product-level comparisons, procurement,
Efficient for manufacturers with multiple
Large/unique projects where local sourcing,
building rating systems (LEED, Green Star,
similar products; ensures methodological
logistics, and site conditions matter
BREEAM)
consistency
Credibility
Highest credibility
Medium/Low credibility
High credibility
Accuracy
High for typical product use
Medium–high, but variable:
Potentially highest accuracy for that single project
Table 1: EPD types based on applications
supply chain. The same product can have multiple EPDs, depending on the location of its production plant, as environmental impacts vary due to differences in local energy mixes, resource use, and transportation distances. Documenting the production site is therefore essential for accurate environmental representation. Figure 1 illustrates how Environmental Product Declarations (EPDs) vary by specificity (Senseney et al., 2023), data accuracy, and development effort.
The lower levels, such as industrywide and product-specific EPDs, rely on aggregated or averaged data suitable for early design decisions, while higher levels like facility-specific and supply-chain-specific EPDs incorporate measured or real-time data for procurement, construction, and ESG reporting. As specificity increases, so does the need for advanced technologies, including IoT, blockchain, and AI, to capture dynamic, traceable, and location-dependent environmental information (Popowicz et al., 2025).
Industry-wide EPDs (IW-EPDs) are the most generic type, representing average performance across an industry sector. Developed using LCA software, standardised databases, and spreadsheet models, they rely on secondary, aggregated data. IW-EPDs support conceptual design and early benchmarking, but they lack supplier traceability and temporal accuracy. Product-specific EPDs (PS-EPDs) represent a specific product or manufacturer’s range and are created
Figure 1: EPD types based on specificity levels and applications
BUILT ENVIRONMENT ECONOMIST: SEPTEMBER – NOVEMBER 2026 51
EPDs
using LCA/EPD tools, manufacturer databases, ERP systems, and validation platforms. They combine data from multiple production facilities, offering better precision for design development and early procurement, though they still use averaged facility data rather than batch-specific inputs. Facility-specific EPDs (FS-EPDs) are unique to a single production plant and based on primary, measured data. Generated using IoT sensors, digital twins, and cloud-based LCA automation, they provide accurate cradle-to-gate (A1–A3) results (Refer to Scope). However, downstream stages often rely on generic datasets. FS-EPDs are suitable for procurement, construction, and reporting purposes. Supply chain-specific EPDs (SCSEPDs) are the most advanced and data-rich form, capturing real-time information across the entire supply chain. Using IoT, GPS tracking, APIs, cloud data lakes, blockchain, and AI/ ML, they provide comprehensive cradle-to-grave (A1–D) visibility (Refer to Scope). SCS-EPDs enable dynamic traceability and ESG reporting, representing the highest level of specificity and digital maturity.
I 3. EPD SCOPE (SYSTEM BOUNDARY) The scope of an Environmental Product Declaration (EPD) defines which stages of a product’s life cycle are included in the environmental assessment. According to ISO 14025 and EN 15804, this system boundary determines the extent of the analysis and must be clearly defined to ensure comparability between EPDs. The EN 15804 standard divides the life cycle into modular stages, A, B, C, and D, which describe different parts of a product’s journey from raw materials to end-of-life (Senseney et al., 2023).
Figure 2: EPD Scopes
Modules A1-A3 (Production Stage) form the compulsory cradleto-gate scope, covering raw material extraction, transport to the manufacturer, and product manufacturing. Modules A4-A5 (Construction Stage), B1-B7 (Use Stage), and C1-C4 (End-of-Life Stage) are optional extensions that include transport to the site, installation, use, maintenance, demolition, and disposal. Module D accounts for benefits after the product’s end of life, such as recycling or energy recovery, offering a cradle-to-cradle perspective when data are available.
I 4. THE FIVE-STEP EPD DEVELOPMENT PROCESS: A SIMPLE GUIDE An Environmental Product Declaration (EPD) is not a marketing claim; it is the outcome of a structured, internationally standardised process following ISO 14025. The process involves the manufacturer, LCA practitioner, independent verifier, and a Program Operator (such as EPD Australasia or Global GreenTag Australia). Each step plays a unique role, similar to an assembly line, ensuring consistency, accuracy, and credibility (Waldman, 2020).
1. Identify the Product Category Rules (PCR) – The Cookbook The manufacturer starts by selecting the appropriate PCR, which defines the “recipe” for how the environmental assessment must be done for that product type. It ensures that all EPDs within the same category follow the same rules for consistency and comparability. 2. Conduct the Life Cycle Assessment (LCA) – The Engine This is the technical heart of the process. The LCA practitioner quantifies all environmental inputs and outputs across the product’s life stages (raw materials, production, use, and endof-life). It generates the core data that drives the EPD. 3. Compile the EPD Report – The Assembly Stage The LCA results are summarised and formatted into the official EPD document. This step ensures that all information is presented in a clear, standardised way, in accordance with EN 15804 and ISO 14025 requirements. 4. Verify the EPD – The Quality Check An independent, accredited verifier reviews the data, methods, and report to confirm compliance with
Del Borghi, A. (2013). LCA and communication: Environmental Product Declaration. The International Journal of Life Cycle Assessment, 18(2), 293-295. https://doi.org/10.1007/s11367-012-0513-9 Olanrewaju, O. I., Enegbuma, W. I., Donn, M., & Oyefusi, O. N. (2025). Assessment of environmental product declaration and databases: Towards ensuring data quality assurance practices. Environmental Impact Assessment Review, 112, 107803. https://doi.org/10.1016/j. eiar.2024.107803
52 BUILT ENVIRONMENT ECONOMIST: SEPTEMBER – NOVEMBER 2026
EPDs
Figure 3: EPD Development Process
the PCR and relevant standards. This step safeguards the EPD’s credibility and ensures transparency. 5. Register and Publish – The Public Launch Once verified, the EPD is officially registered and published by a Program Operator. It becomes publicly available on recognised platforms, making it a trusted reference for designers, builders, and policy makers. EPDs are typically valid for five years before renewal is required. Figure 3 illustrates the five sequential
steps in developing an EPD, from defining the “cookbook” (PCR) to the “public launch” (registration and publication, showing how the process ensures consistency, credibility, and global alignment under ISO 14025 and EN 15804.
I 5. EPD MYTH VS. REALITY There are common misconceptions around EPDs (Table 2). EPDs are Type III environmental declarations intended for transparent disclosure, not promotional eco-labels or marketing
COMMON MISCONCEPTION (MYTH)
claims. EPDs are standardised, databased documents developed under ISO 14025 that report a product’s quantified environmental impacts but do not directly judge or compare performance. The table highlights common myths, such as believing EPDs always cover the full life cycle, can be self-declared, or are identical across locations, and contrasts them with the actual requirements. In reality, EPDs require third-party verification, their results depend on location-specific data, and their scope must always be checked to interpret results correctly.
THE REALITY (TRUTH)
“An EPD means the product is sustainable or has a lower
EPDs are purely data sheets. They only quantify the impact; they do not rank sustainability
environmental impact.”
or endorse a product.
“EPDs always show the full life cycle impacts (cradle-to-grave).”
Many EPDs only cover ‘Cradle-to-gate’ (A1-A3). You must check the scope.
“EPDs are the same across all production locations.”
Location matters due to different energy mixes, which means impacts are highly variable.
“Project EPD can be verified internally.”
Any declaration claiming to be an EPD must have mandatory third-party verification.
“EPDs last for the lifetime of the product and never expire. ”
EPDs have a limited validity period, typically five years, and must be updated with new data and re-verified to remain valid. They do not stay current for the entire lifetime of a product.
Table 2: Misconceptions on EPDs
FUTURE DIRECTIONS Despite their growing importance, current EPDs still face challenges related to data accuracy, consistency, and compatibility across products, regions, and databases (Olanrewaju et al., 2025; Waldman, 2020). Variations in data quality, limited traceability, and static reporting structures reduce
comparability and confidence in results. Future EPD systems should leverage emerging digital technologies such as IoT, blockchain, artificial intelligence, and machine learning to enable real-time data collection, automated verification, and transparent traceability by analysing large datasets, identifying inconsistencies, and improving the reliability of impact calculations. These
technologies can transform EPDs from static documents into dynamic and interconnected systems, enhancing accuracy, interoperability, and trust in sustainability reporting.
This article was written by researchers from Western Sydney University’s Centre for Smart Modern Construction.
Popowicz, M., Katzer, N. J., Kettele, M., Schöggl, J.-P., & Baumgartner, R. J. (2025). Digital technologies for life cycle assessment: a review and integrated combination framework. The International Journal of Life Cycle Assessment, 30(3), 405-428. https://doi.org/10.1007/s11367-024-02409-4 Senseney, C. T., Harvey, J., Butt, A. A., & Meijer, J. (2023). Recommendations for cradle-to-gate environmental product declarations (EPD) in ‘Buy Clean’ procurement based on CDOT’s experience. Environmental Research: Infrastructure and Sustainability, 3(3), 035004. https://doi. org/10.1088/2634-4505/acf06d Waldman, J. (2020). Embodied Carbon in Construction Materials: A Framework for Quantifying Data Quality in EPDs. Buildings and Cities, 1(1), 612632. https://doi.org/10.5334/bc.31
BUILT ENVIRONMENT ECONOMIST: SEPTEMBER – NOVEMBER 2026 53
ROBOTICS
HUMAN ROBOT TEAMING FOR SUSTAINABLE AND RESILIENT CONSTRUCTION: A NEW ERA DAWNS By Sara Wilkinson, Carol Hon (QUT), Fred Chang (QUT), Peng Wu (Curtin), Dikai Liu (UTS)
54 BUILT ENVIRONMENT ECONOMIST: SEPTEMBER – NOVEMBER 2026
ROBOTICS
INTRODUCTION
I THEME 1 – TECHNOLOGY
Human Robot Teaming (HRT) for Sustainable and Resilient Construction is probably a concept few of us have heard of? However, technological innovations in the field of robotics now mean that there are a number of robots which can undertake construction activities such as painting, laying floor tiles and bricks. Potentially, safety may be enhanced, costs may be reduced, defects reduced, and projects may be completed faster.
Advancing AI, robotics, and machine learning to enable safe, efficient, and human-centred collaboration on construction sites.
Research teams lead by the University of Technology Sydney (UTS), include Queensland University of Technology (QUT), Western Sydney University (WSU), University of NSW (UNSW) RMIT, Monash University, and Curtin University, Government bodies (such as NSW Government SafeWork) and industry partners (including Laing O’Rourke, Australian Constructors Association, Cortex Automation), are in the midst of a 5 year ARC funded project to develop and test their robots and examine the sustainability and resilience issues and outcomes for our industry. Quantity Surveyors have a significant role to play in the uptake and deployment of robots in construction projects. In this article, the first of a series, we outline the potential of robots in construction and the four themes of the research. We describe some of the robots currently being tested and the issues for the QS profession.
EXPLORING ROBOT POTENTIAL IN CONSTRUCTION The project has 4 themes outlined below to investigate the potential for human robot teaming in construction projects.
This theme focuses on advancing the technological foundations of humanrobot teaming through research in intelligent robotics, artificial intelligence, robot learning, and human skill transfer. It investigates how robots can collaborate effectively with humans by developing capabilities in human-robot collaboration and brain-robot interfaces. The theme also explores robot-interpretable Building Information Modelling design for automation, and optimal teaming between humans and robots. The outcomes of this research will deliver methodologies that enable robots to work alongside humans safely and efficiently in complex construction environments
I THEME 2 – PEOPLE Ensuring worker health, safety, and wellbeing through thoughtful design and adoption of human-robot teaming systems. The use of robotics for repetitive, routine and high-risk construction tasks offers significant benefits for both workers and organisations. By reducing exposure to physically demanding and hazardous activities, robots can lower ergonomic risks, minimise injuries, and improve productivity. However, their introduction may also create new safety challenges that do not exist in traditional construction environments. As human-robot teaming becomes more common, the health and safety risk landscape will evolve and require further research and attention. Existing regulations and codes of practice may not fully address the unique risks associated with human-robot
BUILT ENVIRONMENT ECONOMIST: SEPTEMBER – NOVEMBER 2026 55
ROBOTICS
collaboration. Updated guidance, standards and regulatory frameworks will therefore be needed to identify, manage and mitigate emerging hazards effectively. Successful human-robot teaming also depends on people. Organisations must invest in workforce planning, supervision, and targeted training to equip workers and managers with the knowledge and skills required to work safely and effectively alongside robotic systems. Combined with thoughtful redesign of workflows and job tasks, these measures can enhance both productivity and worker wellbeing.
I THEME 3 – BUSINESS Examining sustainability metrics and business models that make robotics adoption viable, equitable, and environmentally responsible. The adoption of any new technology or innovation is always complex. There is the fear of the unknown to overcome. For example, how good is the quality of work the robots undertake? Would the amount of remedial or snagging work increase on projects? How much do they cost? Are the robots going to add to project costs or reduce them? Will contractors be buying, or hiring, the robots? Will the use of robots create a new employment type in the construction sector? And if so, who would regulate this employment in respect of training, education requirements and benchmarks? All these questions and others will be explored in this stream to set out the business case for the use of robots in various projects from new build to maintenance and repair.
I THEME 4 – QUALITY Reimagining construction quality assurance through data-driven and AI-enabled monitoring and decisionmaking.
Figure 2: HRT for installing Screws (Source: UTS)
Construction quality assurance has long relied on manual inspection, sampling-based checking, and posthoc rectification, which are labourintensive, subjective, and often too slow to prevent defects from propagating through project stages. This theme reimagines quality assurance as a data-driven and AI-enabled process, in which continuous sensing, automated defect detection, and intelligent decision-making replace intermittent manual checks and support proactive quality management across design, manufacturing, and on-site assembly. An example is the quality checking of robotic-assisted prefabrication using LiDAR and mobile laser scanning. High-density point clouds captured during and after robotic fabrication are registered against BIM models to
56 BUILT ENVIRONMENT ECONOMIST: SEPTEMBER – NOVEMBER 2026
quantify geometric deviations, surface flatness, and connection tolerances at millimetre accuracy. AI models trained on these scan-versus-design comparisons detect dimensional nonconformance in near real time, enabling robots to adjust fabrication parameters, reducing rework, and providing verifiable digital quality records for prefabricated components before delivery to site.
INTRODUCING SOME OF OUR ROBOTS. Short videos showing our robots below (figures 1 to 3) in action laying floor tiles, screwing timber, and painting can be found at this website: www.hartcon. org/projects-technologies.
ROBOTICS
Figure 3: HRT for Painting (Source: UTS)
Figure 1: HRT for Tiling (Source: UTS)
BUILT ENVIRONMENT ECONOMIST: SEPTEMBER – NOVEMBER 2026 57
ROBOTICS
SUSTAINABILITY AND RESILIENCE ISSUES
The 4D Principle: Source UTS
When we examine the sustainability issues associated with robots, there are environmental, social and economic factors that need to be considered. For example, the energy required to operate the robots can be significant and the carbon emissions associated with their use needs to be acknowledged, quantified and where possible, offset. We are at a very stage of the adoption of robots in construction and therefore need to measure and record the different levels of energy consumption based on robot type and tasks undertaken and also location. For social sustainability, the issues could be positive – in that work that is potentially dangerous for humans could be undertaken by robots, reducing risk of workplace injury. However, much work currently considered ‘dangerous’ is low skilled and very well paid. Therefore those people in the workforce whose well paid jobs may disappear or reduce in income will be disaffected. As far as economic sustainability is concerned, it is not clear currently in which tasks, projects, the use of robots could reduce project timelines, reduce project costs and increase profitability or otherwise. On this basis there is much work to be undertaken to fully understand the sustainability aspects of robotics in construction. With regards to resilience, it may be possible that the use of robots in a projects enables construction to continue in periods of excessive heat when humans are unable to work safety outside. It would also be the case that in some locations, where worker shortages are experienced, the use of robots enables projects to progress without delays.
HRT transforms construction by pairing human intelligence with robotic precision to address the 4D Principle: tasks that are Dull, Dirty, Dangerous, or Dear. While robots manage highrisk and repetitive operations, humans provide the critical decision-making and judgment necessary for site safety. This integration drives the industry toward a human-centric, sustainable, and resilient future. Furthermore, by offloading physical burdens to technology, HRT fosters an inclusive environment that empowers a diverse workforce across all ages, genders, and physical abilities.
58 BUILT ENVIRONMENT ECONOMIST: SEPTEMBER – NOVEMBER 2026
Much work currently considered 'dangerous' is low skilled and very well paid. Therefore those people in the workforce whose well paid jobs may disappear or reduce in income will be disaffected
ROBOTICS
ISSUES FOR QS PROFESSIONALS
SUMMARY
Quantity Surveying is a critical profession in the built environment as QS professionals primarily determine, analyse, and manage construction costs and contracts from feasibility, through construction, to occupancy/ use and end-of-life. QS skills and experience add substantial value across all construction projects from inception and their professional advice and guidance has significant impact on decision making in projects.
There is no doubt that we are at the start of a period of significant innovation and change in our sector. QS’s, as trusted professionals are essential in enabling, advising and guiding this process for clients and society. It is imperative that the knowledge and understanding of robots and their capacity to deliver projects on time, within budget is understood.
QS’s work for quantity surveying firms, contractors/builders, engineering firms, multi-disciplinary consultancies, property developers, and government agencies. All sectors of the built environment, including buildings, infrastructure, utilities, and resources, benefit from the early engagement of a Certified QS and their knowledge and guidance on the adoption of robots in projects will be significant. It is vital, therefore, to increase QS knowledge and understanding of the potential use of robots in projects, and the costs, the benefits, the risks and liabilities involved.
We are large teams of industry experts and partners, robotics engineers, building surveyors, quantity surveyors, project managers, construction managers, undertaking extensive research into the adoption of Human Robot Teaming for Sustainable Resilient Construction. We will be publishing updates on our findings in each of the 4 research themes above over the coming 3 or 4 years. We look forward to sharing our knowledge and findings with AIQS members and welcome any feedback and comments from you.
From an estimating perspective, HRT alters the productivity rates and labour constants underpinning first-principles cost estimates. Traditional unit rates are often inappropriate for HRT projects, requiring estimators to understand its practical application on site and develop new productivity benchmarks and cost build-ups. Quantity surveyors therefore need the competence to advise on the cost implications of HRT, supporting informed tendering and project decisions.
BUILT ENVIRONMENT ECONOMIST: SEPTEMBER – NOVEMBER 2026 59
Suite 3, Level 4, 35 Clarence Street, Sydney, New South Wales, Australia 2000 +61 2 8234 4000 www.aiqs.com.au